
Dollar lovers
25 Posts

Dollar lovers
Open Trade
Occasional Trader
1.5 Years
19 Following
185 Followers
15 Liked
Posts
Portfolio
All
Quotes
Live
Can I go to the north of Ethereum?


颜驰Bit
·
--
Speak!!!!!!!!!! #ETH
Don't speak, don't take away the tears, the reflection of me in the mirror has already left the outline of your smile😁
Don't look back, the last bus is about to leave~
Don't speak, don't take away the tears, the reflection of me in the mirror has already left the outline of your smile😁
Don't look back, the last bus is about to leave~
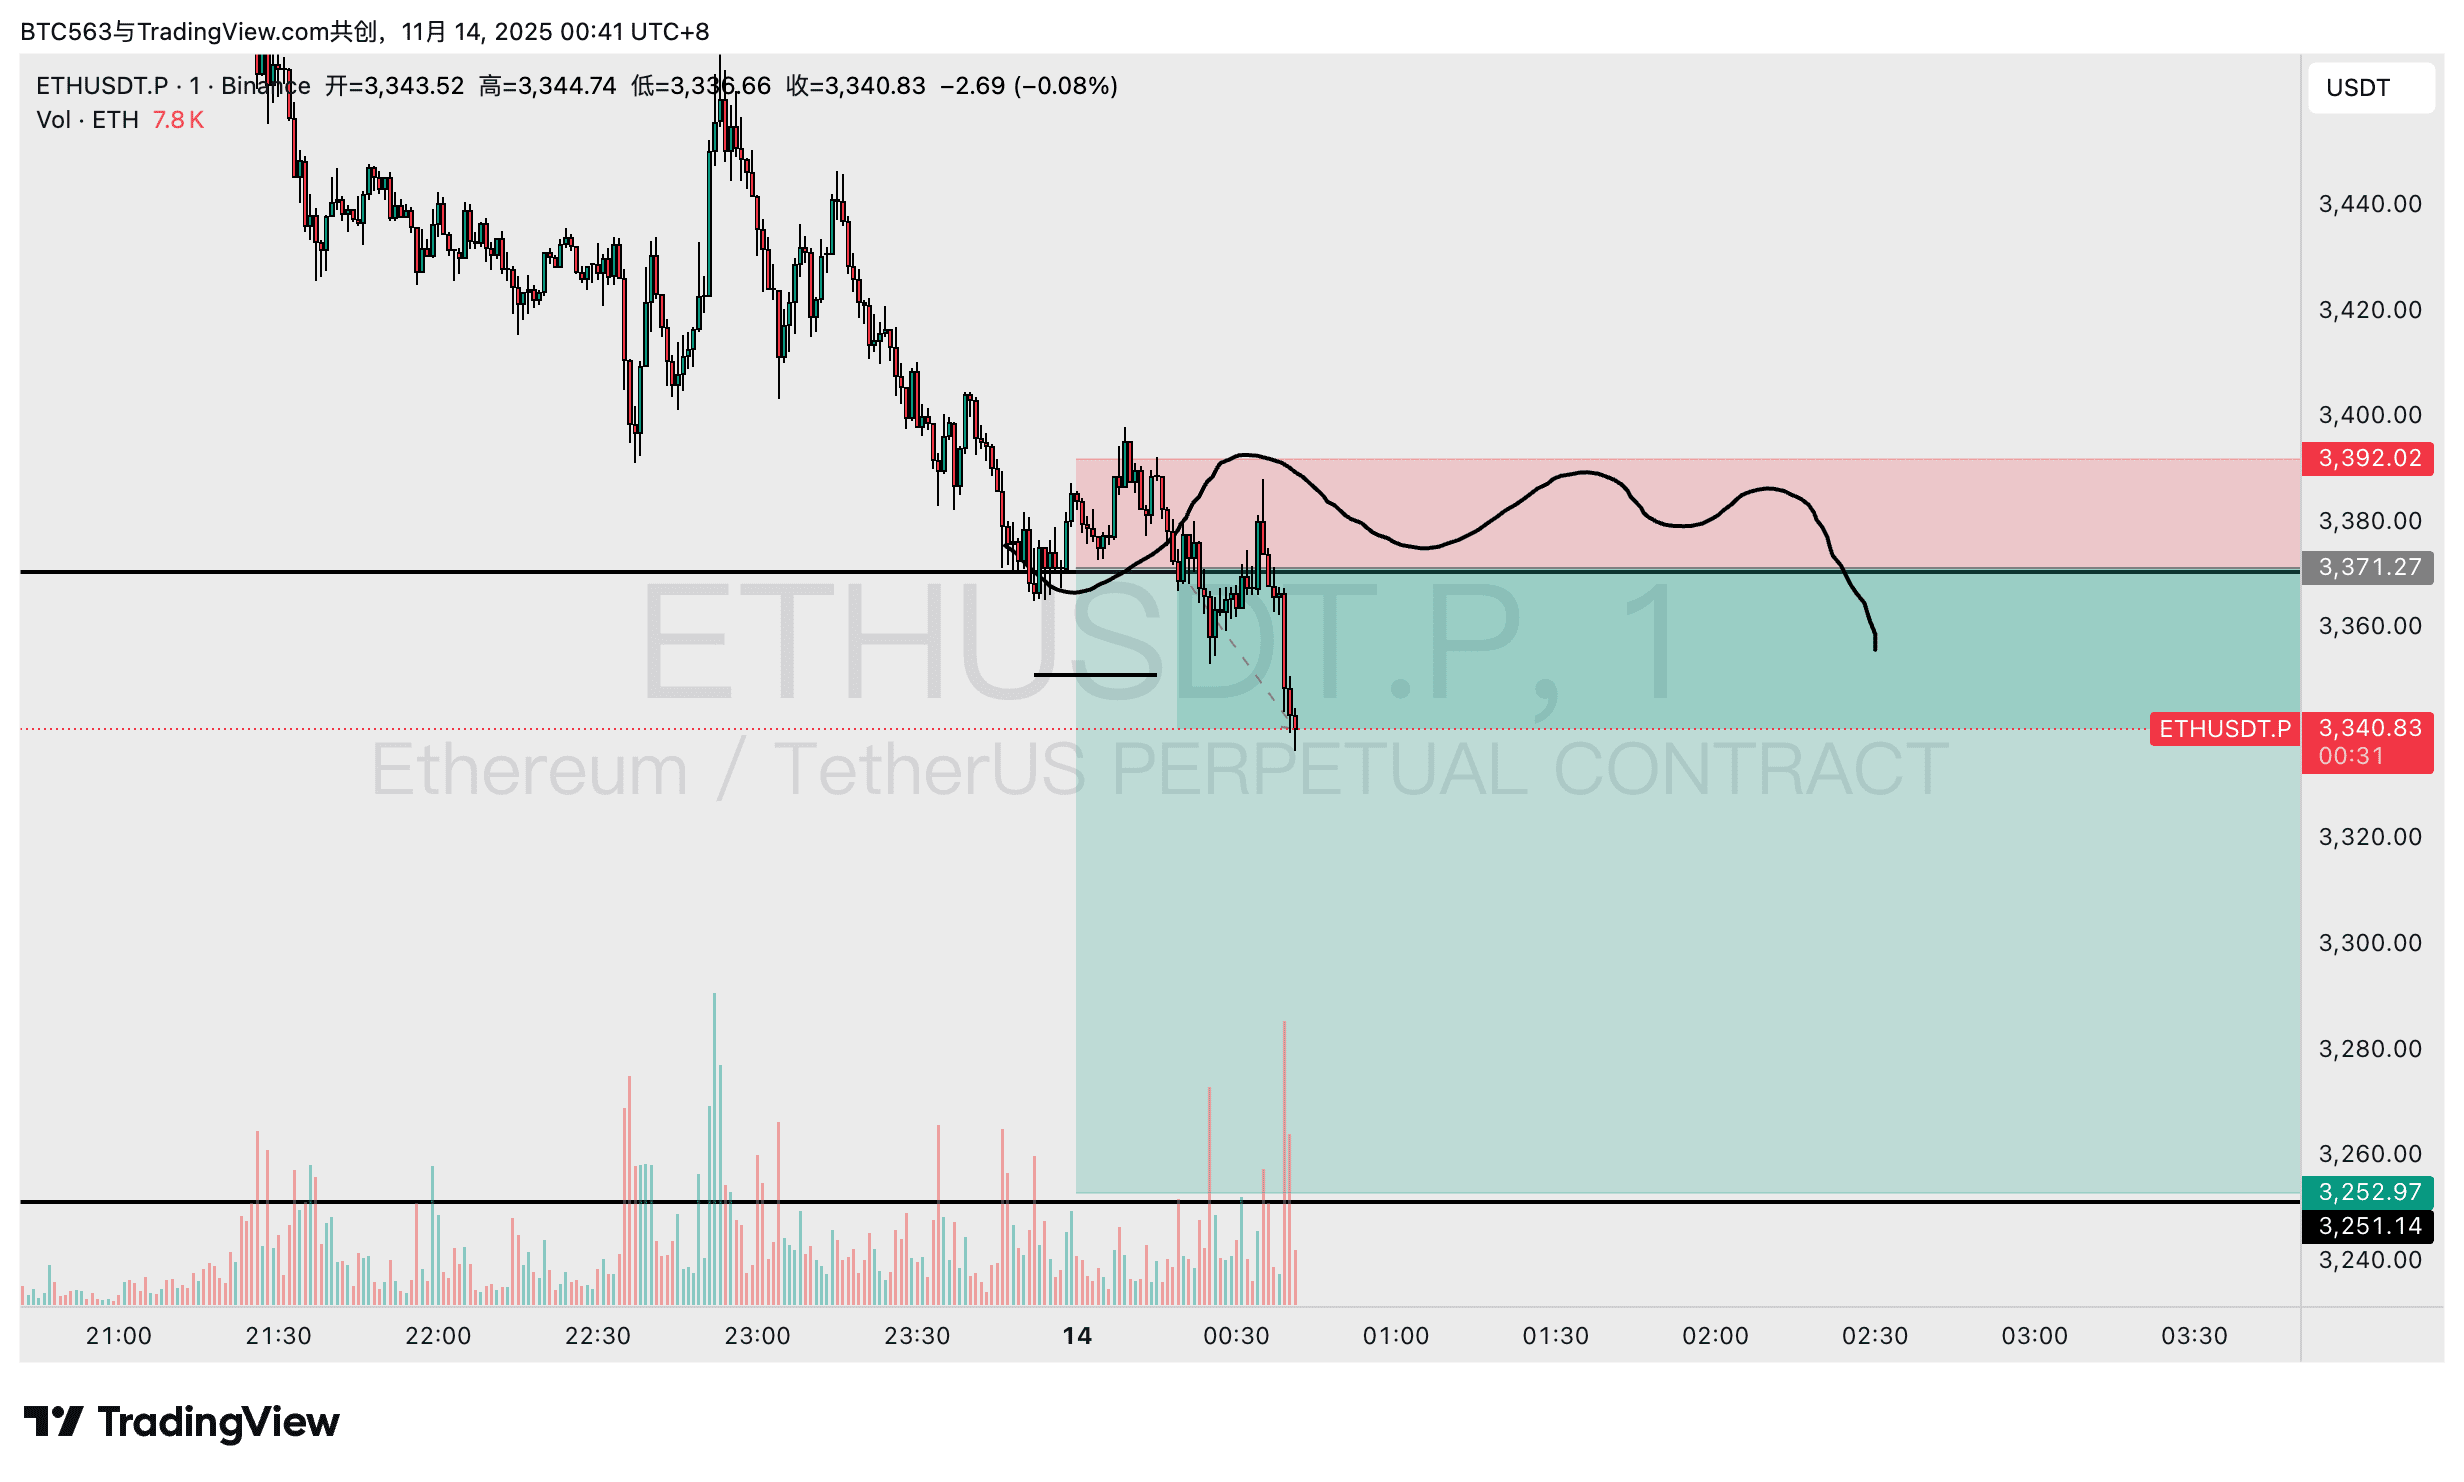
Is it still possible to get on board now?
Quoted content has been removed
Then I'll set a take-profit at 3960

合约杀手____稳定反佣
·
--
BearishReduced by 25 with tears, the latest liquidation price is 3957, please don't come over, dog dealer! $ETH I am listening to the voice live broadcast on Binance Square 'Will ETH make a surprise attack this weekend or have a large range fluctuation?', join me here to listen:
https://app.binance.com/uni-qr/cspa/31845869495969?r=MI05MRFZ&l=zh-CN&uc=app_square_share_link&us=copylink
https://app.binance.com/uni-qr/cspa/31845869495969?r=MI05MRFZ&l=zh-CN&uc=app_square_share_link&us=copylink
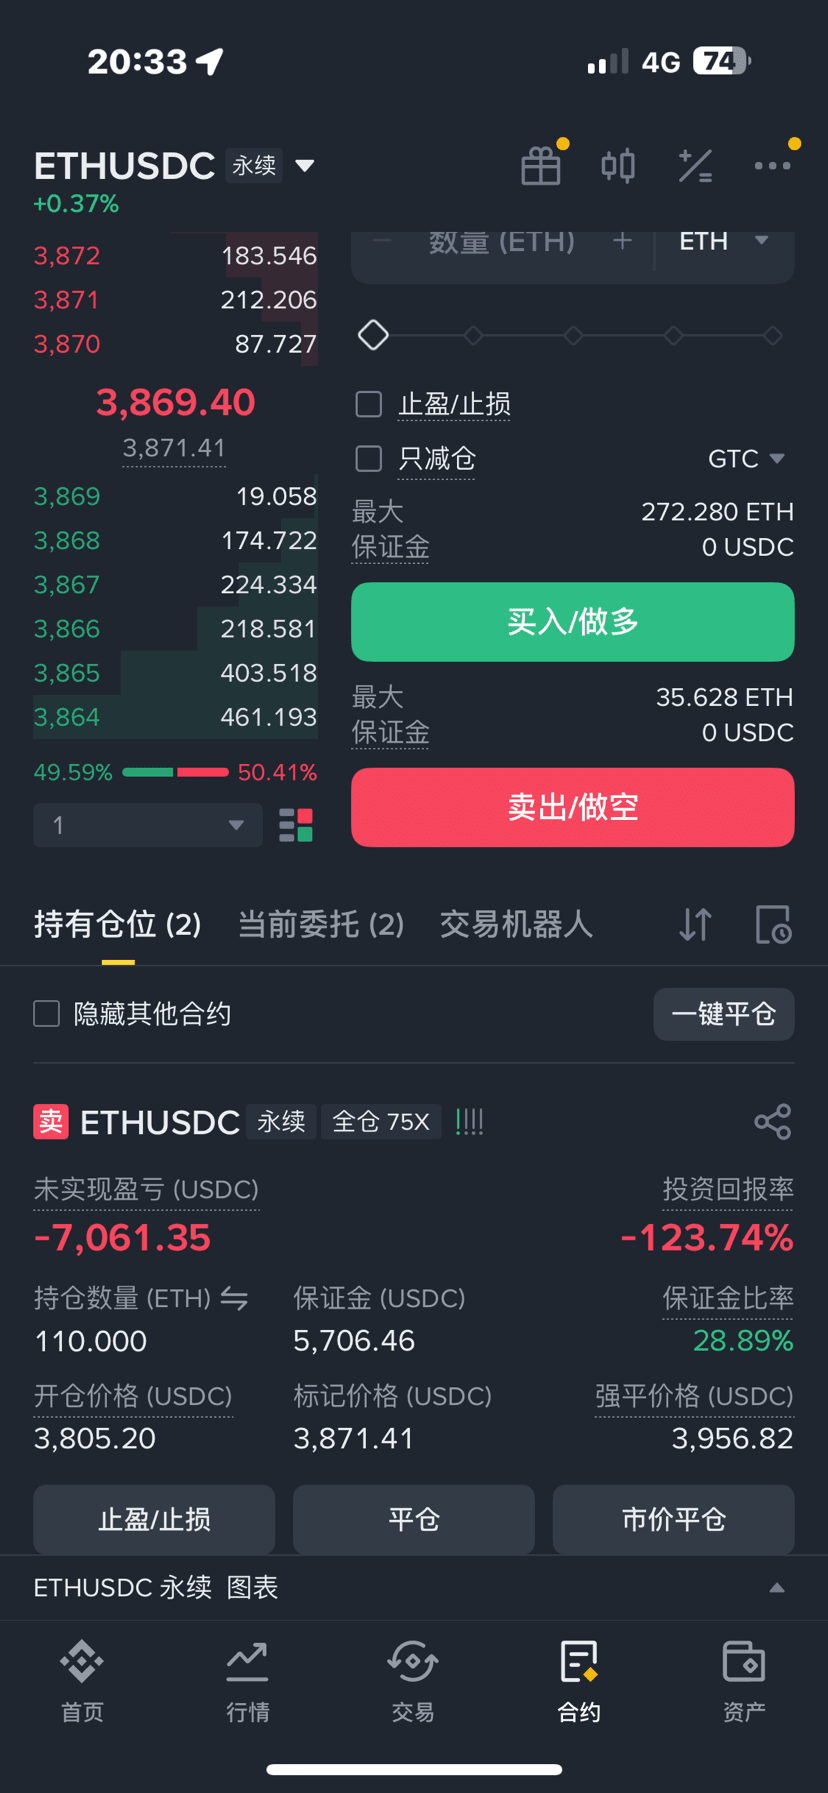
Reviewing the previous day's high fluctuation of 15%-20%, compared to the steady batch now.
Quoted content has been removed
Hahaha, it's quite symmetrical!

百转千回鸡哥
·
--
Is the long-short entanglement right? Can't see the situation clearly?
If I told you that now is the highest point, would you believe it?
Currently, there is a quick surge at the daily level but it hasn't broken through the previous high, indicating that there is distribution during the rapid rise. This is the last opportunity to escape the peak, and what follows is the start of a long bear market. I know that many KOLs in the square are saying it will rise to 120k, 130k, 150k, but the previous high hasn't been broken, how can we talk about rising? In my personal opinion, focus on shorting at highs, set a slightly larger stop loss at 113000, and continue shorting around this stop loss point, reduce positions partially at 100k, and when there is a rebound, continue to increase short positions. Those who understand will have three black swan opportunities in the second half of the year, enough to make you wealthy. #$BTC #看懂K线
If I told you that now is the highest point, would you believe it?
Currently, there is a quick surge at the daily level but it hasn't broken through the previous high, indicating that there is distribution during the rapid rise. This is the last opportunity to escape the peak, and what follows is the start of a long bear market. I know that many KOLs in the square are saying it will rise to 120k, 130k, 150k, but the previous high hasn't been broken, how can we talk about rising? In my personal opinion, focus on shorting at highs, set a slightly larger stop loss at 113000, and continue shorting around this stop loss point, reduce positions partially at 100k, and when there is a rebound, continue to increase short positions. Those who understand will have three black swan opportunities in the second half of the year, enough to make you wealthy. #$BTC #看懂K线
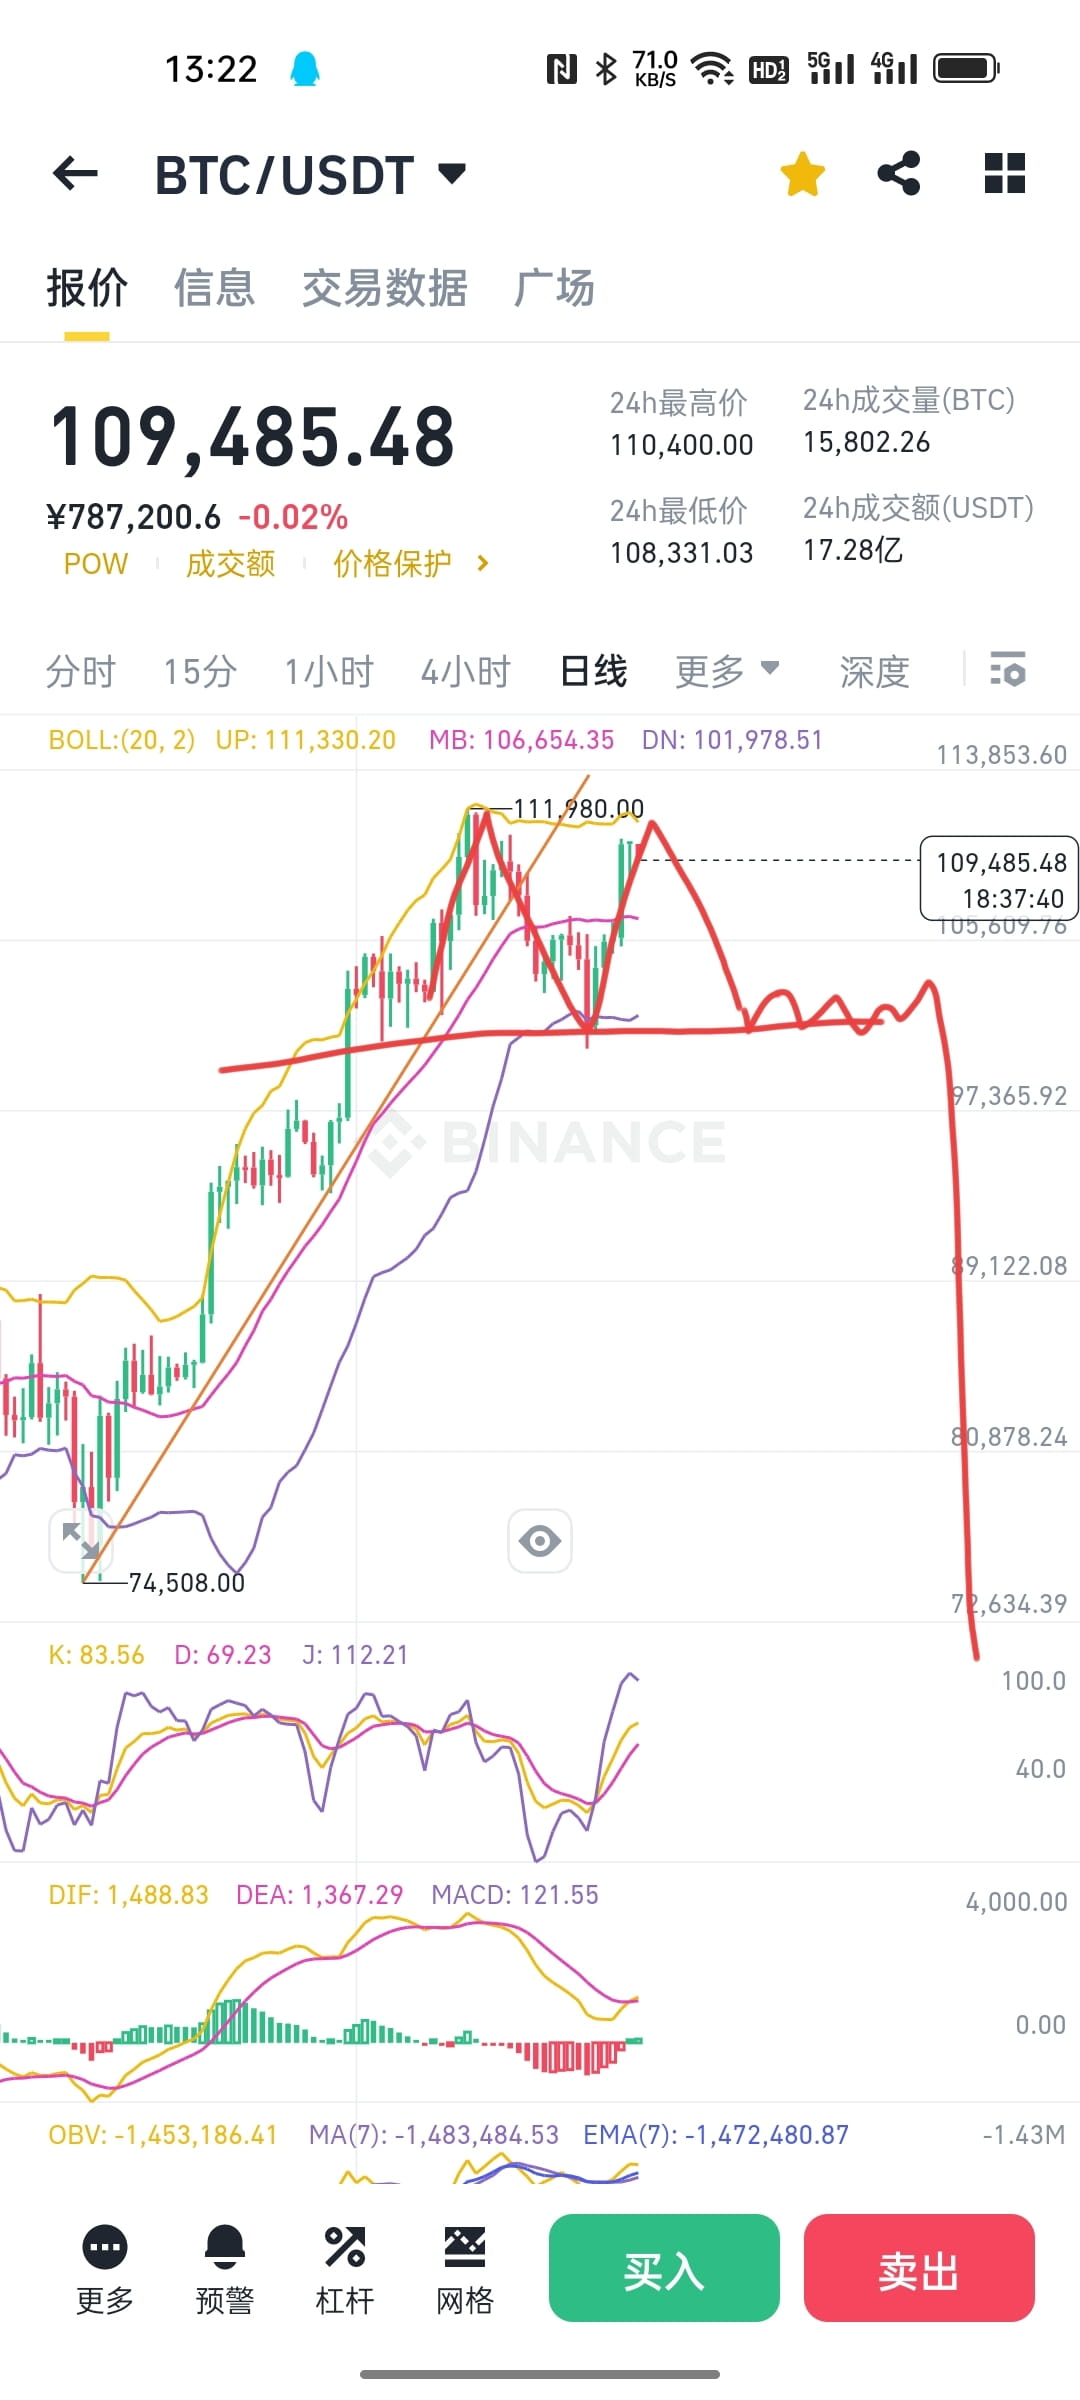
Came down

币圈小白闹着玩
·
--
Do you still want to carry it? My heart is bleeding!!!!
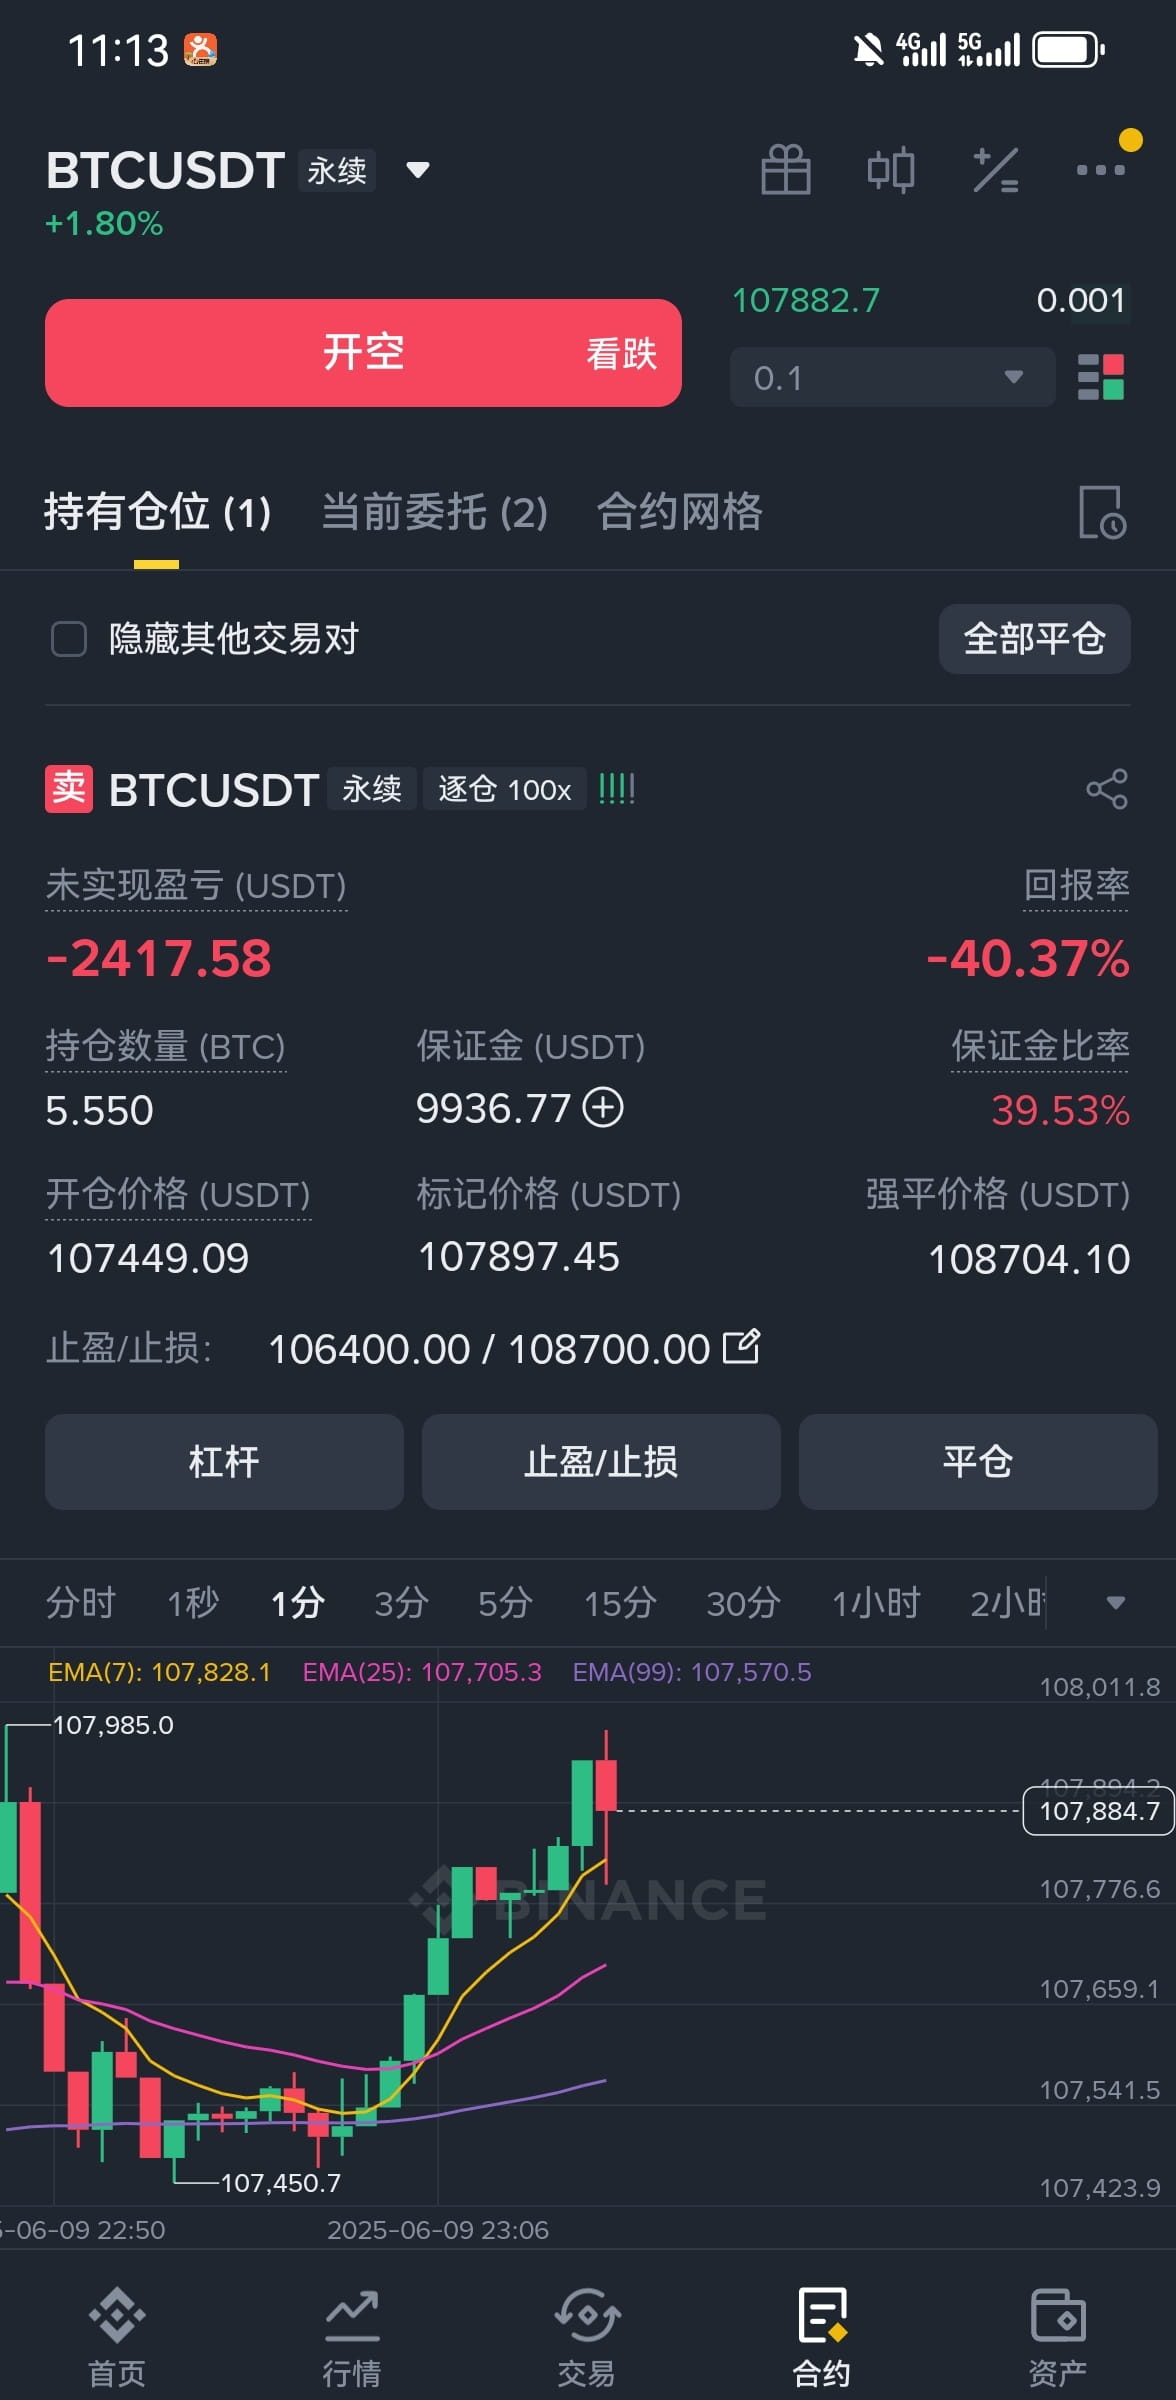
Hmm, steady the mind, just added a double, the opening price has reached 103800, waiting for the plunge

Moshe Berrie SLkD
--
别着急,一般半夜就下去了
🎙️ 【Doctor Tea Party】Can BOB's Back Mountain Village Explode at This Opportunity?
End
02 h 53 m 23 s
4.8k
0
How many people have been washed away?
In the same direction as the teacher 📉

Crypto-交易员
·
--
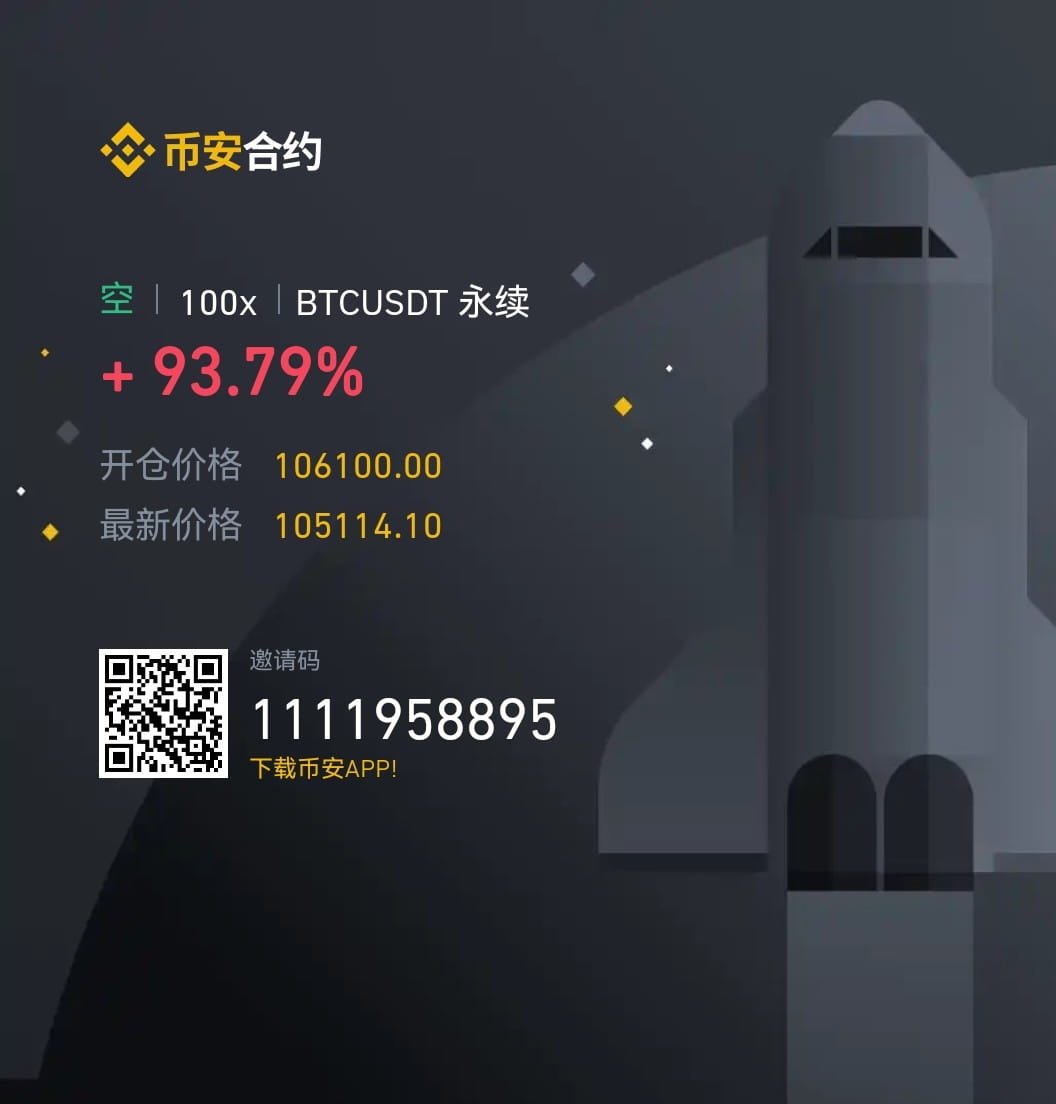
BearishThe trading road is long, and strategies should only be based on the market! Adhering to yesterday's article viewpoint, BTC 106600 is the long-short conversion point, and we still expect a pullback before it breaks above! So, is it a good opportunity to open a short position as we get closer to 106600?
Today's strategy: Short BTC near 106100, with the first take profit at 104866 and the second take profit at 103866.
Ethereum is in sync with Bitcoin's position, with a long-short conversion point at 2580! If it breaks below, we continue to expect a pullback!
Today's strategy: Short BTC near 106100, with the first take profit at 104866 and the second take profit at 103866.
Ethereum is in sync with Bitcoin's position, with a long-short conversion point at 2580! If it breaks below, we continue to expect a pullback!
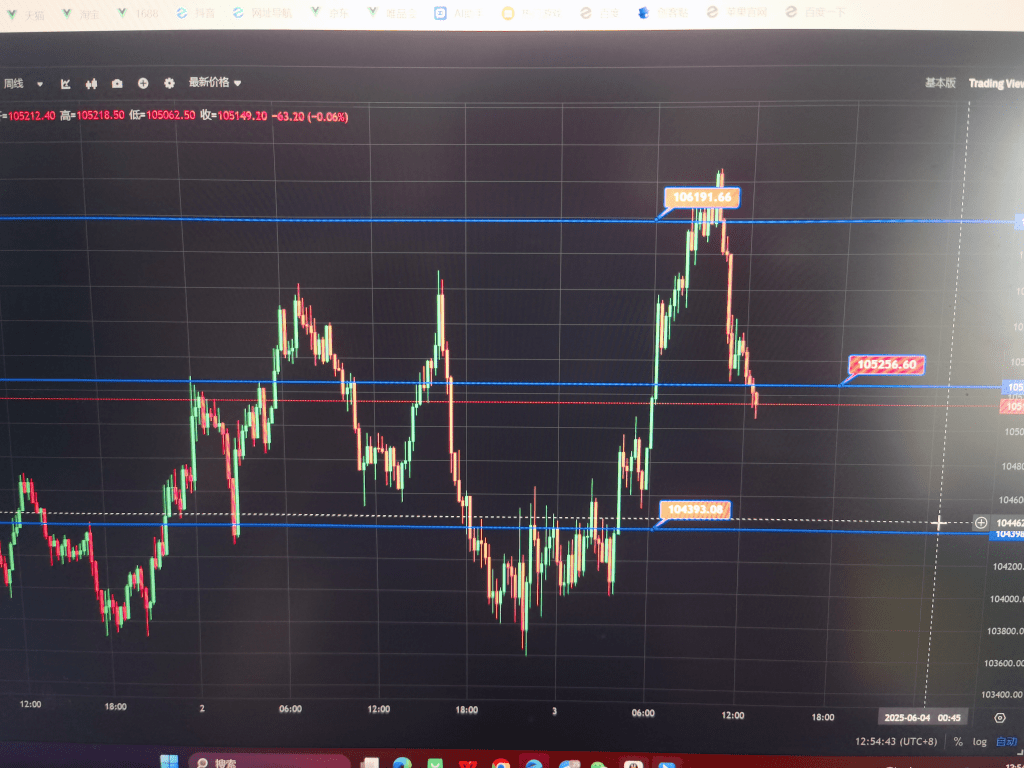
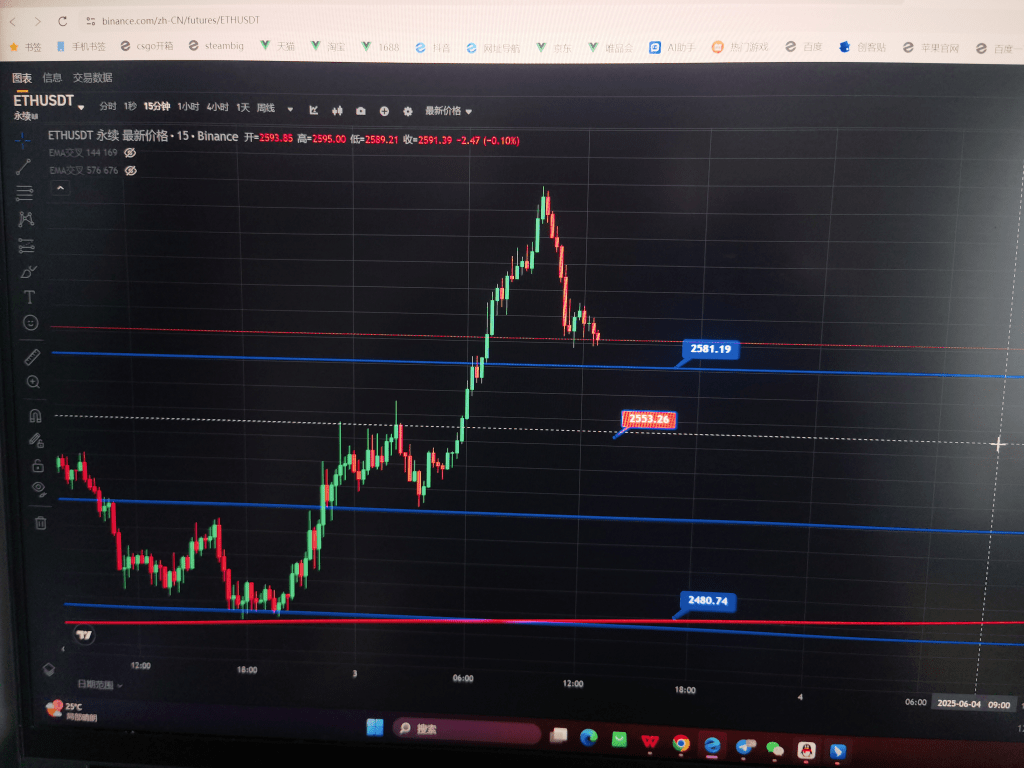
104500🈳

喻东-缠道交易
·
--
BullishThe daily chart of the large pancake is experiencing consecutive declines, showing a downward trend, while the hourly chart shows a rise in the low points, with 103k as the first support. The lower Bollinger Band on the four-hour chart is flattening, RSI6 is oversold, and MACD is expected to golden cross with a rebound anticipated, a small position can be taken.
Key levels: 104.500 - 103.500, looking at around 106k.
Key levels: 104.500 - 103.500, looking at around 106k.
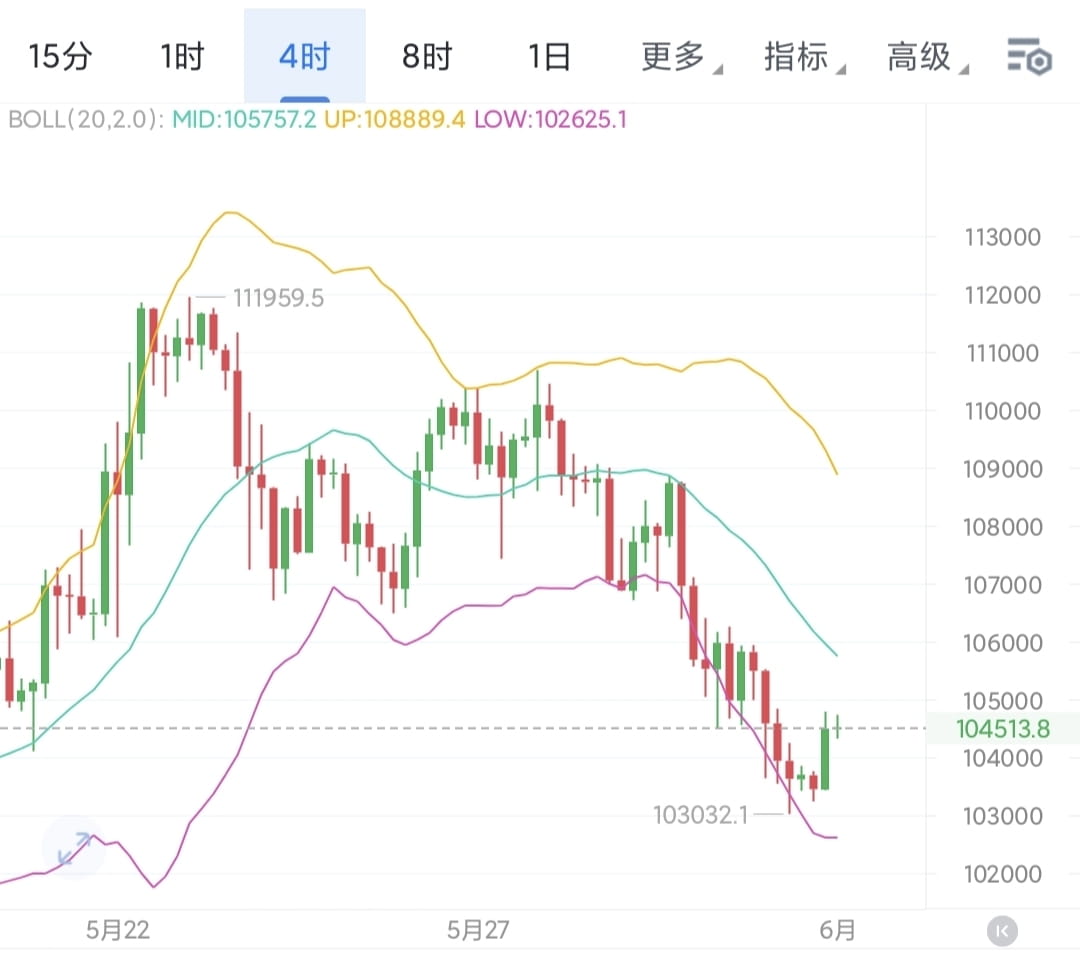
Can the opening pressure of 104200-104800 be突破

老韭菜不割
·
--
How long can this last?

There are many

Troy牧一
·
--
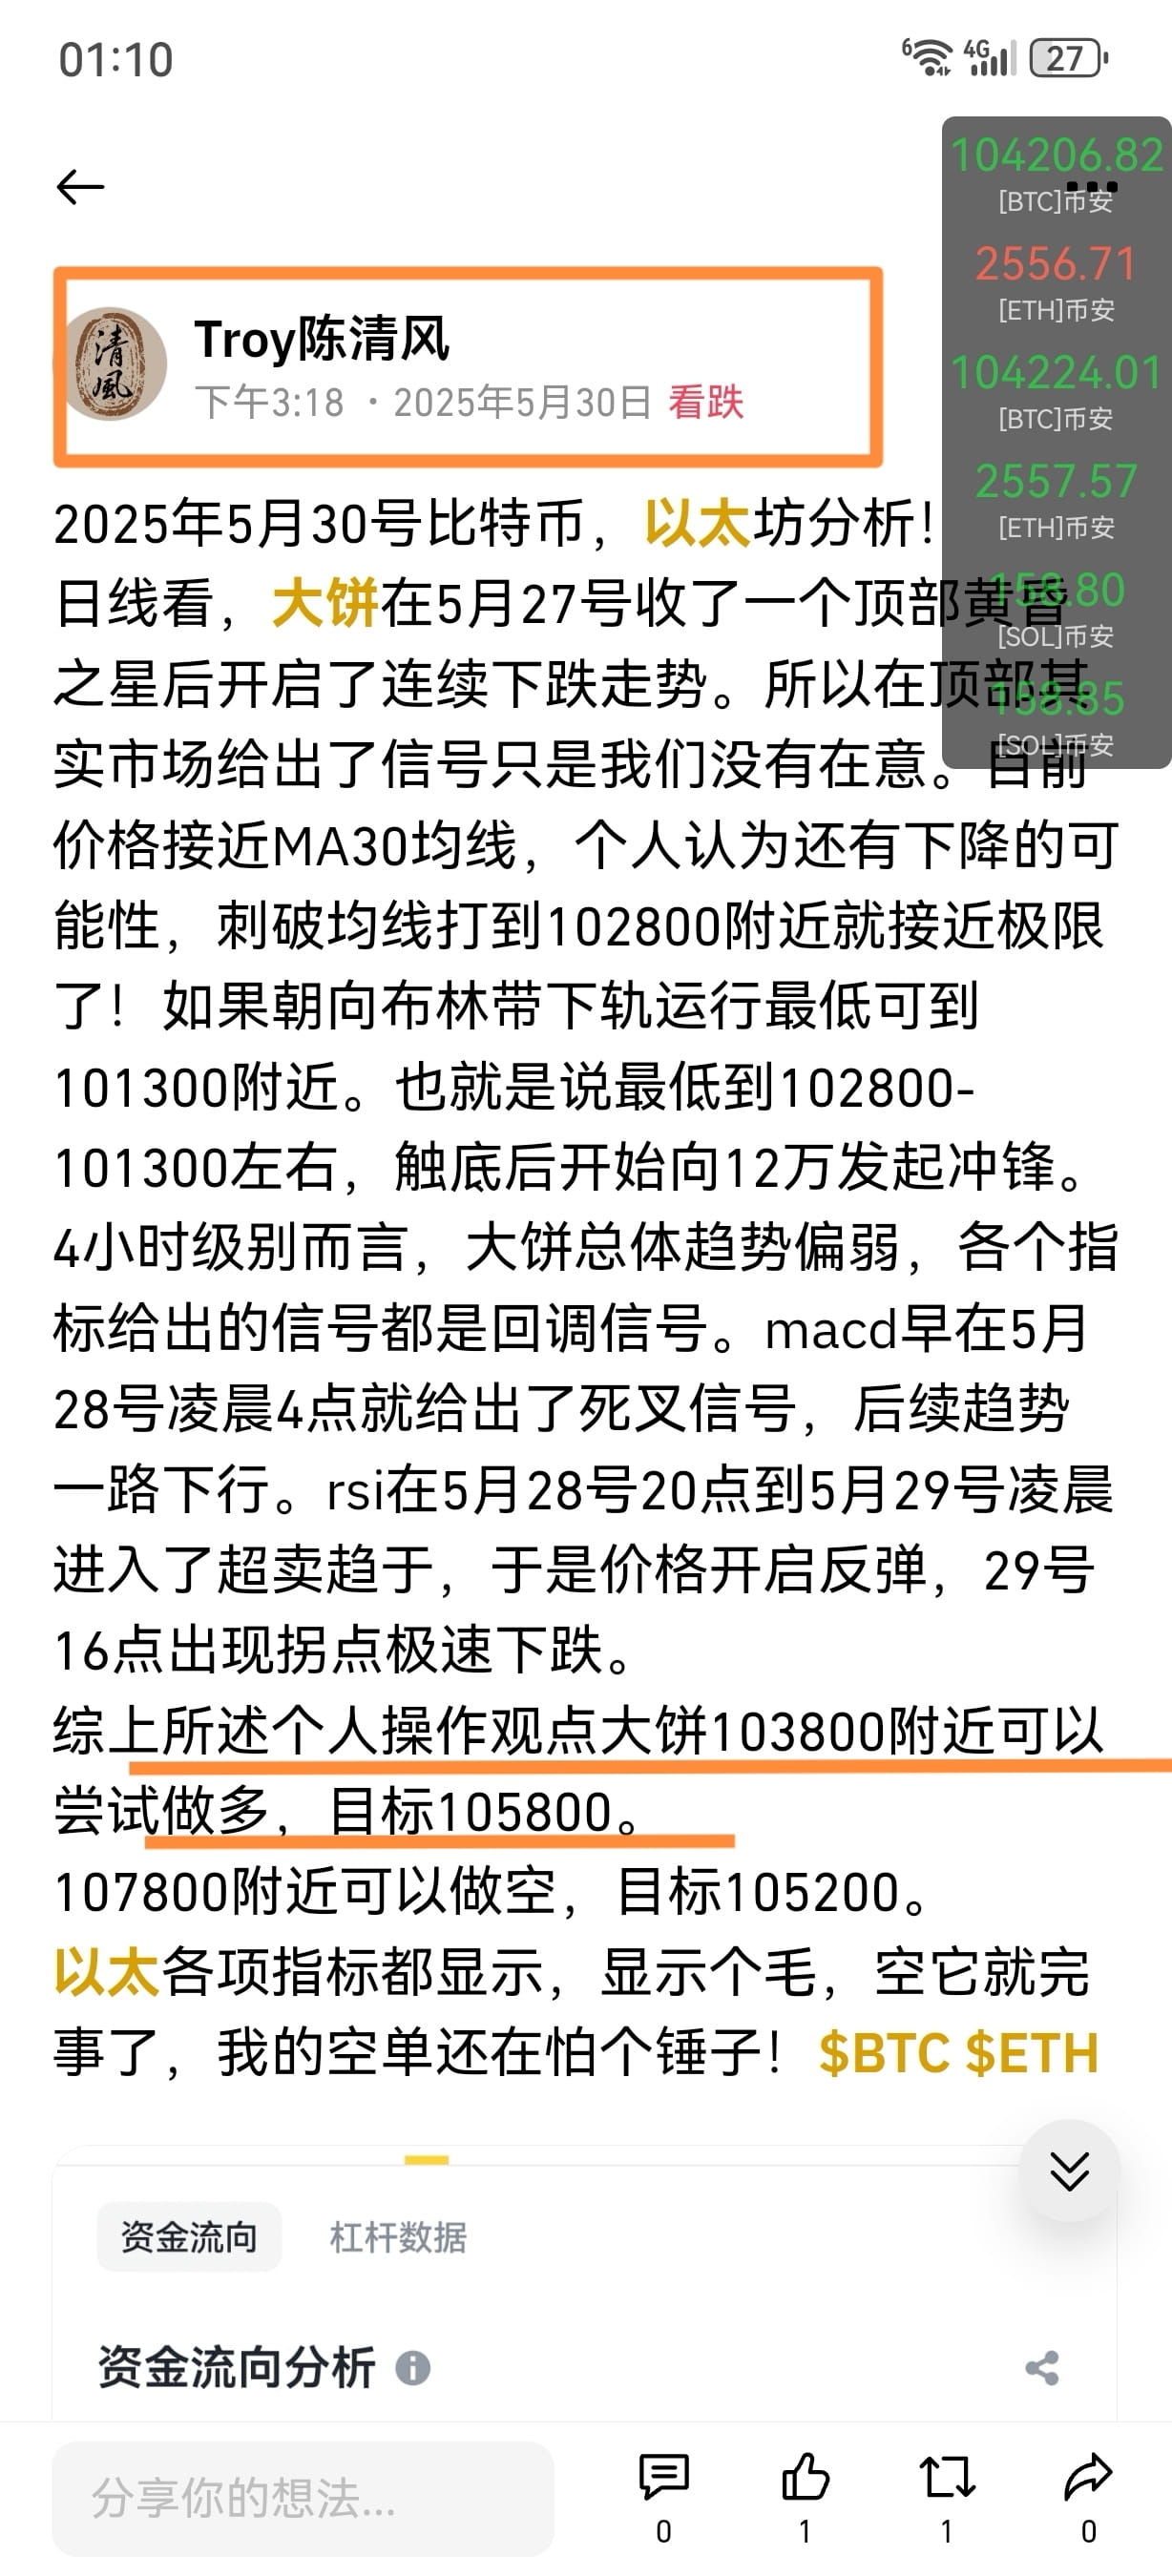
The large pancake of 103800 has been caught in a long position, friends! At that time, the price was around 106000, and I wrote this price to go long. Did everyone think I was out of my mind???
I entered the long position with my first order, setting the stop loss around 101500, and the first target is at 105800! Report completed, esteemed viewers, please check it out! #中心化与去中心化交易所 $BTC
I entered the long position with my first order, setting the stop loss around 101500, and the first target is at 105800! Report completed, esteemed viewers, please check it out! #中心化与去中心化交易所 $BTC
I also have a lot of
Are you using the candied hawthorn strategy? 😂

U U貔貅
·
--
Guarded for a day, exploded for a day, the sky has fallen
Log in to explore more content