
盘面之外
801 Posts
盘面之外
Report
Block User
五道口毕业土木硕士。长期主义交易员,政治经济学拥趸。
盘面只占四分之一,研究市场,也过生活。
曾用名加密486。
Open Trade

UNI Holder
High-Frequency Trader
2.6 Years
112 Following
1.6K+ Followers
2.6K+ Liked
Posts
Portfolio
All
Quotes
Live
·
--
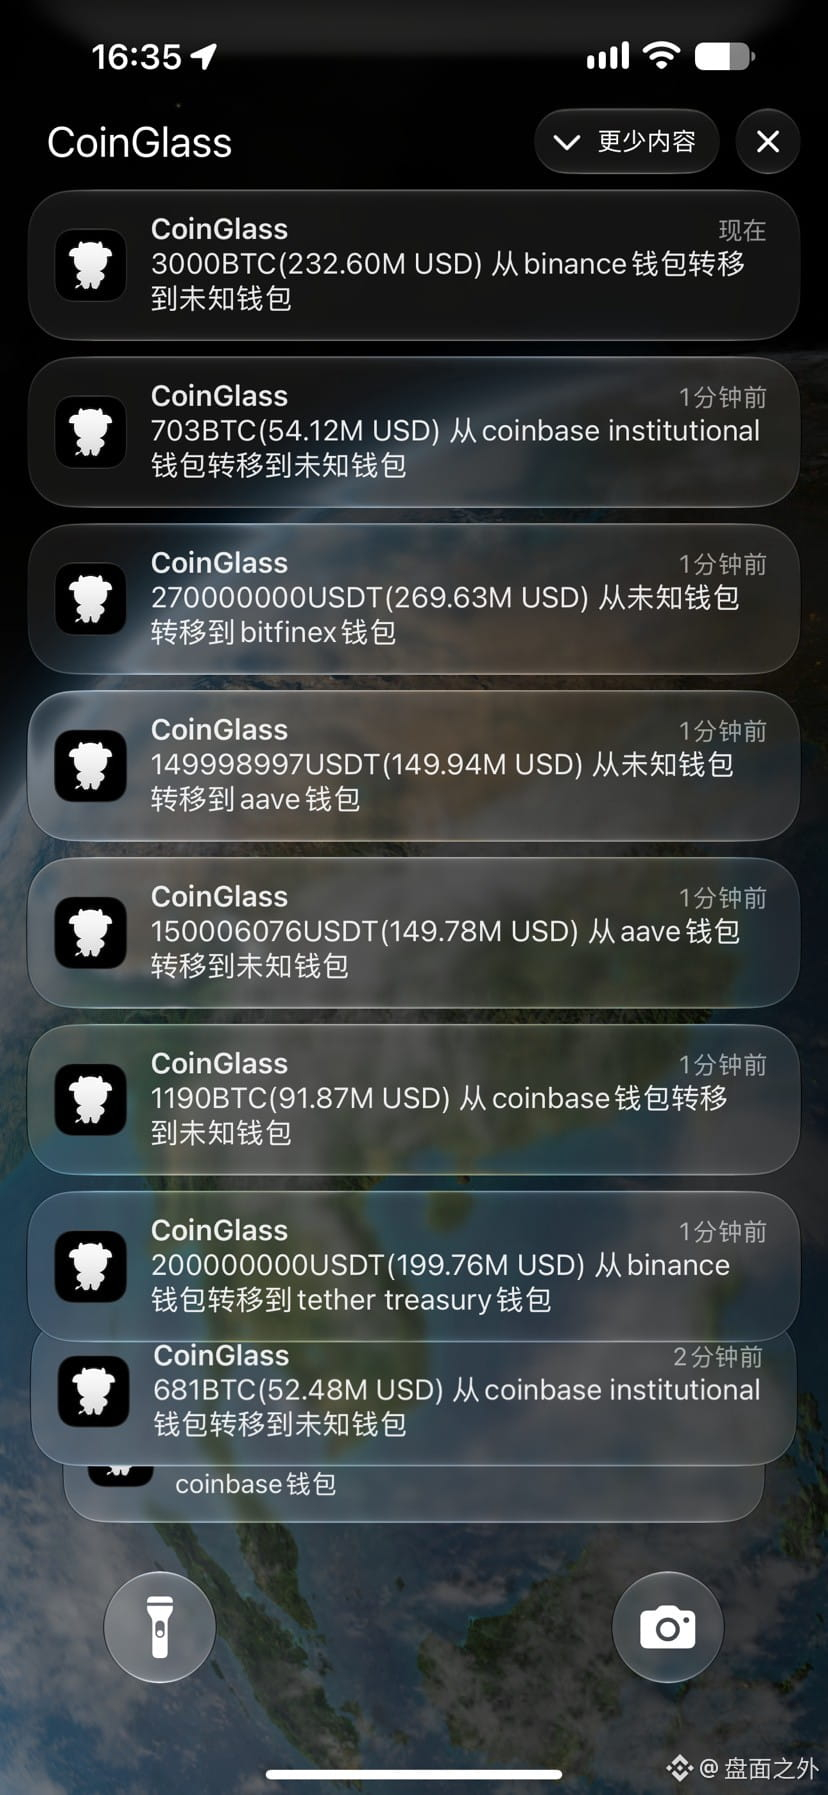
$BTC It's all large transfers. Is the world about to fall apart again?
{future}(BTCUSDT)
$BTC It's all large transfers. Is the world about to fall apart again?
19
44
43.4k
·
--
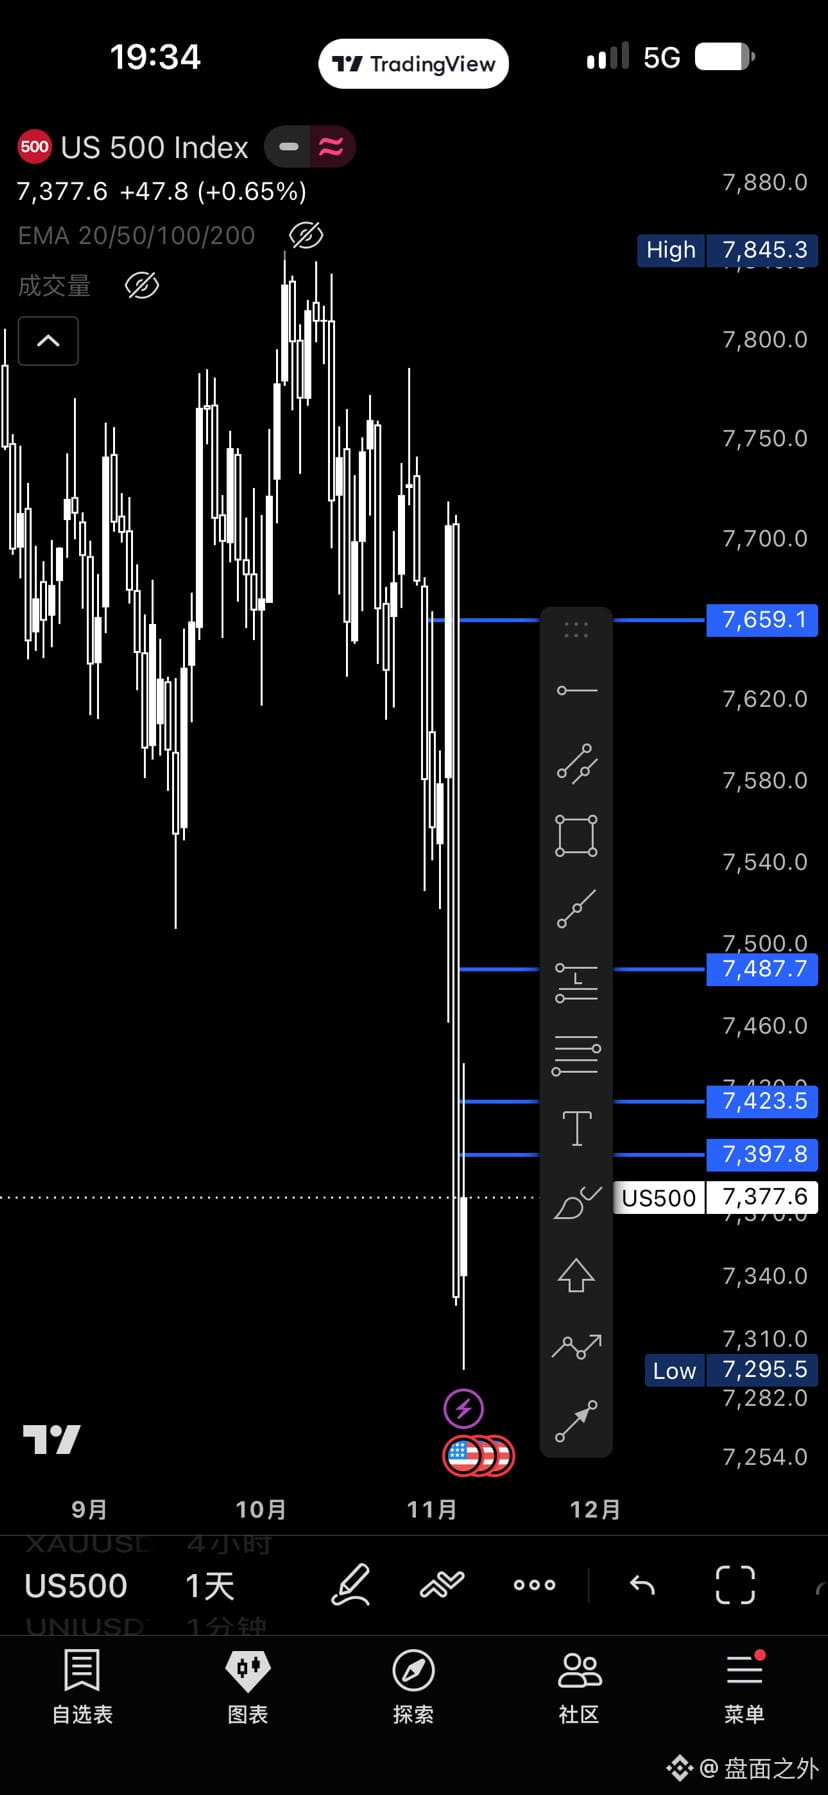
I revisited some films about the financial crisis today. I recommend everyone watch Margin Call. The image shows the S&P 500 index: $NVDA
{future}(NVDAUSDT)
I revisited some films about the financial crisis today. I recommend everyone watch Margin Call. The image shows the S&P 500 index: $NVDA
2
557
·
--
Partly True
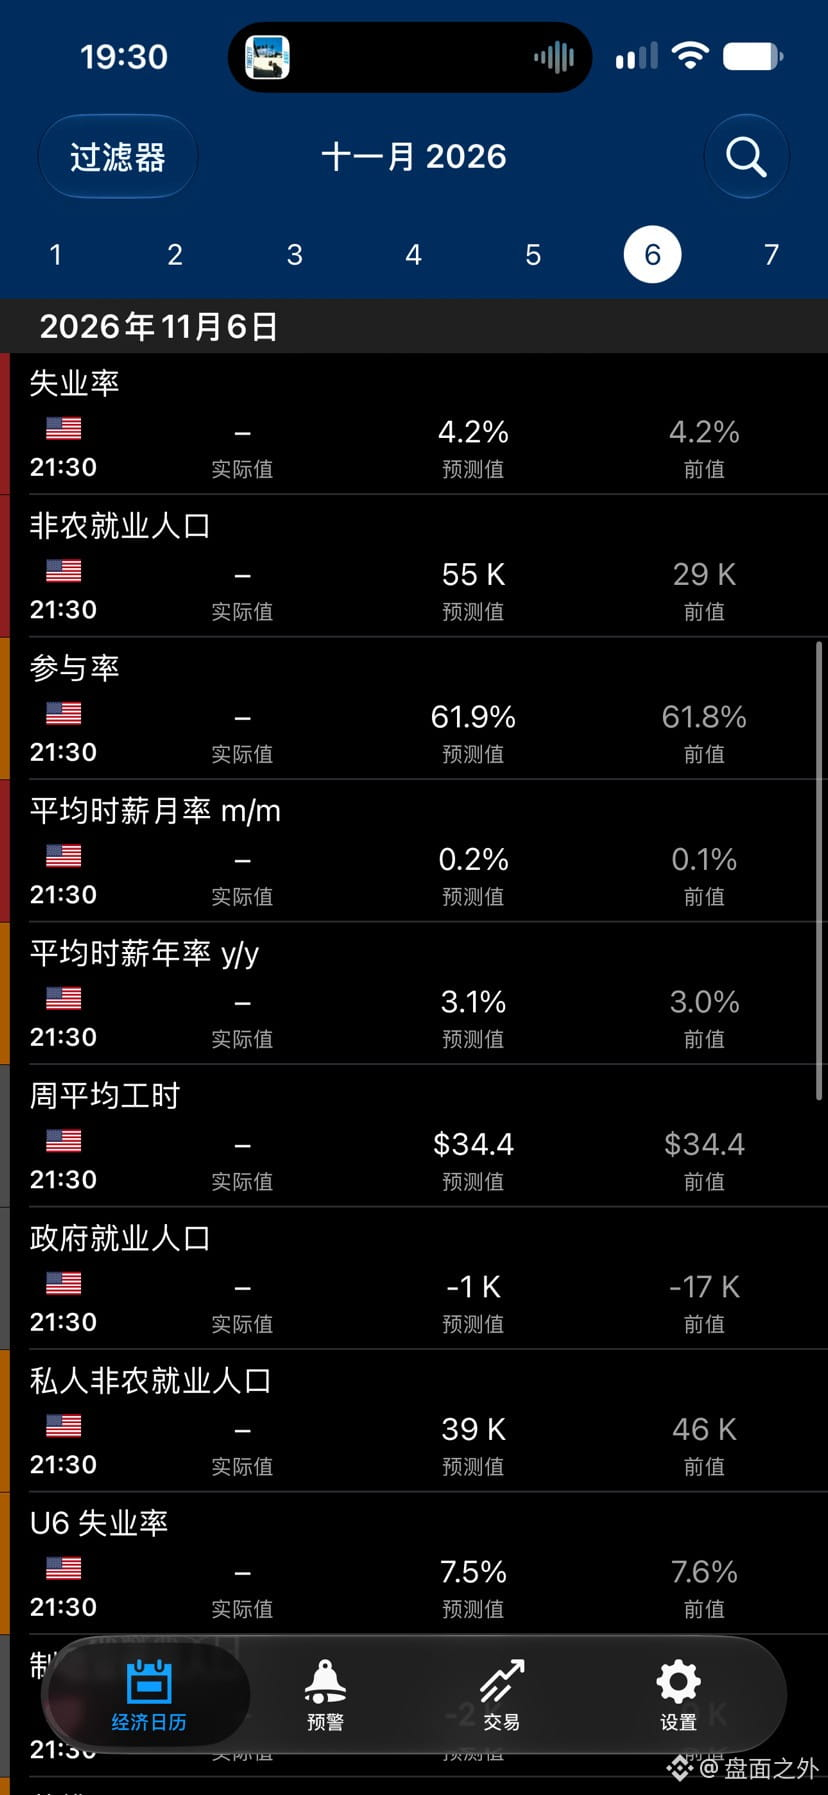
Nonfarm payrolls data comes out at 9:30. Waiting for a big drop $BTC 😎
{future}(BTCUSDT)
Nonfarm payrolls data comes out at 9:30. Waiting for a big drop $BTC 😎
4
2
4.4k
·
--
Article
AIN: From Beginner to Buried
Around 20:00 on 9/17, the market maker entered and built a position at 0.023, as the perpetual-to-spot ratio surged.
From 9/19 to 10/3, the price fluctuated in a broad channel. Trade based on the chart’s resistance and support levels.
On 10/2 around 18:00, the market maker added to their position again at around 0.023, as the perpetual-to-spot ratio surged.
On 10/3, the token price took off. The market maker swept both sides at the highs, triggering stop-losses and liquidating traders.From 10/11 to 10/25, the price moved in a descending channel while open interest kept falling, indicating that the market maker was distributing. Use the channel together with MFI to place trades. At 11:00 on the 25th, the perpetual-to-spot ratio surged, and the long/short ratio for large traders’ positions rose abnormally, signaling that the market maker had entered the market.On 10/26, the price was ignited and took off, triggering a massive short squeeze. It then moved sideways at the highs, waiting for retail traders to enter.
Around 20:00 on 9/17, the market maker entered and built a position at 0.023, as the perpetual-to-spot ratio surged.
From 9/19 to 10/3, the price fluctuated in a broad channel. Trade based on the chart’s resistance and support levels.
On 10/2 around 18:00, the market maker added to their position again at around 0.023, as the perpetual-to-spot ratio surged.
On 10/3, the token price took off. The market maker swept both sides at the highs, triggering stop-losses and liquidating traders.From 10/11 to 10/25, the price moved in a descending channel while open interest kept falling, indicating that the market maker was distributing. Use the channel together with MFI to place trades. At 11:00 on the 25th, the perpetual-to-spot ratio surged, and the long/short ratio for large traders’ positions rose abnormally, signaling that the market maker had entered the market.On 10/26, the price was ignited and took off, triggering a massive short squeeze. It then moved sideways at the highs, waiting for retail traders to enter.
AIN: From Beginner to Buried
Around 20:00 on 9/17, the market maker entered and built a position at 0.023, as the perpetual-to-spot ratio surged.
From 9/19 to 10/3, the price fluctuated in a broad channel. Trade based on the chart’s resistance and support levels.
On 10/2 around 18:00, the market maker added to their position again at around 0.023, as the perpetual-to-spot ratio surged.
On 10/3, the token price took off. The market maker swept both sides at the highs, triggering stop-losses and liquidating traders.From 10/11 to 10/25, the price moved in a descending channel while open interest kept falling, indicating that the market maker was distributing. Use the channel together with MFI to place trades. At 11:00 on the 25th, the perpetual-to-spot ratio surged, and the long/short ratio for large traders’ positions rose abnormally, signaling that the market maker had entered the market.On 10/26, the price was ignited and took off, triggering a massive short squeeze. It then moved sideways at the highs, waiting for retail traders to enter.
2
6
1.4k
·
--
Article
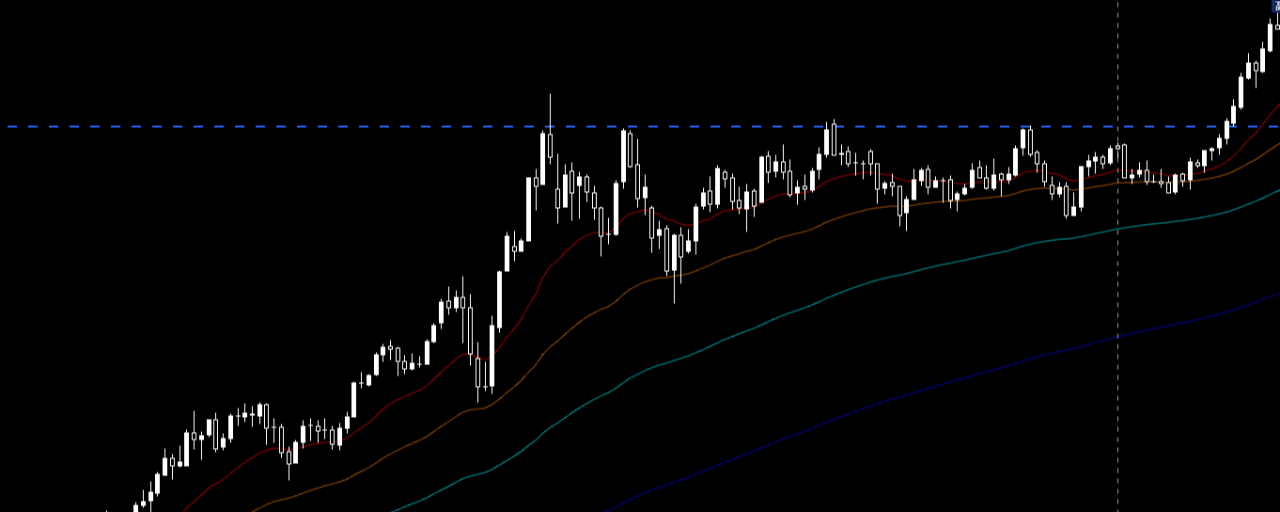
Common Chart PatternsChart patterns do not focus on the body and wicks of individual candlesticks. Instead, they examine the geometric structures formed when price repeatedly tests certain levels over a period of time. These structures essentially reflect the battle between buyers and sellers at specific price levels. The greater the liquidity and the more evenly matched the buyers and sellers, the more likely a standard structure or pattern is to emerge.
I. Reversal chart patterns (the balance of power shifts at the end of a trend)
1. Double Top / Double Bottom W M
Structure: Price tests the same level twice (a high for a double top, a low for a double bottom), with a pullback low (the neckline) forming in between. The pattern is confirmed when the neckline is decisively breached.
Common Chart Patterns
Chart patterns do not focus on the body and wicks of individual candlesticks. Instead, they examine the geometric structures formed when price repeatedly tests certain levels over a period of time. These structures essentially reflect the battle between buyers and sellers at specific price levels. The greater the liquidity and the more evenly matched the buyers and sellers, the more likely a standard structure or pattern is to emerge.
I. Reversal chart patterns (the balance of power shifts at the end of a trend)
1. Double Top / Double Bottom W M
Structure: Price tests the same level twice (a high for a double top, a low for a double bottom), with a pullback low (the neckline) forming in between. The pattern is confirmed when the neckline is decisively breached.
I. Reversal chart patterns (the balance of power shifts at the end of a trend)
1. Double Top / Double Bottom W M
Structure: Price tests the same level twice (a high for a double top, a low for a double bottom), with a pullback low (the neckline) forming in between. The pattern is confirmed when the neckline is decisively breached.
9
7
2.4k
·
--
Exclusive insider news: #Anthropic will soon partner with the xx exchange, and the stock will then be listed on the xx exchange’s ETH L2 DEX. Anyone able and interested in participating in the pre-IPO can contact me.
Exclusive insider news: #Anthropic will soon partner with the xx exchange, and the stock will then be listed on the xx exchange’s ETH L2 DEX. Anyone able and interested in participating in the pre-IPO can contact me.
1
190
·
--
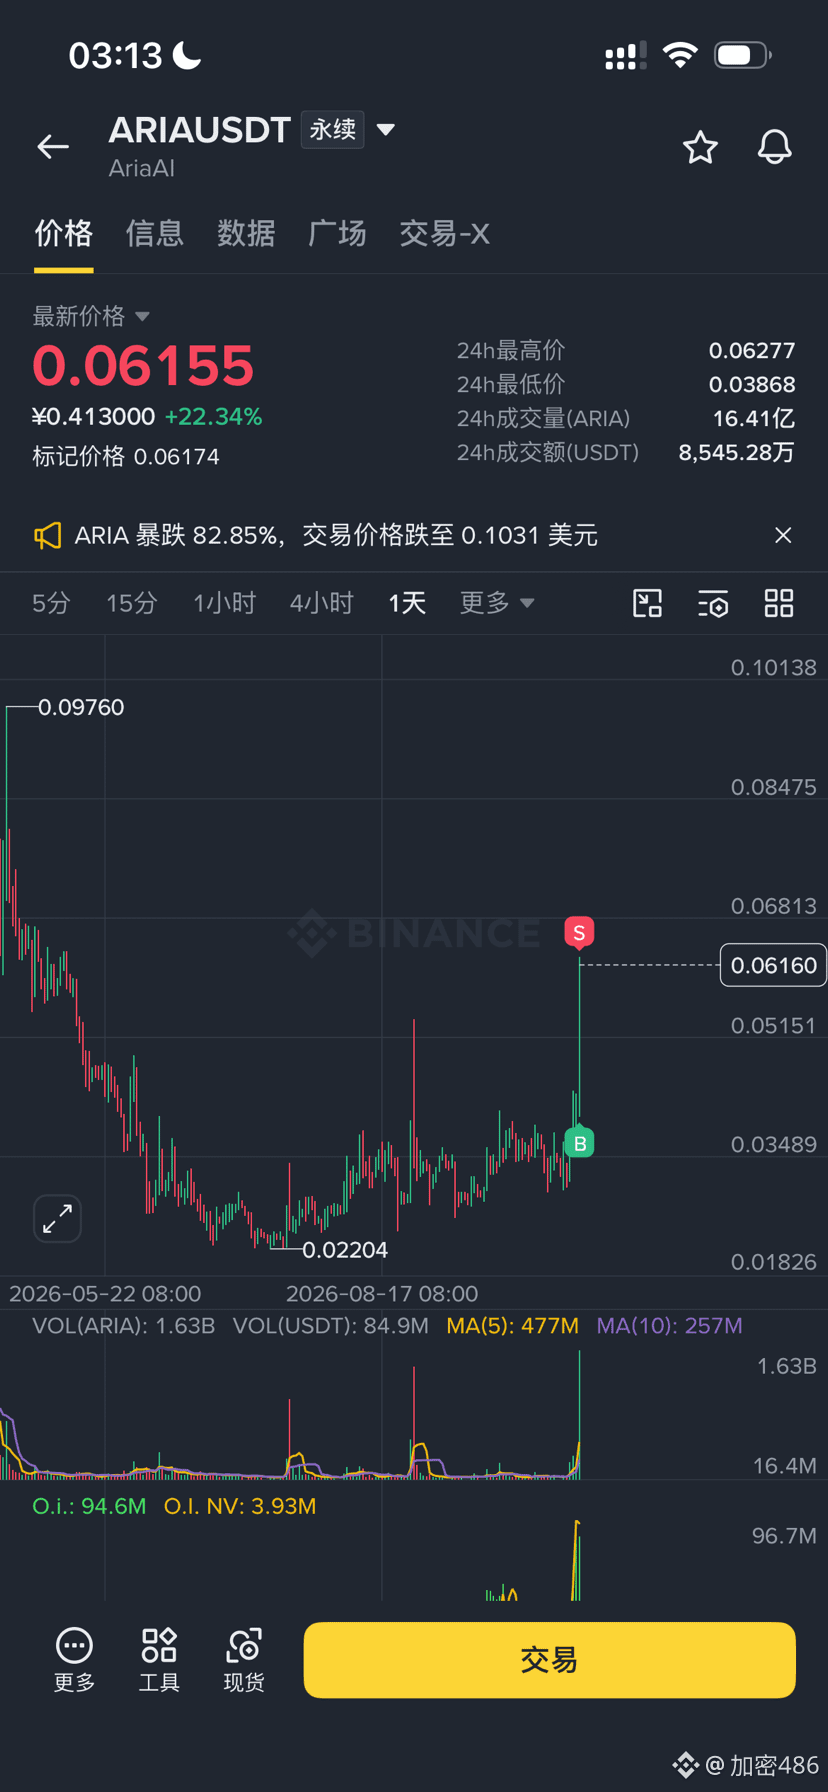
$ARIA Guys, guess where the peak is? I'll go first: 0.1!
{future}(ARIAUSDT)
$ARIA Guys, guess where the peak is? I'll go first: 0.1!
1
638
Log in to explore more content
Join global crypto users on Binance Square
⚡️ Get latest and useful information about crypto.
💬 Trusted by the world’s largest crypto exchange.
👍 Discover real insights from verified creators.
Email / Phone number
Trending Topics
USPPIMissMayEaseBTCPressure
86,920 views
1,094 Discussing
US PPI Rises 6.5% a Year in October, Slightly Below 6.6% Forecast
Binance News
·18 Likes
·20.2k views
MANTRAPausesUnstakingFor7DaysAfterKeplrSecurityIncident
130 views
10 Discussing
BitcoinCoreDisclosesTorTrafficVulnerability
39,433 views
620 Discussing