
土豆谈币
5k Posts

土豆谈币
Report
Block User
公众号:《听宝儿姐说》,喂(TDTB07)自有投研团队,顶级一二级资源,擅长各种现货均线理论分析操作,以及短线合约策略入场布局!
14 Following
3.4K+ Followers
4.0K+ Liked
Posts
All
Videos
PINNED
·
--
Come to the Binance chat collection
Seize future layout opportunities
Share swing and long-term strategies in real time!
Come to the Binance chat collection
Seize future layout opportunities
Share swing and long-term strategies in real time!
Seize future layout opportunities
Share swing and long-term strategies in real time!

6
76
·
--
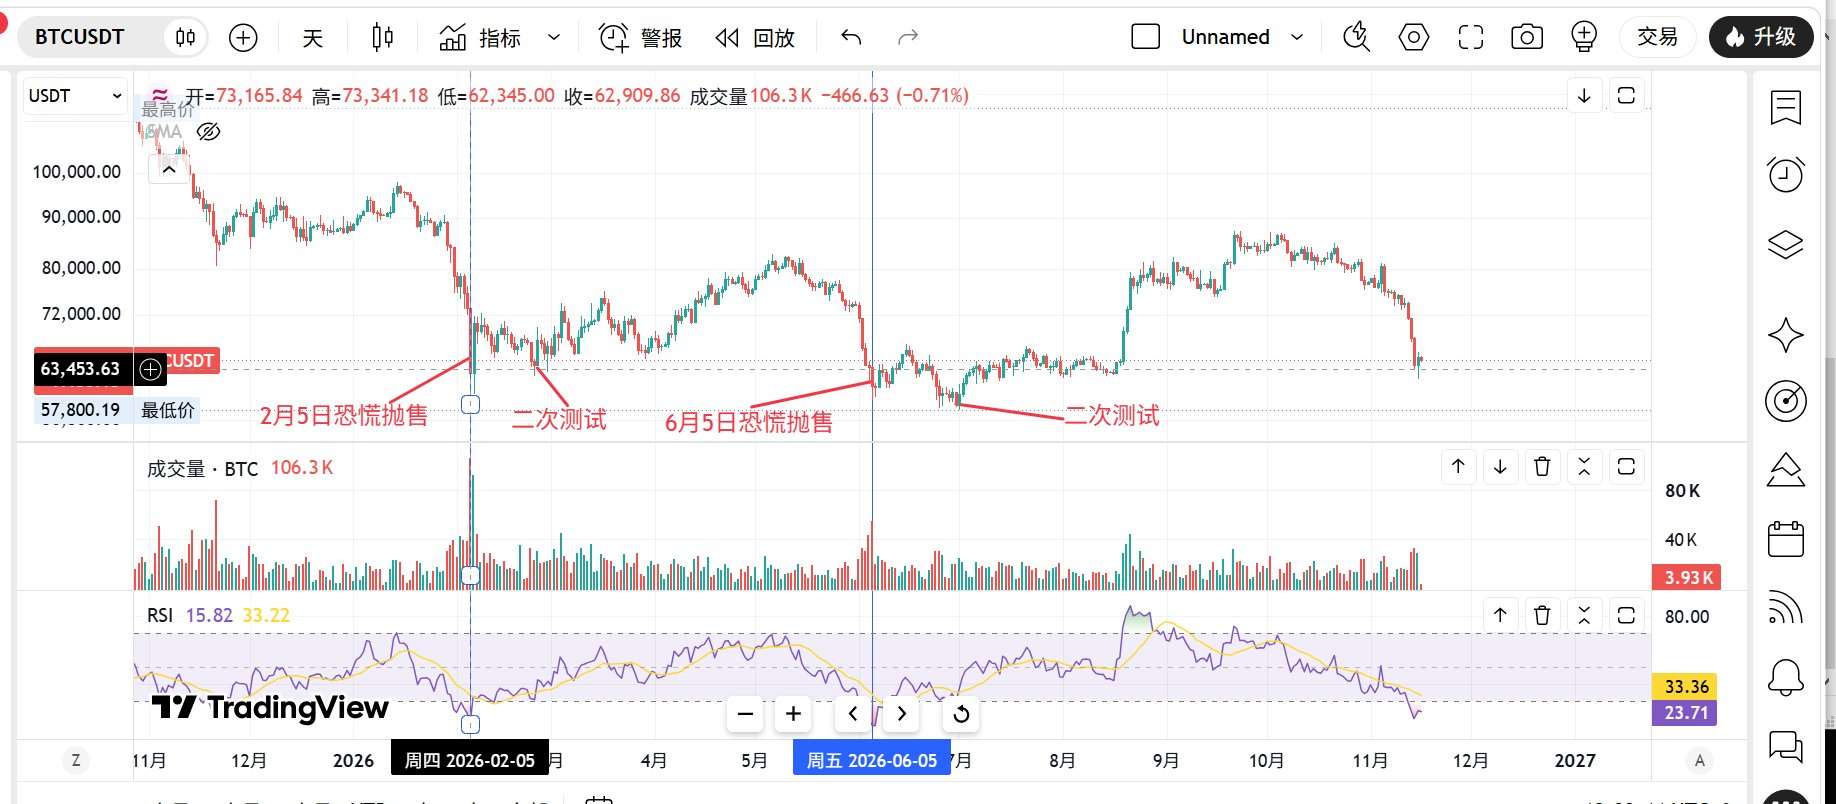
How can you tell whether Bitcoin has bottomed? Don’t just focus on the $50,000–$55,000 range—watch for two other signals.
First, there should be a high-volume panic sell-off, followed by a retest. The retest doesn’t necessarily have to stay above the previous low. What matters is whether volume has dropped, the decline has narrowed, and the downward selling pressure has weakened.
Second, the RSI needs to be extreme enough. At the previous two bottoms, the daily RSI was close to 15 and the weekly RSI was around 30. Now, the daily low is 19 and the weekly reading is 38, so the market isn’t oversold enough yet.
So the bottoming signals aren’t clear at this point. Next, watch for a high-volume panic sell-off, whether selling pressure weakens significantly on a retest, and whether the RSI moves further into extreme oversold territory. If these conditions are met, it would look more like an interim bottom. $BTC
{spot}(BTCUSDT)
How can you tell whether Bitcoin has bottomed? Don’t just focus on the $50,000–$55,000 range—watch for two other signals.
First, there should be a high-volume panic sell-off, followed by a retest. The retest doesn’t necessarily have to stay above the previous low. What matters is whether volume has dropped, the decline has narrowed, and the downward selling pressure has weakened.
Second, the RSI needs to be extreme enough. At the previous two bottoms, the daily RSI was close to 15 and the weekly RSI was around 30. Now, the daily low is 19 and the weekly reading is 38, so the market isn’t oversold enough yet.
So the bottoming signals aren’t clear at this point. Next, watch for a high-volume panic sell-off, whether selling pressure weakens significantly on a retest, and whether the RSI moves further into extreme oversold territory. If these conditions are met, it would look more like an interim bottom. $BTC
First, there should be a high-volume panic sell-off, followed by a retest. The retest doesn’t necessarily have to stay above the previous low. What matters is whether volume has dropped, the decline has narrowed, and the downward selling pressure has weakened.
Second, the RSI needs to be extreme enough. At the previous two bottoms, the daily RSI was close to 15 and the weekly RSI was around 30. Now, the daily low is 19 and the weekly reading is 38, so the market isn’t oversold enough yet.
So the bottoming signals aren’t clear at this point. Next, watch for a high-volume panic sell-off, whether selling pressure weakens significantly on a retest, and whether the RSI moves further into extreme oversold territory. If these conditions are met, it would look more like an interim bottom. $BTC
188
·
--
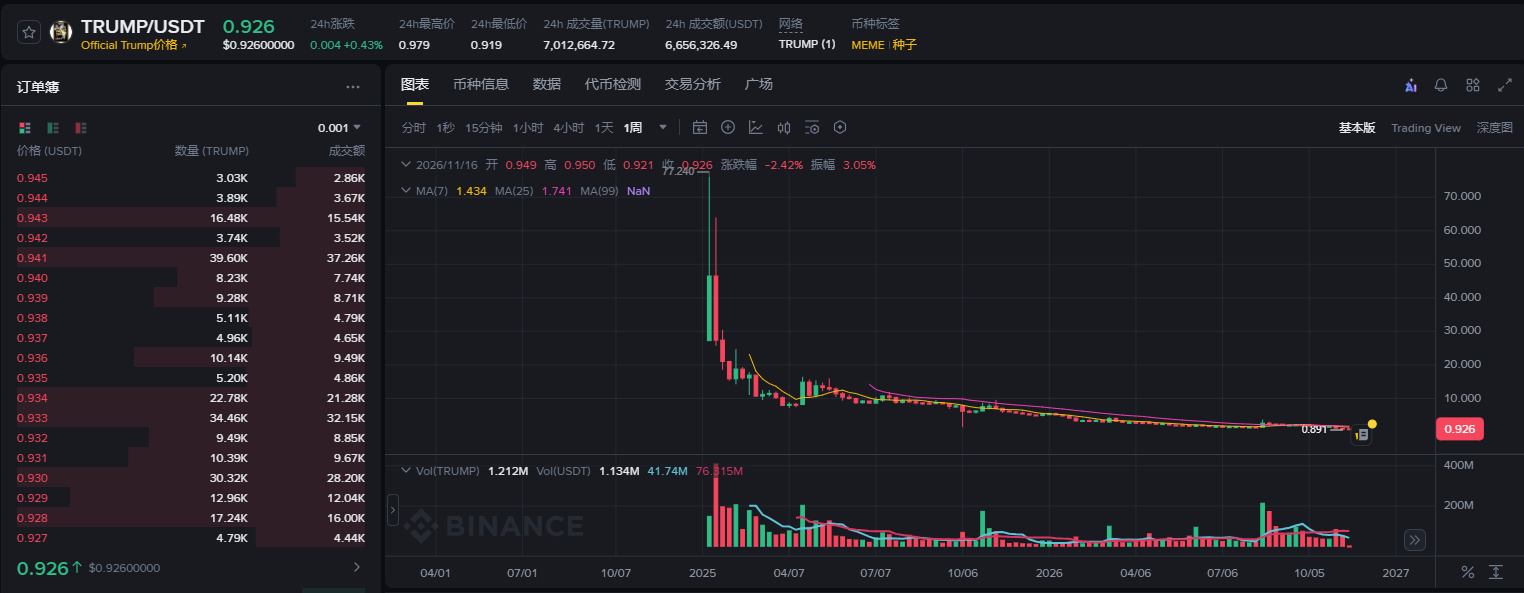
$TRUMP Down nearly 99%, to be honest, this is its own political story falling apart—not a sign that the crypto market has lost faith.
Money is what really reflects confidence: the fear index is at 21–28, stablecoin supply has shrunk by about $14.2 billion, and ETFs have seen six straight days of outflows. Money is leaving, and that’s a more meaningful signal than a meme coin going to zero.
The market structure looks similar to 2019: altcoins aren’t following, BTC rebounded after breaking below its 200-day moving average, and the Fed ended QT. But back then, volume didn’t follow through, and it took a year of grinding before the real bull market began. Short-term holders are now sitting on losses of 73%—an extreme level—but we’re still some way from a complete washout, and capital hasn’t rotated back in.
So don’t rush to call this a “2019 prelude” or say “crypto is over.” A big drop doesn’t mean we’ve hit bottom. At minimum, look for two of these signals: ETF inflows return, BTC finds support on strong volume, and altcoins stop making new lows in unison.
When confidence disappears, coins often pass from the weakest hands to the most patient ones. If you believe the former scenario, size your position for the possibility that this could grind on for a year—but don’t bet on a reversal next week.
{spot}(TRUMPUSDT)
$TRUMP Down nearly 99%, to be honest, this is its own political story falling apart—not a sign that the crypto market has lost faith.
Money is what really reflects confidence: the fear index is at 21–28, stablecoin supply has shrunk by about $14.2 billion, and ETFs have seen six straight days of outflows. Money is leaving, and that’s a more meaningful signal than a meme coin going to zero.
The market structure looks similar to 2019: altcoins aren’t following, BTC rebounded after breaking below its 200-day moving average, and the Fed ended QT. But back then, volume didn’t follow through, and it took a year of grinding before the real bull market began. Short-term holders are now sitting on losses of 73%—an extreme level—but we’re still some way from a complete washout, and capital hasn’t rotated back in.
So don’t rush to call this a “2019 prelude” or say “crypto is over.” A big drop doesn’t mean we’ve hit bottom. At minimum, look for two of these signals: ETF inflows return, BTC finds support on strong volume, and altcoins stop making new lows in unison.
When confidence disappears, coins often pass from the weakest hands to the most patient ones. If you believe the former scenario, size your position for the possibility that this could grind on for a year—but don’t bet on a reversal next week.
Money is what really reflects confidence: the fear index is at 21–28, stablecoin supply has shrunk by about $14.2 billion, and ETFs have seen six straight days of outflows. Money is leaving, and that’s a more meaningful signal than a meme coin going to zero.
The market structure looks similar to 2019: altcoins aren’t following, BTC rebounded after breaking below its 200-day moving average, and the Fed ended QT. But back then, volume didn’t follow through, and it took a year of grinding before the real bull market began. Short-term holders are now sitting on losses of 73%—an extreme level—but we’re still some way from a complete washout, and capital hasn’t rotated back in.
So don’t rush to call this a “2019 prelude” or say “crypto is over.” A big drop doesn’t mean we’ve hit bottom. At minimum, look for two of these signals: ETF inflows return, BTC finds support on strong volume, and altcoins stop making new lows in unison.
When confidence disappears, coins often pass from the weakest hands to the most patient ones. If you believe the former scenario, size your position for the possibility that this could grind on for a year—but don’t bet on a reversal next week.
205
·
--
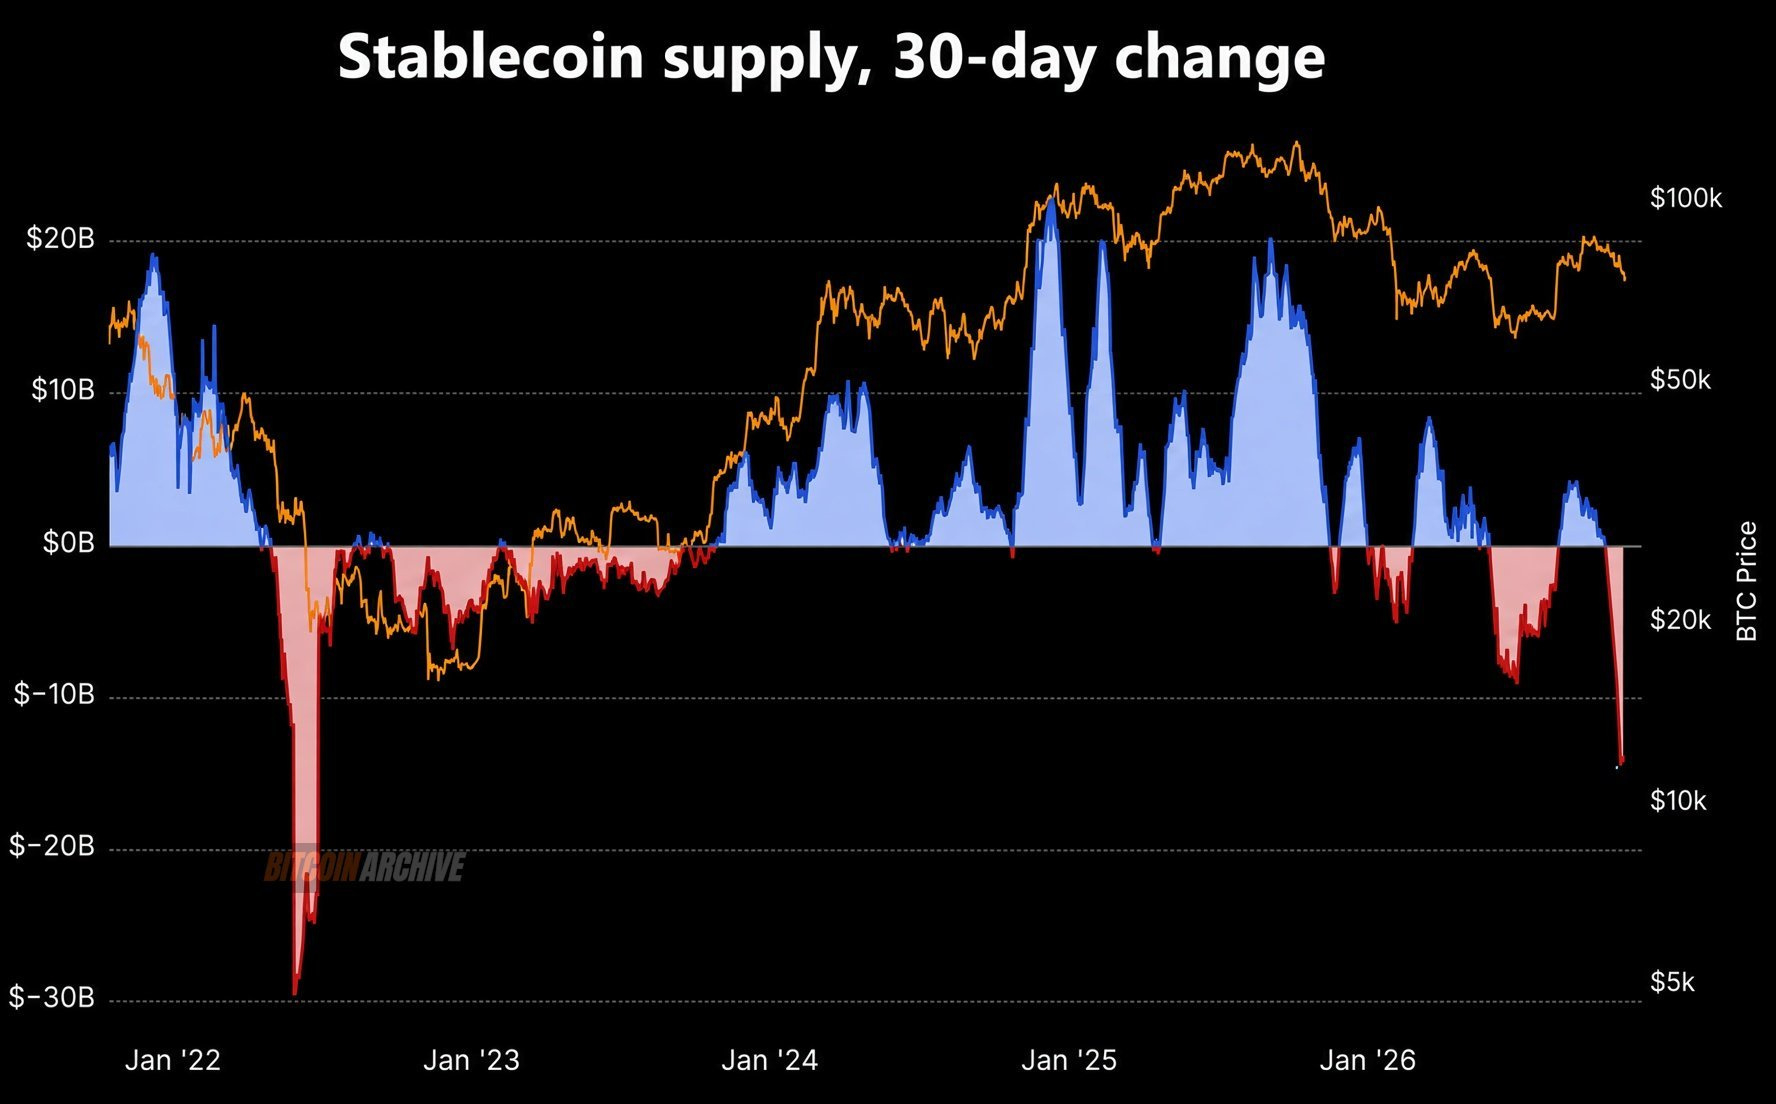
The crypto market isn’t short on stories right now—it’s short on money, and that money is vanishing at the fastest rate since 2022.
Stablecoins have shrunk by $14.2 billion net over the past 30 days, with USDT alone down $8.3 billion. When BTC fell below $58,000 in July 2026, stablecoins shrank by $9.5 billion over 30 days. This time is even worse. USDT is down $6.6 billion over the past 60 days—a drop in absolute terms of more than twice the amount over the same period after the FTX collapse.
ETFs are seeing outflows too: U.S. spot BTC ETFs have had net outflows of about $1.6 billion over the past 20 trading days, while the Coinbase premium has remained negative. Institutional funds and on-chain liquidity are both weakening.
Cash is rapidly draining from the market, and institutions aren’t stepping in to take over, so every rebound is a real struggle. This market is nothing like the one when BTC fell to $58,000: there’s less money, so rebounds naturally have less conviction.
The crypto market isn’t short on stories right now—it’s short on money, and that money is vanishing at the fastest rate since 2022.
Stablecoins have shrunk by $14.2 billion net over the past 30 days, with USDT alone down $8.3 billion. When BTC fell below $58,000 in July 2026, stablecoins shrank by $9.5 billion over 30 days. This time is even worse. USDT is down $6.6 billion over the past 60 days—a drop in absolute terms of more than twice the amount over the same period after the FTX collapse.
ETFs are seeing outflows too: U.S. spot BTC ETFs have had net outflows of about $1.6 billion over the past 20 trading days, while the Coinbase premium has remained negative. Institutional funds and on-chain liquidity are both weakening.
Cash is rapidly draining from the market, and institutions aren’t stepping in to take over, so every rebound is a real struggle. This market is nothing like the one when BTC fell to $58,000: there’s less money, so rebounds naturally have less conviction.
Stablecoins have shrunk by $14.2 billion net over the past 30 days, with USDT alone down $8.3 billion. When BTC fell below $58,000 in July 2026, stablecoins shrank by $9.5 billion over 30 days. This time is even worse. USDT is down $6.6 billion over the past 60 days—a drop in absolute terms of more than twice the amount over the same period after the FTX collapse.
ETFs are seeing outflows too: U.S. spot BTC ETFs have had net outflows of about $1.6 billion over the past 20 trading days, while the Coinbase premium has remained negative. Institutional funds and on-chain liquidity are both weakening.
Cash is rapidly draining from the market, and institutions aren’t stepping in to take over, so every rebound is a real struggle. This market is nothing like the one when BTC fell to $58,000: there’s less money, so rebounds naturally have less conviction.
1
226
·
--
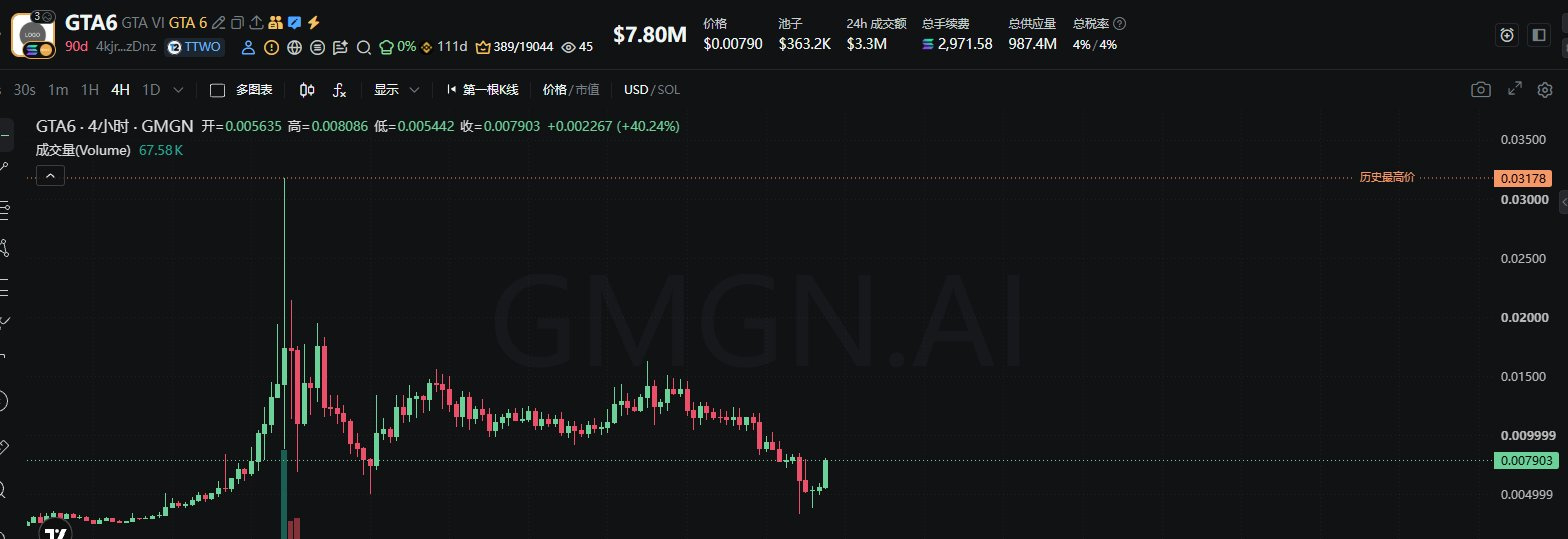
The GTA6 concept coin has a market cap of around 7.8M right now, so you could take a small position early. Its narrative is tied to the upcoming Grand Theft Auto, and the launch on the 19th will most likely spark a surge in hype.
CA: 4kjruqGHDsSqkMdFfCjV7Vb62HPFhtXyWc2t6JpQzDnz. Manage your risk accordingly.
The GTA6 concept coin has a market cap of around 7.8M right now, so you could take a small position early. Its narrative is tied to the upcoming Grand Theft Auto, and the launch on the 19th will most likely spark a surge in hype.
CA: 4kjruqGHDsSqkMdFfCjV7Vb62HPFhtXyWc2t6JpQzDnz. Manage your risk accordingly.
CA: 4kjruqGHDsSqkMdFfCjV7Vb62HPFhtXyWc2t6JpQzDnz. Manage your risk accordingly.
192
·
--
Bullish
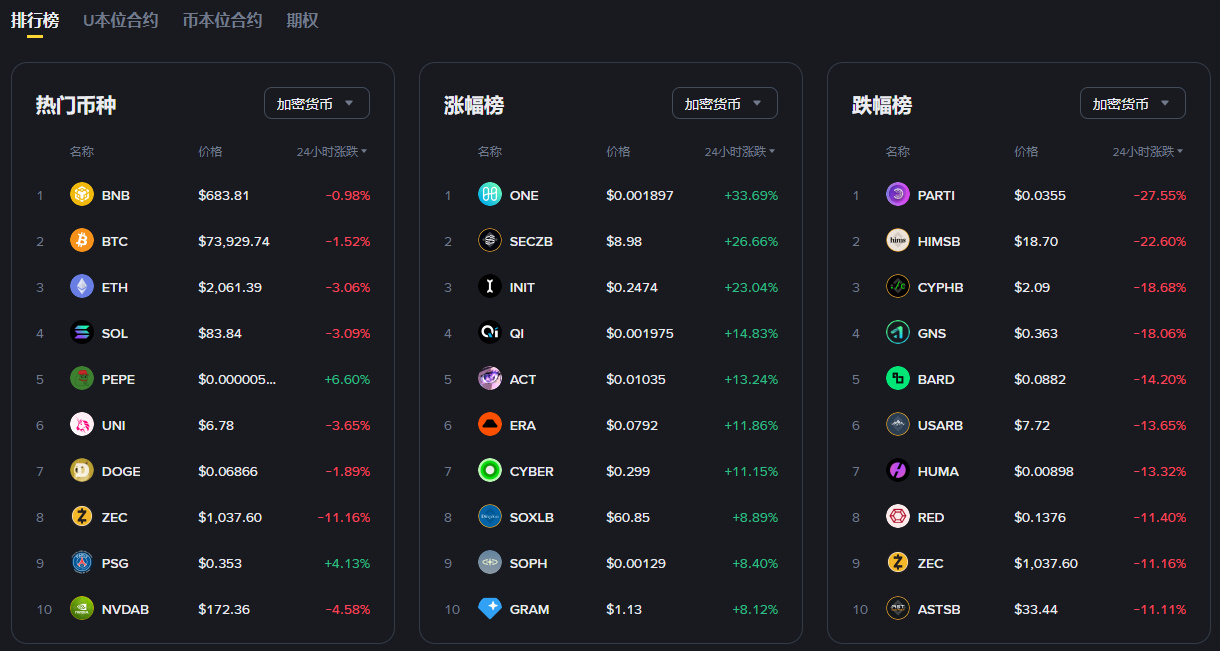
If you bought a bunch of wild altcoins and got stuck holding the bag, don’t be sad.
If you didn’t buy altcoins, you definitely bought a pile of UNI, ENA, and ZAMA; if you didn’t buy those, you bought ETH; and if you didn’t buy ETH, you’re probably sitting on a pile of Gstock, 4stock, GM coins, PONS, or STONK.
If you haven’t touched any of those, you’re definitely farming Smartx. And if you haven’t even farmed that, you’re just broke and can’t afford to buy anything.
If you bought a bunch of wild altcoins and got stuck holding the bag, don’t be sad.
If you didn’t buy altcoins, you definitely bought a pile of UNI, ENA, and ZAMA; if you didn’t buy those, you bought ETH; and if you didn’t buy ETH, you’re probably sitting on a pile of Gstock, 4stock, GM coins, PONS, or STONK.
If you haven’t touched any of those, you’re definitely farming Smartx. And if you haven’t even farmed that, you’re just broke and can’t afford to buy anything.
If you didn’t buy altcoins, you definitely bought a pile of UNI, ENA, and ZAMA; if you didn’t buy those, you bought ETH; and if you didn’t buy ETH, you’re probably sitting on a pile of Gstock, 4stock, GM coins, PONS, or STONK.
If you haven’t touched any of those, you’re definitely farming Smartx. And if you haven’t even farmed that, you’re just broke and can’t afford to buy anything.
1
251
·
--
Tonight, the U.S. October CPI report is different from usual: the government shutdown last October means there’s no comparable base, so there won’t be a year-over-year figure this time. The market can only focus on the month-over-month rate.
CPI is expected to rise 0.3% month over month, with core CPI up 0.2%, compared with previous readings of 0.6% and 0.3%. Market expectations are on the optimistic side. The Cleveland Fed is more aggressive, forecasting 0.24% and 0.21%.
My take: With no year-over-year figure, the monthly rate will matter more. If it comes in clearly above 0.3%, that suggests energy costs are still feeding into inflation, and expectations of a December rate hike will probably heat up. If core CPI holds around 0.2% and comes in at or below expectations, that would support risk assets.
In plain English: At or below expectations is good news; above expectations but below the previous reading is mildly negative; above both expectations and the previous reading is outright bad news.
Also, the December FOMC meeting is on December 10. November data—apart from nonfarm payrolls—won’t be released in time, so this October report may have the biggest impact on Fed policy. $BTC
{future}(BTCUSDT)
Tonight, the U.S. October CPI report is different from usual: the government shutdown last October means there’s no comparable base, so there won’t be a year-over-year figure this time. The market can only focus on the month-over-month rate.
CPI is expected to rise 0.3% month over month, with core CPI up 0.2%, compared with previous readings of 0.6% and 0.3%. Market expectations are on the optimistic side. The Cleveland Fed is more aggressive, forecasting 0.24% and 0.21%.
My take: With no year-over-year figure, the monthly rate will matter more. If it comes in clearly above 0.3%, that suggests energy costs are still feeding into inflation, and expectations of a December rate hike will probably heat up. If core CPI holds around 0.2% and comes in at or below expectations, that would support risk assets.
In plain English: At or below expectations is good news; above expectations but below the previous reading is mildly negative; above both expectations and the previous reading is outright bad news.
Also, the December FOMC meeting is on December 10. November data—apart from nonfarm payrolls—won’t be released in time, so this October report may have the biggest impact on Fed policy. $BTC
CPI is expected to rise 0.3% month over month, with core CPI up 0.2%, compared with previous readings of 0.6% and 0.3%. Market expectations are on the optimistic side. The Cleveland Fed is more aggressive, forecasting 0.24% and 0.21%.
My take: With no year-over-year figure, the monthly rate will matter more. If it comes in clearly above 0.3%, that suggests energy costs are still feeding into inflation, and expectations of a December rate hike will probably heat up. If core CPI holds around 0.2% and comes in at or below expectations, that would support risk assets.
In plain English: At or below expectations is good news; above expectations but below the previous reading is mildly negative; above both expectations and the previous reading is outright bad news.
Also, the December FOMC meeting is on December 10. November data—apart from nonfarm payrolls—won’t be released in time, so this October report may have the biggest impact on Fed policy. $BTC
100
·
--
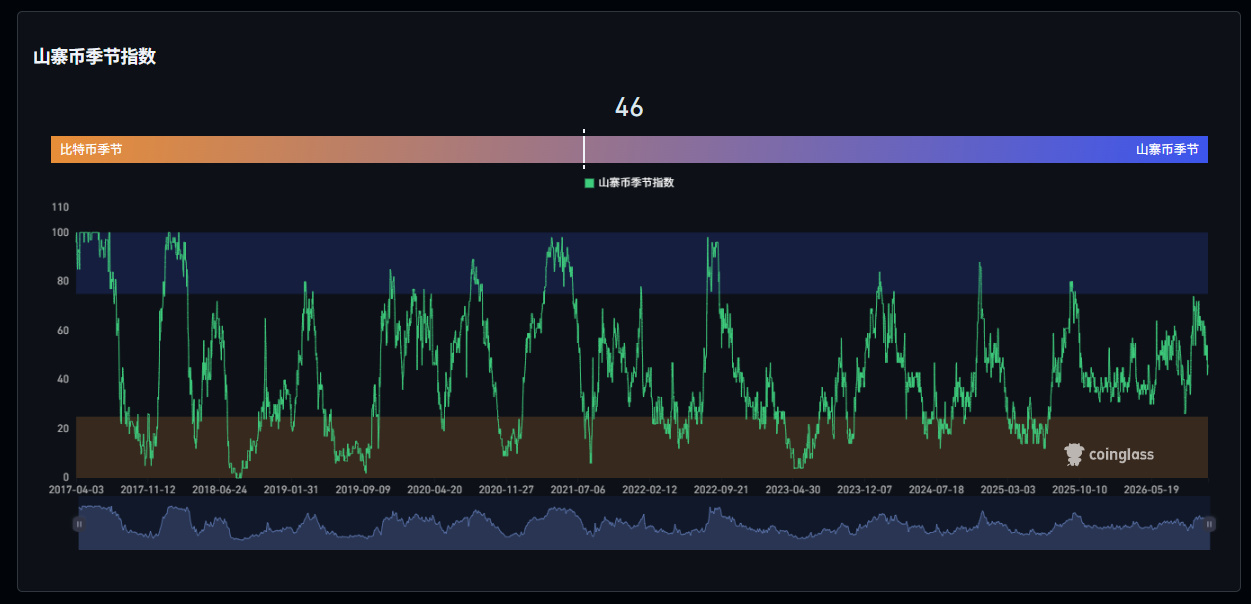
To judge whether an altcoin is worth holding long term, look at whether its price action is sustainable.
Most altcoins are on the gainers list one day and the losers list the next. Their prices are driven purely by shady market makers pumping them so they can dump their bags—taking whatever profit they can get. With coins like ZKC, ZKP, TUT, and POL, the project teams have basically gone dormant, while the market makers still have tokens to sell. They take advantage of a strong market to pump the price and find buyers to dump on.
With this pullback, just look at one thing: if the price hasn’t broken below or fallen back to its previous low, it means the market makers are still around and haven’t abandoned the coin. Altcoins with staying power still have project teams moving with the broader market. Examples include AAVE, UNI, ZEC, NEAR, MORPHO, LINK, AERO, RAY, ENA, and LIT. These are infrastructure or trending projects, and are relatively suitable for medium- to long-term holds through a full market cycle.
When investing in altcoins, choosing the right ones is what matters most. If both the project team and the market makers have abandoned a coin and you’re still holding it long term, you’ll have wasted another cycle.
To judge whether an altcoin is worth holding long term, look at whether its price action is sustainable.
Most altcoins are on the gainers list one day and the losers list the next. Their prices are driven purely by shady market makers pumping them so they can dump their bags—taking whatever profit they can get. With coins like ZKC, ZKP, TUT, and POL, the project teams have basically gone dormant, while the market makers still have tokens to sell. They take advantage of a strong market to pump the price and find buyers to dump on.
With this pullback, just look at one thing: if the price hasn’t broken below or fallen back to its previous low, it means the market makers are still around and haven’t abandoned the coin. Altcoins with staying power still have project teams moving with the broader market. Examples include AAVE, UNI, ZEC, NEAR, MORPHO, LINK, AERO, RAY, ENA, and LIT. These are infrastructure or trending projects, and are relatively suitable for medium- to long-term holds through a full market cycle.
When investing in altcoins, choosing the right ones is what matters most. If both the project team and the market makers have abandoned a coin and you’re still holding it long term, you’ll have wasted another cycle.
Most altcoins are on the gainers list one day and the losers list the next. Their prices are driven purely by shady market makers pumping them so they can dump their bags—taking whatever profit they can get. With coins like ZKC, ZKP, TUT, and POL, the project teams have basically gone dormant, while the market makers still have tokens to sell. They take advantage of a strong market to pump the price and find buyers to dump on.
With this pullback, just look at one thing: if the price hasn’t broken below or fallen back to its previous low, it means the market makers are still around and haven’t abandoned the coin. Altcoins with staying power still have project teams moving with the broader market. Examples include AAVE, UNI, ZEC, NEAR, MORPHO, LINK, AERO, RAY, ENA, and LIT. These are infrastructure or trending projects, and are relatively suitable for medium- to long-term holds through a full market cycle.
When investing in altcoins, choosing the right ones is what matters most. If both the project team and the market makers have abandoned a coin and you’re still holding it long term, you’ll have wasted another cycle.
134
·
--
Bullish
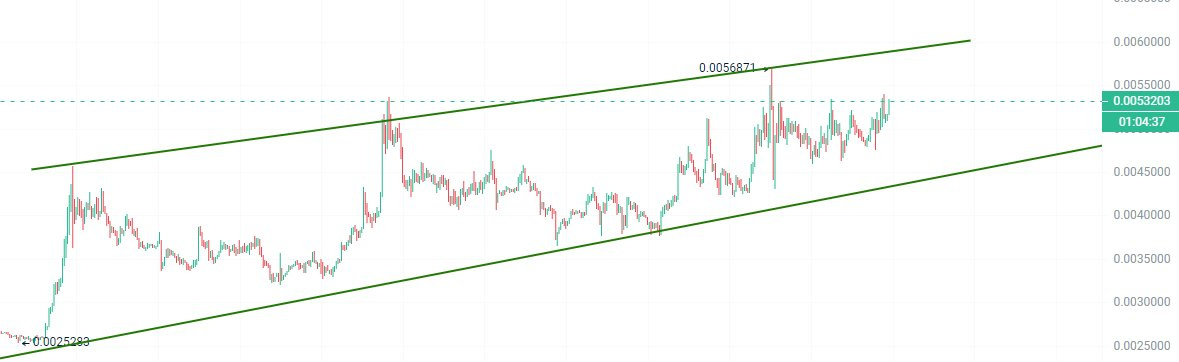
$PEPE I’m still pretty optimistic about it. When the broader market fell, it got dragged down too, but quickly bounced back, which shows there’s buying support. Overall, it’s still in an uptrend.
In the short term, it may test the upper boundary again. If it breaks through on strong volume, it’ll most likely accelerate and make a run—provided Bitcoin stabilizes first.
{spot}(PEPEUSDT)
$PEPE I’m still pretty optimistic about it. When the broader market fell, it got dragged down too, but quickly bounced back, which shows there’s buying support. Overall, it’s still in an uptrend.
In the short term, it may test the upper boundary again. If it breaks through on strong volume, it’ll most likely accelerate and make a run—provided Bitcoin stabilizes first.
In the short term, it may test the upper boundary again. If it breaks through on strong volume, it’ll most likely accelerate and make a run—provided Bitcoin stabilizes first.
168
·
--
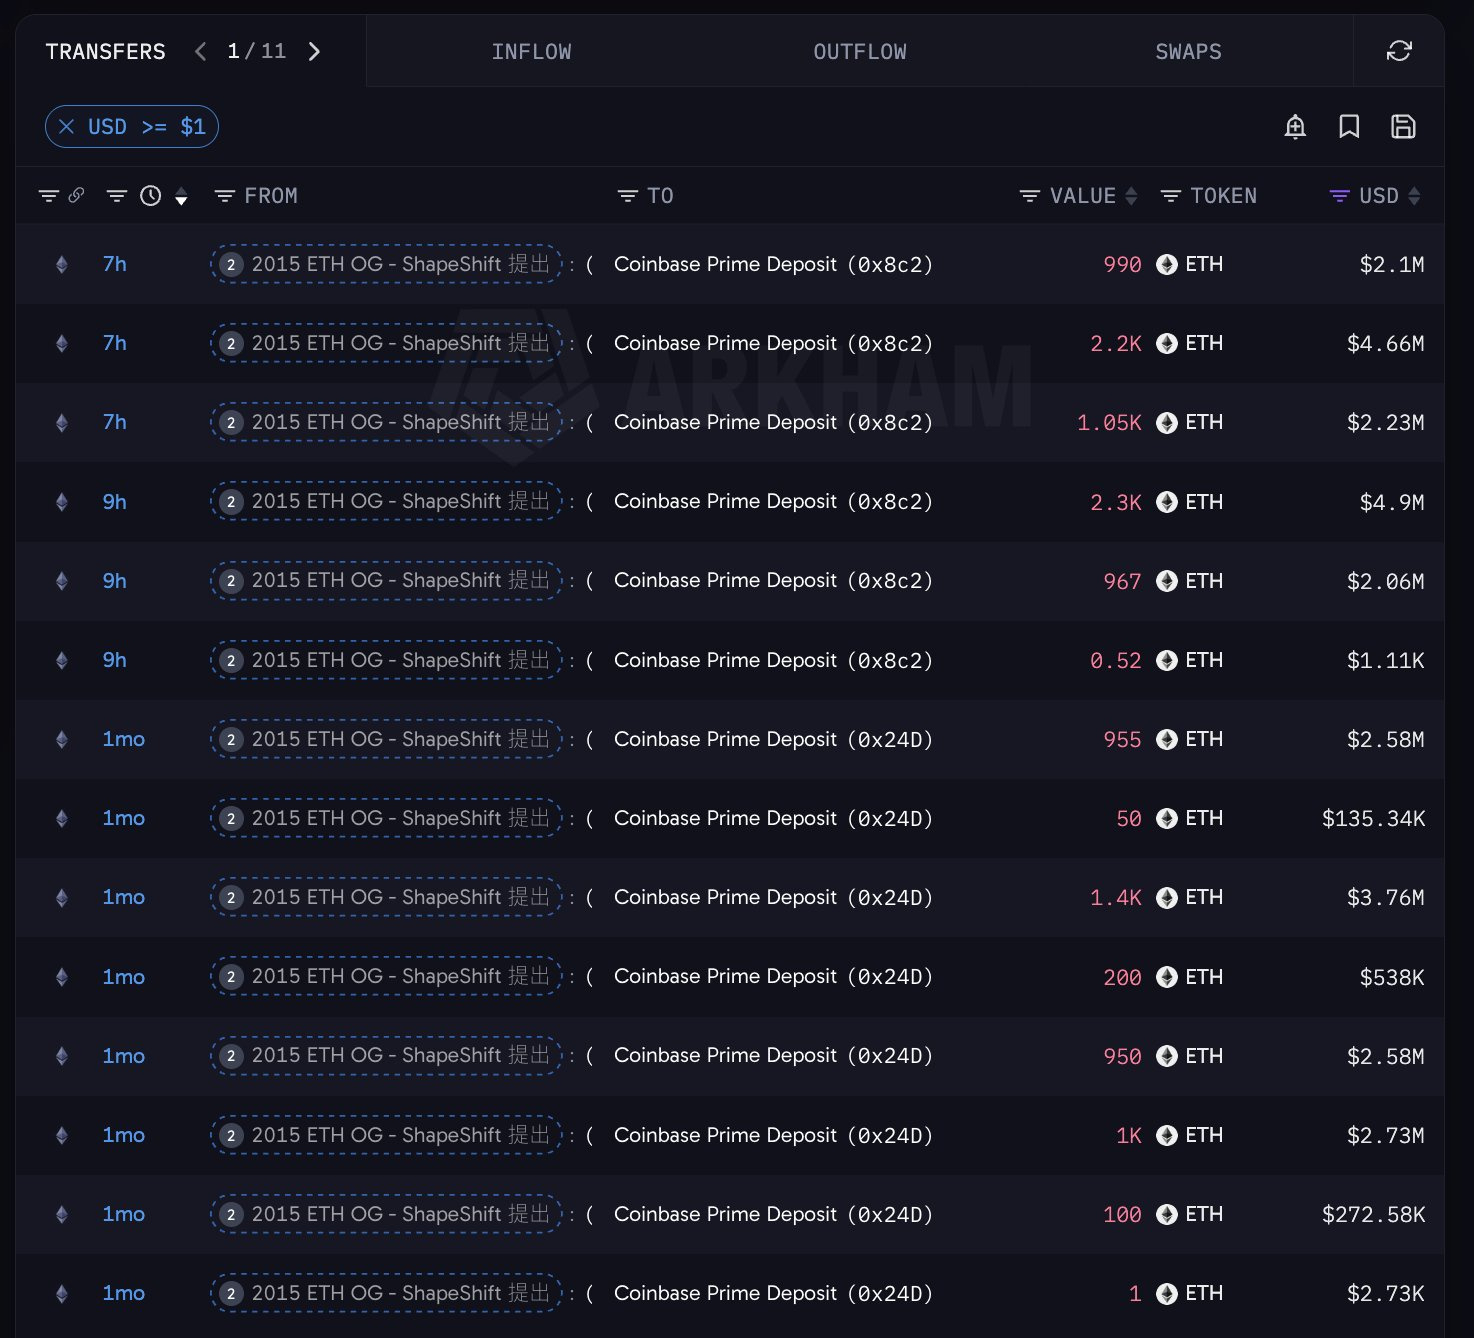
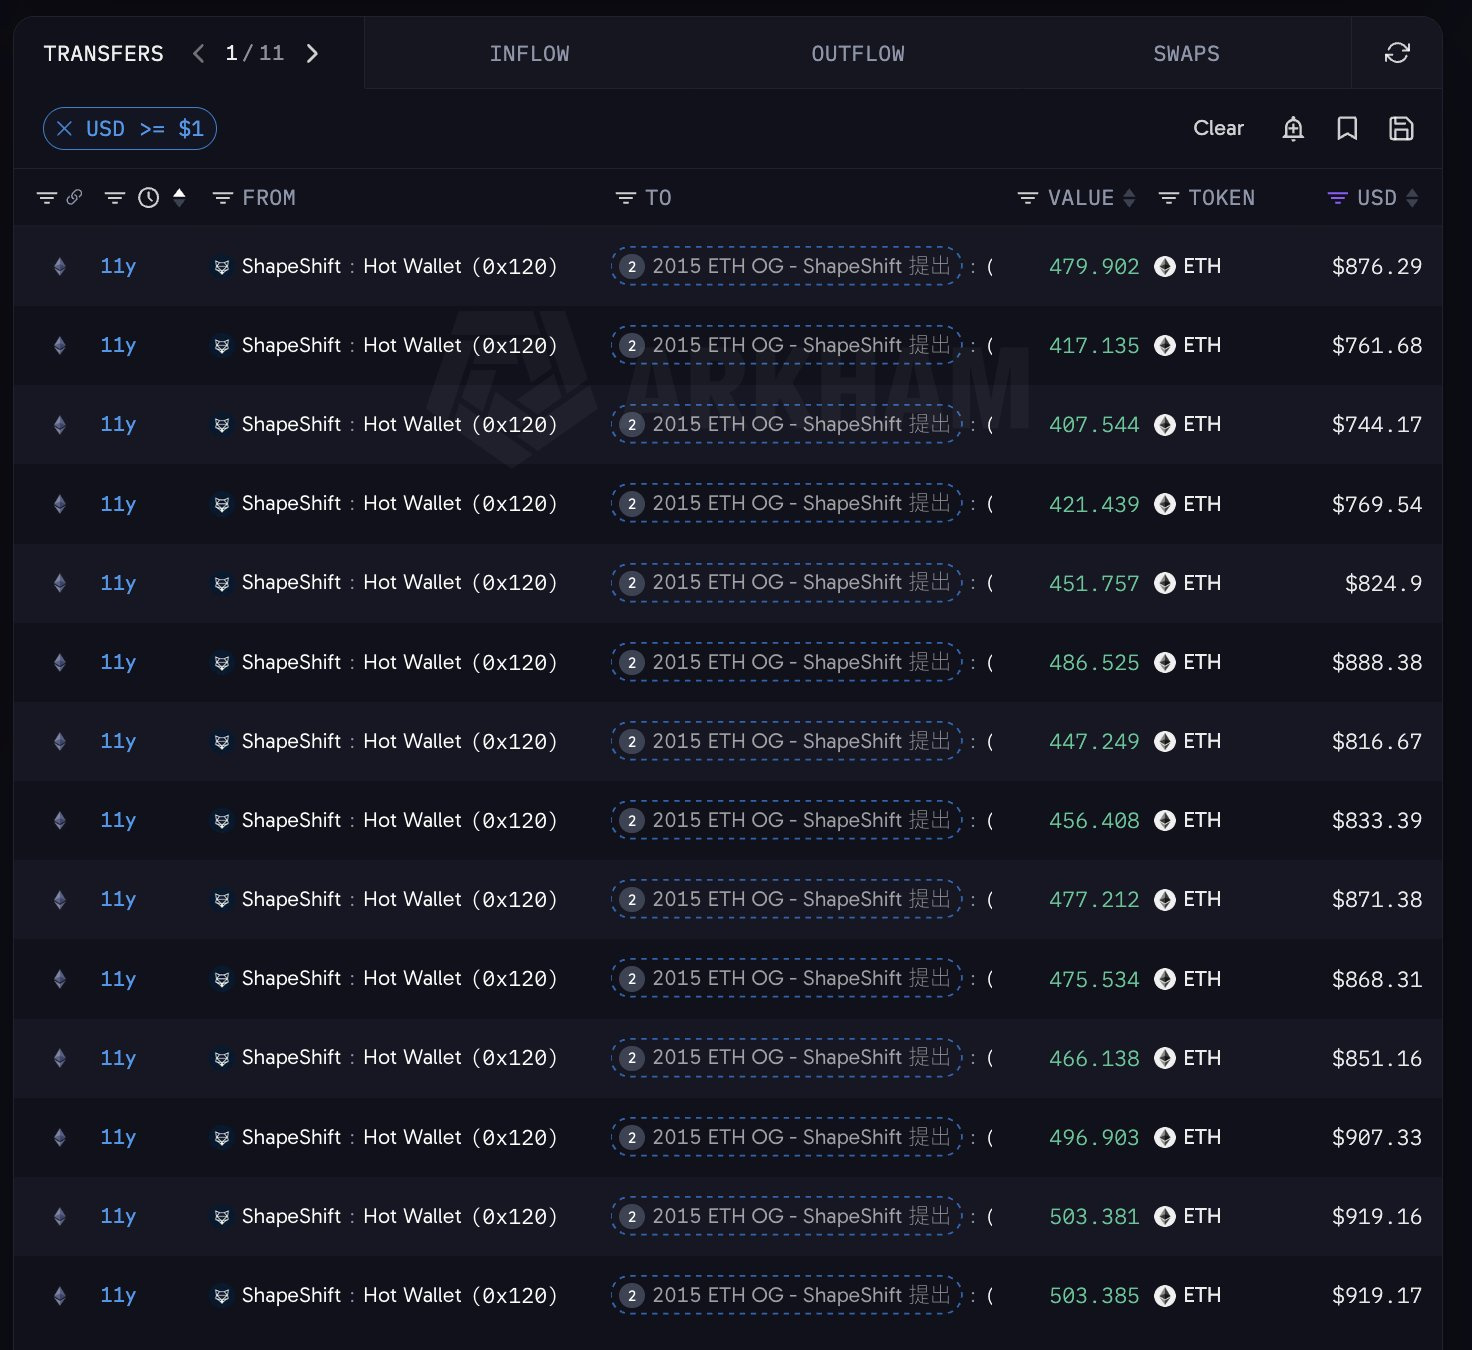
The ancient whale that built a position of 37,000 coins at $1.5 in January 2015 ($ETH ) has started selling.
It is suspected of selling 7,507.52 ETH over the past 9 hours, with an estimated profit of $15.93 million. Since September 29, it has transferred 12,163.52 ETH worth $28.54 million to exchanges, at an average deposit price of $2,346.87. If it sells everything, its return would reach 156,358%. The funds can be traced back to a withdrawal from ShapeShift in August 2015.
{future}(ETHUSDT)
The ancient whale that built a position of 37,000 coins at $1.5 in January 2015 ($ETH ) has started selling.
It is suspected of selling 7,507.52 ETH over the past 9 hours, with an estimated profit of $15.93 million. Since September 29, it has transferred 12,163.52 ETH worth $28.54 million to exchanges, at an average deposit price of $2,346.87. If it sells everything, its return would reach 156,358%. The funds can be traced back to a withdrawal from ShapeShift in August 2015.
It is suspected of selling 7,507.52 ETH over the past 9 hours, with an estimated profit of $15.93 million. Since September 29, it has transferred 12,163.52 ETH worth $28.54 million to exchanges, at an average deposit price of $2,346.87. If it sells everything, its return would reach 156,358%. The funds can be traced back to a withdrawal from ShapeShift in August 2015.
166
·
--
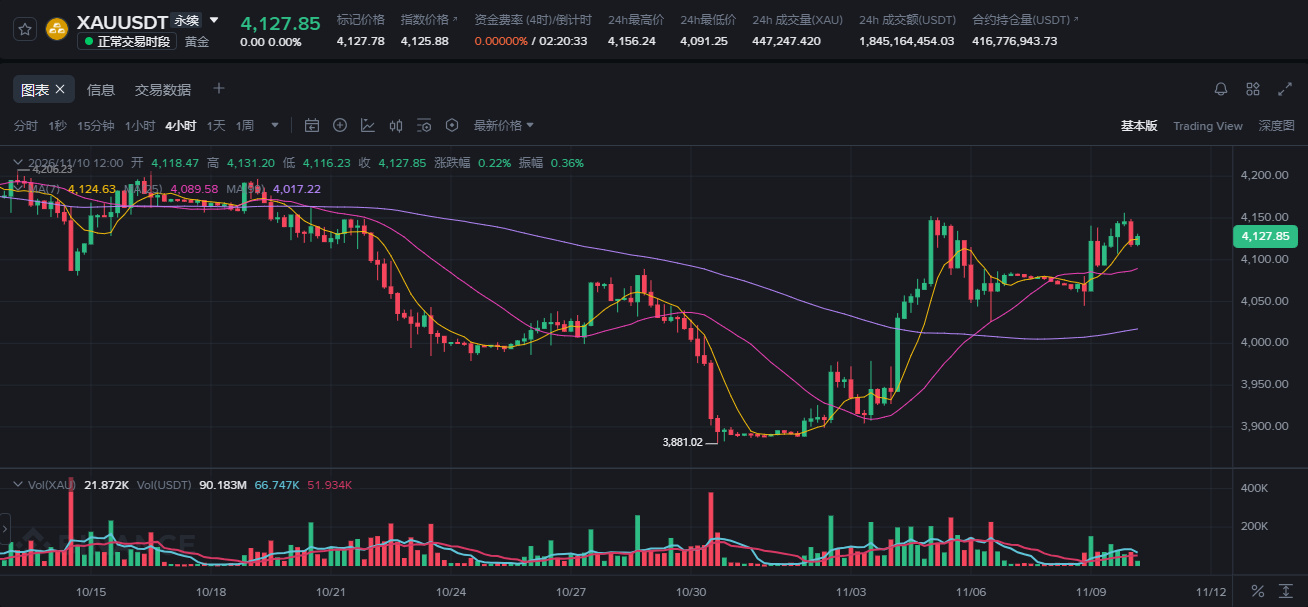
$XAU Gold: CPI at 9:30 tonight will reveal the truth
Key levels: Support is at 4040–4020. As long as 4020 isn’t decisively broken, the broader trend remains range-bound with an upward bias. Resistance is at 4170–4150, this week’s high and the strongest resistance. Strong resistance is at 4200–4230; if gold can’t break through, it’ll need to correct further. For now, it’s just range-bound shakeout, flushing out the less committed.
The strategy is simple: buy on a pullback to support. Don’t chase the rally.
{future}(XAUUSDT)
$XAU Gold: CPI at 9:30 tonight will reveal the truth
Key levels: Support is at 4040–4020. As long as 4020 isn’t decisively broken, the broader trend remains range-bound with an upward bias. Resistance is at 4170–4150, this week’s high and the strongest resistance. Strong resistance is at 4200–4230; if gold can’t break through, it’ll need to correct further. For now, it’s just range-bound shakeout, flushing out the less committed.
The strategy is simple: buy on a pullback to support. Don’t chase the rally.
Key levels: Support is at 4040–4020. As long as 4020 isn’t decisively broken, the broader trend remains range-bound with an upward bias. Resistance is at 4170–4150, this week’s high and the strongest resistance. Strong resistance is at 4200–4230; if gold can’t break through, it’ll need to correct further. For now, it’s just range-bound shakeout, flushing out the less committed.
The strategy is simple: buy on a pullback to support. Don’t chase the rally.
131
·
--
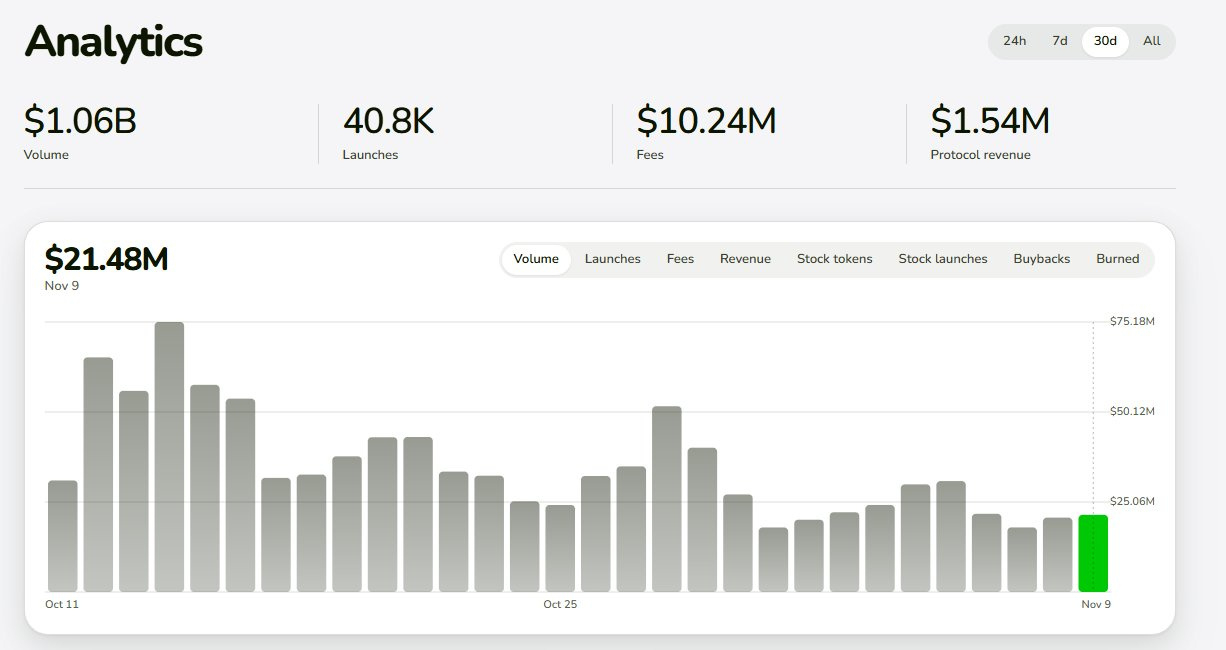
$PONS stayed above 20M for the second consecutive day, with metrics broadly recovering: volume was 21.5M, up a modest 3.7%; platform fees rose 19.9%, protocol revenue 16.1%, token issuance 21.8%, and transaction count 15.8%.
But the broader chain did even better: total DEX volume on Robinhood Chain surged from 387M to 737M, nearly doubling, while PONS’s share fell from 5.3% to 2.9%—clearly underperforming the market.
Burns topped 100,000 tokens for the third consecutive day, bringing the cumulative total to 32.97%; 254,000 remain in the buyback pool, with funds moved from the splitter into escrow.
Also, STONK fell 30% on each of the past two days—pretty alarming to watch.
$PONS stayed above 20M for the second consecutive day, with metrics broadly recovering: volume was 21.5M, up a modest 3.7%; platform fees rose 19.9%, protocol revenue 16.1%, token issuance 21.8%, and transaction count 15.8%.
But the broader chain did even better: total DEX volume on Robinhood Chain surged from 387M to 737M, nearly doubling, while PONS’s share fell from 5.3% to 2.9%—clearly underperforming the market.
Burns topped 100,000 tokens for the third consecutive day, bringing the cumulative total to 32.97%; 254,000 remain in the buyback pool, with funds moved from the splitter into escrow.
Also, STONK fell 30% on each of the past two days—pretty alarming to watch.
But the broader chain did even better: total DEX volume on Robinhood Chain surged from 387M to 737M, nearly doubling, while PONS’s share fell from 5.3% to 2.9%—clearly underperforming the market.
Burns topped 100,000 tokens for the third consecutive day, bringing the cumulative total to 32.97%; 254,000 remain in the buyback pool, with funds moved from the splitter into escrow.
Also, STONK fell 30% on each of the past two days—pretty alarming to watch.
182
·
--
Today is all about extreme whipsaw. This morning I was too busy following the Nvidia drama, and by the time I wanted to short, the futures contract was already down nearly 2%, so I didn't chase it. Stocks were a beat behind, but oil reacted quickly, so I caught some news in the early hours and made a short-term trade.
Oil prices first fell on weekend impeachment news and Trump's comment that he wouldn't strike if negotiations were possible. Then, in the early hours, Al Jazeera reported that the US and Iran had reached a consensus on the nuclear issue, that the US had unfrozen some funds, and that Iran had opened the Strait of Hormuz. Brent nearly broke below $90, and the funding rate for shorts surged too. Then Trump added that he was still prepared to use force if necessary, and oil prices bounced right back. As soon as I saw the statement, I closed all my short positions, avoiding the high funding fees, and continued to wait for an opportunity.
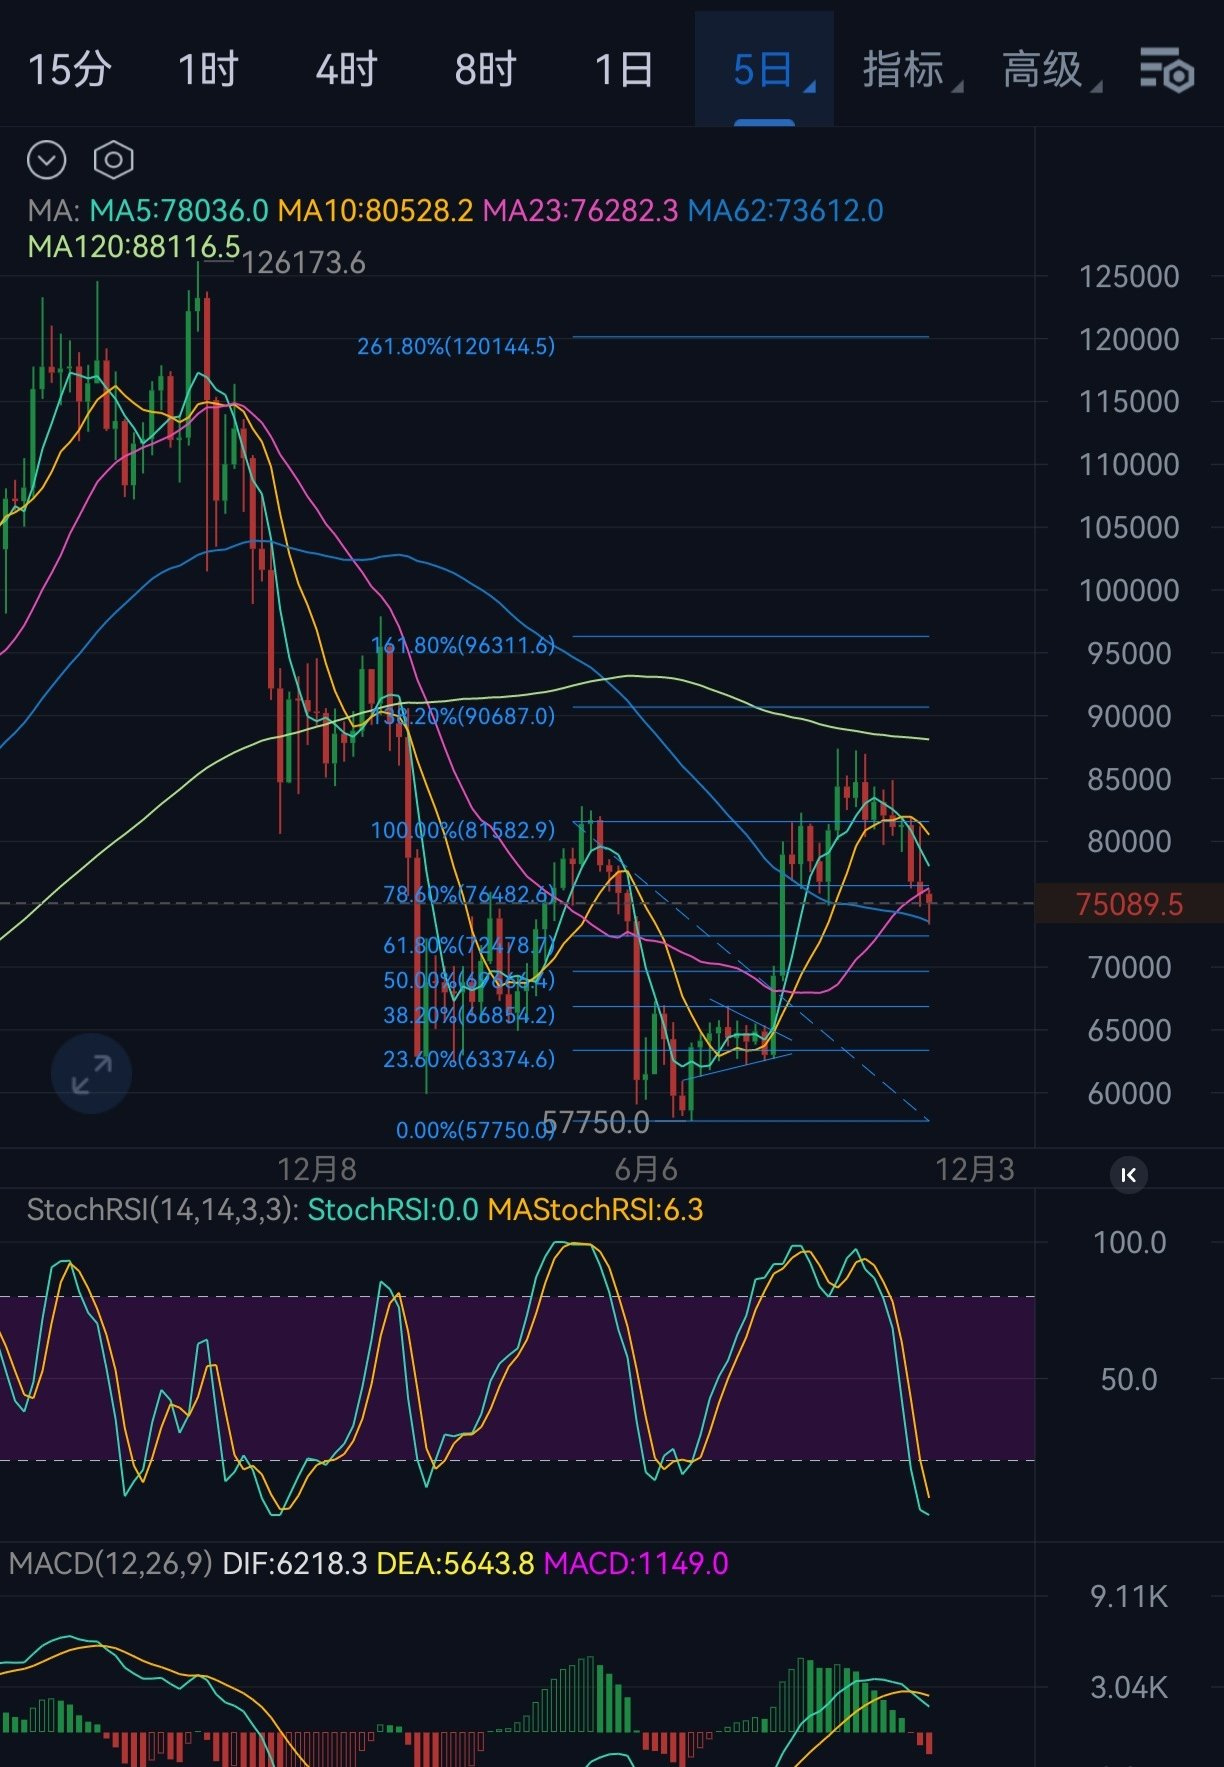
$BTC This 5-day line is due for a move. It won't stay stuck for much longer. The first leg went from 57,000 to 87,000, about 30,000 points. My guess is that the second leg will start at 75,000 and climb another 30,000 points to around 105,000, followed by a period of consolidation. That's how the script goes.
{future}(BTCUSDT)
Today is all about extreme whipsaw. This morning I was too busy following the Nvidia drama, and by the time I wanted to short, the futures contract was already down nearly 2%, so I didn't chase it. Stocks were a beat behind, but oil reacted quickly, so I caught some news in the early hours and made a short-term trade.
Oil prices first fell on weekend impeachment news and Trump's comment that he wouldn't strike if negotiations were possible. Then, in the early hours, Al Jazeera reported that the US and Iran had reached a consensus on the nuclear issue, that the US had unfrozen some funds, and that Iran had opened the Strait of Hormuz. Brent nearly broke below $90, and the funding rate for shorts surged too. Then Trump added that he was still prepared to use force if necessary, and oil prices bounced right back. As soon as I saw the statement, I closed all my short positions, avoiding the high funding fees, and continued to wait for an opportunity.
$BTC This 5-day line is due for a move. It won't stay stuck for much longer. The first leg went from 57,000 to 87,000, about 30,000 points. My guess is that the second leg will start at 75,000 and climb another 30,000 points to around 105,000, followed by a period of consolidation. That's how the script goes.
Oil prices first fell on weekend impeachment news and Trump's comment that he wouldn't strike if negotiations were possible. Then, in the early hours, Al Jazeera reported that the US and Iran had reached a consensus on the nuclear issue, that the US had unfrozen some funds, and that Iran had opened the Strait of Hormuz. Brent nearly broke below $90, and the funding rate for shorts surged too. Then Trump added that he was still prepared to use force if necessary, and oil prices bounced right back. As soon as I saw the statement, I closed all my short positions, avoiding the high funding fees, and continued to wait for an opportunity.
$BTC This 5-day line is due for a move. It won't stay stuck for much longer. The first leg went from 57,000 to 87,000, about 30,000 points. My guess is that the second leg will start at 75,000 and climb another 30,000 points to around 105,000, followed by a period of consolidation. That's how the script goes.
73
Log in to explore more content
Join global crypto users on Binance Square
⚡️ Get latest and useful information about crypto.
💬 Trusted by the world’s largest crypto exchange.
👍 Discover real insights from verified creators.
Email / Phone number
Trending Topics
IsAnthropic’s$1.5TMarketCapJustified?
36,554 views
195 Discussing
Anthropic Set to Open at $105 in Record Nasdaq Debut
Binance News
·15 Likes
·17.8k views
BTCBelow$62KAmidHikeFearsAndShiftToAnthropic
2,248 views
34 Discussing
NvidiaBoardReportedlySplitOverHuang’sReturn
171,819 views
1,430 Discussing