
Bhandari Pitambar
2.5k Posts

Bhandari Pitambar
Report
Block User
Open Trade

PEPE Holder
Frequent Trader
1.2 Years
2.2K+ Following
601 Followers
233 Liked
Posts
Portfolio
All
Videos
Live
Article
ADA/USDT Market Analysis (15m Chart + Overall Market)What your chart shows:
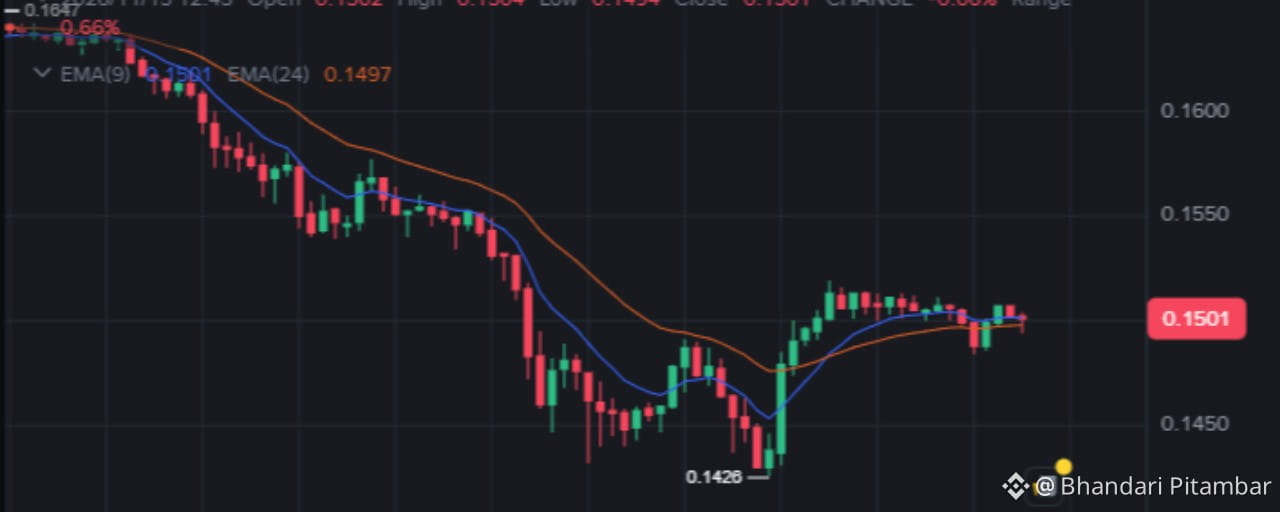
Price: $0.1501 — after a heavy decline from 0.1647, price bottomed at 0.1426, then V-shaped bounced to ~0.1520, and is now consolidating in a tight 0.1495–0.1510 rangeEMA(9) ≈ 0.1501 and EMA(24) = 0.1497 — price is stuck right at/above both EMAs, meaning the short-term decline has paused but direction is still undecidedRSI(6) = 49.90 — perfectly neutral. Neither oversold nor overbought — the market is waiting for a breakout
The bigger picture (what matters):
ADA is down -10.29% in 24h and -34.98% over 30 days — even weaker performance than BNBThe whole market is crashing: Bitcoin below $69K, and the Fear & Greed Index has fallen to 12/100 (Extreme Fear)Whale selling: wallets holding 10M–100M ADA reportedly sold ~50 million ADA between Nov 4–10 — a negative signal for the near termFounder Charles Hoskinson's remarks that "the roadmap is complete, my role is done" have left holders frustrated and dented confidenceTechnically, ADA is considered bearish below $0.20, and the $0.1820 support has already brokenSome analysts have warned price could slide toward $0.14 within November
Pump or Dump now? — Both scenarios:
🟢 Pump (bounce) scenario:
If 0.1490–0.1497 (EMA24 zone) holds and 0.1520 breaks with volume → 0.1550, then a relief rally toward 0.1600 is possibleOnly a reclaim of 0.1647 (the chart's old breakdown point) would signal a genuine structure changeBut this is most likely just an oversold bounce — it won't sustain unless BTC stabilizes
🔴 Dump (decline) scenario (higher probability, trend-wise):
If 0.1490 breaks → 0.1450, then a retest of 0.1426 (the chart low)If 0.1426 fails → the 0.1400 psychological level, and beyond that the path opens toward 0.135–0.13, as analysts have warnedThe -35% 30-day decline and ongoing whale selling keep the downside risk alive
My conclusion:
Short term, expect a 0.1426–0.1520 range, but the overall trend is clearly bearish. ADA is currently weaker than the broader market (relative weakness), so bounces are likely to meet selling pressure quickly. Confirmation of a "pump" requires a strong-volume close above 0.1520; until then, this is likely just a temporary pause within the decline. If scalping, only do so with a stop-loss near 0.1426, and exit immediately if 0.1426 breaks.
{future}(ADAUSDT)
ADA/USDT Market Analysis (15m Chart + Overall Market)
What your chart shows:
Price: $0.1501 — after a heavy decline from 0.1647, price bottomed at 0.1426, then V-shaped bounced to ~0.1520, and is now consolidating in a tight 0.1495–0.1510 rangeEMA(9) ≈ 0.1501 and EMA(24) = 0.1497 — price is stuck right at/above both EMAs, meaning the short-term decline has paused but direction is still undecidedRSI(6) = 49.90 — perfectly neutral. Neither oversold nor overbought — the market is waiting for a breakout
The bigger picture (what matters):
ADA is down -10.29% in 24h and -34.98% over 30 days — even weaker performance than BNBThe whole market is crashing: Bitcoin below $69K, and the Fear & Greed Index has fallen to 12/100 (Extreme Fear)Whale selling: wallets holding 10M–100M ADA reportedly sold ~50 million ADA between Nov 4–10 — a negative signal for the near termFounder Charles Hoskinson's remarks that "the roadmap is complete, my role is done" have left holders frustrated and dented confidenceTechnically, ADA is considered bearish below $0.20, and the $0.1820 support has already brokenSome analysts have warned price could slide toward $0.14 within November
Pump or Dump now? — Both scenarios:
🟢 Pump (bounce) scenario:
If 0.1490–0.1497 (EMA24 zone) holds and 0.1520 breaks with volume → 0.1550, then a relief rally toward 0.1600 is possibleOnly a reclaim of 0.1647 (the chart's old breakdown point) would signal a genuine structure changeBut this is most likely just an oversold bounce — it won't sustain unless BTC stabilizes
🔴 Dump (decline) scenario (higher probability, trend-wise):
If 0.1490 breaks → 0.1450, then a retest of 0.1426 (the chart low)If 0.1426 fails → the 0.1400 psychological level, and beyond that the path opens toward 0.135–0.13, as analysts have warnedThe -35% 30-day decline and ongoing whale selling keep the downside risk alive
My conclusion:
Short term, expect a 0.1426–0.1520 range, but the overall trend is clearly bearish. ADA is currently weaker than the broader market (relative weakness), so bounces are likely to meet selling pressure quickly. Confirmation of a "pump" requires a strong-volume close above 0.1520; until then, this is likely just a temporary pause within the decline. If scalping, only do so with a stop-loss near 0.1426, and exit immediately if 0.1426 breaks.
Price: $0.1501 — after a heavy decline from 0.1647, price bottomed at 0.1426, then V-shaped bounced to ~0.1520, and is now consolidating in a tight 0.1495–0.1510 rangeEMA(9) ≈ 0.1501 and EMA(24) = 0.1497 — price is stuck right at/above both EMAs, meaning the short-term decline has paused but direction is still undecidedRSI(6) = 49.90 — perfectly neutral. Neither oversold nor overbought — the market is waiting for a breakout
The bigger picture (what matters):
ADA is down -10.29% in 24h and -34.98% over 30 days — even weaker performance than BNBThe whole market is crashing: Bitcoin below $69K, and the Fear & Greed Index has fallen to 12/100 (Extreme Fear)Whale selling: wallets holding 10M–100M ADA reportedly sold ~50 million ADA between Nov 4–10 — a negative signal for the near termFounder Charles Hoskinson's remarks that "the roadmap is complete, my role is done" have left holders frustrated and dented confidenceTechnically, ADA is considered bearish below $0.20, and the $0.1820 support has already brokenSome analysts have warned price could slide toward $0.14 within November
Pump or Dump now? — Both scenarios:
🟢 Pump (bounce) scenario:
If 0.1490–0.1497 (EMA24 zone) holds and 0.1520 breaks with volume → 0.1550, then a relief rally toward 0.1600 is possibleOnly a reclaim of 0.1647 (the chart's old breakdown point) would signal a genuine structure changeBut this is most likely just an oversold bounce — it won't sustain unless BTC stabilizes
🔴 Dump (decline) scenario (higher probability, trend-wise):
If 0.1490 breaks → 0.1450, then a retest of 0.1426 (the chart low)If 0.1426 fails → the 0.1400 psychological level, and beyond that the path opens toward 0.135–0.13, as analysts have warnedThe -35% 30-day decline and ongoing whale selling keep the downside risk alive
My conclusion:
Short term, expect a 0.1426–0.1520 range, but the overall trend is clearly bearish. ADA is currently weaker than the broader market (relative weakness), so bounces are likely to meet selling pressure quickly. Confirmation of a "pump" requires a strong-volume close above 0.1520; until then, this is likely just a temporary pause within the decline. If scalping, only do so with a stop-loss near 0.1426, and exit immediately if 0.1426 breaks.
1
1
237
Article
BNB Market Analysis (15-Minute Chart + Overall Market)What Your Chart Shows:
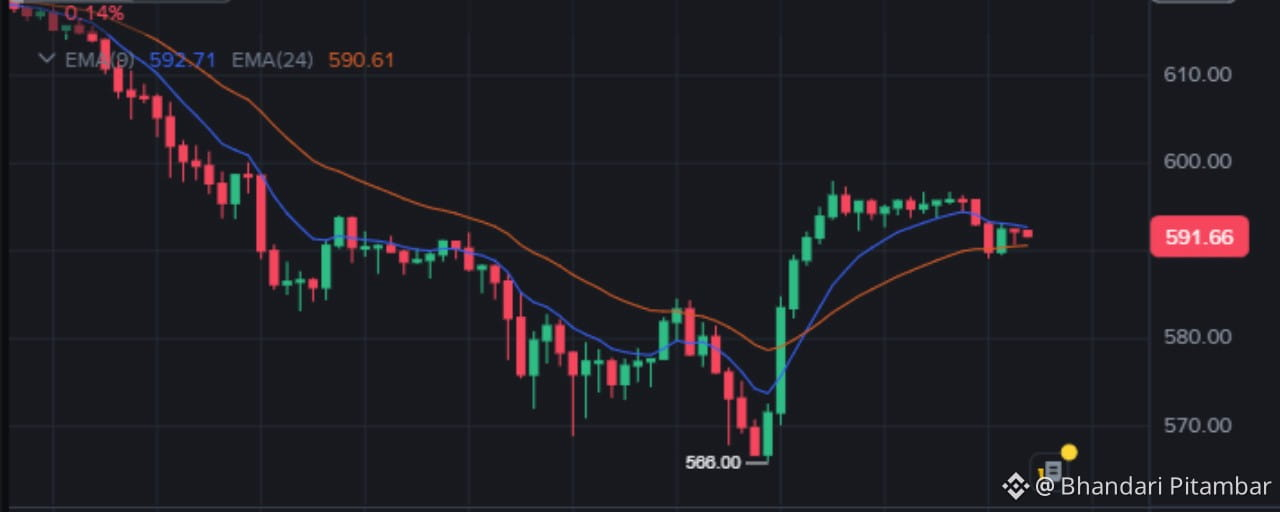
Price: 591.66 — BNB bounced sharply in a V-shape from the low of 568 to around 597. It is now pulling back and trying to stabilize.EMA(9) = 592.71 (price is below it) and EMA(24) = 590.61 (price is above it) — Price is trapped between the two EMAs, indicating that the market is looking for direction.RSI(6) = 43 — Buying momentum is slowing down, but the market is not oversold. RSI is in a neutral-to-weak zone.
Bigger Picture (Very Important):
Looking only at the 15-minute chart is not enough. On higher timeframes, BNB is in a strong downtrend.
BNB has dropped approximately 15% in 7 days, falling from around 700 to 590.This is not just a BNB problem — the entire crypto market is under pressure: Bitcoin is below 69,000, ETH is below 2,000, and approximately $1.9 billion in liquidations have occurred within 24 hours.Macroeconomic pressure: Higher-than-expected US inflation has increased fears that the Federal Reserve may raise interest rates in December. ETF outflows are also putting pressure on the market.The impact of Binance's approximately $6.4 billion hack on October 29 is still being felt. However, Binance has reportedly covered all affected assets through its SAFU fund and published its Proof of Reserves.Fear & Greed Index = 21 (Extreme Fear), and approximately 71% of accounts are holding long positions. Heavy long positioning increases the risk of further liquidations.
Pump or Dump? — Both Scenarios:
🟢 Bullish Scenario (Pump):
If the 588–590 support zone (EMA24) holds and BNB breaks above 595–597 with strong volume, the next targets could be:600–605610–613 (potential relief rally)The daily RSI was around 28 (oversold), so there is room for a bounce.However, the rally may not last unless BTC also stabilizes and starts recovering.
🔴 Bearish Scenario (Dump) — More Likely According to the Current Trend:
If the price drops below 588–590, BNB could retest:580 support568 (the previous chart low)If 568 also breaks, the next downside zone could be 550–558.Analysts consider $580 an important support level. Losing this level could lead to a deeper decline.
My Conclusion:
In the short term, BNB appears likely to move within the 568–600 range, but the overall trend remains bearish.
Buying the current bounce and assuming that a new pump has started would be risky.
Until BTC recovers and BNB successfully reclaims the 600+ level, this move is more likely to be an oversold relief bounce rather than the beginning of a sustained bullish trend.
If 568 holds, a short-term long scalp setup may develop, but only with strict risk management and a stop-loss around 566–567.
{future}(BTCUSDT)
{spot}(BNBUSDT)
BNB Market Analysis (15-Minute Chart + Overall Market)
What Your Chart Shows:
Price: 591.66 — BNB bounced sharply in a V-shape from the low of 568 to around 597. It is now pulling back and trying to stabilize.EMA(9) = 592.71 (price is below it) and EMA(24) = 590.61 (price is above it) — Price is trapped between the two EMAs, indicating that the market is looking for direction.RSI(6) = 43 — Buying momentum is slowing down, but the market is not oversold. RSI is in a neutral-to-weak zone.
Bigger Picture (Very Important):
Looking only at the 15-minute chart is not enough. On higher timeframes, BNB is in a strong downtrend.
BNB has dropped approximately 15% in 7 days, falling from around 700 to 590.This is not just a BNB problem — the entire crypto market is under pressure: Bitcoin is below 69,000, ETH is below 2,000, and approximately $1.9 billion in liquidations have occurred within 24 hours.Macroeconomic pressure: Higher-than-expected US inflation has increased fears that the Federal Reserve may raise interest rates in December. ETF outflows are also putting pressure on the market.The impact of Binance's approximately $6.4 billion hack on October 29 is still being felt. However, Binance has reportedly covered all affected assets through its SAFU fund and published its Proof of Reserves.Fear & Greed Index = 21 (Extreme Fear), and approximately 71% of accounts are holding long positions. Heavy long positioning increases the risk of further liquidations.
Pump or Dump? — Both Scenarios:
🟢 Bullish Scenario (Pump):
If the 588–590 support zone (EMA24) holds and BNB breaks above 595–597 with strong volume, the next targets could be:600–605610–613 (potential relief rally)The daily RSI was around 28 (oversold), so there is room for a bounce.However, the rally may not last unless BTC also stabilizes and starts recovering.
🔴 Bearish Scenario (Dump) — More Likely According to the Current Trend:
If the price drops below 588–590, BNB could retest:580 support568 (the previous chart low)If 568 also breaks, the next downside zone could be 550–558.Analysts consider $580 an important support level. Losing this level could lead to a deeper decline.
My Conclusion:
In the short term, BNB appears likely to move within the 568–600 range, but the overall trend remains bearish.
Buying the current bounce and assuming that a new pump has started would be risky.
Until BTC recovers and BNB successfully reclaims the 600+ level, this move is more likely to be an oversold relief bounce rather than the beginning of a sustained bullish trend.
If 568 holds, a short-term long scalp setup may develop, but only with strict risk management and a stop-loss around 566–567.
Price: 591.66 — BNB bounced sharply in a V-shape from the low of 568 to around 597. It is now pulling back and trying to stabilize.EMA(9) = 592.71 (price is below it) and EMA(24) = 590.61 (price is above it) — Price is trapped between the two EMAs, indicating that the market is looking for direction.RSI(6) = 43 — Buying momentum is slowing down, but the market is not oversold. RSI is in a neutral-to-weak zone.
Bigger Picture (Very Important):
Looking only at the 15-minute chart is not enough. On higher timeframes, BNB is in a strong downtrend.
BNB has dropped approximately 15% in 7 days, falling from around 700 to 590.This is not just a BNB problem — the entire crypto market is under pressure: Bitcoin is below 69,000, ETH is below 2,000, and approximately $1.9 billion in liquidations have occurred within 24 hours.Macroeconomic pressure: Higher-than-expected US inflation has increased fears that the Federal Reserve may raise interest rates in December. ETF outflows are also putting pressure on the market.The impact of Binance's approximately $6.4 billion hack on October 29 is still being felt. However, Binance has reportedly covered all affected assets through its SAFU fund and published its Proof of Reserves.Fear & Greed Index = 21 (Extreme Fear), and approximately 71% of accounts are holding long positions. Heavy long positioning increases the risk of further liquidations.
Pump or Dump? — Both Scenarios:
🟢 Bullish Scenario (Pump):
If the 588–590 support zone (EMA24) holds and BNB breaks above 595–597 with strong volume, the next targets could be:600–605610–613 (potential relief rally)The daily RSI was around 28 (oversold), so there is room for a bounce.However, the rally may not last unless BTC also stabilizes and starts recovering.
🔴 Bearish Scenario (Dump) — More Likely According to the Current Trend:
If the price drops below 588–590, BNB could retest:580 support568 (the previous chart low)If 568 also breaks, the next downside zone could be 550–558.Analysts consider $580 an important support level. Losing this level could lead to a deeper decline.
My Conclusion:
In the short term, BNB appears likely to move within the 568–600 range, but the overall trend remains bearish.
Buying the current bounce and assuming that a new pump has started would be risky.
Until BTC recovers and BNB successfully reclaims the 600+ level, this move is more likely to be an oversold relief bounce rather than the beginning of a sustained bullish trend.
If 568 holds, a short-term long scalp setup may develop, but only with strict risk management and a stop-loss around 566–567.
1
1
98
Article
BNB Market Analysis (15m Chart + Overall Market)What you can see on your chart:
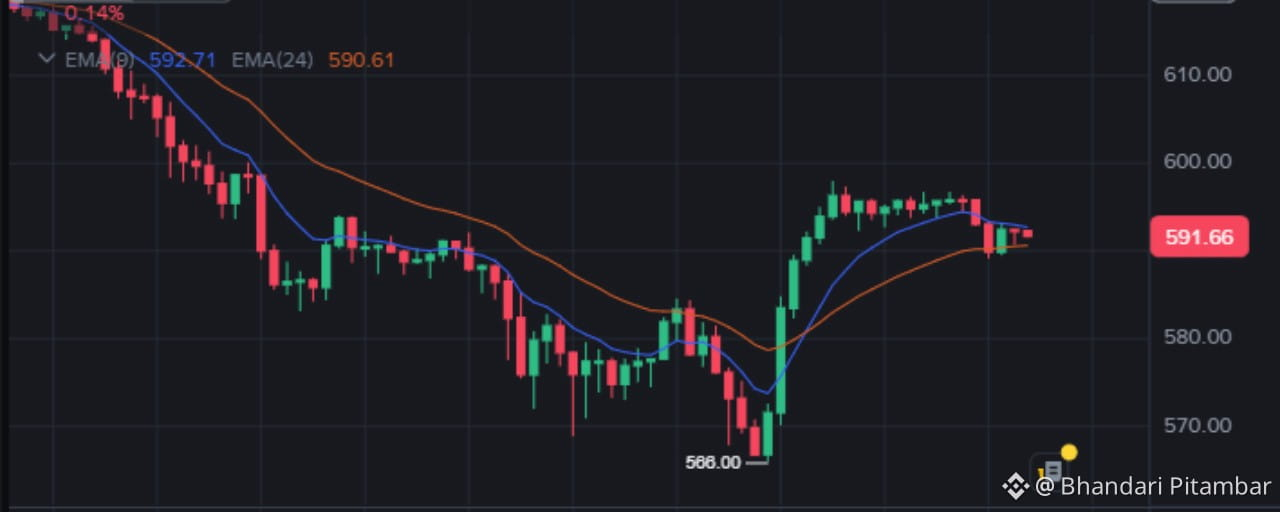
Price: 591.66 — it made a V-shaped bounce from the bottom at 568 to around 597, and has now pulled back and is consolidating
EMA(9) = 592.71 (price is below this) vs. EMA(24) = 590.61 (price is above this) — there’s a squeeze between the two EMAs, meaning the market is looking for direction
RSI(6) = 43 — the bounce momentum is cooling, but it’s not oversold. Neutral-to-weak zone
The bigger picture (this is important):
Looking only at the 15m chart isn’t enough — on the bigger timeframe, BNB is in a strong downtrend:
BNB Market Analysis (15m Chart + Overall Market)
What you can see on your chart:
Price: 591.66 — it made a V-shaped bounce from the bottom at 568 to around 597, and has now pulled back and is consolidating
EMA(9) = 592.71 (price is below this) vs. EMA(24) = 590.61 (price is above this) — there’s a squeeze between the two EMAs, meaning the market is looking for direction
RSI(6) = 43 — the bounce momentum is cooling, but it’s not oversold. Neutral-to-weak zone
The bigger picture (this is important):
Looking only at the 15m chart isn’t enough — on the bigger timeframe, BNB is in a strong downtrend:
Price: 591.66 — it made a V-shaped bounce from the bottom at 568 to around 597, and has now pulled back and is consolidating
EMA(9) = 592.71 (price is below this) vs. EMA(24) = 590.61 (price is above this) — there’s a squeeze between the two EMAs, meaning the market is looking for direction
RSI(6) = 43 — the bounce momentum is cooling, but it’s not oversold. Neutral-to-weak zone
The bigger picture (this is important):
Looking only at the 15m chart isn’t enough — on the bigger timeframe, BNB is in a strong downtrend:
1
1
66
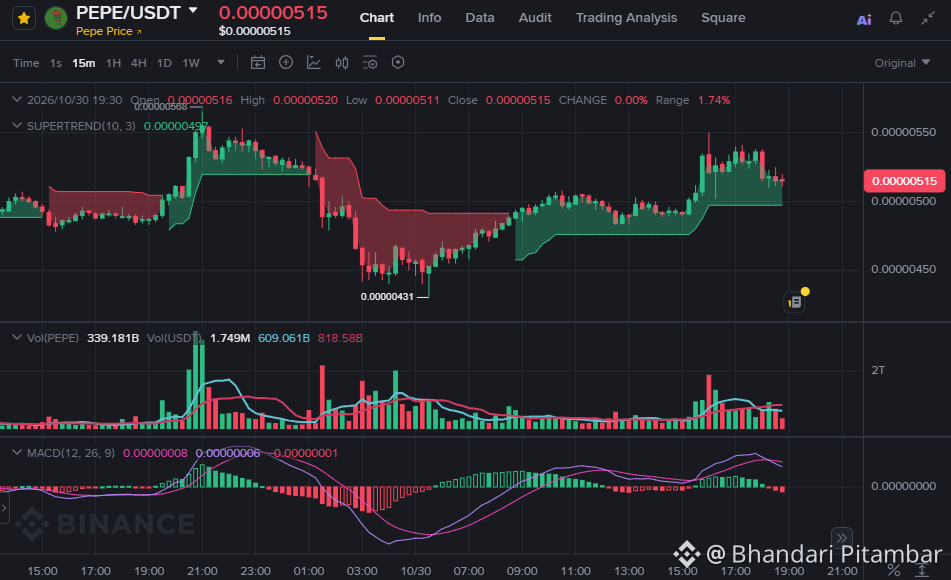
Looking at the PEPE/USDT chart right now the price is moving around 0.00000517 USDT. Last 24 hour price increased by about +6.38% and now there seems to be some correction till the 24 hour high price reached 0.00000568.
Now whether the market will rise or fall depends on technical indicators:
1. Bullish Signals:
The chart is currently seeing a support zone at 0.00000497 using the SUPERTREND (10, 3) indicator. As long as the price remains above this support level, the market is considered to be in the positive (bullish) zone and there is a possibility of going higher again.
2. Possibility of decrease or correction:
The price has recently reached a new low at (0.00000568), some time there may be a further support test in the market due to Profit Booking.
What should you do?
Now, if you are looking for money, then spend all your money at once.
If the price still bottoms out and settles in the support zone (around 0.00000500), the DCA (piece by piece par) risk becomes less.
(Note: This is not a financial advice. Since the crypto market is high risk, do your own research before taking the decision.)
{spot}(PEPEUSDT)
Looking at the PEPE/USDT chart right now the price is moving around 0.00000517 USDT. Last 24 hour price increased by about +6.38% and now there seems to be some correction till the 24 hour high price reached 0.00000568.
Now whether the market will rise or fall depends on technical indicators:
1. Bullish Signals:
The chart is currently seeing a support zone at 0.00000497 using the SUPERTREND (10, 3) indicator. As long as the price remains above this support level, the market is considered to be in the positive (bullish) zone and there is a possibility of going higher again.
2. Possibility of decrease or correction:
The price has recently reached a new low at (0.00000568), some time there may be a further support test in the market due to Profit Booking.
What should you do?
Now, if you are looking for money, then spend all your money at once.
If the price still bottoms out and settles in the support zone (around 0.00000500), the DCA (piece by piece par) risk becomes less.
(Note: This is not a financial advice. Since the crypto market is high risk, do your own research before taking the decision.)
Now whether the market will rise or fall depends on technical indicators:
1. Bullish Signals:
The chart is currently seeing a support zone at 0.00000497 using the SUPERTREND (10, 3) indicator. As long as the price remains above this support level, the market is considered to be in the positive (bullish) zone and there is a possibility of going higher again.
2. Possibility of decrease or correction:
The price has recently reached a new low at (0.00000568), some time there may be a further support test in the market due to Profit Booking.
What should you do?
Now, if you are looking for money, then spend all your money at once.
If the price still bottoms out and settles in the support zone (around 0.00000500), the DCA (piece by piece par) risk becomes less.
(Note: This is not a financial advice. Since the crypto market is high risk, do your own research before taking the decision.)
66
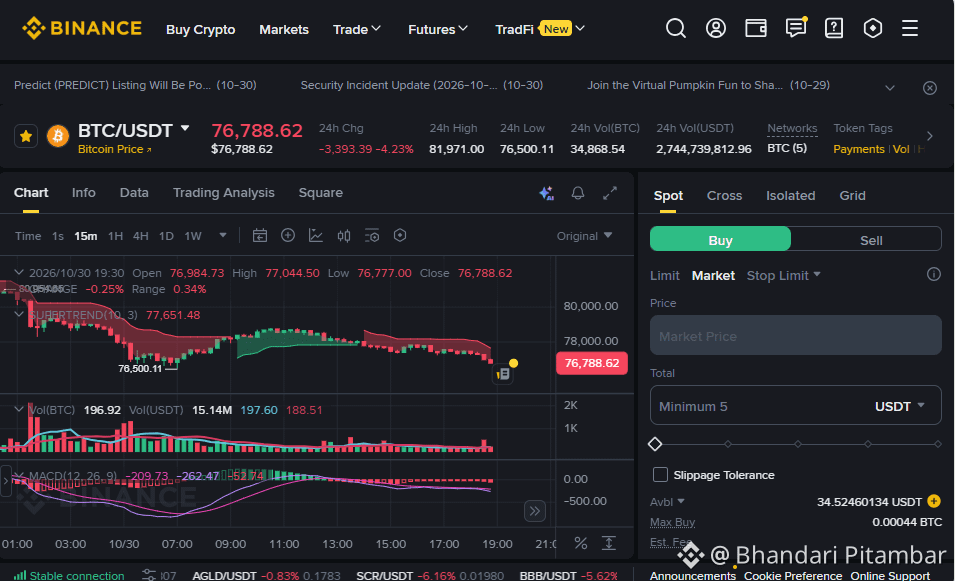
Current Chart State and Market Critical Herd Analysis of rare market decline or aging Yes Type F:
1. Pressure to decrease or correct the price (bearish pressure)
Recent chart: Bitcoin price is currently at $76,650 per trade.
Indicators: The Supertrend line on the 15-minute chart remains in the negative zone for the short-term stock price ($77,624). This indicates that in the short term, the pressure on short-term creditor-buyer sellers may remain high and the price may bottom out for some time or settle sideways (Uta Range).
2. How rare is the market to grow?
Support Level: 24-hour all-time low point (low) near $76,500. If the price takes important support, the price may bounce back.
Bholum: Halko Business Cash Body High ($2.74 Billion) Reko Chh, Jasle Thulo Dosima Kinbech Bharekhsho Sounch.
conclusion:
Short-term provisional reports indicate satellite growth. If the $76,500 support level remains intact then the market will remain stable, and at this point the bottom price will remain at the lowest level.
The crypto market is extremely volatile and any predictions regarding its risk appetite are necessary.
{spot}(BTCUSDT)
Current Chart State and Market Critical Herd Analysis of rare market decline or aging Yes Type F:
1. Pressure to decrease or correct the price (bearish pressure)
Recent chart: Bitcoin price is currently at $76,650 per trade.
Indicators: The Supertrend line on the 15-minute chart remains in the negative zone for the short-term stock price ($77,624). This indicates that in the short term, the pressure on short-term creditor-buyer sellers may remain high and the price may bottom out for some time or settle sideways (Uta Range).
2. How rare is the market to grow?
Support Level: 24-hour all-time low point (low) near $76,500. If the price takes important support, the price may bounce back.
Bholum: Halko Business Cash Body High ($2.74 Billion) Reko Chh, Jasle Thulo Dosima Kinbech Bharekhsho Sounch.
conclusion:
Short-term provisional reports indicate satellite growth. If the $76,500 support level remains intact then the market will remain stable, and at this point the bottom price will remain at the lowest level.
The crypto market is extremely volatile and any predictions regarding its risk appetite are necessary.
1. Pressure to decrease or correct the price (bearish pressure)
Recent chart: Bitcoin price is currently at $76,650 per trade.
Indicators: The Supertrend line on the 15-minute chart remains in the negative zone for the short-term stock price ($77,624). This indicates that in the short term, the pressure on short-term creditor-buyer sellers may remain high and the price may bottom out for some time or settle sideways (Uta Range).
2. How rare is the market to grow?
Support Level: 24-hour all-time low point (low) near $76,500. If the price takes important support, the price may bounce back.
Bholum: Halko Business Cash Body High ($2.74 Billion) Reko Chh, Jasle Thulo Dosima Kinbech Bharekhsho Sounch.
conclusion:
Short-term provisional reports indicate satellite growth. If the $76,500 support level remains intact then the market will remain stable, and at this point the bottom price will remain at the lowest level.
The crypto market is extremely volatile and any predictions regarding its risk appetite are necessary.
79
you are the girl of the garden
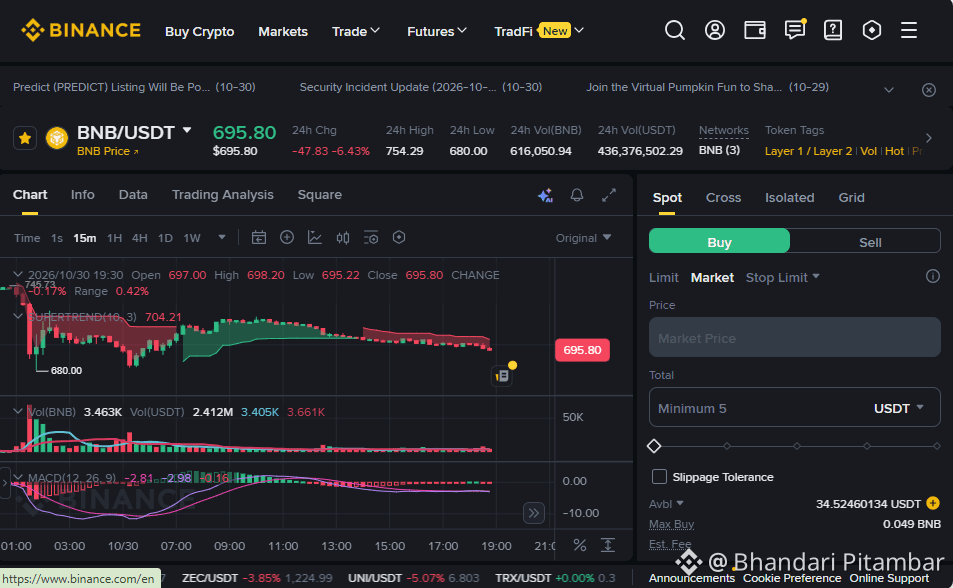
Looking at the current market situation and technical indicators, selling pressure and bearish trend are clearly visible in the market. Its main reasons are mentioned below:
Price Drop: BNB price 24 hours down 6.20% to 697.39 USDT (24 hours high price 754.29 USDT).
Supertrend: Current price is at 697.39 while Supertrend indicator is at 706.35. A price below this line indicates the continuation of a short-term downtrend.
MACD indicator: The MACD line is in the negative zone (-2.76 and -2.78), which shows that sellers are dominating the market and there is less possibility of a big upswing in the near future.
Impact on the overall market: Other major cryptocurrencies including Bitcoin (-3.69%) and Ethereum (-4.08%) are also trading down overnight.
conclusion:
Technically, the market is currently under pressure and may go down for some time in the short term or there may be fluctuations around this. To know when the market reverses, it has to cross the major resistance line.
Warning: Due to the highly volatile nature of the cryptocurrency market, you should only take decisions while investing or trading keeping your risk management in mind.
{spot}(BNBUSDT)
you are the girl of the garden
Looking at the current market situation and technical indicators, selling pressure and bearish trend are clearly visible in the market. Its main reasons are mentioned below:
Price Drop: BNB price 24 hours down 6.20% to 697.39 USDT (24 hours high price 754.29 USDT).
Supertrend: Current price is at 697.39 while Supertrend indicator is at 706.35. A price below this line indicates the continuation of a short-term downtrend.
MACD indicator: The MACD line is in the negative zone (-2.76 and -2.78), which shows that sellers are dominating the market and there is less possibility of a big upswing in the near future.
Impact on the overall market: Other major cryptocurrencies including Bitcoin (-3.69%) and Ethereum (-4.08%) are also trading down overnight.
conclusion:
Technically, the market is currently under pressure and may go down for some time in the short term or there may be fluctuations around this. To know when the market reverses, it has to cross the major resistance line.
Warning: Due to the highly volatile nature of the cryptocurrency market, you should only take decisions while investing or trading keeping your risk management in mind.
Looking at the current market situation and technical indicators, selling pressure and bearish trend are clearly visible in the market. Its main reasons are mentioned below:
Price Drop: BNB price 24 hours down 6.20% to 697.39 USDT (24 hours high price 754.29 USDT).
Supertrend: Current price is at 697.39 while Supertrend indicator is at 706.35. A price below this line indicates the continuation of a short-term downtrend.
MACD indicator: The MACD line is in the negative zone (-2.76 and -2.78), which shows that sellers are dominating the market and there is less possibility of a big upswing in the near future.
Impact on the overall market: Other major cryptocurrencies including Bitcoin (-3.69%) and Ethereum (-4.08%) are also trading down overnight.
conclusion:
Technically, the market is currently under pressure and may go down for some time in the short term or there may be fluctuations around this. To know when the market reverses, it has to cross the major resistance line.
Warning: Due to the highly volatile nature of the cryptocurrency market, you should only take decisions while investing or trading keeping your risk management in mind.
91
🎙️ 🎉The raging bull market of 2026 is here—the rally has begun, and all the action is on BSC!! On November 1, Elon Musk will celebrate the birthday of Marvin, the Mars dog. Don’t miss this on-chain rally!
End
02 h 03 m 35 s
2.5k
8
34

Article
Bitcoin Market Today: Up or Down?Bitcoin Market Today: Up or Down?
Short Answer:
The market is slightly bearish to neutral today, with no clear uptrend.
Real Price Context:
Bitcoin is trading in a range of around $66,000–$70,000, after recently failing to sustain highs such as $75,000+.
1. Market Structure: Not Trending—Stuck.
Bitcoin is not trending strongly right now. It is stuck in a range:
Support: $60,000–$66,000
Resistance: $72,000–$75,000
What this really means:
This is a decision zone, not a bullish breakout phase.
Reality Check:
If BTC were truly bullish, it would already be above $75,000. This is not the case.
2. Short-Term Direction: Bearish Pressure Prevails
Recent data shows:
BTC down ~4–5% this week
Strong liquidation of long positions (over $400M)
Option expiry manipulation pushed the price down (“max pain”)
Meaning:
This is classic short-term bearish control.
Not a panic-level crash—but sellers are currently outweighing buyers.
3. Macro Reality: Crypto Is Not Independent
Many traders believe Bitcoin moves independently. This is wrong.
Current Macro Pressures:
Geopolitical tensions → risk-off sentiment
Strong USD → capital flows from crypto
Rising energy costs → mining pressure
Important Information:
Bitcoin is behaving like a risk asset (like stocks)—not digital gold.
4. Miner Behavior: A Hidden Bearish Signal
This is something most retail traders overlook.
Mining Cost ≈ $80,000–$88,000 per BTC
Market Price ≈ $66,000–$70,000
What happens when miners lose money?
They sell Bitcoin to survive → increase supply → push the price down.
This is called:
Miner Giving Up
And it's already happening.
5. Liquidity and Institutional Flow
Bitcoin is trapped by a balance of these forces:
Bullish:
ETF demand
Long accumulation
Bearish:
Profit-taking
Weak liquidity
Institutional cash rotation
Net result:
→ Market turns sideways + volatile
6. Technical reality: No confirmation of a bull run
Even if the price rebounds:
It's still below strong resistance
Momentum is weak and inconsistent
Rally attempts are being sold
Key levels to watch:
Above $75,000 → Bullish continuation
Below $65,000 → Bearish breakdown
Right now:
→ We're in the middle (uncertain zone)
7. Psychology: This is a trap phase
This is where most traders lose money.
Why?
Because the market is:
Not clearly bullish
Not clearly bearish
This creates:
Fake breakouts, fake dips, emotional trading
Final Verdict (Honest Market Truth)
Today, Bitcoin is:
Not bullish
Not crashing
Controlled, manipulated, and range-bound
Real Direction:
→ Short-term: Slight downside/bearish bias
→ Mid-term: Neutral consolidation
→ Long-term: Still structurally bullish (but not currently active)
Practical Trading Insight
Instead of guessing direction:
Smart traders wait for breakout confirmation
Professionals trade in the range (support → resistance)
Example:
Buy near $60,000–$65,000
Sell near $72,000–$75,000
Between Anything in = Low Edge
#BTC走势分析
$BTC
{spot}(BTCUSDT)
Bitcoin Market Today: Up or Down?
Bitcoin Market Today: Up or Down?
Short Answer:
The market is slightly bearish to neutral today, with no clear uptrend.
Real Price Context:
Bitcoin is trading in a range of around $66,000–$70,000, after recently failing to sustain highs such as $75,000+.
1. Market Structure: Not Trending—Stuck.
Bitcoin is not trending strongly right now. It is stuck in a range:
Support: $60,000–$66,000
Resistance: $72,000–$75,000
What this really means:
This is a decision zone, not a bullish breakout phase.
Reality Check:
If BTC were truly bullish, it would already be above $75,000. This is not the case.
2. Short-Term Direction: Bearish Pressure Prevails
Recent data shows:
BTC down ~4–5% this week
Strong liquidation of long positions (over $400M)
Option expiry manipulation pushed the price down (“max pain”)
Meaning:
This is classic short-term bearish control.
Not a panic-level crash—but sellers are currently outweighing buyers.
3. Macro Reality: Crypto Is Not Independent
Many traders believe Bitcoin moves independently. This is wrong.
Current Macro Pressures:
Geopolitical tensions → risk-off sentiment
Strong USD → capital flows from crypto
Rising energy costs → mining pressure
Important Information:
Bitcoin is behaving like a risk asset (like stocks)—not digital gold.
4. Miner Behavior: A Hidden Bearish Signal
This is something most retail traders overlook.
Mining Cost ≈ $80,000–$88,000 per BTC
Market Price ≈ $66,000–$70,000
What happens when miners lose money?
They sell Bitcoin to survive → increase supply → push the price down.
This is called:
Miner Giving Up
And it's already happening.
5. Liquidity and Institutional Flow
Bitcoin is trapped by a balance of these forces:
Bullish:
ETF demand
Long accumulation
Bearish:
Profit-taking
Weak liquidity
Institutional cash rotation
Net result:
→ Market turns sideways + volatile
6. Technical reality: No confirmation of a bull run
Even if the price rebounds:
It's still below strong resistance
Momentum is weak and inconsistent
Rally attempts are being sold
Key levels to watch:
Above $75,000 → Bullish continuation
Below $65,000 → Bearish breakdown
Right now:
→ We're in the middle (uncertain zone)
7. Psychology: This is a trap phase
This is where most traders lose money.
Why?
Because the market is:
Not clearly bullish
Not clearly bearish
This creates:
Fake breakouts, fake dips, emotional trading
Final Verdict (Honest Market Truth)
Today, Bitcoin is:
Not bullish
Not crashing
Controlled, manipulated, and range-bound
Real Direction:
→ Short-term: Slight downside/bearish bias
→ Mid-term: Neutral consolidation
→ Long-term: Still structurally bullish (but not currently active)
Practical Trading Insight
Instead of guessing direction:
Smart traders wait for breakout confirmation
Professionals trade in the range (support → resistance)
Example:
Buy near $60,000–$65,000
Sell near $72,000–$75,000
Between Anything in = Low Edge
#BTC走势分析
$BTC
Short Answer:
The market is slightly bearish to neutral today, with no clear uptrend.
Real Price Context:
Bitcoin is trading in a range of around $66,000–$70,000, after recently failing to sustain highs such as $75,000+.
1. Market Structure: Not Trending—Stuck.
Bitcoin is not trending strongly right now. It is stuck in a range:
Support: $60,000–$66,000
Resistance: $72,000–$75,000
What this really means:
This is a decision zone, not a bullish breakout phase.
Reality Check:
If BTC were truly bullish, it would already be above $75,000. This is not the case.
2. Short-Term Direction: Bearish Pressure Prevails
Recent data shows:
BTC down ~4–5% this week
Strong liquidation of long positions (over $400M)
Option expiry manipulation pushed the price down (“max pain”)
Meaning:
This is classic short-term bearish control.
Not a panic-level crash—but sellers are currently outweighing buyers.
3. Macro Reality: Crypto Is Not Independent
Many traders believe Bitcoin moves independently. This is wrong.
Current Macro Pressures:
Geopolitical tensions → risk-off sentiment
Strong USD → capital flows from crypto
Rising energy costs → mining pressure
Important Information:
Bitcoin is behaving like a risk asset (like stocks)—not digital gold.
4. Miner Behavior: A Hidden Bearish Signal
This is something most retail traders overlook.
Mining Cost ≈ $80,000–$88,000 per BTC
Market Price ≈ $66,000–$70,000
What happens when miners lose money?
They sell Bitcoin to survive → increase supply → push the price down.
This is called:
Miner Giving Up
And it's already happening.
5. Liquidity and Institutional Flow
Bitcoin is trapped by a balance of these forces:
Bullish:
ETF demand
Long accumulation
Bearish:
Profit-taking
Weak liquidity
Institutional cash rotation
Net result:
→ Market turns sideways + volatile
6. Technical reality: No confirmation of a bull run
Even if the price rebounds:
It's still below strong resistance
Momentum is weak and inconsistent
Rally attempts are being sold
Key levels to watch:
Above $75,000 → Bullish continuation
Below $65,000 → Bearish breakdown
Right now:
→ We're in the middle (uncertain zone)
7. Psychology: This is a trap phase
This is where most traders lose money.
Why?
Because the market is:
Not clearly bullish
Not clearly bearish
This creates:
Fake breakouts, fake dips, emotional trading
Final Verdict (Honest Market Truth)
Today, Bitcoin is:
Not bullish
Not crashing
Controlled, manipulated, and range-bound
Real Direction:
→ Short-term: Slight downside/bearish bias
→ Mid-term: Neutral consolidation
→ Long-term: Still structurally bullish (but not currently active)
Practical Trading Insight
Instead of guessing direction:
Smart traders wait for breakout confirmation
Professionals trade in the range (support → resistance)
Example:
Buy near $60,000–$65,000
Sell near $72,000–$75,000
Between Anything in = Low Edge
#BTC走势分析
$BTC
2
1
2
270

Article
BNB Market Today: Up or Down?1. Current Facts (Not Hype)
Based on the latest data, BNB is trading slightly down or sideways today.
Price Range: ~$630–$645
24H Change: Slightly Negative to Flat
Market Behavior: Low Momentum, Consolidation
Recent data shows:
A slight decline of around -0.6% to -2.8% over 24 hours
Intraday movement is tight, with no strong breakout direction
Core Insight:
This is not a trending market right now—it's in a waiting phase.
2. Market Structure: What's Really Happening
A. Trend Layer (Short-Term)
Price is stuck in a range (around $622 – $663)
Resistance: ~$660–$670
Support: ~$620
Breakout Levels:
Bullish Breakout: Above ~$663
Bearish Breakdown: Below ~$622
Reality Check:
Most traders believe “it will go up today” —
but structurally, BNB is compressing, not trending.
B. Momentum Layer
Indicators from all sources show:
RSI: Neutral
MACD: Mild Bearish Pressure
Volume: Low
Interpretation:
Buyers are not strong enough yet
Sellers are not aggressive either
This creates a sideways trap zone.
C. Market Psychology
This is the most important layer that most people overlook.
Traders are in "wait and watch" mode.
There's no strong story or catalyst today.
Smart money is slowly accumulating, not chasing.
Fact:
When the market feels "boring,"
it's usually a pre-move accumulation phase.
3. Multi-Timeframe Insight
Short-Term (Today)
Direction: Sideways to Slightly Bearish
Expectation: Fake Moves, Low Conviction
Mid-Term (1–2 Weeks)
Possible Move to the $660–$680 Zone if Breakout Holds
Big Picture
BNB Still in a Recovery Structure After Correction
Not Yet in a Full Bull Trend
4. Key Scenarios (Professional View)
Scenario 1: Bullish Breakout
If BNB Breaks $663 with Volume:
Fast Move → $680–$700 Possible
Scenario 2: Rejection (Higher Chance Today)
If Price Fails at Resistance:
Pullback → $620–$630 Zone
Scenario 3: Chop Zone (Current Reality)
Price Remains Between $630–$650
Buyers and Sellers trap both.
5. Strategic Insight (What Smart Traders Do)
Instead of guessing direction:
They wait for confirmation, not prediction.
They trade breakouts, not emotion.
They avoid fake moves with low volume.
Practical Example:
False Thinking:
“BNB will pump today.”
Professional Thinking:
“If BNB breaks $663 with volume, I go long. Otherwise, I wait.”
6. Final Verdict
BNB isn't clearly moving up or down today.
It is:
Structurewise: Neutral
Momentum: Weak
Behavior: Sideways Consolidation
Real Answer:
BNB is in a decision zone, not in a trend.
#bnb #BTC #ETH
$ETH
{spot}(ETHUSDT)
$BTC
{spot}(BTCUSDT)
$BNB
{spot}(BNBUSDT)
BNB Market Today: Up or Down?
1. Current Facts (Not Hype)
Based on the latest data, BNB is trading slightly down or sideways today.
Price Range: ~$630–$645
24H Change: Slightly Negative to Flat
Market Behavior: Low Momentum, Consolidation
Recent data shows:
A slight decline of around -0.6% to -2.8% over 24 hours
Intraday movement is tight, with no strong breakout direction
Core Insight:
This is not a trending market right now—it's in a waiting phase.
2. Market Structure: What's Really Happening
A. Trend Layer (Short-Term)
Price is stuck in a range (around $622 – $663)
Resistance: ~$660–$670
Support: ~$620
Breakout Levels:
Bullish Breakout: Above ~$663
Bearish Breakdown: Below ~$622
Reality Check:
Most traders believe “it will go up today” —
but structurally, BNB is compressing, not trending.
B. Momentum Layer
Indicators from all sources show:
RSI: Neutral
MACD: Mild Bearish Pressure
Volume: Low
Interpretation:
Buyers are not strong enough yet
Sellers are not aggressive either
This creates a sideways trap zone.
C. Market Psychology
This is the most important layer that most people overlook.
Traders are in "wait and watch" mode.
There's no strong story or catalyst today.
Smart money is slowly accumulating, not chasing.
Fact:
When the market feels "boring,"
it's usually a pre-move accumulation phase.
3. Multi-Timeframe Insight
Short-Term (Today)
Direction: Sideways to Slightly Bearish
Expectation: Fake Moves, Low Conviction
Mid-Term (1–2 Weeks)
Possible Move to the $660–$680 Zone if Breakout Holds
Big Picture
BNB Still in a Recovery Structure After Correction
Not Yet in a Full Bull Trend
4. Key Scenarios (Professional View)
Scenario 1: Bullish Breakout
If BNB Breaks $663 with Volume:
Fast Move → $680–$700 Possible
Scenario 2: Rejection (Higher Chance Today)
If Price Fails at Resistance:
Pullback → $620–$630 Zone
Scenario 3: Chop Zone (Current Reality)
Price Remains Between $630–$650
Buyers and Sellers trap both.
5. Strategic Insight (What Smart Traders Do)
Instead of guessing direction:
They wait for confirmation, not prediction.
They trade breakouts, not emotion.
They avoid fake moves with low volume.
Practical Example:
False Thinking:
“BNB will pump today.”
Professional Thinking:
“If BNB breaks $663 with volume, I go long. Otherwise, I wait.”
6. Final Verdict
BNB isn't clearly moving up or down today.
It is:
Structurewise: Neutral
Momentum: Weak
Behavior: Sideways Consolidation
Real Answer:
BNB is in a decision zone, not in a trend.
#bnb #BTC #ETH
$ETH
$BTC
$BNB
Based on the latest data, BNB is trading slightly down or sideways today.
Price Range: ~$630–$645
24H Change: Slightly Negative to Flat
Market Behavior: Low Momentum, Consolidation
Recent data shows:
A slight decline of around -0.6% to -2.8% over 24 hours
Intraday movement is tight, with no strong breakout direction
Core Insight:
This is not a trending market right now—it's in a waiting phase.
2. Market Structure: What's Really Happening
A. Trend Layer (Short-Term)
Price is stuck in a range (around $622 – $663)
Resistance: ~$660–$670
Support: ~$620
Breakout Levels:
Bullish Breakout: Above ~$663
Bearish Breakdown: Below ~$622
Reality Check:
Most traders believe “it will go up today” —
but structurally, BNB is compressing, not trending.
B. Momentum Layer
Indicators from all sources show:
RSI: Neutral
MACD: Mild Bearish Pressure
Volume: Low
Interpretation:
Buyers are not strong enough yet
Sellers are not aggressive either
This creates a sideways trap zone.
C. Market Psychology
This is the most important layer that most people overlook.
Traders are in "wait and watch" mode.
There's no strong story or catalyst today.
Smart money is slowly accumulating, not chasing.
Fact:
When the market feels "boring,"
it's usually a pre-move accumulation phase.
3. Multi-Timeframe Insight
Short-Term (Today)
Direction: Sideways to Slightly Bearish
Expectation: Fake Moves, Low Conviction
Mid-Term (1–2 Weeks)
Possible Move to the $660–$680 Zone if Breakout Holds
Big Picture
BNB Still in a Recovery Structure After Correction
Not Yet in a Full Bull Trend
4. Key Scenarios (Professional View)
Scenario 1: Bullish Breakout
If BNB Breaks $663 with Volume:
Fast Move → $680–$700 Possible
Scenario 2: Rejection (Higher Chance Today)
If Price Fails at Resistance:
Pullback → $620–$630 Zone
Scenario 3: Chop Zone (Current Reality)
Price Remains Between $630–$650
Buyers and Sellers trap both.
5. Strategic Insight (What Smart Traders Do)
Instead of guessing direction:
They wait for confirmation, not prediction.
They trade breakouts, not emotion.
They avoid fake moves with low volume.
Practical Example:
False Thinking:
“BNB will pump today.”
Professional Thinking:
“If BNB breaks $663 with volume, I go long. Otherwise, I wait.”
6. Final Verdict
BNB isn't clearly moving up or down today.
It is:
Structurewise: Neutral
Momentum: Weak
Behavior: Sideways Consolidation
Real Answer:
BNB is in a decision zone, not in a trend.
#bnb #BTC #ETH
$ETH
$BTC
$BNB
1
1
1
48

Article
Crypto Feels Quiet Today… But That’s Usually When It Gets DangerousIf you woke up today thinking the crypto market would clearly go up or down—well, it doesn't really happen that way. It's like watching the weather in the mountains. One minute it's sunny, the next it's foggy.
And today? It seems like one of those "looks calm... but something's brewing" days.
So... what are the indicators really saying?
Okay, let's look at it the way real traders do—not textbook style, just the way you feel when you look at the charts.
1. RSI (Relative Strength Index)
Right now, the RSI on most major coins is hovering in the middle. Neither overbought nor oversold.
Which basically means:
👉 No one is panicking
👉 No one is going all-in either
It's like a market that's... waiting. Watching. Breathing.
And honestly, that kind of neutral zone? Big moves usually start where they end, not where they end.
2. MACD (Momentum Indicator)
This is interesting.
We're seeing weak crossovers or flat momentum on many charts. There's no strong bullish explosion, but there's no massive bearish breakdown either.
It's like pushing a car that won't start—there's a little movement, but the ignition isn't on yet.
This tells me:
The market isn't confident yet.
And markets without confidence? They're dangerous. They deceive you.
3. Volume—The Real Truth Teller
From here, things... calm down a bit.
Volume isn't impressive. And rallies with low volume? They're promises that people don't keep.
If the price rises without volume, experienced traders start asking:
"Who's actually buying this?"
So if you see green candles today—don't blindly trust them.
4. Support and Resistance Levels
The price is near critical levels for many coins.
This is a classic tension zone:
Breakup → Quick Pump
Reject → Sharp Decline
It's literally like flipping a coin... unless you wait for confirmation (which most people don't, admittedly).
5. Market Sentiment (Emotional Side)
This part is underestimated.
Right now, sentiment feels... cautiously optimistic.
People want the market to go up.
But they've been deceived before. That's why they're hesitant.
And that hesitation? It slows down momentum.
My honest opinion (no sugarcoating)
Today doesn't look like a day with a strong trend.
It looks like this:
A setup day
A trap day
Or a fake breakout day
Yeah... not the easiest environment.
If you're trading:
You might see small moves, but expect fake signals.
Are you overtrading today? This is how people quietly lose money.
If you're holding:
Nothing special right now.
But this kind of calm often precedes volatility.
The real-life way to think about it:
It's like being at a train station...
You hear the announcement.
You see movement.
People start walking toward the platform.
But the train hasn't arrived yet.
This is the state of the market right now.
Final Thoughts
If I had to sum it up in one line:
Today isn't about winning big—it's about not getting scammed.
Be patient. Watch carefully. Let the market show its hand first.
Because when it finally runs… it won’t ask for permission.
$BLUR
{spot}(BLURUSDT)
$MOVR
{future}(MOVRUSDT)
$NOM
{spot}(NOMUSDT)
Crypto Feels Quiet Today… But That’s Usually When It Gets Dangerous
If you woke up today thinking the crypto market would clearly go up or down—well, it doesn't really happen that way. It's like watching the weather in the mountains. One minute it's sunny, the next it's foggy.
And today? It seems like one of those "looks calm... but something's brewing" days.
So... what are the indicators really saying?
Okay, let's look at it the way real traders do—not textbook style, just the way you feel when you look at the charts.
1. RSI (Relative Strength Index)
Right now, the RSI on most major coins is hovering in the middle. Neither overbought nor oversold.
Which basically means:
👉 No one is panicking
👉 No one is going all-in either
It's like a market that's... waiting. Watching. Breathing.
And honestly, that kind of neutral zone? Big moves usually start where they end, not where they end.
2. MACD (Momentum Indicator)
This is interesting.
We're seeing weak crossovers or flat momentum on many charts. There's no strong bullish explosion, but there's no massive bearish breakdown either.
It's like pushing a car that won't start—there's a little movement, but the ignition isn't on yet.
This tells me:
The market isn't confident yet.
And markets without confidence? They're dangerous. They deceive you.
3. Volume—The Real Truth Teller
From here, things... calm down a bit.
Volume isn't impressive. And rallies with low volume? They're promises that people don't keep.
If the price rises without volume, experienced traders start asking:
"Who's actually buying this?"
So if you see green candles today—don't blindly trust them.
4. Support and Resistance Levels
The price is near critical levels for many coins.
This is a classic tension zone:
Breakup → Quick Pump
Reject → Sharp Decline
It's literally like flipping a coin... unless you wait for confirmation (which most people don't, admittedly).
5. Market Sentiment (Emotional Side)
This part is underestimated.
Right now, sentiment feels... cautiously optimistic.
People want the market to go up.
But they've been deceived before. That's why they're hesitant.
And that hesitation? It slows down momentum.
My honest opinion (no sugarcoating)
Today doesn't look like a day with a strong trend.
It looks like this:
A setup day
A trap day
Or a fake breakout day
Yeah... not the easiest environment.
If you're trading:
You might see small moves, but expect fake signals.
Are you overtrading today? This is how people quietly lose money.
If you're holding:
Nothing special right now.
But this kind of calm often precedes volatility.
The real-life way to think about it:
It's like being at a train station...
You hear the announcement.
You see movement.
People start walking toward the platform.
But the train hasn't arrived yet.
This is the state of the market right now.
Final Thoughts
If I had to sum it up in one line:
Today isn't about winning big—it's about not getting scammed.
Be patient. Watch carefully. Let the market show its hand first.
Because when it finally runs… it won’t ask for permission.
$BLUR
$MOVR
$NOM
And today? It seems like one of those "looks calm... but something's brewing" days.
So... what are the indicators really saying?
Okay, let's look at it the way real traders do—not textbook style, just the way you feel when you look at the charts.
1. RSI (Relative Strength Index)
Right now, the RSI on most major coins is hovering in the middle. Neither overbought nor oversold.
Which basically means:
👉 No one is panicking
👉 No one is going all-in either
It's like a market that's... waiting. Watching. Breathing.
And honestly, that kind of neutral zone? Big moves usually start where they end, not where they end.
2. MACD (Momentum Indicator)
This is interesting.
We're seeing weak crossovers or flat momentum on many charts. There's no strong bullish explosion, but there's no massive bearish breakdown either.
It's like pushing a car that won't start—there's a little movement, but the ignition isn't on yet.
This tells me:
The market isn't confident yet.
And markets without confidence? They're dangerous. They deceive you.
3. Volume—The Real Truth Teller
From here, things... calm down a bit.
Volume isn't impressive. And rallies with low volume? They're promises that people don't keep.
If the price rises without volume, experienced traders start asking:
"Who's actually buying this?"
So if you see green candles today—don't blindly trust them.
4. Support and Resistance Levels
The price is near critical levels for many coins.
This is a classic tension zone:
Breakup → Quick Pump
Reject → Sharp Decline
It's literally like flipping a coin... unless you wait for confirmation (which most people don't, admittedly).
5. Market Sentiment (Emotional Side)
This part is underestimated.
Right now, sentiment feels... cautiously optimistic.
People want the market to go up.
But they've been deceived before. That's why they're hesitant.
And that hesitation? It slows down momentum.
My honest opinion (no sugarcoating)
Today doesn't look like a day with a strong trend.
It looks like this:
A setup day
A trap day
Or a fake breakout day
Yeah... not the easiest environment.
If you're trading:
You might see small moves, but expect fake signals.
Are you overtrading today? This is how people quietly lose money.
If you're holding:
Nothing special right now.
But this kind of calm often precedes volatility.
The real-life way to think about it:
It's like being at a train station...
You hear the announcement.
You see movement.
People start walking toward the platform.
But the train hasn't arrived yet.
This is the state of the market right now.
Final Thoughts
If I had to sum it up in one line:
Today isn't about winning big—it's about not getting scammed.
Be patient. Watch carefully. Let the market show its hand first.
Because when it finally runs… it won’t ask for permission.
$BLUR
$MOVR
$NOM
124

Article
Will NOM actually rise today?Short answer: It depends on liquidity, narrative, and timing—not hope.
Now let’s break the reality down properly so your Binance Square post stands out as expert-level, not noise.
1. Market Context First (Reality Check)
Before even touching NOM, understand this:
Crypto does not move randomly. It moves in layers:
Layer 1: Macro Flow
Bitcoin dominance rising → Altcoins (like NOM) struggle
Bitcoin ranging → Alts rotate (best case for NOM pump)
Bitcoin dumping → Everything bleeds
Layer 2: Liquidity Cycles
Asia session: often slow, setup phase
EU session: volatility starts
US session: real moves happen
Layer 3: Narrative Power
Coins don’t pump because they’re “good”
They pump because:
New listings
Influencer push
Ecosystem hype
Liquidity traps
So first challenge your assumption:
“Will NOM rise today?” is the wrong question.
Correct question:
“Is there enough liquidity + narrative + technical setup to push NOM today?”
2. Technical Structure of NOM (Intraday Thinking)
Let’s think like a smart money trader:
Scenario A: Bullish Case
NOM will rise IF:
Holding strong support (previous demand zone)
Higher lows forming on lower timeframe (5m/15m)
Volume increasing on green candles
Break of local resistance with momentum
This means:
Buyers are stepping in, not just price bouncing
Scenario B: Fake Pump (Most Common Trap)
NOM spikes quickly:
Low volume
No structure
Long wicks
This is:
Liquidity grab → whales exit → retail trapped
Scenario C: Bearish Reality
Lower highs + weak bounces
Volume decreasing
Bitcoin slightly bearish
This leads to:
Slow bleed, not dramatic crash
3. Order Flow Thinking (Advanced Edge)
Forget indicators for a second.
Ask:
Where are stop losses sitting?
Where is retail entering?
Where would whales profit?
Typical pattern:
Price consolidates
Fake breakout (retail buys)
Sharp reversal
Real move later
So if NOM already pumped recently:
→ Probability of continuation today decreases
4. Probability Model (Realistic, Not Emotional)
Let’s assign rough probabilities:
Strong bullish breakout → 25%
Fake pump / trap → 50%
Slow bleed / sideways → 25%
Why?
Because most altcoins:
Move only when liquidity is forced—not naturally
5. Key Signals to Watch TODAY
If you want to be precise, watch this:
Bullish Confirmation Checklist
BTC stable or slightly bullish
NOM breaks resistance + retests successfully
Volume spike (real, not fake)
No immediate rejection
Bearish Warning Signs
Quick spike → immediate drop
Low volume breakout
BTC showing weakness
Rejection at resistance multiple times
6. Strategic Insight (What Smart Traders Do)
Instead of predicting:
They react to confirmation
Bad trader:
“It will go up, I’ll buy now”
Smart trader:
“If it confirms strength, I enter”
This single shift:
= survival in crypto
7. Binance Square Post (Human + Relatable)
Here’s your polished post:
Title:
NOM Today: Pump Incoming or Just Another Trap?
Content:
Everyone is asking the same question right now…
“Is NOM about to pump today?”
Let’s be real for a second.
Markets don’t reward hope.
They reward patience.
Right now, NOM is sitting at a critical zone.
It’s not about direction. It’s about decision.
If buyers step in with real volume,
we could see a clean breakout.
But if this turns into a weak push…
it’s just another liquidity trap waiting to happen.
I’ve seen this too many times.
A sudden green candle.
Retail jumps in.
Then boom… reversal.
That’s not a pump.
That’s an exit for smart money.
So what am I watching?
Not predictions.
Not hype.
I’m watching:
Volume strength
Structure
Reaction at resistance
Because the truth is simple:
The market doesn’t move when you expect it.
It moves when it hurts the most people.
So don’t chase.
Let the move prove itself first.
Are you trading the move…
or reacting to emotion?
#NOM #karnel #zbt
$NOM
{spot}(NOMUSDT)
$ZBT
{spot}(ZBTUSDT)
$SKL
{spot}(SKLUSDT)
Will NOM actually rise today?
Short answer: It depends on liquidity, narrative, and timing—not hope.
Now let’s break the reality down properly so your Binance Square post stands out as expert-level, not noise.
1. Market Context First (Reality Check)
Before even touching NOM, understand this:
Crypto does not move randomly. It moves in layers:
Layer 1: Macro Flow
Bitcoin dominance rising → Altcoins (like NOM) struggle
Bitcoin ranging → Alts rotate (best case for NOM pump)
Bitcoin dumping → Everything bleeds
Layer 2: Liquidity Cycles
Asia session: often slow, setup phase
EU session: volatility starts
US session: real moves happen
Layer 3: Narrative Power
Coins don’t pump because they’re “good”
They pump because:
New listings
Influencer push
Ecosystem hype
Liquidity traps
So first challenge your assumption:
“Will NOM rise today?” is the wrong question.
Correct question:
“Is there enough liquidity + narrative + technical setup to push NOM today?”
2. Technical Structure of NOM (Intraday Thinking)
Let’s think like a smart money trader:
Scenario A: Bullish Case
NOM will rise IF:
Holding strong support (previous demand zone)
Higher lows forming on lower timeframe (5m/15m)
Volume increasing on green candles
Break of local resistance with momentum
This means:
Buyers are stepping in, not just price bouncing
Scenario B: Fake Pump (Most Common Trap)
NOM spikes quickly:
Low volume
No structure
Long wicks
This is:
Liquidity grab → whales exit → retail trapped
Scenario C: Bearish Reality
Lower highs + weak bounces
Volume decreasing
Bitcoin slightly bearish
This leads to:
Slow bleed, not dramatic crash
3. Order Flow Thinking (Advanced Edge)
Forget indicators for a second.
Ask:
Where are stop losses sitting?
Where is retail entering?
Where would whales profit?
Typical pattern:
Price consolidates
Fake breakout (retail buys)
Sharp reversal
Real move later
So if NOM already pumped recently:
→ Probability of continuation today decreases
4. Probability Model (Realistic, Not Emotional)
Let’s assign rough probabilities:
Strong bullish breakout → 25%
Fake pump / trap → 50%
Slow bleed / sideways → 25%
Why?
Because most altcoins:
Move only when liquidity is forced—not naturally
5. Key Signals to Watch TODAY
If you want to be precise, watch this:
Bullish Confirmation Checklist
BTC stable or slightly bullish
NOM breaks resistance + retests successfully
Volume spike (real, not fake)
No immediate rejection
Bearish Warning Signs
Quick spike → immediate drop
Low volume breakout
BTC showing weakness
Rejection at resistance multiple times
6. Strategic Insight (What Smart Traders Do)
Instead of predicting:
They react to confirmation
Bad trader:
“It will go up, I’ll buy now”
Smart trader:
“If it confirms strength, I enter”
This single shift:
= survival in crypto
7. Binance Square Post (Human + Relatable)
Here’s your polished post:
Title:
NOM Today: Pump Incoming or Just Another Trap?
Content:
Everyone is asking the same question right now…
“Is NOM about to pump today?”
Let’s be real for a second.
Markets don’t reward hope.
They reward patience.
Right now, NOM is sitting at a critical zone.
It’s not about direction. It’s about decision.
If buyers step in with real volume,
we could see a clean breakout.
But if this turns into a weak push…
it’s just another liquidity trap waiting to happen.
I’ve seen this too many times.
A sudden green candle.
Retail jumps in.
Then boom… reversal.
That’s not a pump.
That’s an exit for smart money.
So what am I watching?
Not predictions.
Not hype.
I’m watching:
Volume strength
Structure
Reaction at resistance
Because the truth is simple:
The market doesn’t move when you expect it.
It moves when it hurts the most people.
So don’t chase.
Let the move prove itself first.
Are you trading the move…
or reacting to emotion?
#NOM #karnel #zbt
$NOM
$ZBT
$SKL
Now let’s break the reality down properly so your Binance Square post stands out as expert-level, not noise.
1. Market Context First (Reality Check)
Before even touching NOM, understand this:
Crypto does not move randomly. It moves in layers:
Layer 1: Macro Flow
Bitcoin dominance rising → Altcoins (like NOM) struggle
Bitcoin ranging → Alts rotate (best case for NOM pump)
Bitcoin dumping → Everything bleeds
Layer 2: Liquidity Cycles
Asia session: often slow, setup phase
EU session: volatility starts
US session: real moves happen
Layer 3: Narrative Power
Coins don’t pump because they’re “good”
They pump because:
New listings
Influencer push
Ecosystem hype
Liquidity traps
So first challenge your assumption:
“Will NOM rise today?” is the wrong question.
Correct question:
“Is there enough liquidity + narrative + technical setup to push NOM today?”
2. Technical Structure of NOM (Intraday Thinking)
Let’s think like a smart money trader:
Scenario A: Bullish Case
NOM will rise IF:
Holding strong support (previous demand zone)
Higher lows forming on lower timeframe (5m/15m)
Volume increasing on green candles
Break of local resistance with momentum
This means:
Buyers are stepping in, not just price bouncing
Scenario B: Fake Pump (Most Common Trap)
NOM spikes quickly:
Low volume
No structure
Long wicks
This is:
Liquidity grab → whales exit → retail trapped
Scenario C: Bearish Reality
Lower highs + weak bounces
Volume decreasing
Bitcoin slightly bearish
This leads to:
Slow bleed, not dramatic crash
3. Order Flow Thinking (Advanced Edge)
Forget indicators for a second.
Ask:
Where are stop losses sitting?
Where is retail entering?
Where would whales profit?
Typical pattern:
Price consolidates
Fake breakout (retail buys)
Sharp reversal
Real move later
So if NOM already pumped recently:
→ Probability of continuation today decreases
4. Probability Model (Realistic, Not Emotional)
Let’s assign rough probabilities:
Strong bullish breakout → 25%
Fake pump / trap → 50%
Slow bleed / sideways → 25%
Why?
Because most altcoins:
Move only when liquidity is forced—not naturally
5. Key Signals to Watch TODAY
If you want to be precise, watch this:
Bullish Confirmation Checklist
BTC stable or slightly bullish
NOM breaks resistance + retests successfully
Volume spike (real, not fake)
No immediate rejection
Bearish Warning Signs
Quick spike → immediate drop
Low volume breakout
BTC showing weakness
Rejection at resistance multiple times
6. Strategic Insight (What Smart Traders Do)
Instead of predicting:
They react to confirmation
Bad trader:
“It will go up, I’ll buy now”
Smart trader:
“If it confirms strength, I enter”
This single shift:
= survival in crypto
7. Binance Square Post (Human + Relatable)
Here’s your polished post:
Title:
NOM Today: Pump Incoming or Just Another Trap?
Content:
Everyone is asking the same question right now…
“Is NOM about to pump today?”
Let’s be real for a second.
Markets don’t reward hope.
They reward patience.
Right now, NOM is sitting at a critical zone.
It’s not about direction. It’s about decision.
If buyers step in with real volume,
we could see a clean breakout.
But if this turns into a weak push…
it’s just another liquidity trap waiting to happen.
I’ve seen this too many times.
A sudden green candle.
Retail jumps in.
Then boom… reversal.
That’s not a pump.
That’s an exit for smart money.
So what am I watching?
Not predictions.
Not hype.
I’m watching:
Volume strength
Structure
Reaction at resistance
Because the truth is simple:
The market doesn’t move when you expect it.
It moves when it hurts the most people.
So don’t chase.
Let the move prove itself first.
Are you trading the move…
or reacting to emotion?
#NOM #karnel #zbt
$NOM
$ZBT
$SKL
142

Article
PAXG Price Today – Deep Market Reality AnalysisLet’s cut through hype and think like a trader, not a hopeful investor.
First, understand what PAX Gold (PAXG) actually is. It’s not a typical crypto—it’s a tokenized version of physical gold. That means:
Its price ≈ real gold price
Not driven by hype cycles like altcoins
Moves based on macroeconomics, not memes
So asking “Will PAXG rise today?” is really asking:
“Will gold move up today?”
1. Core Drivers That Move PAXG (Today-Level Thinking)
A. USD Strength (Critical)
Gold and USD have an inverse relationship.
If US Dollar rises → Gold falls → PAXG falls
If US Dollar falls → Gold rises → PAXG rises
Reality Check Today:
If DXY (Dollar Index) is strong → PAXG upside is limited
If DXY weakens → bullish setup
B. Interest Rates & Bond Yields
Gold doesn’t pay interest. So:
High interest rates → investors prefer bonds → gold drops
Falling rates → gold becomes attractive → price rises
Short-Term Insight:
Even a small shift in US bond yields intraday can move PAXG.
C. Risk Sentiment (Market Fear vs Greed)
This is where most traders misunderstand PAXG.
Gold = “fear asset”
Stock market crashing → gold rises
Crypto crashing → sometimes gold rises
Everything pumping → gold stagnates or drops
So check:
Is market risk-on or risk-off today?
D. Geopolitical Triggers (Sudden Moves)
Gold reacts fast to:
War headlines
Economic instability
Banking issues
If sudden news hits → PAXG spikes instantly
2. Technical Analysis Perspective (Short-Term Traders)
Let’s break it down like a pro:
Key Levels Framework
Think in zones, not exact numbers:
Support: Previous day low / consolidation zone
Resistance: Previous high / psychological levels
Intraday Signals:
Breakout above resistance → short-term bullish
Rejection at resistance → bearish pullback
Sideways range → no real move (most common case)
Liquidity Trap Reality
Most retail traders lose here.
What actually happens:
Price fake breaks up → traps buyers → drops
Price fake drops → traps sellers → pumps
PAXG is less volatile than BTC, but still follows liquidity traps.
3. Crypto Market Correlation (Often Ignored)
Even though PAXG tracks gold, it still trades on platforms like Binance.
That means:
If crypto market crashes hard → liquidity exits → PAXG can dip
If crypto pumps → capital flows to risk assets → PAXG underperforms
So:
PAXG = hybrid behavior (Gold + Crypto liquidity)
4. Real-World Scenario Analysis (Today)
Let’s simulate 3 realistic outcomes:
Scenario 1: Bullish Case
USD weakens
Stock market uncertain
Minor geopolitical tension
Result:
→ PAXG rises slowly (not explosive)
Scenario 2: Neutral Case (Most Likely)
No major news
Stable USD
Sideways market
Result:
→ PAXG stays flat (range-bound)
Scenario 3: Bearish Case
Strong USD
Rising bond yields
Risk-on sentiment
Result:
→ PAXG dips slightly
5. The Hard Truth Most People Ignore
PAXG is NOT a “fast profit” asset.
If you're expecting:
5–10% daily gains → unrealistic
Quick pump → unlikely
Instead:
It’s a capital preservation + hedge tool
Think:
PAXG = “digital gold savings”
NOT = “trading rocket”
6. Strategic Positioning (Smart Money Thinking)
When to Buy PAXG
During economic uncertainty
When crypto looks overheated
When USD shows weakness
When NOT to Buy
During strong bull runs in BTC/altcoins
When interest rates are rising sharply
7. Final Verdict (Today)
Will PAXG rise today?
Probability-based answer:
Strong rise → Low probability
Mild upward move → Possible
Sideways → Most likely
Drop → Depends on USD strength
So:
→ Expect stability, not explosion.
8. Binance Square Post (Human, Relatable Style)
Title:
PAXG Today: Slow Gold or Hidden Opportunity?
Post Content:
Let’s be real for a second.
Everyone in crypto is chasing fast gains. But PAXG doesn’t play that game.
It moves like gold. Calm. Slow. Patient.
If you’re expecting a big pump today… you might be disappointed.
But here’s the interesting part.
When the market gets uncertain… when fear starts creeping in… that’s when PAXG quietly starts moving.
Not loudly. Not dramatically. Just steadily.
Think of it like this:
Bitcoin is a sports car.
PAXG is a tank.
One is fast. The other survives.
So today?
Most likely:
PAXG stays stable. Maybe small movement.
But if something unexpected hits the market…
That’s when it wakes up.
The real question is not:
“Will it pump today?”
The real question is:
“Are you positioned before it matters?”
Advanced Insight
The biggest misconception:
People treat PAXG like a trading asset.
Smart money treats it as:
A hedge against crypto volatility
A liquidity parking zone
A macroeconomic signal
In future cycles:
Tokenized real-world assets (like PAXG) will likely grow significantly as institutions enter blockchain.
So while retail ignores it…
Institutions quietly accumulate these types of assets.
Action Plan
Step 1: Check Macro First
Look at USD index
Look at bond yields
Check global news
Step 2: Identify Market Mode
Risk-on → avoid heavy PAXG
Risk-off → consider PAXG
Step 3: Use PAXG Strategically
Store value during uncertainty
Rotate profits from crypto into PAXG
Step 4: Avoid Overtrading
Don’t expect big daily moves
Use it as a hedge, not a gamble
Step 5: Build Hybrid Portfolio
Example:
60% BTC/Altcoins
20% Stablecoins
20% PAXG (safety layer)
#PAXG #pepe #sto
$PAXG
{spot}(PAXGUSDT)
$PEPE
{spot}(PEPEUSDT)
$STO
{spot}(STOUSDT)
PAXG Price Today – Deep Market Reality Analysis
Let’s cut through hype and think like a trader, not a hopeful investor.
First, understand what PAX Gold (PAXG) actually is. It’s not a typical crypto—it’s a tokenized version of physical gold. That means:
Its price ≈ real gold price
Not driven by hype cycles like altcoins
Moves based on macroeconomics, not memes
So asking “Will PAXG rise today?” is really asking:
“Will gold move up today?”
1. Core Drivers That Move PAXG (Today-Level Thinking)
A. USD Strength (Critical)
Gold and USD have an inverse relationship.
If US Dollar rises → Gold falls → PAXG falls
If US Dollar falls → Gold rises → PAXG rises
Reality Check Today:
If DXY (Dollar Index) is strong → PAXG upside is limited
If DXY weakens → bullish setup
B. Interest Rates & Bond Yields
Gold doesn’t pay interest. So:
High interest rates → investors prefer bonds → gold drops
Falling rates → gold becomes attractive → price rises
Short-Term Insight:
Even a small shift in US bond yields intraday can move PAXG.
C. Risk Sentiment (Market Fear vs Greed)
This is where most traders misunderstand PAXG.
Gold = “fear asset”
Stock market crashing → gold rises
Crypto crashing → sometimes gold rises
Everything pumping → gold stagnates or drops
So check:
Is market risk-on or risk-off today?
D. Geopolitical Triggers (Sudden Moves)
Gold reacts fast to:
War headlines
Economic instability
Banking issues
If sudden news hits → PAXG spikes instantly
2. Technical Analysis Perspective (Short-Term Traders)
Let’s break it down like a pro:
Key Levels Framework
Think in zones, not exact numbers:
Support: Previous day low / consolidation zone
Resistance: Previous high / psychological levels
Intraday Signals:
Breakout above resistance → short-term bullish
Rejection at resistance → bearish pullback
Sideways range → no real move (most common case)
Liquidity Trap Reality
Most retail traders lose here.
What actually happens:
Price fake breaks up → traps buyers → drops
Price fake drops → traps sellers → pumps
PAXG is less volatile than BTC, but still follows liquidity traps.
3. Crypto Market Correlation (Often Ignored)
Even though PAXG tracks gold, it still trades on platforms like Binance.
That means:
If crypto market crashes hard → liquidity exits → PAXG can dip
If crypto pumps → capital flows to risk assets → PAXG underperforms
So:
PAXG = hybrid behavior (Gold + Crypto liquidity)
4. Real-World Scenario Analysis (Today)
Let’s simulate 3 realistic outcomes:
Scenario 1: Bullish Case
USD weakens
Stock market uncertain
Minor geopolitical tension
Result:
→ PAXG rises slowly (not explosive)
Scenario 2: Neutral Case (Most Likely)
No major news
Stable USD
Sideways market
Result:
→ PAXG stays flat (range-bound)
Scenario 3: Bearish Case
Strong USD
Rising bond yields
Risk-on sentiment
Result:
→ PAXG dips slightly
5. The Hard Truth Most People Ignore
PAXG is NOT a “fast profit” asset.
If you're expecting:
5–10% daily gains → unrealistic
Quick pump → unlikely
Instead:
It’s a capital preservation + hedge tool
Think:
PAXG = “digital gold savings”
NOT = “trading rocket”
6. Strategic Positioning (Smart Money Thinking)
When to Buy PAXG
During economic uncertainty
When crypto looks overheated
When USD shows weakness
When NOT to Buy
During strong bull runs in BTC/altcoins
When interest rates are rising sharply
7. Final Verdict (Today)
Will PAXG rise today?
Probability-based answer:
Strong rise → Low probability
Mild upward move → Possible
Sideways → Most likely
Drop → Depends on USD strength
So:
→ Expect stability, not explosion.
8. Binance Square Post (Human, Relatable Style)
Title:
PAXG Today: Slow Gold or Hidden Opportunity?
Post Content:
Let’s be real for a second.
Everyone in crypto is chasing fast gains. But PAXG doesn’t play that game.
It moves like gold. Calm. Slow. Patient.
If you’re expecting a big pump today… you might be disappointed.
But here’s the interesting part.
When the market gets uncertain… when fear starts creeping in… that’s when PAXG quietly starts moving.
Not loudly. Not dramatically. Just steadily.
Think of it like this:
Bitcoin is a sports car.
PAXG is a tank.
One is fast. The other survives.
So today?
Most likely:
PAXG stays stable. Maybe small movement.
But if something unexpected hits the market…
That’s when it wakes up.
The real question is not:
“Will it pump today?”
The real question is:
“Are you positioned before it matters?”
Advanced Insight
The biggest misconception:
People treat PAXG like a trading asset.
Smart money treats it as:
A hedge against crypto volatility
A liquidity parking zone
A macroeconomic signal
In future cycles:
Tokenized real-world assets (like PAXG) will likely grow significantly as institutions enter blockchain.
So while retail ignores it…
Institutions quietly accumulate these types of assets.
Action Plan
Step 1: Check Macro First
Look at USD index
Look at bond yields
Check global news
Step 2: Identify Market Mode
Risk-on → avoid heavy PAXG
Risk-off → consider PAXG
Step 3: Use PAXG Strategically
Store value during uncertainty
Rotate profits from crypto into PAXG
Step 4: Avoid Overtrading
Don’t expect big daily moves
Use it as a hedge, not a gamble
Step 5: Build Hybrid Portfolio
Example:
60% BTC/Altcoins
20% Stablecoins
20% PAXG (safety layer)
#PAXG #pepe #sto
$PAXG
$PEPE
$STO
First, understand what PAX Gold (PAXG) actually is. It’s not a typical crypto—it’s a tokenized version of physical gold. That means:
Its price ≈ real gold price
Not driven by hype cycles like altcoins
Moves based on macroeconomics, not memes
So asking “Will PAXG rise today?” is really asking:
“Will gold move up today?”
1. Core Drivers That Move PAXG (Today-Level Thinking)
A. USD Strength (Critical)
Gold and USD have an inverse relationship.
If US Dollar rises → Gold falls → PAXG falls
If US Dollar falls → Gold rises → PAXG rises
Reality Check Today:
If DXY (Dollar Index) is strong → PAXG upside is limited
If DXY weakens → bullish setup
B. Interest Rates & Bond Yields
Gold doesn’t pay interest. So:
High interest rates → investors prefer bonds → gold drops
Falling rates → gold becomes attractive → price rises
Short-Term Insight:
Even a small shift in US bond yields intraday can move PAXG.
C. Risk Sentiment (Market Fear vs Greed)
This is where most traders misunderstand PAXG.
Gold = “fear asset”
Stock market crashing → gold rises
Crypto crashing → sometimes gold rises
Everything pumping → gold stagnates or drops
So check:
Is market risk-on or risk-off today?
D. Geopolitical Triggers (Sudden Moves)
Gold reacts fast to:
War headlines
Economic instability
Banking issues
If sudden news hits → PAXG spikes instantly
2. Technical Analysis Perspective (Short-Term Traders)
Let’s break it down like a pro:
Key Levels Framework
Think in zones, not exact numbers:
Support: Previous day low / consolidation zone
Resistance: Previous high / psychological levels
Intraday Signals:
Breakout above resistance → short-term bullish
Rejection at resistance → bearish pullback
Sideways range → no real move (most common case)
Liquidity Trap Reality
Most retail traders lose here.
What actually happens:
Price fake breaks up → traps buyers → drops
Price fake drops → traps sellers → pumps
PAXG is less volatile than BTC, but still follows liquidity traps.
3. Crypto Market Correlation (Often Ignored)
Even though PAXG tracks gold, it still trades on platforms like Binance.
That means:
If crypto market crashes hard → liquidity exits → PAXG can dip
If crypto pumps → capital flows to risk assets → PAXG underperforms
So:
PAXG = hybrid behavior (Gold + Crypto liquidity)
4. Real-World Scenario Analysis (Today)
Let’s simulate 3 realistic outcomes:
Scenario 1: Bullish Case
USD weakens
Stock market uncertain
Minor geopolitical tension
Result:
→ PAXG rises slowly (not explosive)
Scenario 2: Neutral Case (Most Likely)
No major news
Stable USD
Sideways market
Result:
→ PAXG stays flat (range-bound)
Scenario 3: Bearish Case
Strong USD
Rising bond yields
Risk-on sentiment
Result:
→ PAXG dips slightly
5. The Hard Truth Most People Ignore
PAXG is NOT a “fast profit” asset.
If you're expecting:
5–10% daily gains → unrealistic
Quick pump → unlikely
Instead:
It’s a capital preservation + hedge tool
Think:
PAXG = “digital gold savings”
NOT = “trading rocket”
6. Strategic Positioning (Smart Money Thinking)
When to Buy PAXG
During economic uncertainty
When crypto looks overheated
When USD shows weakness
When NOT to Buy
During strong bull runs in BTC/altcoins
When interest rates are rising sharply
7. Final Verdict (Today)
Will PAXG rise today?
Probability-based answer:
Strong rise → Low probability
Mild upward move → Possible
Sideways → Most likely
Drop → Depends on USD strength
So:
→ Expect stability, not explosion.
8. Binance Square Post (Human, Relatable Style)
Title:
PAXG Today: Slow Gold or Hidden Opportunity?
Post Content:
Let’s be real for a second.
Everyone in crypto is chasing fast gains. But PAXG doesn’t play that game.
It moves like gold. Calm. Slow. Patient.
If you’re expecting a big pump today… you might be disappointed.
But here’s the interesting part.
When the market gets uncertain… when fear starts creeping in… that’s when PAXG quietly starts moving.
Not loudly. Not dramatically. Just steadily.
Think of it like this:
Bitcoin is a sports car.
PAXG is a tank.
One is fast. The other survives.
So today?
Most likely:
PAXG stays stable. Maybe small movement.
But if something unexpected hits the market…
That’s when it wakes up.
The real question is not:
“Will it pump today?”
The real question is:
“Are you positioned before it matters?”
Advanced Insight
The biggest misconception:
People treat PAXG like a trading asset.
Smart money treats it as:
A hedge against crypto volatility
A liquidity parking zone
A macroeconomic signal
In future cycles:
Tokenized real-world assets (like PAXG) will likely grow significantly as institutions enter blockchain.
So while retail ignores it…
Institutions quietly accumulate these types of assets.
Action Plan
Step 1: Check Macro First
Look at USD index
Look at bond yields
Check global news
Step 2: Identify Market Mode
Risk-on → avoid heavy PAXG
Risk-off → consider PAXG
Step 3: Use PAXG Strategically
Store value during uncertainty
Rotate profits from crypto into PAXG
Step 4: Avoid Overtrading
Don’t expect big daily moves
Use it as a hedge, not a gamble
Step 5: Build Hybrid Portfolio
Example:
60% BTC/Altcoins
20% Stablecoins
20% PAXG (safety layer)
#PAXG #pepe #sto
$PAXG
$PEPE
$STO
97

Article
The Coming Crypto Crossroads: Google’s Warning & Satoshi’s Sleeping FortuneLet’s slow down and really unpack what’s happening here—because this isn’t just a technical update. It’s a philosophical, economic, and even psychological turning point for crypto.
When companies like Google start urging upgrades to encryption algorithms, they’re not being dramatic. They’re looking ahead—specifically at the rise of quantum computing and its potential to break today’s cryptographic systems.
And that leads us to one of the biggest unanswered questions in crypto:
What happens to the untouched Bitcoins of Satoshi Nakamoto?
1. The Core Issue (Explained Simply)
Most cryptocurrencies—including Bitcoin—rely on:
ECDSA (Elliptic Curve Digital Signature Algorithm)
Private keys → Public keys → Addresses
Today:
It’s practically impossible to derive a private key from a public key.
But in a post-quantum world:
Quantum computers could theoretically reverse this process.
That means wallets could be hacked if exposed.
Now here’s the catch:
Not all Bitcoin is equally safe
Used addresses (public key revealed) → Vulnerable sooner
Unused addresses (only hash visible) → Safer (for now)
2. Why Satoshi’s Bitcoins Are Special
Satoshi is estimated to hold ~1 million BTC.
But those coins have never moved.
That creates a paradox:
Scenario A: They are safe
If private keys are never exposed, funds stay locked forever.
Scenario B: They become the biggest target in history
Once quantum attacks are viable, dormant wallets become vulnerable.
So we face a dilemma:
Should the network protect inactive coins… or respect absolute ownership?
3. Three Competing Solutions (With Trade-offs)
Solution 1: Do Nothing (Purist Approach)
Philosophy: Code is law. Ownership is absolute.
Pros:
Preserves Bitcoin’s immutability
No governance interference
Maintains trust in decentralization
Cons:
Massive BTC (including Satoshi’s) could be stolen
Market chaos if suddenly moved
Undermines long-term security
Solution 2: Mandatory Upgrade (Hard Fork)
Upgrade Bitcoin to post-quantum cryptography.
Mechanism:
Require all users to move funds to new quantum-resistant addresses
Old addresses become invalid after a deadline
Pros:
Strong future-proofing
Eliminates quantum threat
Cons:
Breaks backward compatibility
Risks chain split (like Bitcoin vs Bitcoin Cash)
Satoshi’s coins likely become unmovable forever
Solution 3: “Use It or Lose It” Policy
Introduce rules like:
Coins must be moved within X years
Otherwise, they become unspendable or redistributed
Pros:
Clears dormant coins
Reduces attack surface
Cons:
Violates core principle of ownership
Highly controversial
Slippery slope toward centralized control
4. Real-World Analogy
Think of Bitcoin like a vault system:
Today: Vaults are unbreakable
Future: A new tool can open any vault silently
Now imagine:
One vault (Satoshi’s) contains 1 million gold bars
No one has touched it for 15 years
Do you:
Leave it alone?
Upgrade all vaults and lock that one forever?
Redistribute the gold?
There is no perfect answer.
5. Market Impact (If Satoshi’s Coins Move)
Let’s be brutally realistic.
If Satoshi’s coins suddenly move:
Immediate effects:
Panic selling
Massive volatility
Trust shock
Long-term effects:
Narrative shift: “Bitcoin is no longer untouchable”
Institutional hesitation
Regulatory pressure increases
But here’s the twist:
Even the possibility of movement is enough to influence markets.
6. Hidden Assumption to Challenge
Everyone assumes:
“Quantum computing will break Bitcoin.”
But let’s challenge that:
Counterarguments:
Practical quantum attacks may still be decades away
Cryptography can evolve faster than quantum hardware
Hybrid systems (classical + quantum-resistant) can be deployed
So the real question isn’t if, but when and how fast.
7. Future Prediction (Advanced View)
Within 10–20 years:
Bitcoin may adopt layered cryptography
Wallets will auto-upgrade signatures
Quantum-resistant chains may emerge alongside Bitcoin
Satoshi’s coins may become:Permanently locked
Or the most valuable untouched relic in history
And psychologically:
Satoshi’s unmoved coins may evolve into a symbol—like digital sacred ground.
Advanced Insight
The real battle here isn’t just technical—it’s ideological.
Bitcoin was designed to remove human decision-making.
But quantum threats may force exactly that: a human decision about immutable code.
This creates a paradox:
The more we try to protect Bitcoin, the more we risk changing what makes it valuable.
Satoshi’s coins amplify this tension. They are both:
A security risk
And a philosophical anchor
Whichever path is chosen will redefine decentralization itself.
Action Plan
Step 1: Understand Your Risk
Check if your wallet exposes public keys
Prefer modern address formats (SegWit, Taproot)
Step 2: Prepare for Migration
Stay updated on quantum-resistant proposals
Be ready to move funds when needed
Step 3: Diversify Cryptographic Exposure
Don’t rely on one chain or one wallet type
Explore quantum-resistant projects (research phase only)
Step 4: Follow Governance Signals
Watch Bitcoin developer discussions
Monitor forks or upgrade proposals
Step 5: Think Strategically (Not Emotionally)
Don’t panic over quantum headlines
Focus on timeline realism vs hype
The Coming Crypto Crossroads: Google’s Warning & Satoshi’s Sleeping Fortune
Let’s slow down and really unpack what’s happening here—because this isn’t just a technical update. It’s a philosophical, economic, and even psychological turning point for crypto.
When companies like Google start urging upgrades to encryption algorithms, they’re not being dramatic. They’re looking ahead—specifically at the rise of quantum computing and its potential to break today’s cryptographic systems.
And that leads us to one of the biggest unanswered questions in crypto:
What happens to the untouched Bitcoins of Satoshi Nakamoto?
1. The Core Issue (Explained Simply)
Most cryptocurrencies—including Bitcoin—rely on:
ECDSA (Elliptic Curve Digital Signature Algorithm)
Private keys → Public keys → Addresses
Today:
It’s practically impossible to derive a private key from a public key.
But in a post-quantum world:
Quantum computers could theoretically reverse this process.
That means wallets could be hacked if exposed.
Now here’s the catch:
Not all Bitcoin is equally safe
Used addresses (public key revealed) → Vulnerable sooner
Unused addresses (only hash visible) → Safer (for now)
2. Why Satoshi’s Bitcoins Are Special
Satoshi is estimated to hold ~1 million BTC.
But those coins have never moved.
That creates a paradox:
Scenario A: They are safe
If private keys are never exposed, funds stay locked forever.
Scenario B: They become the biggest target in history
Once quantum attacks are viable, dormant wallets become vulnerable.
So we face a dilemma:
Should the network protect inactive coins… or respect absolute ownership?
3. Three Competing Solutions (With Trade-offs)
Solution 1: Do Nothing (Purist Approach)
Philosophy: Code is law. Ownership is absolute.
Pros:
Preserves Bitcoin’s immutability
No governance interference
Maintains trust in decentralization
Cons:
Massive BTC (including Satoshi’s) could be stolen
Market chaos if suddenly moved
Undermines long-term security
Solution 2: Mandatory Upgrade (Hard Fork)
Upgrade Bitcoin to post-quantum cryptography.
Mechanism:
Require all users to move funds to new quantum-resistant addresses
Old addresses become invalid after a deadline
Pros:
Strong future-proofing
Eliminates quantum threat
Cons:
Breaks backward compatibility
Risks chain split (like Bitcoin vs Bitcoin Cash)
Satoshi’s coins likely become unmovable forever
Solution 3: “Use It or Lose It” Policy
Introduce rules like:
Coins must be moved within X years
Otherwise, they become unspendable or redistributed
Pros:
Clears dormant coins
Reduces attack surface
Cons:
Violates core principle of ownership
Highly controversial
Slippery slope toward centralized control
4. Real-World Analogy
Think of Bitcoin like a vault system:
Today: Vaults are unbreakable
Future: A new tool can open any vault silently
Now imagine:
One vault (Satoshi’s) contains 1 million gold bars
No one has touched it for 15 years
Do you:
Leave it alone?
Upgrade all vaults and lock that one forever?
Redistribute the gold?
There is no perfect answer.
5. Market Impact (If Satoshi’s Coins Move)
Let’s be brutally realistic.
If Satoshi’s coins suddenly move:
Immediate effects:
Panic selling
Massive volatility
Trust shock
Long-term effects:
Narrative shift: “Bitcoin is no longer untouchable”
Institutional hesitation
Regulatory pressure increases
But here’s the twist:
Even the possibility of movement is enough to influence markets.
6. Hidden Assumption to Challenge
Everyone assumes:
“Quantum computing will break Bitcoin.”
But let’s challenge that:
Counterarguments:
Practical quantum attacks may still be decades away
Cryptography can evolve faster than quantum hardware
Hybrid systems (classical + quantum-resistant) can be deployed
So the real question isn’t if, but when and how fast.
7. Future Prediction (Advanced View)
Within 10–20 years:
Bitcoin may adopt layered cryptography
Wallets will auto-upgrade signatures
Quantum-resistant chains may emerge alongside Bitcoin
Satoshi’s coins may become:Permanently locked
Or the most valuable untouched relic in history
And psychologically:
Satoshi’s unmoved coins may evolve into a symbol—like digital sacred ground.
Advanced Insight
The real battle here isn’t just technical—it’s ideological.
Bitcoin was designed to remove human decision-making.
But quantum threats may force exactly that: a human decision about immutable code.
This creates a paradox:
The more we try to protect Bitcoin, the more we risk changing what makes it valuable.
Satoshi’s coins amplify this tension. They are both:
A security risk
And a philosophical anchor
Whichever path is chosen will redefine decentralization itself.
Action Plan
Step 1: Understand Your Risk
Check if your wallet exposes public keys
Prefer modern address formats (SegWit, Taproot)
Step 2: Prepare for Migration
Stay updated on quantum-resistant proposals
Be ready to move funds when needed
Step 3: Diversify Cryptographic Exposure
Don’t rely on one chain or one wallet type
Explore quantum-resistant projects (research phase only)
Step 4: Follow Governance Signals
Watch Bitcoin developer discussions
Monitor forks or upgrade proposals
Step 5: Think Strategically (Not Emotionally)
Don’t panic over quantum headlines
Focus on timeline realism vs hype
When companies like Google start urging upgrades to encryption algorithms, they’re not being dramatic. They’re looking ahead—specifically at the rise of quantum computing and its potential to break today’s cryptographic systems.
And that leads us to one of the biggest unanswered questions in crypto:
What happens to the untouched Bitcoins of Satoshi Nakamoto?
1. The Core Issue (Explained Simply)
Most cryptocurrencies—including Bitcoin—rely on:
ECDSA (Elliptic Curve Digital Signature Algorithm)
Private keys → Public keys → Addresses
Today:
It’s practically impossible to derive a private key from a public key.
But in a post-quantum world:
Quantum computers could theoretically reverse this process.
That means wallets could be hacked if exposed.
Now here’s the catch:
Not all Bitcoin is equally safe
Used addresses (public key revealed) → Vulnerable sooner
Unused addresses (only hash visible) → Safer (for now)
2. Why Satoshi’s Bitcoins Are Special
Satoshi is estimated to hold ~1 million BTC.
But those coins have never moved.
That creates a paradox:
Scenario A: They are safe
If private keys are never exposed, funds stay locked forever.
Scenario B: They become the biggest target in history
Once quantum attacks are viable, dormant wallets become vulnerable.
So we face a dilemma:
Should the network protect inactive coins… or respect absolute ownership?
3. Three Competing Solutions (With Trade-offs)
Solution 1: Do Nothing (Purist Approach)
Philosophy: Code is law. Ownership is absolute.
Pros:
Preserves Bitcoin’s immutability
No governance interference
Maintains trust in decentralization
Cons:
Massive BTC (including Satoshi’s) could be stolen
Market chaos if suddenly moved
Undermines long-term security
Solution 2: Mandatory Upgrade (Hard Fork)
Upgrade Bitcoin to post-quantum cryptography.
Mechanism:
Require all users to move funds to new quantum-resistant addresses
Old addresses become invalid after a deadline
Pros:
Strong future-proofing
Eliminates quantum threat
Cons:
Breaks backward compatibility
Risks chain split (like Bitcoin vs Bitcoin Cash)
Satoshi’s coins likely become unmovable forever
Solution 3: “Use It or Lose It” Policy
Introduce rules like:
Coins must be moved within X years
Otherwise, they become unspendable or redistributed
Pros:
Clears dormant coins
Reduces attack surface
Cons:
Violates core principle of ownership
Highly controversial
Slippery slope toward centralized control
4. Real-World Analogy
Think of Bitcoin like a vault system:
Today: Vaults are unbreakable
Future: A new tool can open any vault silently
Now imagine:
One vault (Satoshi’s) contains 1 million gold bars
No one has touched it for 15 years
Do you:
Leave it alone?
Upgrade all vaults and lock that one forever?
Redistribute the gold?
There is no perfect answer.
5. Market Impact (If Satoshi’s Coins Move)
Let’s be brutally realistic.
If Satoshi’s coins suddenly move:
Immediate effects:
Panic selling
Massive volatility
Trust shock
Long-term effects:
Narrative shift: “Bitcoin is no longer untouchable”
Institutional hesitation
Regulatory pressure increases
But here’s the twist:
Even the possibility of movement is enough to influence markets.
6. Hidden Assumption to Challenge
Everyone assumes:
“Quantum computing will break Bitcoin.”
But let’s challenge that:
Counterarguments:
Practical quantum attacks may still be decades away
Cryptography can evolve faster than quantum hardware
Hybrid systems (classical + quantum-resistant) can be deployed
So the real question isn’t if, but when and how fast.
7. Future Prediction (Advanced View)
Within 10–20 years:
Bitcoin may adopt layered cryptography
Wallets will auto-upgrade signatures
Quantum-resistant chains may emerge alongside Bitcoin
Satoshi’s coins may become:Permanently locked
Or the most valuable untouched relic in history
And psychologically:
Satoshi’s unmoved coins may evolve into a symbol—like digital sacred ground.
Advanced Insight
The real battle here isn’t just technical—it’s ideological.
Bitcoin was designed to remove human decision-making.
But quantum threats may force exactly that: a human decision about immutable code.
This creates a paradox:
The more we try to protect Bitcoin, the more we risk changing what makes it valuable.
Satoshi’s coins amplify this tension. They are both:
A security risk
And a philosophical anchor
Whichever path is chosen will redefine decentralization itself.
Action Plan
Step 1: Understand Your Risk
Check if your wallet exposes public keys
Prefer modern address formats (SegWit, Taproot)
Step 2: Prepare for Migration
Stay updated on quantum-resistant proposals
Be ready to move funds when needed
Step 3: Diversify Cryptographic Exposure
Don’t rely on one chain or one wallet type
Explore quantum-resistant projects (research phase only)
Step 4: Follow Governance Signals
Watch Bitcoin developer discussions
Monitor forks or upgrade proposals
Step 5: Think Strategically (Not Emotionally)
Don’t panic over quantum headlines
Focus on timeline realism vs hype
50

Article
KERNEL Smart Money vs. Retail: Who Really Controls Prices Today?Let's be honest.
Most traders think prices change due to "news" or "community hype."
This is comforting—but wrong.
Price changes due to liquidity manipulation.
And if you don't understand this, you're not trading—you're being traded.
1. Key Truth (Simple but Powerful)
There are only two real forces in the market:
1. Smart Money
Market Makers
Whales
Institutions
2. Retail Traders
You
Binance Square Users
Social Media Followers
Now here's the uncomfortable part:
Smart Money needs retail to lose... so they can win.
2. How Smart Money Changes KERNEL
Let's understand their playbook step-by-step.
Phase 1: Accumulation (Silent Zone)
Price moves sideways
Volume seems boring
No hype
Reality:
Smart money is quietly buying
Retail Reaction:
“This coin is over”
Phase 2: Manipulation (Creating a Trap)
Fake breakout up
Sudden drop
Finding a stop-loss
Reality:
They are building a liquidity pool
Retail Reaction:
Panic selling or FOMO buying
Phase 3: Expansion (Real Move)
Strong trend begins
Volume increases
Momentum builds
Reality:
Smart money is now pushing the price up
Retail Reaction:
“I knew it would go up!” (But comes late)
Phase 4: Distribution (Exit Phase)
Price rises rapidly
News and hype spreads
Reality:
Smart money is selling to retail
Retail Reaction:
Top 3 Buys
Potential Positions for KERNEL Today
Let's challenge the predictions again.
If you're seeing:
Sudden attention
Postals everywhere
"Next 100x" claims
Then most likely:
👉 You're not in a hurry
👉 You're in the manipulation or distribution phase
4. Liquidity Trap Model
Traders get trapped like this:
Trap Setup:
Resistance is broken → Looks bullish
Everyone enters long
What happens next:
Price sharply reverses
Reaches stop-loss
Then moves in the original direction
This is called:
👉 Liquidity Sweep + Reversal
5. Real Trading Framework (Use it today)
3-Step Confirmation System
Step 1: Structure
Higher high + higher low → Bullish
Lower high + lower low → Bearish
Step 2: Liquidity
Did the price break the previous high/low?
If yes → manipulation likely
Step 3: Confirmation
Wait for a retest
Enter after a reaction
6. Two Different Strategies (Think Like a Pro)
Strategy A: Momentum Trading
Advantages:
Faster profits
Works in strong trends
Disadvantages:
Higher risk of fakeouts
Strategy B: Contrarian Trading
Advantages:
Better entry prices
Higher probability setups
Disadvantages:
Requires patience
More emotionally challenging
7. A Hard Reality Check
I want to reiterate a dangerous thought:
“If I catch the pump early, I’ll make a big profit.”
Reality:
Early pumps are engineered
You’re rarely early
You usually exit liquidity
Advanced Insight
The biggest mistake traders make is misjudging the direction Trying to guess.
Professionals don't guess. They react to confirmation after manipulation.
If you change your thinking from:
"Where will the price go?"
To:
"Where is the liquidity, and who is getting trapped?"
You immediately surpass 90% of traders.
Action Plan (Step-by-Step)
Step 1: Identify the Phase
Is the KERNEL ranging, pumping, or rejecting?
Step 2: Mark the Liquidity Zone
Previous High (Buy Stop)
Previous Low (Sell Stop)
Step 3: Wait for a Sweep
Don't enter before manipulation
Step 4: Confirm Entry
Enter after a reversal or breakout retest
Step 5: Control Risk
Never risk more than 2%
Consider losses as part of the system
#KERNEL #ZBT #SKL
$ZBT
{spot}(ZBTUSDT)
$SKL
{spot}(SKLUSDT)
$KERNEL
{spot}(KERNELUSDT)
KERNEL Smart Money vs. Retail: Who Really Controls Prices Today?
Let's be honest.
Most traders think prices change due to "news" or "community hype."
This is comforting—but wrong.
Price changes due to liquidity manipulation.
And if you don't understand this, you're not trading—you're being traded.
1. Key Truth (Simple but Powerful)
There are only two real forces in the market:
1. Smart Money
Market Makers
Whales
Institutions
2. Retail Traders
You
Binance Square Users
Social Media Followers
Now here's the uncomfortable part:
Smart Money needs retail to lose... so they can win.
2. How Smart Money Changes KERNEL
Let's understand their playbook step-by-step.
Phase 1: Accumulation (Silent Zone)
Price moves sideways
Volume seems boring
No hype
Reality:
Smart money is quietly buying
Retail Reaction:
“This coin is over”
Phase 2: Manipulation (Creating a Trap)
Fake breakout up
Sudden drop
Finding a stop-loss
Reality:
They are building a liquidity pool
Retail Reaction:
Panic selling or FOMO buying
Phase 3: Expansion (Real Move)
Strong trend begins
Volume increases
Momentum builds
Reality:
Smart money is now pushing the price up
Retail Reaction:
“I knew it would go up!” (But comes late)
Phase 4: Distribution (Exit Phase)
Price rises rapidly
News and hype spreads
Reality:
Smart money is selling to retail
Retail Reaction:
Top 3 Buys
Potential Positions for KERNEL Today
Let's challenge the predictions again.
If you're seeing:
Sudden attention
Postals everywhere
"Next 100x" claims
Then most likely:
👉 You're not in a hurry
👉 You're in the manipulation or distribution phase
4. Liquidity Trap Model
Traders get trapped like this:
Trap Setup:
Resistance is broken → Looks bullish
Everyone enters long
What happens next:
Price sharply reverses
Reaches stop-loss
Then moves in the original direction
This is called:
👉 Liquidity Sweep + Reversal
5. Real Trading Framework (Use it today)
3-Step Confirmation System
Step 1: Structure
Higher high + higher low → Bullish
Lower high + lower low → Bearish
Step 2: Liquidity
Did the price break the previous high/low?
If yes → manipulation likely
Step 3: Confirmation
Wait for a retest
Enter after a reaction
6. Two Different Strategies (Think Like a Pro)
Strategy A: Momentum Trading
Advantages:
Faster profits
Works in strong trends
Disadvantages:
Higher risk of fakeouts
Strategy B: Contrarian Trading
Advantages:
Better entry prices
Higher probability setups
Disadvantages:
Requires patience
More emotionally challenging
7. A Hard Reality Check
I want to reiterate a dangerous thought:
“If I catch the pump early, I’ll make a big profit.”
Reality:
Early pumps are engineered
You’re rarely early
You usually exit liquidity
Advanced Insight
The biggest mistake traders make is misjudging the direction Trying to guess.
Professionals don't guess. They react to confirmation after manipulation.
If you change your thinking from:
"Where will the price go?"
To:
"Where is the liquidity, and who is getting trapped?"
You immediately surpass 90% of traders.
Action Plan (Step-by-Step)
Step 1: Identify the Phase
Is the KERNEL ranging, pumping, or rejecting?
Step 2: Mark the Liquidity Zone
Previous High (Buy Stop)
Previous Low (Sell Stop)
Step 3: Wait for a Sweep
Don't enter before manipulation
Step 4: Confirm Entry
Enter after a reversal or breakout retest
Step 5: Control Risk
Never risk more than 2%
Consider losses as part of the system
#KERNEL #ZBT #SKL
$ZBT
$SKL
$KERNEL
Most traders think prices change due to "news" or "community hype."
This is comforting—but wrong.
Price changes due to liquidity manipulation.
And if you don't understand this, you're not trading—you're being traded.
1. Key Truth (Simple but Powerful)
There are only two real forces in the market:
1. Smart Money
Market Makers
Whales
Institutions
2. Retail Traders
You
Binance Square Users
Social Media Followers
Now here's the uncomfortable part:
Smart Money needs retail to lose... so they can win.
2. How Smart Money Changes KERNEL
Let's understand their playbook step-by-step.
Phase 1: Accumulation (Silent Zone)
Price moves sideways
Volume seems boring
No hype
Reality:
Smart money is quietly buying
Retail Reaction:
“This coin is over”
Phase 2: Manipulation (Creating a Trap)
Fake breakout up
Sudden drop
Finding a stop-loss
Reality:
They are building a liquidity pool
Retail Reaction:
Panic selling or FOMO buying
Phase 3: Expansion (Real Move)
Strong trend begins
Volume increases
Momentum builds
Reality:
Smart money is now pushing the price up
Retail Reaction:
“I knew it would go up!” (But comes late)
Phase 4: Distribution (Exit Phase)
Price rises rapidly
News and hype spreads
Reality:
Smart money is selling to retail
Retail Reaction:
Top 3 Buys
Potential Positions for KERNEL Today
Let's challenge the predictions again.
If you're seeing:
Sudden attention
Postals everywhere
"Next 100x" claims
Then most likely:
👉 You're not in a hurry
👉 You're in the manipulation or distribution phase
4. Liquidity Trap Model
Traders get trapped like this:
Trap Setup:
Resistance is broken → Looks bullish
Everyone enters long
What happens next:
Price sharply reverses
Reaches stop-loss
Then moves in the original direction
This is called:
👉 Liquidity Sweep + Reversal
5. Real Trading Framework (Use it today)
3-Step Confirmation System
Step 1: Structure
Higher high + higher low → Bullish
Lower high + lower low → Bearish
Step 2: Liquidity
Did the price break the previous high/low?
If yes → manipulation likely
Step 3: Confirmation
Wait for a retest
Enter after a reaction
6. Two Different Strategies (Think Like a Pro)
Strategy A: Momentum Trading
Advantages:
Faster profits
Works in strong trends
Disadvantages:
Higher risk of fakeouts
Strategy B: Contrarian Trading
Advantages:
Better entry prices
Higher probability setups
Disadvantages:
Requires patience
More emotionally challenging
7. A Hard Reality Check
I want to reiterate a dangerous thought:
“If I catch the pump early, I’ll make a big profit.”
Reality:
Early pumps are engineered
You’re rarely early
You usually exit liquidity
Advanced Insight
The biggest mistake traders make is misjudging the direction Trying to guess.
Professionals don't guess. They react to confirmation after manipulation.
If you change your thinking from:
"Where will the price go?"
To:
"Where is the liquidity, and who is getting trapped?"
You immediately surpass 90% of traders.
Action Plan (Step-by-Step)
Step 1: Identify the Phase
Is the KERNEL ranging, pumping, or rejecting?
Step 2: Mark the Liquidity Zone
Previous High (Buy Stop)
Previous Low (Sell Stop)
Step 3: Wait for a Sweep
Don't enter before manipulation
Step 4: Confirm Entry
Enter after a reversal or breakout retest
Step 5: Control Risk
Never risk more than 2%
Consider losses as part of the system
#KERNEL #ZBT #SKL
$ZBT
$SKL
$KERNEL
149

Article
BNB Market Analysis Today — Deep, Strategic BreakdownLet’s analyze BNB not like a casual trader, but like a market operator who understands liquidity, psychology, and macro flows.
1. Current Market Structure (Core Understanding)
BNB is not just a coin — it’s tightly coupled with the ecosystem of Binance.
That creates a hybrid asset behavior:
Part utility token (fees, staking, launchpad)
Part exchange equity proxy
Part speculative asset
What does this mean?
BNB does NOT behave like pure decentralized assets such as Bitcoin or Ethereum.
Instead:
It is more controlled
More resilient in dumps
But sometimes lags in explosive rallies
2. Today's Likely Market Scenarios
We break today into 3 probabilistic scenarios:
Scenario A — Controlled Bullish Continuation (40% probability)
Conditions:
BTC stable or slightly bullish
No negative Binance news
Altcoin sentiment improving
Expected behaviour:
BNB slowly climbs
Small pullbacks get bought quickly
Volume increases gradually
Key insight:
BNB tends to move after BTC stabilizes, not during chaos.
Scenario B — Sideways Liquidity Trap (35% probability)
Conditions:
btc ranging
Low volatility environment
Expected behaviour:
BNB trades in a tight range
Fake breakouts (both up and down)
Whales accumulate silently
Market psychology:
Retail gets chopped. Smart money builds positions.
Scenario C — Sharp Downside Reaction (25% probability)
Triggers:
Sudden BTC drop
Negative regulatory headlines
Binance-related FUD
Expected behaviour:
Fast drop (liquidity sweep)
Quick partial recovery
Long-term structure remains intact
Important:
BNB rarely collapses deeply unless Binance itself is targeted.
3. Liquidity & Whale Behavior (Advanced Layer)
To understand today, think like a whale:
Where is liquidity?
Above recent highs → stop-loss clusters
Below recent lows → panic sellers
Whale strategy:
Push price to trigger stops
absorb liquidity
Reverse direction
Conclusion:
Today is likely manipulation-driven, not purely trend-driven.
4. Technical Framework (Professional View)
Use this 3-layer model:
Layer 1: Trend
Higher highs + higher lows → bullish bias
Lower highs → early weakness
Layer 2: Liquidity Zones
Identify equal highs/lows
Expect stop hunts
Layer 3: Volume Confirmation
Breakout without volume = fake
Breakout with volume = continuation
5. Fundamental Catalysts to Watch Today
Binance announcements (launchpad, burns, listings)
Regulatory news impacting Binance
Overall crypto market sentiment
BTC dominance shifts
BNB reacts strongly to internal ecosystem news — more than most coins.
6. Strategic Trading Insights
If you are a short-term trader:
Avoid chasing breakouts
Wait for liquidity sweeps
Trade reversals, not emotions
If you are a swing trader:
Accumulate during sideways phases
Avoid panic selling
Focus on structure, not noise
If you are a long-term holder:
BNB remains structurally strong
Binance ecosystem = long-term advantage
But regulatory risk always exists
Final Thoughts
Trading BNB is like playing chess with an invisible opponent.
You don't win by reacting fast — you win by understanding why the move was made.
Most traders watch candles.
Smart traders watch behavior.
→ Advanced Insight
BNB’s biggest hidden strength is centralized backing with decentralized perception.
This creates a paradox:
It is more stable than most altcoins
But carries “invisible risk” tied to Binance
Future prediction:
If Binance expands globally → BNB could outperform many altcoins
If regulatory pressure increases → BNB becomes highly volatile overnight
→ Action Plan (Step-by-Step)
Identify today's BTC direction first
Mark BNB’s recent highs and lows
Wait for a liquidity sweep (fake breakout)
Enter only after confirmation (volume + structure)
Set tight stop-loss below/above liquidity zone
Take partial profits at key resistance levels
Avoid overtrading — patience is your edge
Track Binance-related news in real-time
#BNB #BitcoinPrices #bnbprice
$BTC
{spot}(BTCUSDT)
$ETH
{spot}(ETHUSDT)
$BNB
{spot}(BNBUSDT)
BNB Market Analysis Today — Deep, Strategic Breakdown
Let’s analyze BNB not like a casual trader, but like a market operator who understands liquidity, psychology, and macro flows.
1. Current Market Structure (Core Understanding)
BNB is not just a coin — it’s tightly coupled with the ecosystem of Binance.
That creates a hybrid asset behavior:
Part utility token (fees, staking, launchpad)
Part exchange equity proxy
Part speculative asset
What does this mean?
BNB does NOT behave like pure decentralized assets such as Bitcoin or Ethereum.
Instead:
It is more controlled
More resilient in dumps
But sometimes lags in explosive rallies
2. Today's Likely Market Scenarios
We break today into 3 probabilistic scenarios:
Scenario A — Controlled Bullish Continuation (40% probability)
Conditions:
BTC stable or slightly bullish
No negative Binance news
Altcoin sentiment improving
Expected behaviour:
BNB slowly climbs
Small pullbacks get bought quickly
Volume increases gradually
Key insight:
BNB tends to move after BTC stabilizes, not during chaos.
Scenario B — Sideways Liquidity Trap (35% probability)
Conditions:
btc ranging
Low volatility environment
Expected behaviour:
BNB trades in a tight range
Fake breakouts (both up and down)
Whales accumulate silently
Market psychology:
Retail gets chopped. Smart money builds positions.
Scenario C — Sharp Downside Reaction (25% probability)
Triggers:
Sudden BTC drop
Negative regulatory headlines
Binance-related FUD
Expected behaviour:
Fast drop (liquidity sweep)
Quick partial recovery
Long-term structure remains intact
Important:
BNB rarely collapses deeply unless Binance itself is targeted.
3. Liquidity & Whale Behavior (Advanced Layer)
To understand today, think like a whale:
Where is liquidity?
Above recent highs → stop-loss clusters
Below recent lows → panic sellers
Whale strategy:
Push price to trigger stops
absorb liquidity
Reverse direction
Conclusion:
Today is likely manipulation-driven, not purely trend-driven.
4. Technical Framework (Professional View)
Use this 3-layer model:
Layer 1: Trend
Higher highs + higher lows → bullish bias
Lower highs → early weakness
Layer 2: Liquidity Zones
Identify equal highs/lows
Expect stop hunts
Layer 3: Volume Confirmation
Breakout without volume = fake
Breakout with volume = continuation
5. Fundamental Catalysts to Watch Today
Binance announcements (launchpad, burns, listings)
Regulatory news impacting Binance
Overall crypto market sentiment
BTC dominance shifts
BNB reacts strongly to internal ecosystem news — more than most coins.
6. Strategic Trading Insights
If you are a short-term trader:
Avoid chasing breakouts
Wait for liquidity sweeps
Trade reversals, not emotions
If you are a swing trader:
Accumulate during sideways phases
Avoid panic selling
Focus on structure, not noise
If you are a long-term holder:
BNB remains structurally strong
Binance ecosystem = long-term advantage
But regulatory risk always exists
Final Thoughts
Trading BNB is like playing chess with an invisible opponent.
You don't win by reacting fast — you win by understanding why the move was made.
Most traders watch candles.
Smart traders watch behavior.
→ Advanced Insight
BNB’s biggest hidden strength is centralized backing with decentralized perception.
This creates a paradox:
It is more stable than most altcoins
But carries “invisible risk” tied to Binance
Future prediction:
If Binance expands globally → BNB could outperform many altcoins
If regulatory pressure increases → BNB becomes highly volatile overnight
→ Action Plan (Step-by-Step)
Identify today's BTC direction first
Mark BNB’s recent highs and lows
Wait for a liquidity sweep (fake breakout)
Enter only after confirmation (volume + structure)
Set tight stop-loss below/above liquidity zone
Take partial profits at key resistance levels
Avoid overtrading — patience is your edge
Track Binance-related news in real-time
#BNB #BitcoinPrices #bnbprice
$BTC
$ETH
$BNB
1. Current Market Structure (Core Understanding)
BNB is not just a coin — it’s tightly coupled with the ecosystem of Binance.
That creates a hybrid asset behavior:
Part utility token (fees, staking, launchpad)
Part exchange equity proxy
Part speculative asset
What does this mean?
BNB does NOT behave like pure decentralized assets such as Bitcoin or Ethereum.
Instead:
It is more controlled
More resilient in dumps
But sometimes lags in explosive rallies
2. Today's Likely Market Scenarios
We break today into 3 probabilistic scenarios:
Scenario A — Controlled Bullish Continuation (40% probability)
Conditions:
BTC stable or slightly bullish
No negative Binance news
Altcoin sentiment improving
Expected behaviour:
BNB slowly climbs
Small pullbacks get bought quickly
Volume increases gradually
Key insight:
BNB tends to move after BTC stabilizes, not during chaos.
Scenario B — Sideways Liquidity Trap (35% probability)
Conditions:
btc ranging
Low volatility environment
Expected behaviour:
BNB trades in a tight range
Fake breakouts (both up and down)
Whales accumulate silently
Market psychology:
Retail gets chopped. Smart money builds positions.
Scenario C — Sharp Downside Reaction (25% probability)
Triggers:
Sudden BTC drop
Negative regulatory headlines
Binance-related FUD
Expected behaviour:
Fast drop (liquidity sweep)
Quick partial recovery
Long-term structure remains intact
Important:
BNB rarely collapses deeply unless Binance itself is targeted.
3. Liquidity & Whale Behavior (Advanced Layer)
To understand today, think like a whale:
Where is liquidity?
Above recent highs → stop-loss clusters
Below recent lows → panic sellers
Whale strategy:
Push price to trigger stops
absorb liquidity
Reverse direction
Conclusion:
Today is likely manipulation-driven, not purely trend-driven.
4. Technical Framework (Professional View)
Use this 3-layer model:
Layer 1: Trend
Higher highs + higher lows → bullish bias
Lower highs → early weakness
Layer 2: Liquidity Zones
Identify equal highs/lows
Expect stop hunts
Layer 3: Volume Confirmation
Breakout without volume = fake
Breakout with volume = continuation
5. Fundamental Catalysts to Watch Today
Binance announcements (launchpad, burns, listings)
Regulatory news impacting Binance
Overall crypto market sentiment
BTC dominance shifts
BNB reacts strongly to internal ecosystem news — more than most coins.
6. Strategic Trading Insights
If you are a short-term trader:
Avoid chasing breakouts
Wait for liquidity sweeps
Trade reversals, not emotions
If you are a swing trader:
Accumulate during sideways phases
Avoid panic selling
Focus on structure, not noise
If you are a long-term holder:
BNB remains structurally strong
Binance ecosystem = long-term advantage
But regulatory risk always exists
Final Thoughts
Trading BNB is like playing chess with an invisible opponent.
You don't win by reacting fast — you win by understanding why the move was made.
Most traders watch candles.
Smart traders watch behavior.
→ Advanced Insight
BNB’s biggest hidden strength is centralized backing with decentralized perception.
This creates a paradox:
It is more stable than most altcoins
But carries “invisible risk” tied to Binance
Future prediction:
If Binance expands globally → BNB could outperform many altcoins
If regulatory pressure increases → BNB becomes highly volatile overnight
→ Action Plan (Step-by-Step)
Identify today's BTC direction first
Mark BNB’s recent highs and lows
Wait for a liquidity sweep (fake breakout)
Enter only after confirmation (volume + structure)
Set tight stop-loss below/above liquidity zone
Take partial profits at key resistance levels
Avoid overtrading — patience is your edge
Track Binance-related news in real-time
#BNB #BitcoinPrices #bnbprice
$BTC
$ETH
$BNB
2
2
2
76
Log in to explore more content
Join global crypto users on Binance Square
⚡️ Get latest and useful information about crypto.
💬 Trusted by the world’s largest crypto exchange.
👍 Discover real insights from verified creators.
Email / Phone number
Trending Topics
A Packed Week of Earnings and Data Tests Markets
27,313 views
210 Discussing
🚨🇺🇸 BIG WEEK AHEAD FOR THE MARKETS!
Markets are pricing in a Fed rate hike in December and $BTC could see some big moves next week.
Here's what's coming:
• Monday: Fed Chair Warsh speaks
• Tuesday: US Retail Sales + $NVDA earnings
• Wednesday: FOMC Minutes
• Thursday: Jobless Claims + Philly Fed Index
• Friday: Consumer Sentiment + Fed speeches
All eyes on $BTC as another important week begins.
#bitcoin
Mookie
·8 Likes
·4.6k views
AnthropicIPOTestsInvestorAppetiteForAI
27,912 views
535 Discussing
HuangReportedlyConsidersReturnToNvidia
55,156 views
676 Discussing