
Ansar Ali Aassi
113 Posts

Ansar Ali Aassi
Report
Block User
Open Trade

THE Holder
High-Frequency Trader
2.5 Years
103 Following
49 Followers
6 Liked
Posts
Portfolio
All
Quotes
#opg $OPG
OPGUSDT (OpenGradient) – Short Technical View
Support: $0.15, then $0.14
Resistance: $0.18, then $0.20
A break above $0.18 could open the way toward $0.22–$0.25.
A drop below $0.15 may signal further downside pressure.
Current market structure is neutral to bullish while price remains above key support.
Entry: $0.14
Suggested Stop Loss: $0.132–$0.135 (depends on your risk tolerance)
Target 1: $0.18
Target 2: $0.20
Target 3: $0.22–$0.25 (if bullish momentum continues)
Risk-to-reward improves if the price stays above $0.14 and holds support. Consider moving your stop loss to breakeven once the price reaches your first
#opg $OPG
OPGUSDT (OpenGradient) – Short Technical View
Support: $0.15, then $0.14
Resistance: $0.18, then $0.20
A break above $0.18 could open the way toward $0.22–$0.25.
A drop below $0.15 may signal further downside pressure.
Current market structure is neutral to bullish while price remains above key support.
Entry: $0.14
Suggested Stop Loss: $0.132–$0.135 (depends on your risk tolerance)
Target 1: $0.18
Target 2: $0.20
Target 3: $0.22–$0.25 (if bullish momentum continues)
Risk-to-reward improves if the price stays above $0.14 and holds support. Consider moving your stop loss to breakeven once the price reaches your first
OPGUSDT (OpenGradient) – Short Technical View
Support: $0.15, then $0.14
Resistance: $0.18, then $0.20
A break above $0.18 could open the way toward $0.22–$0.25.
A drop below $0.15 may signal further downside pressure.
Current market structure is neutral to bullish while price remains above key support.
Entry: $0.14
Suggested Stop Loss: $0.132–$0.135 (depends on your risk tolerance)
Target 1: $0.18
Target 2: $0.20
Target 3: $0.22–$0.25 (if bullish momentum continues)
Risk-to-reward improves if the price stays above $0.14 and holds support. Consider moving your stop loss to breakeven once the price reaches your first
97
#bedrock $BR
BR (Bedrock) Today Update – June 13, 2026
Current price: Around $0.13 per BR. Recent market data shows BR trading near $0.128–$0.131.
CoinMarketCap
24h performance: BR is under short-term selling pressure, down roughly 3%–11% over the last 24 hours depending on the exchange and measurement time.
CoinMarketCap
Market cap: Approximately $33 million with about 261 million BR in circulation.
CoinMarketCap
Recent developments: Bedrock continues expanding its BTCFi and liquid-restaking ecosystem. Community attention remains focused on Bedrock 2.0 and Bitcoin yield products.
KuCoin
Key levels:
Support: $0.12
Resistance: $0.14–$0.15
A break above $0.15 could improve bullish momentum, while a drop below $0.12 may lead to further weakness.
CoinMarketCap
Short-term outlook: Neutral to slightly bearish while price remains below the $0.14–$0.15 resistance zone.
#bedrock $BR
BR (Bedrock) Today Update – June 13, 2026
Current price: Around $0.13 per BR. Recent market data shows BR trading near $0.128–$0.131.
CoinMarketCap
24h performance: BR is under short-term selling pressure, down roughly 3%–11% over the last 24 hours depending on the exchange and measurement time.
CoinMarketCap
Market cap: Approximately $33 million with about 261 million BR in circulation.
CoinMarketCap
Recent developments: Bedrock continues expanding its BTCFi and liquid-restaking ecosystem. Community attention remains focused on Bedrock 2.0 and Bitcoin yield products.
KuCoin
Key levels:
Support: $0.12
Resistance: $0.14–$0.15
A break above $0.15 could improve bullish momentum, while a drop below $0.12 may lead to further weakness.
CoinMarketCap
Short-term outlook: Neutral to slightly bearish while price remains below the $0.14–$0.15 resistance zone.
BR (Bedrock) Today Update – June 13, 2026
Current price: Around $0.13 per BR. Recent market data shows BR trading near $0.128–$0.131.
CoinMarketCap
24h performance: BR is under short-term selling pressure, down roughly 3%–11% over the last 24 hours depending on the exchange and measurement time.
CoinMarketCap
Market cap: Approximately $33 million with about 261 million BR in circulation.
CoinMarketCap
Recent developments: Bedrock continues expanding its BTCFi and liquid-restaking ecosystem. Community attention remains focused on Bedrock 2.0 and Bitcoin yield products.
KuCoin
Key levels:
Support: $0.12
Resistance: $0.14–$0.15
A break above $0.15 could improve bullish momentum, while a drop below $0.12 may lead to further weakness.
CoinMarketCap
Short-term outlook: Neutral to slightly bearish while price remains below the $0.14–$0.15 resistance zone.
1
83
#bedrock $BR
Bedrock (BR)
Current price is trading roughly between $0.10–$0.11.
CoinMarketCap
Over the last 24 hours, we’ve seen a dip of about 7–10% in price.
CoinMarketCap
Short-term market sentiment looks Bearish right now.
CoinMarketCap
Trading levels (estimated):
Support: $0.10
Next support: $0.095
Resistance: $0.115–$0.12
If
BR stays above $0.10, we could see a relief bounce,
while breaking below $0.10 increases the likelihood of further downside.
#bedrock $BR
Bedrock (BR)
Current price is trading roughly between $0.10–$0.11.
CoinMarketCap
Over the last 24 hours, we’ve seen a dip of about 7–10% in price.
CoinMarketCap
Short-term market sentiment looks Bearish right now.
CoinMarketCap
Trading levels (estimated):
Support: $0.10
Next support: $0.095
Resistance: $0.115–$0.12
If
BR stays above $0.10, we could see a relief bounce,
while breaking below $0.10 increases the likelihood of further downside.
Bedrock (BR)
Current price is trading roughly between $0.10–$0.11.
CoinMarketCap
Over the last 24 hours, we’ve seen a dip of about 7–10% in price.
CoinMarketCap
Short-term market sentiment looks Bearish right now.
CoinMarketCap
Trading levels (estimated):
Support: $0.10
Next support: $0.095
Resistance: $0.115–$0.12
If
BR stays above $0.10, we could see a relief bounce,
while breaking below $0.10 increases the likelihood of further downside.
71
#bedrock $BR
Bedrock (BR) – Today's Market Position
BR is trading around $0.11–$0.12 with a market capitalization near $30 million.
Binance
Short-term trend: Neutral to slightly bearish after recent volatility and profit-taking.
CoinMarketCap +1
Key support: $0.10–$0.11
Key resistance: $0.12–$0.13
A break above $0.13 could trigger a bullish move, while a drop below $0.10 may increase selling pressure.
CoinGecko
Trading Bias Today: 🟡 Neutral
Above resistance → Bullish
Below support → Bearish
If you're trading BRUSDT.P, tell me your entry price and timeframe (scalp, intraday, or swing), and I can give a more specific setup.
#bedrock $BR
Bedrock (BR) – Today's Market Position
BR is trading around $0.11–$0.12 with a market capitalization near $30 million.
Binance
Short-term trend: Neutral to slightly bearish after recent volatility and profit-taking.
CoinMarketCap +1
Key support: $0.10–$0.11
Key resistance: $0.12–$0.13
A break above $0.13 could trigger a bullish move, while a drop below $0.10 may increase selling pressure.
CoinGecko
Trading Bias Today: 🟡 Neutral
Above resistance → Bullish
Below support → Bearish
If you're trading BRUSDT.P, tell me your entry price and timeframe (scalp, intraday, or swing), and I can give a more specific setup.
Bedrock (BR) – Today's Market Position
BR is trading around $0.11–$0.12 with a market capitalization near $30 million.
Binance
Short-term trend: Neutral to slightly bearish after recent volatility and profit-taking.
CoinMarketCap +1
Key support: $0.10–$0.11
Key resistance: $0.12–$0.13
A break above $0.13 could trigger a bullish move, while a drop below $0.10 may increase selling pressure.
CoinGecko
Trading Bias Today: 🟡 Neutral
Above resistance → Bullish
Below support → Bearish
If you're trading BRUSDT.P, tell me your entry price and timeframe (scalp, intraday, or swing), and I can give a more specific setup.
67
BTCUSDT.P Today (10 June 2026)
Bitcoin remains under short-term bearish pressure after a sharp decline earlier this month. Market sentiment is cautious while BTC trades around the major psychological support zone near $60,000–62,000.
Reuters
Key Levels
Support: $60,000 → $58,000 → $50,000 (major downside target if support breaks)
Reuters
Resistance: $63,000 → $66,000 → $75,000
The Economic Times
Current Position Bias
Above $62K–63K: Neutral to bullish recovery.
Below $60K: Bearish continuation likely.
Intraday traders should watch for rejection around resistance and strong reactions at support.
Reuters
Trading View
Scalp: Buy near support only if volume increases.
Swing: Wait for a confirmed breakout above resistance or a breakdown below support before entering larger positions.
BTCUSDT.P Today (10 June 2026)
Bitcoin remains under short-term bearish pressure after a sharp decline earlier this month. Market sentiment is cautious while BTC trades around the major psychological support zone near $60,000–62,000.
Reuters
Key Levels
Support: $60,000 → $58,000 → $50,000 (major downside target if support breaks)
Reuters
Resistance: $63,000 → $66,000 → $75,000
The Economic Times
Current Position Bias
Above $62K–63K: Neutral to bullish recovery.
Below $60K: Bearish continuation likely.
Intraday traders should watch for rejection around resistance and strong reactions at support.
Reuters
Trading View
Scalp: Buy near support only if volume increases.
Swing: Wait for a confirmed breakout above resistance or a breakdown below support before entering larger positions.
Bitcoin remains under short-term bearish pressure after a sharp decline earlier this month. Market sentiment is cautious while BTC trades around the major psychological support zone near $60,000–62,000.
Reuters
Key Levels
Support: $60,000 → $58,000 → $50,000 (major downside target if support breaks)
Reuters
Resistance: $63,000 → $66,000 → $75,000
The Economic Times
Current Position Bias
Above $62K–63K: Neutral to bullish recovery.
Below $60K: Bearish continuation likely.
Intraday traders should watch for rejection around resistance and strong reactions at support.
Reuters
Trading View
Scalp: Buy near support only if volume increases.
Swing: Wait for a confirmed breakout above resistance or a breakdown below support before entering larger positions.
38
Crypto Market Position (Today)
📉 Overall Market Sentiment: Bearish to Neutral
Bitcoin (BTC) is trading around the low-$60K range after a sharp correction from its 2025 highs.
The Economic Times
Many altcoins remain under pressure, and recent liquidations have mostly hit long positions.
The Crypto Times
Market sentiment has recently been in Fear / Extreme Fear territory, which indicates caution among traders.
Reddit
Some positive signs include renewed ETF inflows and institutional buying, which have helped BTC rebound from recent lows.
Crypto Market Position (Today)
📉 Overall Market Sentiment: Bearish to Neutral
Bitcoin (BTC) is trading around the low-$60K range after a sharp correction from its 2025 highs.
The Economic Times
Many altcoins remain under pressure, and recent liquidations have mostly hit long positions.
The Crypto Times
Market sentiment has recently been in Fear / Extreme Fear territory, which indicates caution among traders.
Reddit
Some positive signs include renewed ETF inflows and institutional buying, which have helped BTC rebound from recent lows.
📉 Overall Market Sentiment: Bearish to Neutral
Bitcoin (BTC) is trading around the low-$60K range after a sharp correction from its 2025 highs.
The Economic Times
Many altcoins remain under pressure, and recent liquidations have mostly hit long positions.
The Crypto Times
Market sentiment has recently been in Fear / Extreme Fear territory, which indicates caution among traders.
Some positive signs include renewed ETF inflows and institutional buying, which have helped BTC rebound from recent lows.
39
#bedrock $BR
BRUSDT.P (Bedrock/USDT Perpetual) Technical Outlook
Nearest Support: 0.165 – 0.170 USDT
Next Support: 0.145 USDT
Nearest Resistance: 0.185 USDT
Strong Resistance: 0.200 USDT
Short-term view:
A breakout above 0.185 USDT could signal further bullish momentum.
A drop below 0.165 USDT could increase the risk of a deeper correction.
#bedrock $BR
BRUSDT.P (Bedrock/USDT Perpetual) Technical Outlook
Nearest Support: 0.165 – 0.170 USDT
Next Support: 0.145 USDT
Nearest Resistance: 0.185 USDT
Strong Resistance: 0.200 USDT
Short-term view:
A breakout above 0.185 USDT could signal further bullish momentum.
A drop below 0.165 USDT could increase the risk of a deeper correction.
BRUSDT.P (Bedrock/USDT Perpetual) Technical Outlook
Nearest Support: 0.165 – 0.170 USDT
Next Support: 0.145 USDT
Nearest Resistance: 0.185 USDT
Strong Resistance: 0.200 USDT
Short-term view:
A breakout above 0.185 USDT could signal further bullish momentum.
A drop below 0.165 USDT could increase the risk of a deeper correction.
44
#bedrock $BR
BRUSDT (Bedrock) Technical Analysis
Based on recent market structure, BR is trading in a volatile range with key support and resistance zones identified by traders.
TradingView +1
Support Levels
First support: 0.077
Strong support: 0.062
Major support: 0.049
TradingView
Resistance Levels
First resistance: 0.088
Breakout resistance: 0.10
Major resistance: 0.12+
TradingView +1
Short-Term Outlook
Above 0.088 → bullish momentum may continue toward 0.10–0.12.
Below 0.077 → bearish pressure could increase toward 0.062.
#bedrock $BR
BRUSDT (Bedrock) Technical Analysis
Based on recent market structure, BR is trading in a volatile range with key support and resistance zones identified by traders.
TradingView +1
Support Levels
First support: 0.077
Strong support: 0.062
Major support: 0.049
TradingView
Resistance Levels
First resistance: 0.088
Breakout resistance: 0.10
Major resistance: 0.12+
TradingView +1
Short-Term Outlook
Above 0.088 → bullish momentum may continue toward 0.10–0.12.
Below 0.077 → bearish pressure could increase toward 0.062.
BRUSDT (Bedrock) Technical Analysis
Based on recent market structure, BR is trading in a volatile range with key support and resistance zones identified by traders.
TradingView +1
Support Levels
First support: 0.077
Strong support: 0.062
Major support: 0.049
TradingView
Resistance Levels
First resistance: 0.088
Breakout resistance: 0.10
Major resistance: 0.12+
TradingView +1
Short-Term Outlook
Above 0.088 → bullish momentum may continue toward 0.10–0.12.
Below 0.077 → bearish pressure could increase toward 0.062.
32
ETH
1. **Price Trend**: Look at the recent price trend on the chart to identify any upward or downward movements.
2. **Technical Indicators**: Use tools like moving averages (e.g., 50-day and 200-day) and RSI to gauge momentum and potential reversal points.
3. **Support and Resistance Levels**: Identify key support and resistance levels that have historically impacted price movement.
4. **Market News**: Stay updated on Ethereum-related news, such as upgrades (like Ethereum 2.0), adoption by platforms, and regulatory news that may influence price.
ETH
1. **Price Trend**: Look at the recent price trend on the chart to identify any upward or downward movements.
2. **Technical Indicators**: Use tools like moving averages (e.g., 50-day and 200-day) and RSI to gauge momentum and potential reversal points.
3. **Support and Resistance Levels**: Identify key support and resistance levels that have historically impacted price movement.
4. **Market News**: Stay updated on Ethereum-related news, such as upgrades (like Ethereum 2.0), adoption by platforms, and regulatory news that may influence price.
1. **Price Trend**: Look at the recent price trend on the chart to identify any upward or downward movements.
2. **Technical Indicators**: Use tools like moving averages (e.g., 50-day and 200-day) and RSI to gauge momentum and potential reversal points.
3. **Support and Resistance Levels**: Identify key support and resistance levels that have historically impacted price movement.
4. **Market News**: Stay updated on Ethereum-related news, such as upgrades (like Ethereum 2.0), adoption by platforms, and regulatory news that may influence price.
72
Bitcoin
1. **Technical Indicators**: Look at trends, support and resistance levels, moving averages, and RSI (Relative Strength Index) for potential price action signals.
2. **Market Sentiment**: Assess the overall market mood through social media trends, fear and greed indexes, and trading volume.
3. **Fundamental Analysis**: Consider developments like regulatory news, adoption rates, and macroeconomic factors that could affect demand.
4. **Historical Patterns**: Review past price movements and cycles, which may provide insights into potential future behavior.
For the latest insights, check reputable financial news sources or analysis platforms, as the BTC market can change rapidly.
Bitcoin
1. **Technical Indicators**: Look at trends, support and resistance levels, moving averages, and RSI (Relative Strength Index) for potential price action signals.
2. **Market Sentiment**: Assess the overall market mood through social media trends, fear and greed indexes, and trading volume.
3. **Fundamental Analysis**: Consider developments like regulatory news, adoption rates, and macroeconomic factors that could affect demand.
4. **Historical Patterns**: Review past price movements and cycles, which may provide insights into potential future behavior.
For the latest insights, check reputable financial news sources or analysis platforms, as the BTC market can change rapidly.
1. **Technical Indicators**: Look at trends, support and resistance levels, moving averages, and RSI (Relative Strength Index) for potential price action signals.
2. **Market Sentiment**: Assess the overall market mood through social media trends, fear and greed indexes, and trading volume.
3. **Fundamental Analysis**: Consider developments like regulatory news, adoption rates, and macroeconomic factors that could affect demand.
4. **Historical Patterns**: Review past price movements and cycles, which may provide insights into potential future behavior.
For the latest insights, check reputable financial news sources or analysis platforms, as the BTC market can change rapidly.
79
#genius $GENIUS
Genius is a project associated with Binance that involves decentralized finance (DeFi) and gaming elements. It typically allows users to earn rewards through gameplay and staking while interacting with various DeFi protocols. If you're looking for specific features, benefits, or updates related to Genius on Binance link with me
#genius $GENIUS
Genius is a project associated with Binance that involves decentralized finance (DeFi) and gaming elements. It typically allows users to earn rewards through gameplay and staking while interacting with various DeFi protocols. If you're looking for specific features, benefits, or updates related to Genius on Binance link with me
Genius is a project associated with Binance that involves decentralized finance (DeFi) and gaming elements. It typically allows users to earn rewards through gameplay and staking while interacting with various DeFi protocols. If you're looking for specific features, benefits, or updates related to Genius on Binance link with me
6
#bedrock $BR Bedrock is a decentralized application (dApp) infrastructure that aims to simplify the development of blockchain applications on Binance Smart Chain (BSC) and other networks. It offers tools and frameworks to make it easier for developers to create and deploy smart contracts.
#bedrock $BR Bedrock is a decentralized application (dApp) infrastructure that aims to simplify the development of blockchain applications on Binance Smart Chain (BSC) and other networks. It offers tools and frameworks to make it easier for developers to create and deploy smart contracts.
78
Lunc burn 448 billion tokens
Lunc burn 448 billion tokens

Crypto Signals Hunter
·
--
BullishNobody is talking about this LUNC number.
So I will.
448,190,000,000 LUNC burned.
Read that again.
448 BILLION tokens.
Gone forever.
Never coming back.
Permanently removed from supply.
And it happened while everyone was sleeping.
While people called LUNC dead —
The community was burning.
While influencers moved to next shiny coin —
The community was burning.
While crypto twitter laughed —
The community was burning.
Every single day — 304 Million tokens disappear forever.
That is not a dead community.
That is an army that never stops. 💪
Now add this to the equation —
🔥 Mint switch permanently OFF
🔥 Total supply locked at 6.46 Trillion
🔥 Circulating supply down to 5.56 Trillion
🔥 On-chain tax burning 0.2% continuously
🔥 448 Billion already gone forever
The supply is shrinking.
Every single day.
Without stopping.
Without reversing.
Basic economics has only one answer for this.
Are you paying attention? 👇
Save this before you scroll away. 🙏
Tag a LUNC holder who needs these real numbers. 💎
#LUNC #LUNCBurn #TerraLunaClassic #BinanceSquare #CryptoGems #Altcoins #Bitcoin #Web3 #DYOR #LUNCArmy
So I will.
448,190,000,000 LUNC burned.
Read that again.
448 BILLION tokens.
Gone forever.
Never coming back.
Permanently removed from supply.
And it happened while everyone was sleeping.
While people called LUNC dead —
The community was burning.
While influencers moved to next shiny coin —
The community was burning.
While crypto twitter laughed —
The community was burning.
Every single day — 304 Million tokens disappear forever.
That is not a dead community.
That is an army that never stops. 💪
Now add this to the equation —
🔥 Mint switch permanently OFF
🔥 Total supply locked at 6.46 Trillion
🔥 Circulating supply down to 5.56 Trillion
🔥 On-chain tax burning 0.2% continuously
🔥 448 Billion already gone forever
The supply is shrinking.
Every single day.
Without stopping.
Without reversing.
Basic economics has only one answer for this.
Are you paying attention? 👇
Save this before you scroll away. 🙏
Tag a LUNC holder who needs these real numbers. 💎
#LUNC #LUNCBurn #TerraLunaClassic #BinanceSquare #CryptoGems #Altcoins #Bitcoin #Web3 #DYOR #LUNCArmy

1
3
264
Bitcoin is currently moving in a tight consolidation zone around $77k–$78k with mixed short-term signals.
Short-term bias (15m–1h):
Slightly bullish while above $77,200
Strong resistance near $77,800–$78,400
If BTC breaks and closes above $77,800 with volume, next push could target $78,400+
If rejected below $77,200, downside may revisit $76,800 → $76,200 �
KuCoin +1
Key levels
Support: 77,200 / 76,800 / 76,200
Resistance: 77,800 / 78,400 �
KuCoin +1
Scalp setup idea
Bullish above: 77,800 breakout
Bearish below: 77,200 breakdown
Bitcoin is currently moving in a tight consolidation zone around $77k–$78k with mixed short-term signals.
Short-term bias (15m–1h):
Slightly bullish while above $77,200
Strong resistance near $77,800–$78,400
If BTC breaks and closes above $77,800 with volume, next push could target $78,400+
If rejected below $77,200, downside may revisit $76,800 → $76,200 �
KuCoin +1
Key levels
Support: 77,200 / 76,800 / 76,200
Resistance: 77,800 / 78,400 �
KuCoin +1
Scalp setup idea
Bullish above: 77,800 breakout
Bearish below: 77,200 breakdown
Short-term bias (15m–1h):
Slightly bullish while above $77,200
Strong resistance near $77,800–$78,400
If BTC breaks and closes above $77,800 with volume, next push could target $78,400+
If rejected below $77,200, downside may revisit $76,800 → $76,200 �
KuCoin +1
Key levels
Support: 77,200 / 76,800 / 76,200
Resistance: 77,800 / 78,400 �
KuCoin +1
Scalp setup idea
Bullish above: 77,800 breakout
Bearish below: 77,200 breakdown
70
click the post and get your reward
click the post and get your reward

callmesae187
·
--
Bullish🔥 BINANCE-STYLE DOUBLE RED PACKET GIVEAWAY! 🔥
Traders, it’s your lucky day 📈✅
We’re dropping TWO FREE Red Packets packed with rewards — don’t fade this opportunity!💥💥
1.CLICK HERE🫵🫵
2.CLICK HERE🫵🫵
💥 What’s inside?
🟥 Red Packet #1 – Surprise rewards & instant bonuses
🟥 Red Packet #2 – Bigger prizes, exclusive perks
#GIVEAWAY🎁 ⏳ First come, first served – once all 500 are claimed, it’s over!
#freeboxgiveaway #free10usdt #RedPacketMission #moneymaker $RIF $BANANAS31 $BTTC
WHAT DO YOU WANT TO WIN??
Traders, it’s your lucky day 📈✅
We’re dropping TWO FREE Red Packets packed with rewards — don’t fade this opportunity!💥💥
1.CLICK HERE🫵🫵
2.CLICK HERE🫵🫵
💥 What’s inside?
🟥 Red Packet #1 – Surprise rewards & instant bonuses
🟥 Red Packet #2 – Bigger prizes, exclusive perks
#GIVEAWAY🎁 ⏳ First come, first served – once all 500 are claimed, it’s over!
#freeboxgiveaway #free10usdt #RedPacketMission #moneymaker $RIF $BANANAS31 $BTTC
WHAT DO YOU WANT TO WIN??
5
Bitcoin (BTC) Technical AnalysisBitcoin is currently trading around the mid-$76K range after rejecting higher resistance near $80K–$82K. Momentum is mixed: the broader trend is recovering from the 2025 correction, but short-term indicators show consolidation and weakening momentum.
Market Structure
Short-term trend (1D): Neutral-to-bullish
Medium-term trend (1W): Bullish recovery structure intact
Momentum: Cooling after recent rally
Volatility: Still elevated
Key Levels
Level TypePrice ZoneImportanceMajor Resistance$81,000 – $84,000Breakout zoneNear Resistance$78,500 – $80,000Sellers activeImmediate Support$75,500 – $76,000Key holding areaStrong Support$72,000 – $74,000Bullish structure supportMacro Support$68,000 – $70,000Long-term demand
Analysts are watching $80K–$81K closely. A confirmed breakout above that zone could open the path toward $84K–$86K.
Indicator Analysis
RSI (Relative Strength Index)
Current daily RSI readings are mostly between 48–66
That suggests:
Not oversold
Not extremely overbought
Momentum still has room upward
Recent reports show RSI cooling after reaching overheated conditions near resistance.
MACD
MACD on several timeframes is flattening
Momentum divergence is appearing
Buyers still control the larger trend, but upside acceleration slowed
Some technical dashboards currently show bearish MACD crossover signals on shorter timeframes.
Moving Averages
BTC remains above the:
50-day EMA
100-day EMA
200-day EMA
This keeps the broader bullish structure valid
The 100-day EMA around the mid-$75K area is currently acting as important dynamic support.
Bullish Scenario
If BTC:
holds above $75K–$76K
breaks $81K resistance with volume
then possible upside targets become:
$84K
$86K
potentially $90K+
Institutional accumulation and ETF participation remain major catalysts.
Bearish Scenario
BTC could weaken if:
price loses $75K support
macro risk sentiment worsens
ETF outflows continue
Then downside targets may become:
$72K
$70K
$68K
Recent ETF outflow data has added short-term pressure.
Trading Outlook
Swing Traders
Bullish above: $76K
Safer breakout entry: Above $81K
Risk zone: below $74K
BTC currently looks range-bound
Likely trading zone:
Support: $76K
Resistance: $80K
Long-Term Investors
The macro structure still favors accumulation while BTC remains above the 200-day EMA and major support zones. Volatility remains high, so position sizing matters.
Bitcoin (BTC) Technical Analysis
Bitcoin is currently trading around the mid-$76K range after rejecting higher resistance near $80K–$82K. Momentum is mixed: the broader trend is recovering from the 2025 correction, but short-term indicators show consolidation and weakening momentum.
Market Structure
Short-term trend (1D): Neutral-to-bullish
Medium-term trend (1W): Bullish recovery structure intact
Momentum: Cooling after recent rally
Volatility: Still elevated
Key Levels
Level TypePrice ZoneImportanceMajor Resistance$81,000 – $84,000Breakout zoneNear Resistance$78,500 – $80,000Sellers activeImmediate Support$75,500 – $76,000Key holding areaStrong Support$72,000 – $74,000Bullish structure supportMacro Support$68,000 – $70,000Long-term demand
Analysts are watching $80K–$81K closely. A confirmed breakout above that zone could open the path toward $84K–$86K.
Indicator Analysis
RSI (Relative Strength Index)
Current daily RSI readings are mostly between 48–66
That suggests:
Not oversold
Not extremely overbought
Momentum still has room upward
Recent reports show RSI cooling after reaching overheated conditions near resistance.
MACD
MACD on several timeframes is flattening
Momentum divergence is appearing
Buyers still control the larger trend, but upside acceleration slowed
Some technical dashboards currently show bearish MACD crossover signals on shorter timeframes.
Moving Averages
BTC remains above the:
50-day EMA
100-day EMA
200-day EMA
This keeps the broader bullish structure valid
The 100-day EMA around the mid-$75K area is currently acting as important dynamic support.
Bullish Scenario
If BTC:
holds above $75K–$76K
breaks $81K resistance with volume
then possible upside targets become:
$84K
$86K
potentially $90K+
Institutional accumulation and ETF participation remain major catalysts.
Bearish Scenario
BTC could weaken if:
price loses $75K support
macro risk sentiment worsens
ETF outflows continue
Then downside targets may become:
$72K
$70K
$68K
Recent ETF outflow data has added short-term pressure.
Trading Outlook
Swing Traders
Bullish above: $76K
Safer breakout entry: Above $81K
Risk zone: below $74K
BTC currently looks range-bound
Likely trading zone:
Support: $76K
Resistance: $80K
Long-Term Investors
The macro structure still favors accumulation while BTC remains above the 200-day EMA and major support zones. Volatility remains high, so position sizing matters.
Market Structure
Short-term trend (1D): Neutral-to-bullish
Medium-term trend (1W): Bullish recovery structure intact
Momentum: Cooling after recent rally
Volatility: Still elevated
Key Levels
Level TypePrice ZoneImportanceMajor Resistance$81,000 – $84,000Breakout zoneNear Resistance$78,500 – $80,000Sellers activeImmediate Support$75,500 – $76,000Key holding areaStrong Support$72,000 – $74,000Bullish structure supportMacro Support$68,000 – $70,000Long-term demand
Analysts are watching $80K–$81K closely. A confirmed breakout above that zone could open the path toward $84K–$86K.
Indicator Analysis
RSI (Relative Strength Index)
Current daily RSI readings are mostly between 48–66
That suggests:
Not oversold
Not extremely overbought
Momentum still has room upward
Recent reports show RSI cooling after reaching overheated conditions near resistance.
MACD
MACD on several timeframes is flattening
Momentum divergence is appearing
Buyers still control the larger trend, but upside acceleration slowed
Some technical dashboards currently show bearish MACD crossover signals on shorter timeframes.
Moving Averages
BTC remains above the:
50-day EMA
100-day EMA
200-day EMA
This keeps the broader bullish structure valid
The 100-day EMA around the mid-$75K area is currently acting as important dynamic support.
Bullish Scenario
If BTC:
holds above $75K–$76K
breaks $81K resistance with volume
then possible upside targets become:
$84K
$86K
potentially $90K+
Institutional accumulation and ETF participation remain major catalysts.
Bearish Scenario
BTC could weaken if:
price loses $75K support
macro risk sentiment worsens
ETF outflows continue
Then downside targets may become:
$72K
$70K
$68K
Recent ETF outflow data has added short-term pressure.
Trading Outlook
Swing Traders
Bullish above: $76K
Safer breakout entry: Above $81K
Risk zone: below $74K
BTC currently looks range-bound
Likely trading zone:
Support: $76K
Resistance: $80K
Long-Term Investors
The macro structure still favors accumulation while BTC remains above the 200-day EMA and major support zones. Volatility remains high, so position sizing matters.
67
Prom Next MovePROMUSDT Technical Analysis
Current market structure for PROMUSDT looks bearish-to-neutral across most major indicators, especially on higher timeframes. Multiple technical sources currently show Strong Sell / Sell conditions with weak momentum and price trading below key moving averages.
Trend Overview
Short-term trend: Weak bearish
Mid-term trend: Bearish unless major resistance breaks
Long-term trend: Still under heavy pressure below 200 MA
Key Indicators
RSI mostly between 28–46 → weak momentum / near oversold zone.
MACD remains bearish on several timeframes.
Moving averages are largely flashing sell signals.
ADX suggests the trend exists but is not extremely strong yet.
Important Support & Resistance
Based on aggregated pivot and technical levels:
Level TypePrice ZoneImmediate Support$1.03 – $1.06Strong Support$0.92 – $0.96Near Resistance$1.13 – $1.23Major Resistance$1.56 – $2.25
Technical Setup
If price holds above support around $1.00, a relief bounce toward $1.20–$1.50 is possible.
If price breaks below $0.92, bearish continuation could accelerate.
Bulls need a clean breakout above the resistance region to shift momentum bullish again.
Chart Logic
Support and resistance work because traders repeatedly react around previous high-volume price zones.
Risk Perspective
PROM is currently highly volatile and still far below historical highs, so risk management is important:
Use stop losses
Avoid overleveraging
Watch Bitcoin trend correlation, since PROM tends to follow broader crypto sentiment.
If you want, I can also provide:
Prom Next Move
PROMUSDT Technical Analysis
Current market structure for PROMUSDT looks bearish-to-neutral across most major indicators, especially on higher timeframes. Multiple technical sources currently show Strong Sell / Sell conditions with weak momentum and price trading below key moving averages.
Trend Overview
Short-term trend: Weak bearish
Mid-term trend: Bearish unless major resistance breaks
Long-term trend: Still under heavy pressure below 200 MA
Key Indicators
RSI mostly between 28–46 → weak momentum / near oversold zone.
MACD remains bearish on several timeframes.
Moving averages are largely flashing sell signals.
ADX suggests the trend exists but is not extremely strong yet.
Important Support & Resistance
Based on aggregated pivot and technical levels:
Level TypePrice ZoneImmediate Support$1.03 – $1.06Strong Support$0.92 – $0.96Near Resistance$1.13 – $1.23Major Resistance$1.56 – $2.25
Technical Setup
If price holds above support around $1.00, a relief bounce toward $1.20–$1.50 is possible.
If price breaks below $0.92, bearish continuation could accelerate.
Bulls need a clean breakout above the resistance region to shift momentum bullish again.
Chart Logic
Support and resistance work because traders repeatedly react around previous high-volume price zones.
Risk Perspective
PROM is currently highly volatile and still far below historical highs, so risk management is important:
Use stop losses
Avoid overleveraging
Watch Bitcoin trend correlation, since PROM tends to follow broader crypto sentiment.
If you want, I can also provide:
Current market structure for PROMUSDT looks bearish-to-neutral across most major indicators, especially on higher timeframes. Multiple technical sources currently show Strong Sell / Sell conditions with weak momentum and price trading below key moving averages.
Trend Overview
Short-term trend: Weak bearish
Mid-term trend: Bearish unless major resistance breaks
Long-term trend: Still under heavy pressure below 200 MA
Key Indicators
RSI mostly between 28–46 → weak momentum / near oversold zone.
MACD remains bearish on several timeframes.
Moving averages are largely flashing sell signals.
ADX suggests the trend exists but is not extremely strong yet.
Important Support & Resistance
Based on aggregated pivot and technical levels:
Level TypePrice ZoneImmediate Support$1.03 – $1.06Strong Support$0.92 – $0.96Near Resistance$1.13 – $1.23Major Resistance$1.56 – $2.25
Technical Setup
If price holds above support around $1.00, a relief bounce toward $1.20–$1.50 is possible.
If price breaks below $0.92, bearish continuation could accelerate.
Bulls need a clean breakout above the resistance region to shift momentum bullish again.
Chart Logic
Support and resistance work because traders repeatedly react around previous high-volume price zones.
Risk Perspective
PROM is currently highly volatile and still far below historical highs, so risk management is important:
Use stop losses
Avoid overleveraging
Watch Bitcoin trend correlation, since PROM tends to follow broader crypto sentiment.
If you want, I can also provide:
306
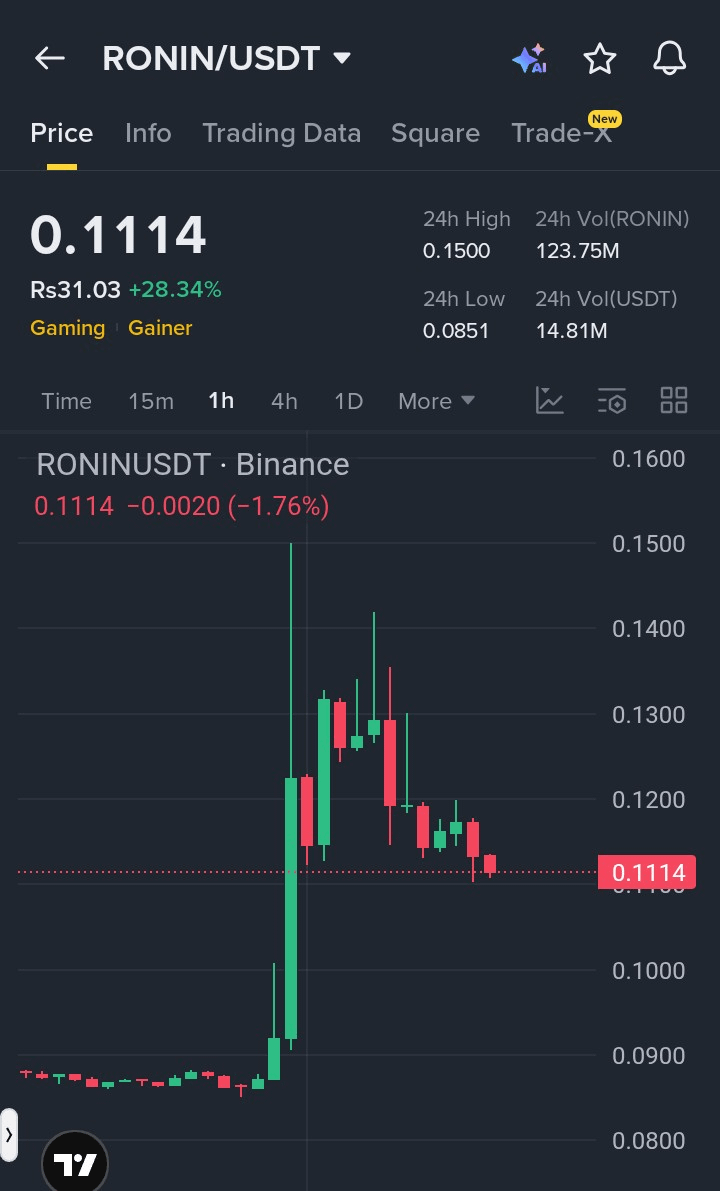
Ronin (RON) Technical AnalysisRonin (RON) is currently trading around $0.11 after bouncing from the February 2026 low near $0.08. The token is still deeply below its 2024 ATH near $4.50, which means long-term trend remains
Ronin (RON) Technical AnalysisRonin (RON) is currently trading around $0.11 after bouncing from the February 2026 low near $0.08. The token is still deeply below its 2024 ATH near $4.50, which means long-term trend remains


Eliza Ross
·
--
Bearish$RONIN has cooled down after a strong +28% impulsive move and is now showing signs of exhaustion around the $0.11 region. Price rejection from higher levels suggests early distribution, with sellers gradually taking control after the explosive rally.
If the market fails to reclaim $0.115, downside pressure may continue as liquidity below $0.11 gets tested. This phase often follows sharp pumps where profit-taking triggers a structured pullback.
Trade Setup (Bearish Bias):
Entry Zone: $0.110 – $0.113 (rejection zone)
Breakdown Confirmation: Below $0.108
Take Profits:
TP1: $0.105
TP2: $0.100
TP3: $0.095 – $0.090
Stop Loss: $0.118
RONIN is showing early weakness after a parabolic move — failure to hold current support could trigger a deeper correction phase.
Buy now and trade here on $RONIN
#RONIN #CryptoAnalysis #BearishSetup #MarketCorrection
If the market fails to reclaim $0.115, downside pressure may continue as liquidity below $0.11 gets tested. This phase often follows sharp pumps where profit-taking triggers a structured pullback.
Trade Setup (Bearish Bias):
Entry Zone: $0.110 – $0.113 (rejection zone)
Breakdown Confirmation: Below $0.108
Take Profits:
TP1: $0.105
TP2: $0.100
TP3: $0.095 – $0.090
Stop Loss: $0.118
RONIN is showing early weakness after a parabolic move — failure to hold current support could trigger a deeper correction phase.
Buy now and trade here on $RONIN
#RONIN #CryptoAnalysis #BearishSetup #MarketCorrection
72
iran and u.s war newsU.S. President Donald Trump announced that Saudi Arabia, Qatar, the UAE, and other countries requested a delay of two to three days for a military strike on Iran, believing a U.S.-Iran agreement is close. According to Odaily, Trump stated at a White House event that the U.S. was prepared for a 'very significant' attack on Iran on the 19th. However, he decided to postpone it, hoping the delay might be permanent, though it could be temporary. Trump mentioned that significant discussions with Iran are underway, and the outcome remains to be seen.
Trump noted some 'very positive developments' in the negotiations, with Gulf allies having the opportunity to facilitate an agreement. He also remarked that the current situation differs slightly from previous instances when the U.S. believed an agreement with Iran was imminent.
iran and u.s war news
U.S. President Donald Trump announced that Saudi Arabia, Qatar, the UAE, and other countries requested a delay of two to three days for a military strike on Iran, believing a U.S.-Iran agreement is close. According to Odaily, Trump stated at a White House event that the U.S. was prepared for a 'very significant' attack on Iran on the 19th. However, he decided to postpone it, hoping the delay might be permanent, though it could be temporary. Trump mentioned that significant discussions with Iran are underway, and the outcome remains to be seen.
Trump noted some 'very positive developments' in the negotiations, with Gulf allies having the opportunity to facilitate an agreement. He also remarked that the current situation differs slightly from previous instances when the U.S. believed an agreement with Iran was imminent.
Trump noted some 'very positive developments' in the negotiations, with Gulf allies having the opportunity to facilitate an agreement. He also remarked that the current situation differs slightly from previous instances when the U.S. believed an agreement with Iran was imminent.
29
Log in to explore more content
Join global crypto users on Binance Square
⚡️ Get latest and useful information about crypto.
💬 Trusted by the world’s largest crypto exchange.
👍 Discover real insights from verified creators.
Email / Phone number
Trending Topics
NvidiaInvestigatesAfterHuang’sAffairApology
123,577 views
1,311 Discussing
Nvidia Board Opens Probe Into Whether Huang Was Target of Foreign Intelligence Effort
Binance News
·14 Likes
·50.1k views
BitcoinFiveWeeklyLosses
153,359 views
1,789 Discussing
AIChipSlumpNasdaq
79,449 views
1,116 Discussing