
solomon_
39 Posts

solomon_
Report
Block User
4 Following
17 Followers
20 Liked
Posts
·
--
Bearish
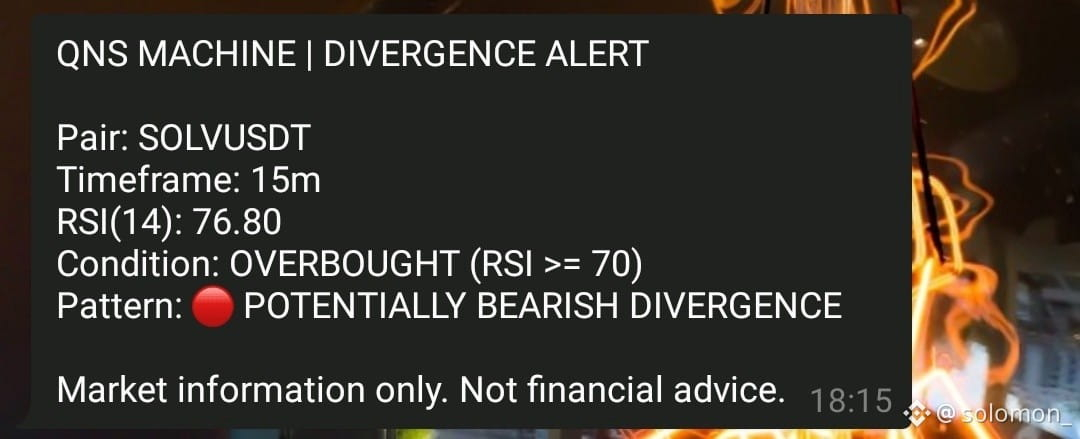
$SOLV | Is Another Sell-Off Coming?
$SOLV remains vulnerable to downside volatility, particularly if buying pressure fails to absorb selling activity.
The key question: Are buyers defending support, or simply delaying another breakdown?
A confirmed break below support, accompanied by rising volume, would strengthen the bearish case.
Until buyers reclaim resistance with conviction, downside risk deserves close attention.
A bounce is not a reversal.
{future}(SOLVUSDT)
$SOLV | Is Another Sell-Off Coming?
$SOLV remains vulnerable to downside volatility, particularly if buying pressure fails to absorb selling activity.
The key question: Are buyers defending support, or simply delaying another breakdown?
A confirmed break below support, accompanied by rising volume, would strengthen the bearish case.
Until buyers reclaim resistance with conviction, downside risk deserves close attention.
A bounce is not a reversal.
$SOLV remains vulnerable to downside volatility, particularly if buying pressure fails to absorb selling activity.
The key question: Are buyers defending support, or simply delaying another breakdown?
A confirmed break below support, accompanied by rising volume, would strengthen the bearish case.
Until buyers reclaim resistance with conviction, downside risk deserves close attention.
A bounce is not a reversal.
174
·
--
$ONDO | 4H Technical Analysis
ONDO remains under bearish pressure, trading around $0.367. RSI(14) near 48 indicates neutral momentum, while the EMA structure remains bearish.
Key support: $0.343
Key resistance: $0.411
A confirmed breakout above resistance could improve the bullish outlook. Losing support would increase downside risk.
Current bias: Bearish to Neutral.
$ONDO | 4H Technical Analysis
ONDO remains under bearish pressure, trading around $0.367. RSI(14) near 48 indicates neutral momentum, while the EMA structure remains bearish.
Key support: $0.343
Key resistance: $0.411
A confirmed breakout above resistance could improve the bullish outlook. Losing support would increase downside risk.
Current bias: Bearish to Neutral.
ONDO remains under bearish pressure, trading around $0.367. RSI(14) near 48 indicates neutral momentum, while the EMA structure remains bearish.
Key support: $0.343
Key resistance: $0.411
A confirmed breakout above resistance could improve the bullish outlook. Losing support would increase downside risk.
Current bias: Bearish to Neutral.
282
·
--
US CPI OCTOBER 2026: INFLATION SLOWS, BUT PRESSURES REMAIN
The latest US inflation report shows CPI rising 0.4% month-over-month, slowing from 0.6% in September.
However, price pressures remain:
- Energy: +0.7%
- Food: +0.5%
- Shelter: +0.3%
What does this mean for Bitcoin and the crypto market?
Slower inflation could strengthen expectations of monetary easing by the Federal Reserve. However, persistent inflation may keep interest rates elevated for longer.
For Bitcoin, market direction depends not only on CPI but also on interest rate expectations, liquidity, and capital flows.
Slower inflation does not automatically mean a bullish market.
Source: US Bureau of Labor Statistics, November 10, 2026.
#HotCPIDecemberHikePriced
US CPI OCTOBER 2026: INFLATION SLOWS, BUT PRESSURES REMAIN
The latest US inflation report shows CPI rising 0.4% month-over-month, slowing from 0.6% in September.
However, price pressures remain:
- Energy: +0.7%
- Food: +0.5%
- Shelter: +0.3%
What does this mean for Bitcoin and the crypto market?
Slower inflation could strengthen expectations of monetary easing by the Federal Reserve. However, persistent inflation may keep interest rates elevated for longer.
For Bitcoin, market direction depends not only on CPI but also on interest rate expectations, liquidity, and capital flows.
Slower inflation does not automatically mean a bullish market.
Source: US Bureau of Labor Statistics, November 10, 2026.
#HotCPIDecemberHikePriced
The latest US inflation report shows CPI rising 0.4% month-over-month, slowing from 0.6% in September.
However, price pressures remain:
- Energy: +0.7%
- Food: +0.5%
- Shelter: +0.3%
What does this mean for Bitcoin and the crypto market?
Slower inflation could strengthen expectations of monetary easing by the Federal Reserve. However, persistent inflation may keep interest rates elevated for longer.
For Bitcoin, market direction depends not only on CPI but also on interest rate expectations, liquidity, and capital flows.
Slower inflation does not automatically mean a bullish market.
Source: US Bureau of Labor Statistics, November 10, 2026.
#HotCPIDecemberHikePriced

119
·
--
OLD COINS vs NEW COINS: A FUNDAMENTAL PERSPECTIVE
Older cryptocurrencies like BTC, ETH, and LTC have survived multiple market cycles, providing years of evidence on security, adoption, and liquidity.
Newer coins may introduce better technology and faster-growing ecosystems, but innovation doesn't guarantee token value.
The biggest risks for newer tokens often include limited operating history, high valuations, and future supply unlocks.
Meanwhile, older coins face their own challenges: slower innovation, competition, and declining relevance.
The real question isn't which coin is older. It's which network creates sustainable demand for its token.
Age provides history. Fundamentals determine value.
QNS MACHINE | Market Insight
OLD COINS vs NEW COINS: A FUNDAMENTAL PERSPECTIVE
Older cryptocurrencies like BTC, ETH, and LTC have survived multiple market cycles, providing years of evidence on security, adoption, and liquidity.
Newer coins may introduce better technology and faster-growing ecosystems, but innovation doesn't guarantee token value.
The biggest risks for newer tokens often include limited operating history, high valuations, and future supply unlocks.
Meanwhile, older coins face their own challenges: slower innovation, competition, and declining relevance.
The real question isn't which coin is older. It's which network creates sustainable demand for its token.
Age provides history. Fundamentals determine value.
QNS MACHINE | Market Insight
Older cryptocurrencies like BTC, ETH, and LTC have survived multiple market cycles, providing years of evidence on security, adoption, and liquidity.
Newer coins may introduce better technology and faster-growing ecosystems, but innovation doesn't guarantee token value.
The biggest risks for newer tokens often include limited operating history, high valuations, and future supply unlocks.
Meanwhile, older coins face their own challenges: slower innovation, competition, and declining relevance.
The real question isn't which coin is older. It's which network creates sustainable demand for its token.
Age provides history. Fundamentals determine value.
QNS MACHINE | Market Insight

124
·
--
Bullish
$ONDO should be recovered fastest than others.
$ONDO should be recovered fastest than others.
1
232
·
--
Who can resist taking a position in ONDO after this correction? 👀
$ONDO
Who can resist taking a position in ONDO after this correction? 👀
$ONDO
$ONDO
209
·
--
Bullish
clean break out from $ONDO
we might see 0.4 😬
clean break out from $ONDO
we might see 0.4 😬
we might see 0.4 😬
102
·
--
Bullish
$SUI
help me guys, wanted to see your thoughts.
$SUI
help me guys, wanted to see your thoughts.
help me guys, wanted to see your thoughts.
new ath soon
73%
rejected
27%
85 votes • Voting closed
766
·
--
Bullish
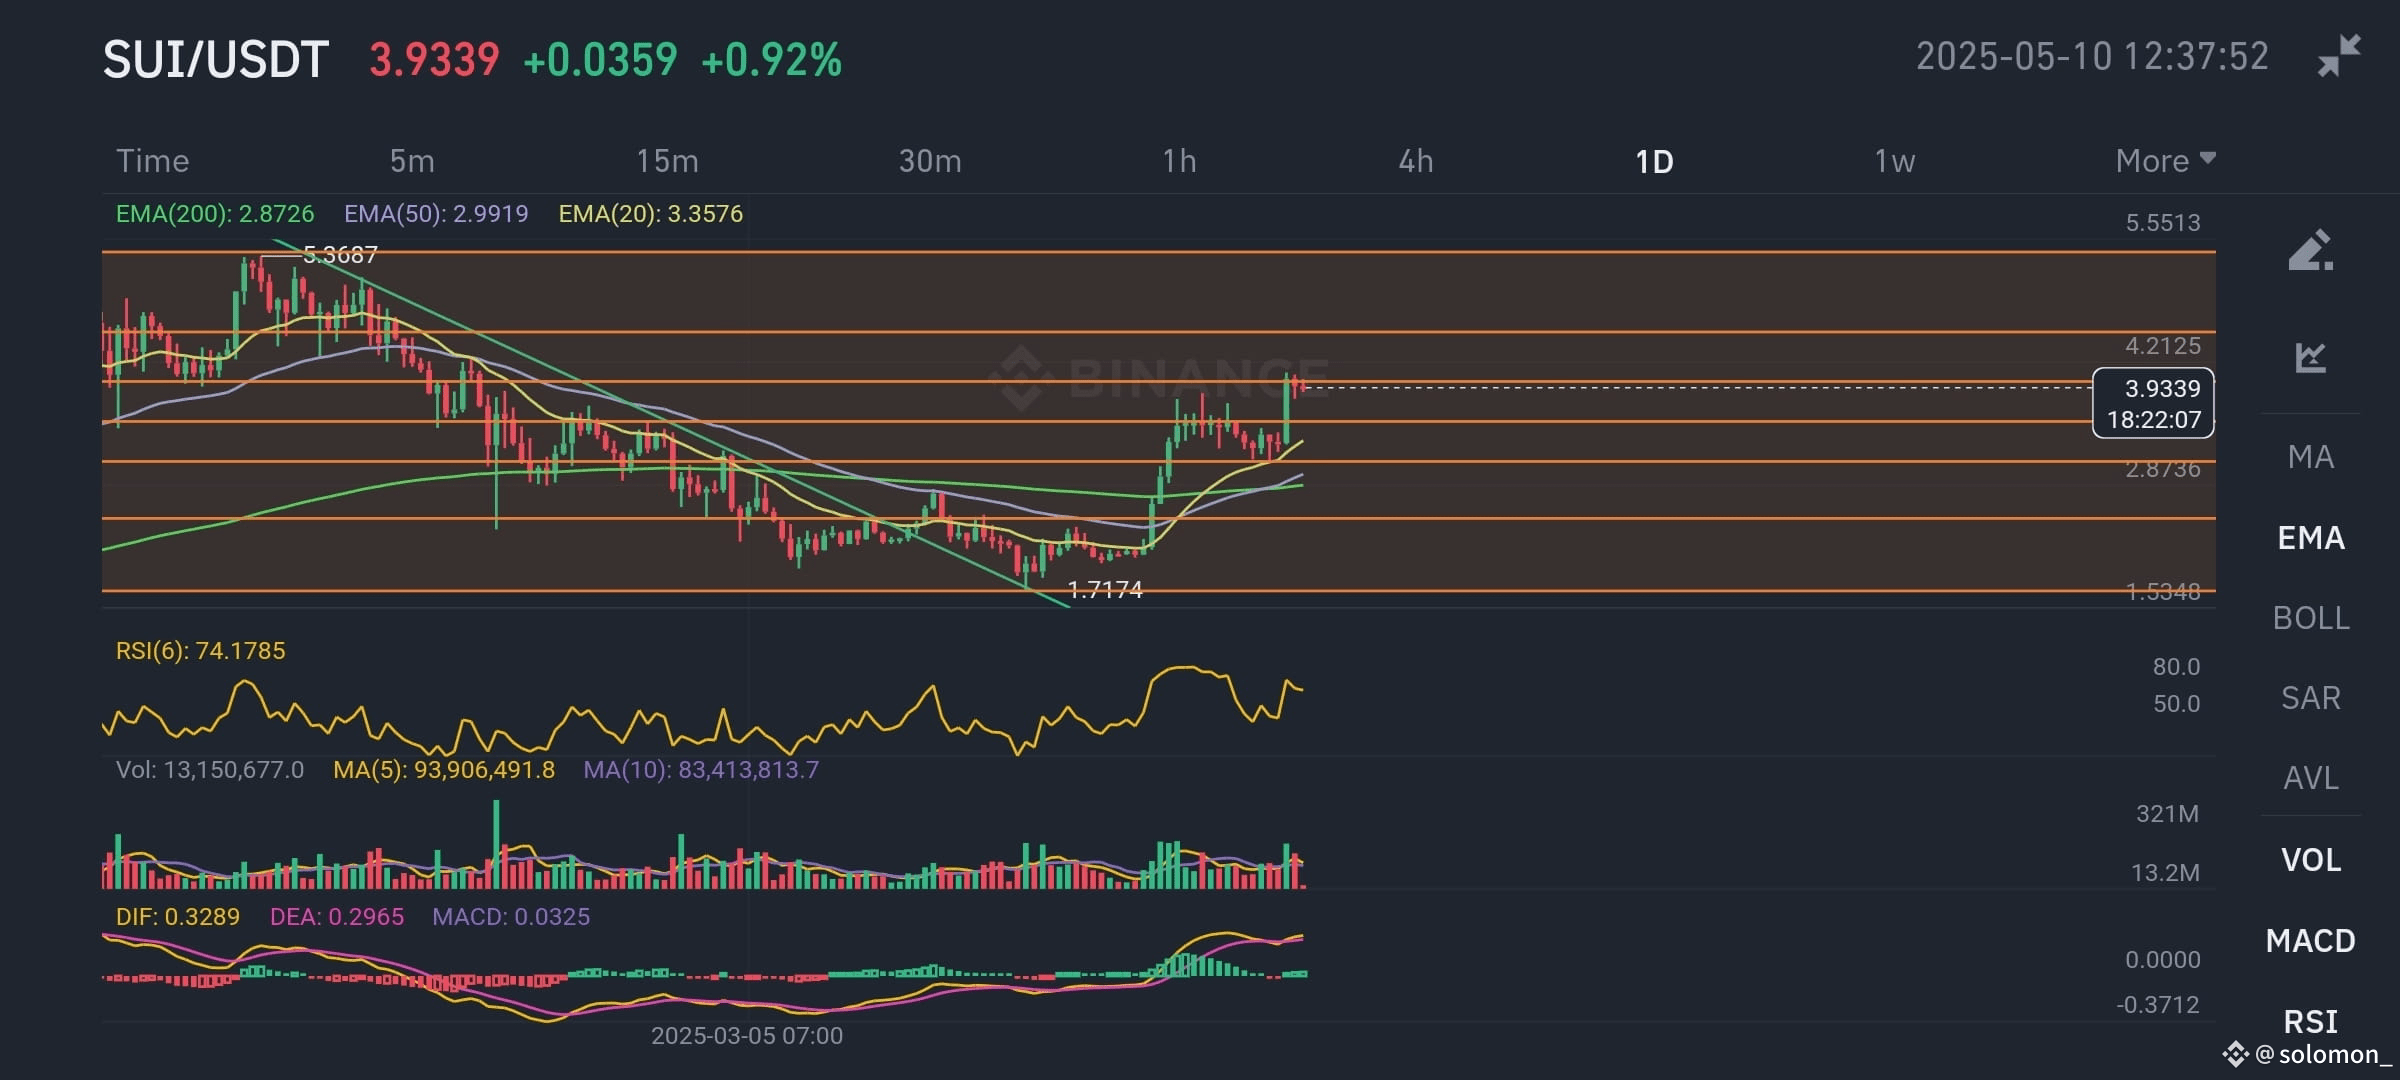
SUI/USDT is showing strong bullish momentum on the daily chart. Price has bounced sharply from the $1.77 support level and is now testing resistance around $3.93. It’s trading above the 20, 50, and 200 EMA, which confirms the bullish trend. The RSI is at 74, indicating overbought conditions — so a short-term pullback is possible. MACD is also bullish with the DIF line above the DEA. If price breaks and holds above $4.21, it could aim for the next resistance near $5.36. However, failure to break this zone might cause a retest toward $3.35 support. Good risk management is key here.
Would you like me to help set a stop loss and target price for a trade plan?
#SUI🔥 #AltcoinTrade #TradeOfTheWeek #CryptoComeback
$SUI
SUI/USDT is showing strong bullish momentum on the daily chart. Price has bounced sharply from the $1.77 support level and is now testing resistance around $3.93. It’s trading above the 20, 50, and 200 EMA, which confirms the bullish trend. The RSI is at 74, indicating overbought conditions — so a short-term pullback is possible. MACD is also bullish with the DIF line above the DEA. If price breaks and holds above $4.21, it could aim for the next resistance near $5.36. However, failure to break this zone might cause a retest toward $3.35 support. Good risk management is key here.
Would you like me to help set a stop loss and target price for a trade plan?
#SUI🔥 #AltcoinTrade #TradeOfTheWeek #CryptoComeback
$SUI
Would you like me to help set a stop loss and target price for a trade plan?
#SUI🔥 #AltcoinTrade #TradeOfTheWeek #CryptoComeback
$SUI
2
122
·
--
Bullish
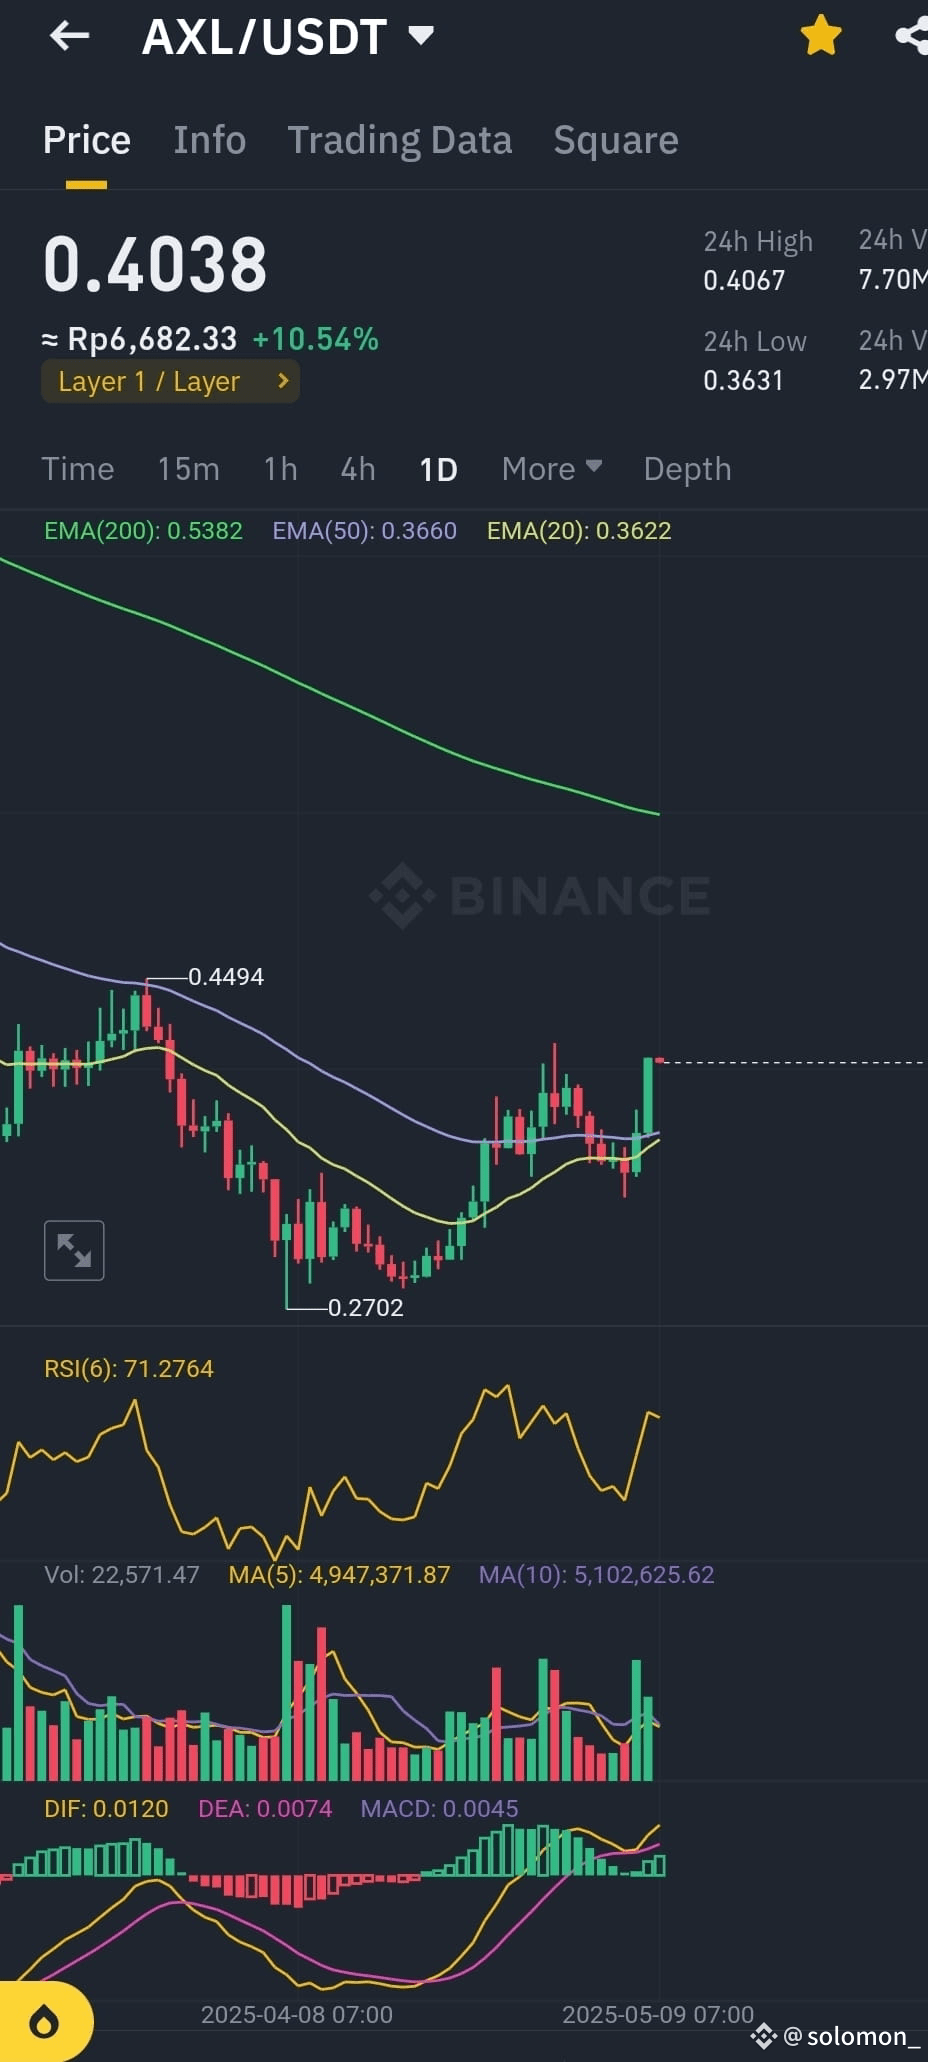
Here’s a concise analysis of the AXL/USDT chart on the 1D (Daily) timeframe:
Current Price: $0.4038 (+10.54%)
Trend Overview
EMA20: $0.3622 (price is above = short-term bullish)
EMA50: $0.3660 (just broken = potential trend reversal)
EMA200: $0.5382 (still far above = long-term downtrend still intact)
Indicators
RSI (6): 71.27 → Overbought territory; suggests caution or possible short-term pullback.
MACD: Bullish crossover with strong green histogram bars, indicating rising momentum.
Volume: Rising — buyers are stepping in strongly.
Price Structure
Price bounced off the $0.2702 low and made higher lows.
Breaking above $0.40 and the 50 EMA confirms bullish structure short term.
Next resistance: around $0.4494 (previous swing high).
Support now sits around $0.3620 - $0.3660 (EMA20/50 zone).
Summary
AXL is showing strong short-term bullish momentum. A daily close above $0.40 is significant. However, RSI being over 70 warns of a potential cooldown or sideways movement before continuing upward.
Plan:
Watch for retest and hold above $0.3660 for safe entry.
TP zones: $0.44 and $0.50+.
Avoid chasing if RSI keeps climbing without a pullback.
#BTCBackto100K #CryptoComeback #TradeStories #StripeStablecoinAccounts
$BTC $XRP $AXL
Here’s a concise analysis of the AXL/USDT chart on the 1D (Daily) timeframe:
Current Price: $0.4038 (+10.54%)
Trend Overview
EMA20: $0.3622 (price is above = short-term bullish)
EMA50: $0.3660 (just broken = potential trend reversal)
EMA200: $0.5382 (still far above = long-term downtrend still intact)
Indicators
RSI (6): 71.27 → Overbought territory; suggests caution or possible short-term pullback.
MACD: Bullish crossover with strong green histogram bars, indicating rising momentum.
Volume: Rising — buyers are stepping in strongly.
Price Structure
Price bounced off the $0.2702 low and made higher lows.
Breaking above $0.40 and the 50 EMA confirms bullish structure short term.
Next resistance: around $0.4494 (previous swing high).
Support now sits around $0.3620 - $0.3660 (EMA20/50 zone).
Summary
AXL is showing strong short-term bullish momentum. A daily close above $0.40 is significant. However, RSI being over 70 warns of a potential cooldown or sideways movement before continuing upward.
Plan:
Watch for retest and hold above $0.3660 for safe entry.
TP zones: $0.44 and $0.50+.
Avoid chasing if RSI keeps climbing without a pullback.
#BTCBackto100K #CryptoComeback #TradeStories #StripeStablecoinAccounts
$BTC $XRP $AXL
Current Price: $0.4038 (+10.54%)
Trend Overview
EMA20: $0.3622 (price is above = short-term bullish)
EMA50: $0.3660 (just broken = potential trend reversal)
EMA200: $0.5382 (still far above = long-term downtrend still intact)
Indicators
RSI (6): 71.27 → Overbought territory; suggests caution or possible short-term pullback.
MACD: Bullish crossover with strong green histogram bars, indicating rising momentum.
Volume: Rising — buyers are stepping in strongly.
Price Structure
Price bounced off the $0.2702 low and made higher lows.
Breaking above $0.40 and the 50 EMA confirms bullish structure short term.
Next resistance: around $0.4494 (previous swing high).
Support now sits around $0.3620 - $0.3660 (EMA20/50 zone).
Summary
AXL is showing strong short-term bullish momentum. A daily close above $0.40 is significant. However, RSI being over 70 warns of a potential cooldown or sideways movement before continuing upward.
Plan:
Watch for retest and hold above $0.3660 for safe entry.
TP zones: $0.44 and $0.50+.
Avoid chasing if RSI keeps climbing without a pullback.
#BTCBackto100K #CryptoComeback #TradeStories #StripeStablecoinAccounts
$BTC $XRP $AXL
899
·
--
Hey bro, looking at the chart, I totally get your point. BTC clearly broke through the main resistance around the 96k-97k area, which was a strong ceiling before. Now it’s holding above the EMA 20 and 50, showing some nice bullish momentum. RSI is at 74, a bit high but that just means buyers are in control for now. The MACD also flipped bullish with that crossover and increasing histogram bars — another good sign. Volume’s not exploding but steady enough to support this breakout. If this momentum holds, I agree with you, we could see BTC pushing to make another higher high, maybe testing the 100k zone or even beyond. Just gotta watch for any fakeouts or sudden dumps, but so far, bulls look confident.
#BTC #bullish $BTC $BTC $BTC
Hey bro, looking at the chart, I totally get your point. BTC clearly broke through the main resistance around the 96k-97k area, which was a strong ceiling before. Now it’s holding above the EMA 20 and 50, showing some nice bullish momentum. RSI is at 74, a bit high but that just means buyers are in control for now. The MACD also flipped bullish with that crossover and increasing histogram bars — another good sign. Volume’s not exploding but steady enough to support this breakout. If this momentum holds, I agree with you, we could see BTC pushing to make another higher high, maybe testing the 100k zone or even beyond. Just gotta watch for any fakeouts or sudden dumps, but so far, bulls look confident.
#BTC #bullish $BTC $BTC $BTC
#BTC #bullish $BTC $BTC $BTC
1
54
·
--
Bullish
Market Overview (4H)
Price: $0.3649 (+5.95%)
Trend: Bullish (Price above EMA 20/50/200).
RSI: 66.77 (strong but nearing overbought).
MACD: Bullish crossover.
Volume: Increasing, supports upside.
4H Trading Plan
Bias: Bullish
Entry: $0.3550 - $0.3580 (EMA support zone).
Stop Loss: Below $0.3420.
Targets:
TP1: $0.3780 (24H high).
TP2: $0.4145 (recent swing high).
1H Trading Plan
Bias: Bullish
Entry: $0.3600 - $0.3620 on bullish candle.
Stop Loss: Below $0.3550.
Targets:
TP1: $0.3720 - $0.3740
TP2: $0.3780.
Key Notes
As long as price stays above EMA200 (both timeframes), bulls are in control.
RSI near 70 — partial profits recommended at first targets.
Watch for bearish reversal signals near TP levels.
$AXL $XRP #XLM $HBAR
#TradeStories #FOMCMeeting #MEMEAct #BTCpredictions
Market Overview (4H)
Price: $0.3649 (+5.95%)
Trend: Bullish (Price above EMA 20/50/200).
RSI: 66.77 (strong but nearing overbought).
MACD: Bullish crossover.
Volume: Increasing, supports upside.
4H Trading Plan
Bias: Bullish
Entry: $0.3550 - $0.3580 (EMA support zone).
Stop Loss: Below $0.3420.
Targets:
TP1: $0.3780 (24H high).
TP2: $0.4145 (recent swing high).
1H Trading Plan
Bias: Bullish
Entry: $0.3600 - $0.3620 on bullish candle.
Stop Loss: Below $0.3550.
Targets:
TP1: $0.3720 - $0.3740
TP2: $0.3780.
Key Notes
As long as price stays above EMA200 (both timeframes), bulls are in control.
RSI near 70 — partial profits recommended at first targets.
Watch for bearish reversal signals near TP levels.
$AXL $XRP #XLM $HBAR
#TradeStories #FOMCMeeting #MEMEAct #BTCpredictions
Price: $0.3649 (+5.95%)
Trend: Bullish (Price above EMA 20/50/200).
RSI: 66.77 (strong but nearing overbought).
MACD: Bullish crossover.
Volume: Increasing, supports upside.
4H Trading Plan
Bias: Bullish
Entry: $0.3550 - $0.3580 (EMA support zone).
Stop Loss: Below $0.3420.
Targets:
TP1: $0.3780 (24H high).
TP2: $0.4145 (recent swing high).
1H Trading Plan
Bias: Bullish
Entry: $0.3600 - $0.3620 on bullish candle.
Stop Loss: Below $0.3550.
Targets:
TP1: $0.3720 - $0.3740
TP2: $0.3780.
Key Notes
As long as price stays above EMA200 (both timeframes), bulls are in control.
RSI near 70 — partial profits recommended at first targets.
Watch for bearish reversal signals near TP levels.
$AXL $XRP #XLM $HBAR
#TradeStories #FOMCMeeting #MEMEAct #BTCpredictions
3
349
·
--
Free gass using my reff, feel free to hit me on dm
https://t.me/birdx2_bot/birdx?startapp=1286474929#
Free gass using my reff, feel free to hit me on dm
https://t.me/birdx2_bot/birdx?startapp=1286474929#
https://t.me/birdx2_bot/birdx?startapp=1286474929#
6
20
Log in to explore more content
Join global crypto users on Binance Square
⚡️ Get latest and useful information about crypto.
💬 Trusted by the world’s largest crypto exchange.
👍 Discover real insights from verified creators.
Email / Phone number
Trending Topics
HuangRisksOusterOverReportedAffairWithSubordinate
50,918 views
746 Discussing
Nvidia Board Meets to Decide Jensen Huang's Future as Crisis Deepens
Binance News
·38 Likes
·43.8k views
AnthropicRejectsIPODelayValuationinQuestion
503,214 views
4,147 Discussing
CoreWeaveJumps10%On168%RevenueGrowth
84,483 views
1,029 Discussing