
CryptoWithZaBi
250 Posts

CryptoWithZaBi
Report
Block User
Experience In Crypto 7 Years Insta mrcryptooofficial
High-Frequency Trader
4.3 Years
11 Following
58 Followers
138 Liked
Posts
All
Quotes
Videos
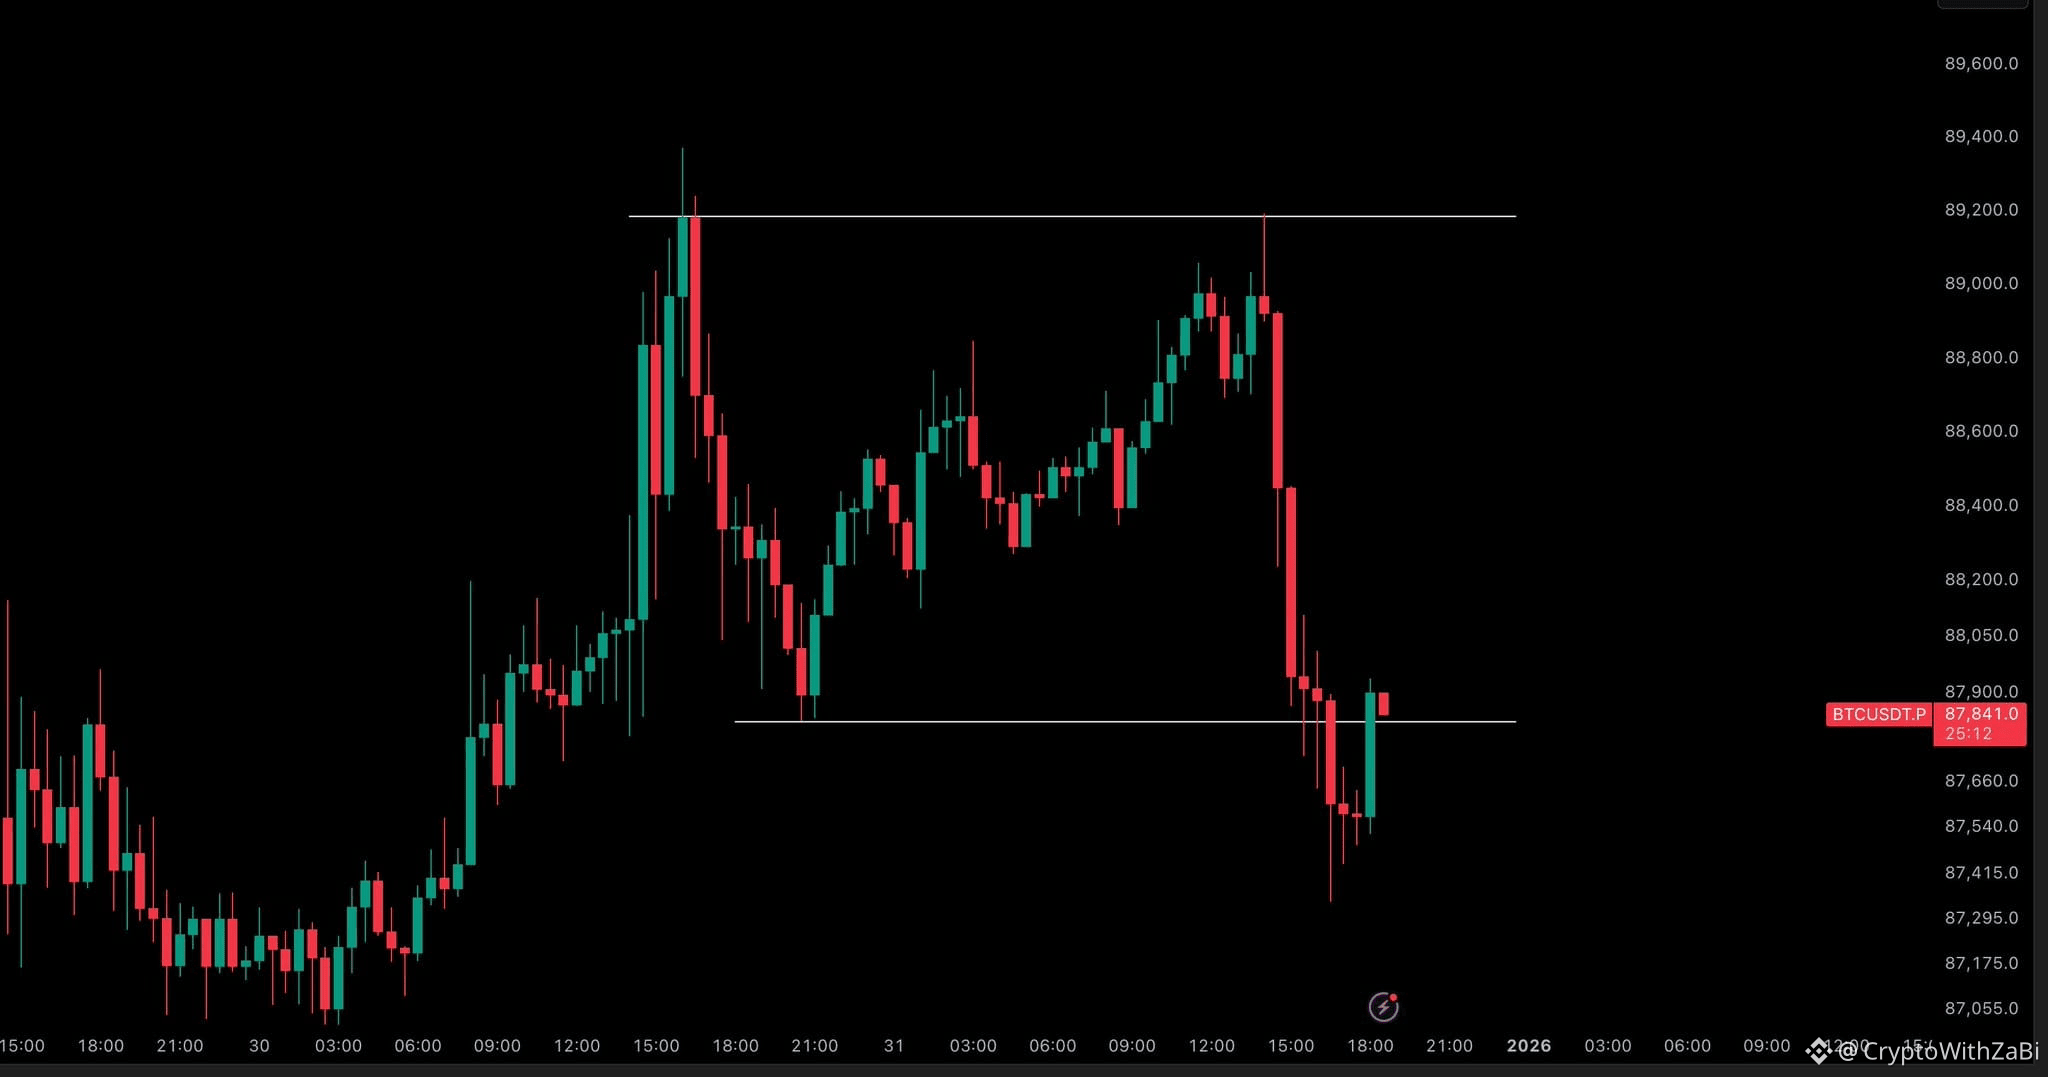
$BTC / $USD - Update
If the bulls can hold this level here that would be just great
$BTC / $USD - Update
If the bulls can hold this level here that would be just great
If the bulls can hold this level here that would be just great
94
2026 will be a good year for Crypto
2024 - 2025 was mer, but we survived it all.
2026 will be a good year for Crypto
2024 - 2025 was mer, but we survived it all.
2024 - 2025 was mer, but we survived it all.
1
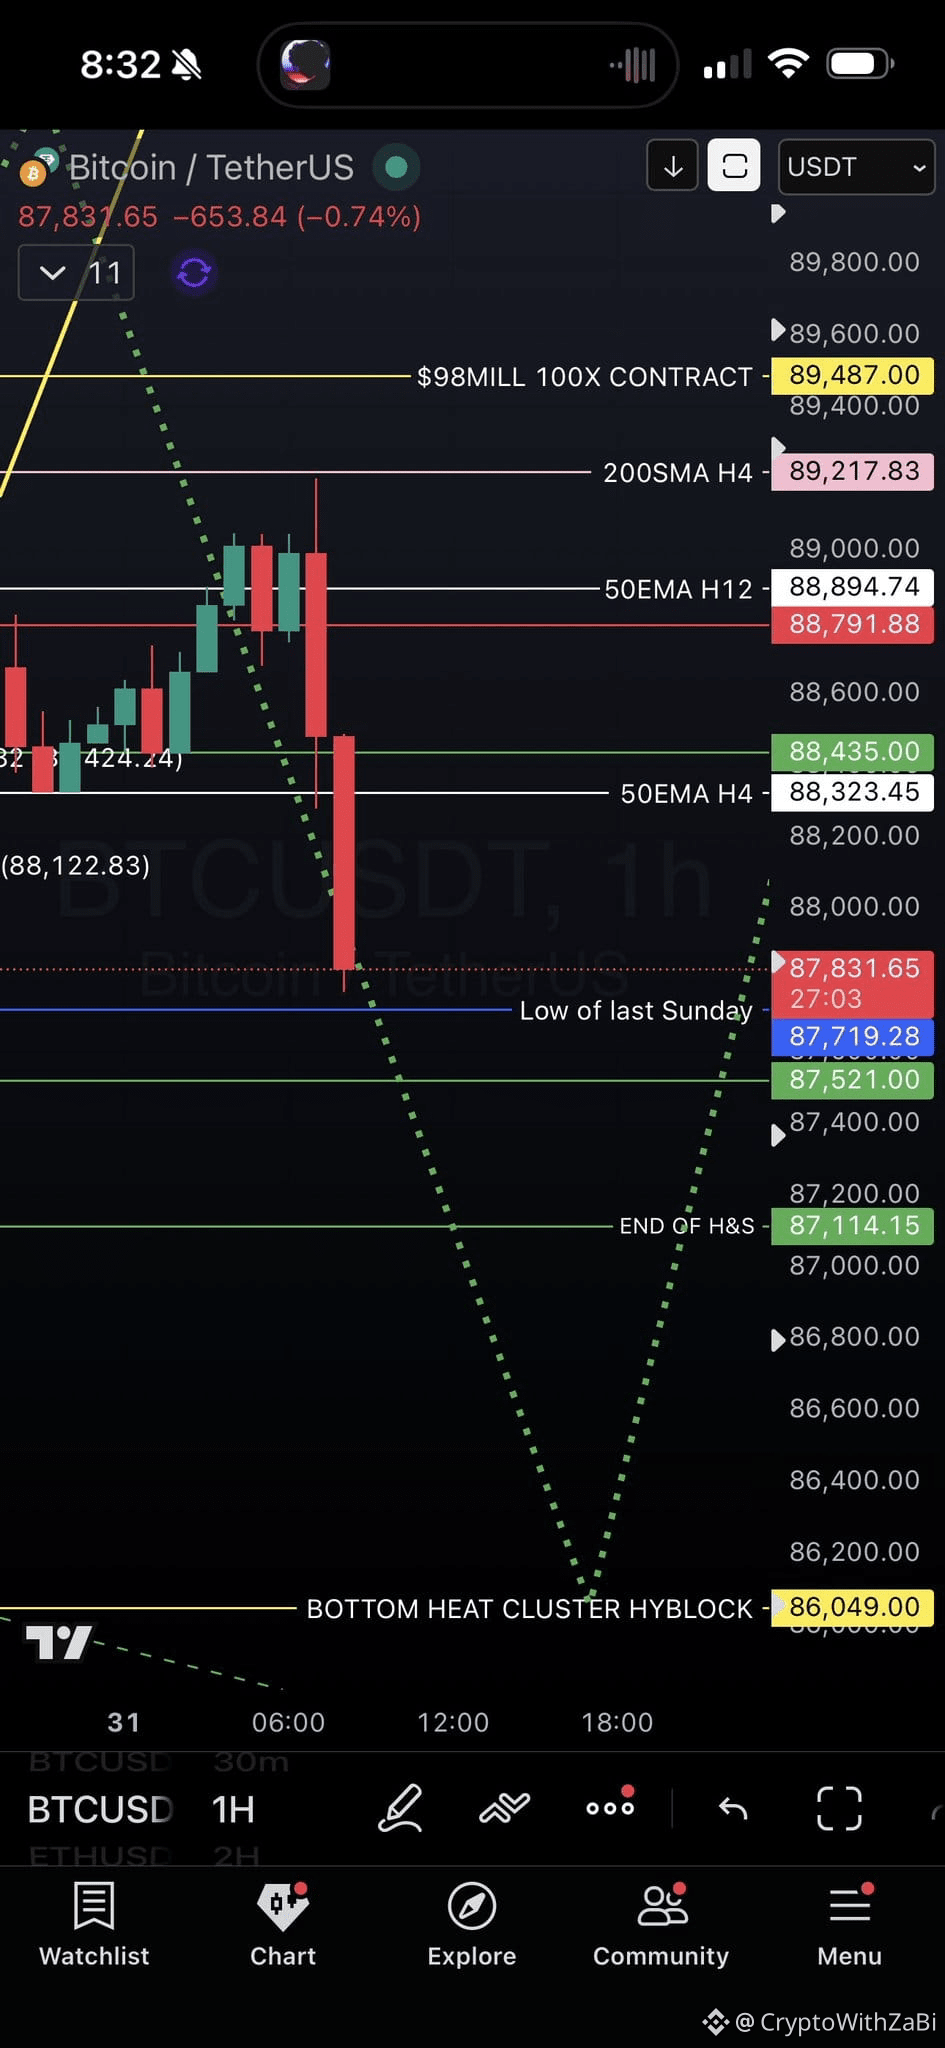
$BTC I can almost smell $86,049 ….. Let’s see if we finally get it today. Whether we do or not the fact that we rejected once again off the 200 SMA H4 is so validating as there is nothing better than to see people tell you that you are wrong only to see it play out in real time!! LOL let’s see who has true integrity and admit they were wrong or at least acknowledge that I was right.
$BTC I can almost smell $86,049 ….. Let’s see if we finally get it today. Whether we do or not the fact that we rejected once again off the 200 SMA H4 is so validating as there is nothing better than to see people tell you that you are wrong only to see it play out in real time!! LOL let’s see who has true integrity and admit they were wrong or at least acknowledge that I was right.
193
The liquidity cycle is finally on our side.
The 🇺🇸 Fed is already injecting billions into the economy.
It will only accelerate from here.
Own assets.
The liquidity cycle is finally on our side.
The 🇺🇸 Fed is already injecting billions into the economy.
It will only accelerate from here.
Own assets.
The 🇺🇸 Fed is already injecting billions into the economy.
It will only accelerate from here.
Own assets.

2
384
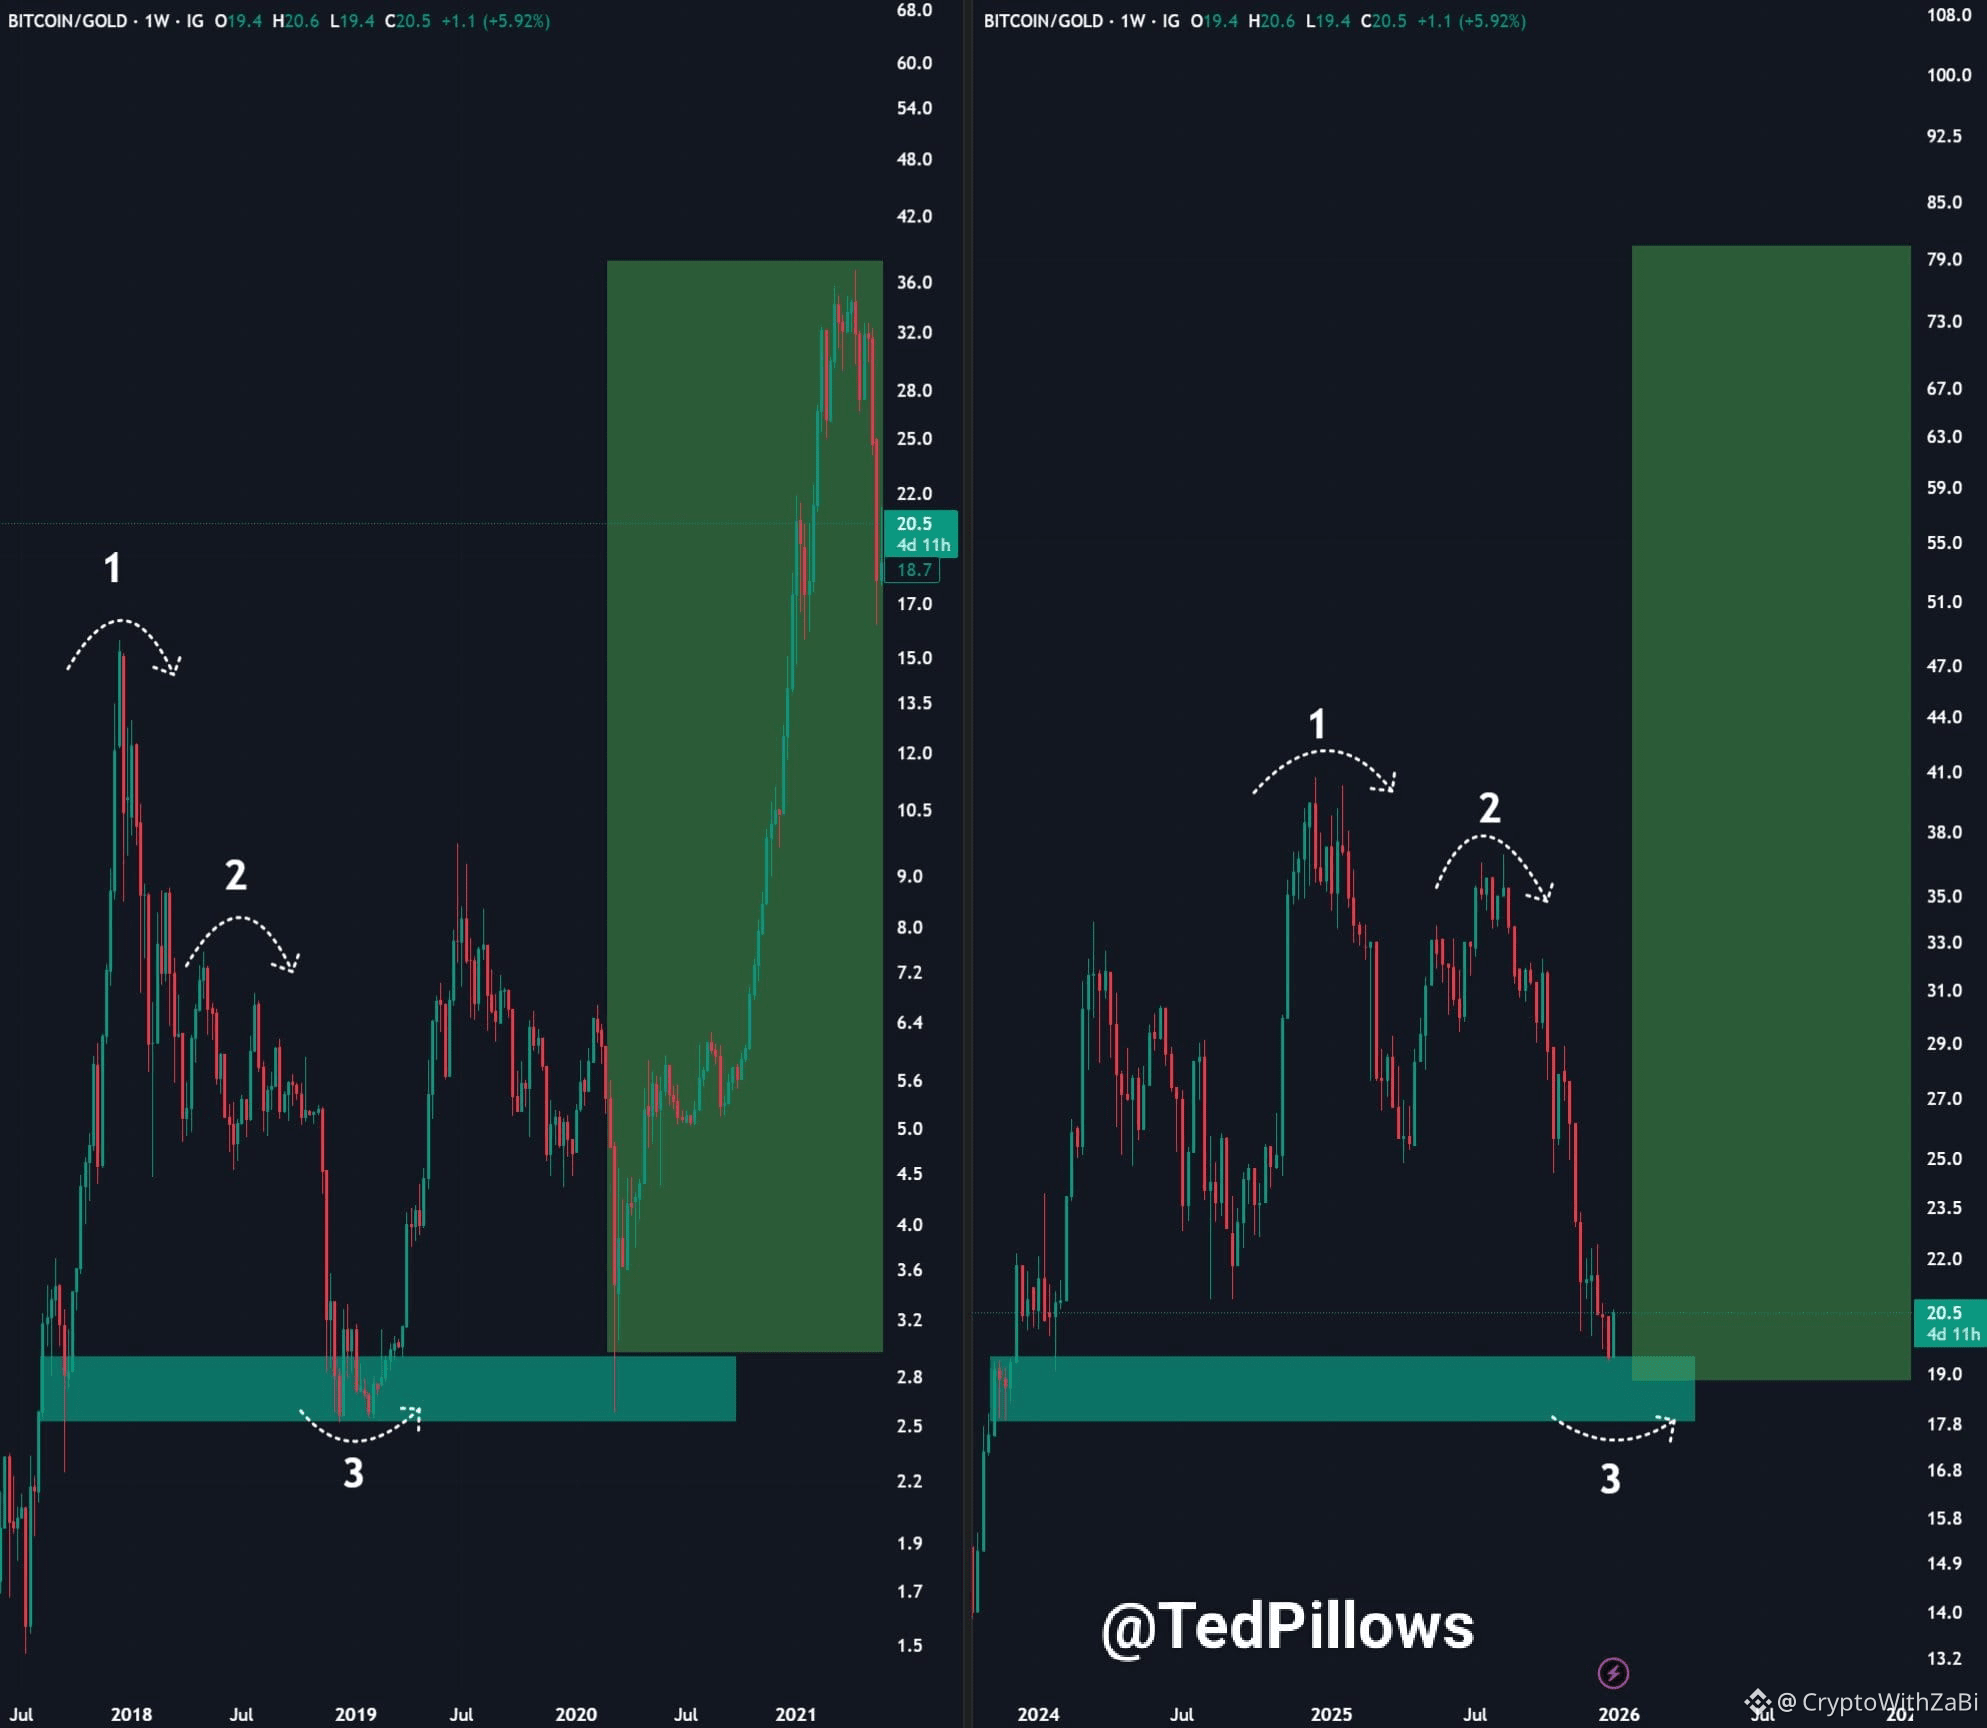
BTC/Gold is now at a crucial support zone.
The fractal looks pretty similar to the 2017-21 cycle, but that would take more time for confirmation.
If this zone holds, we could see liquidity moving from Gold into Bitcoin.
BTC/Gold is now at a crucial support zone.
The fractal looks pretty similar to the 2017-21 cycle, but that would take more time for confirmation.
If this zone holds, we could see liquidity moving from Gold into Bitcoin.
The fractal looks pretty similar to the 2017-21 cycle, but that would take more time for confirmation.
If this zone holds, we could see liquidity moving from Gold into Bitcoin.
7
Bitcoin Price on New Year's Eve
2013: $755
2014: $320
2015: $430
2016: $965
2017: $14,155
2018: $3,740
2019: $7,195
2020: $29,000
2021: $49,305
2022: $16,595
2023: $42,560
2024: $95,650
2025: $87,580
Happy 2026 everyone ‼️
Bitcoin Price on New Year's Eve
2013: $755
2014: $320
2015: $430
2016: $965
2017: $14,155
2018: $3,740
2019: $7,195
2020: $29,000
2021: $49,305
2022: $16,595
2023: $42,560
2024: $95,650
2025: $87,580
Happy 2026 everyone ‼️
2013: $755
2014: $320
2015: $430
2016: $965
2017: $14,155
2018: $3,740
2019: $7,195
2020: $29,000
2021: $49,305
2022: $16,595
2023: $42,560
2024: $95,650
2025: $87,580
Happy 2026 everyone ‼️
6
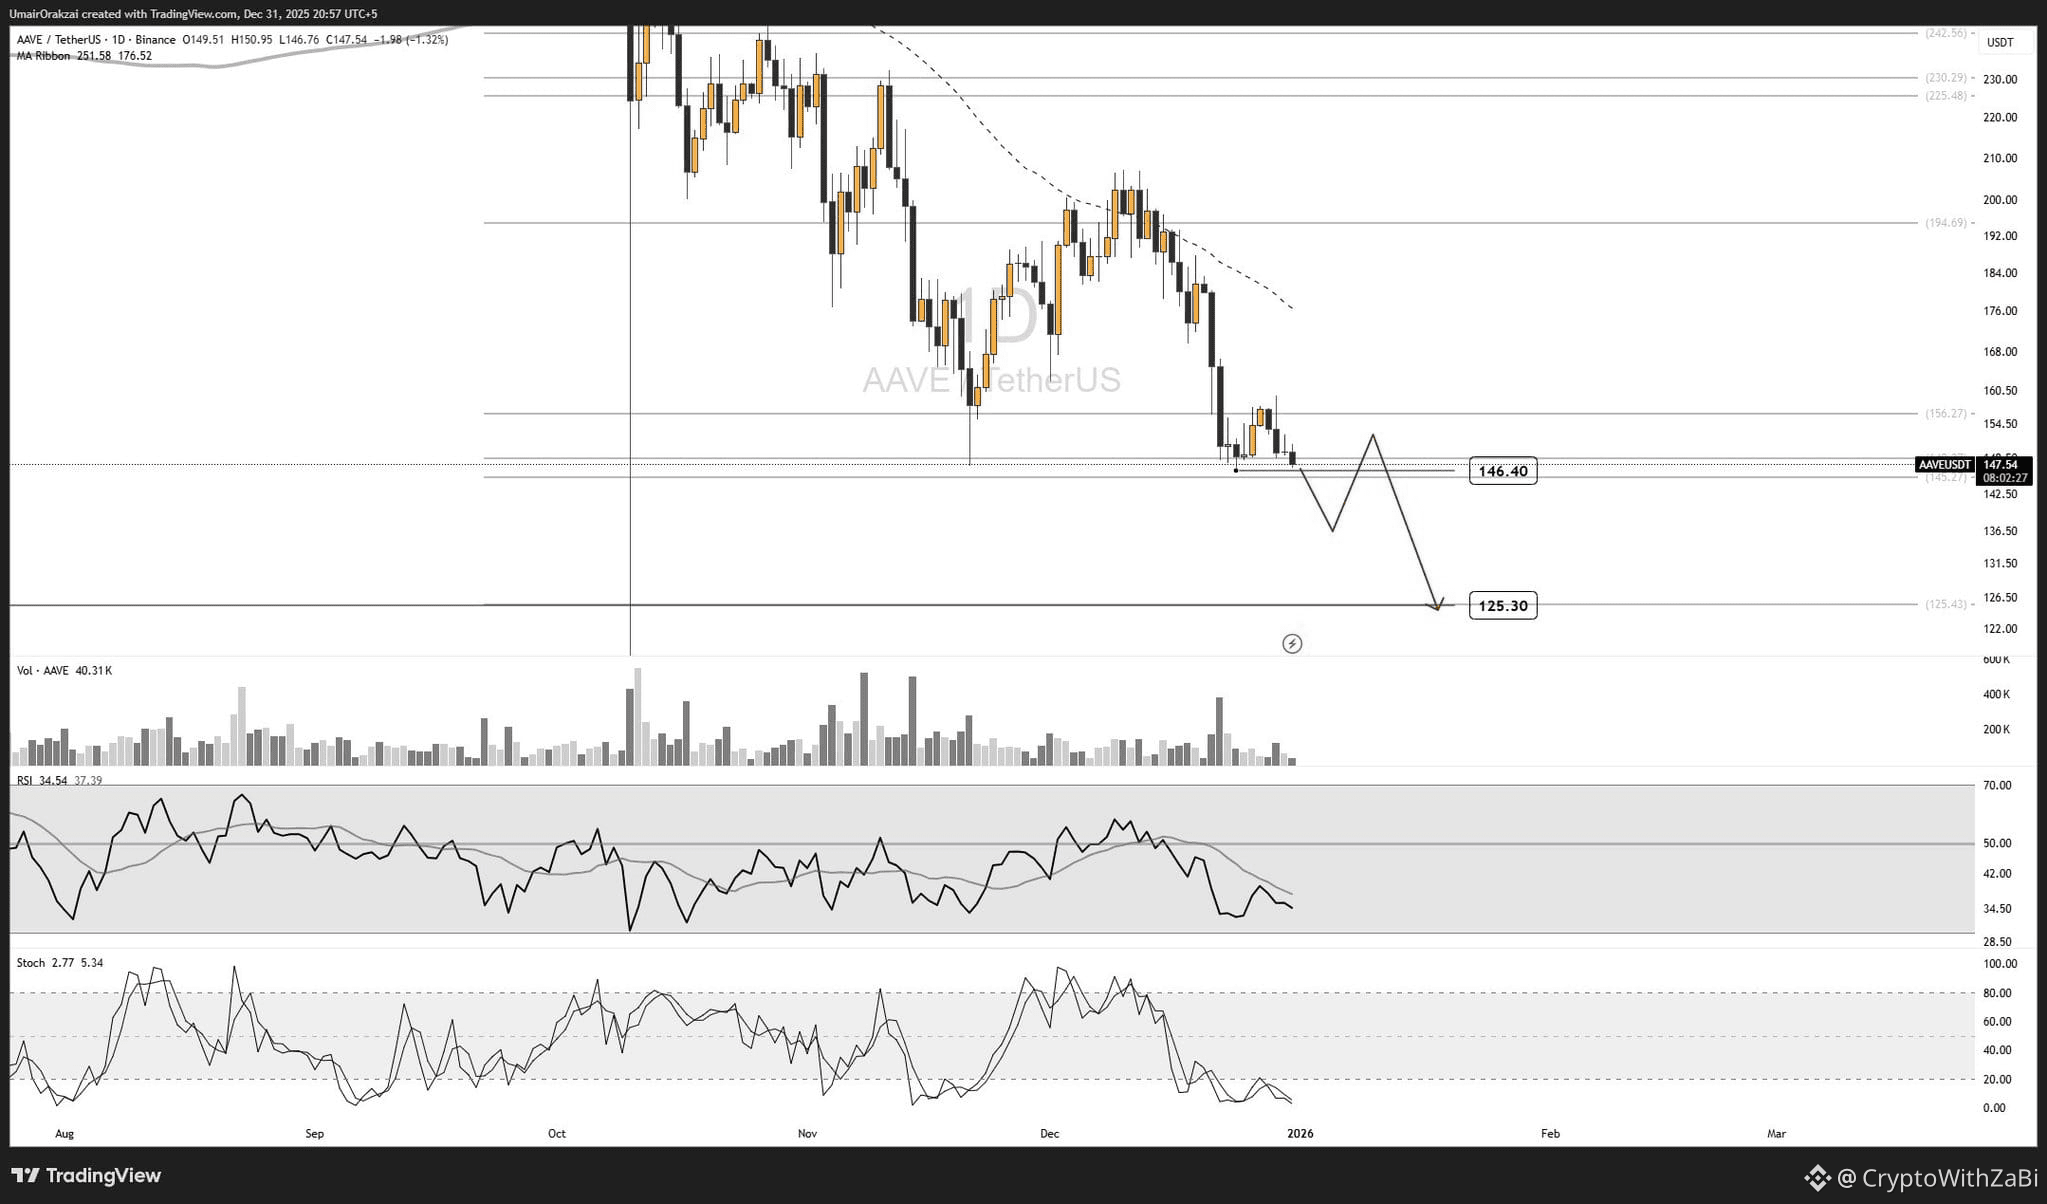
$AAVE 📉🔍
Trying to show some strength, but whether it actually translates into follow-through is still unclear.
Given the overall market health and how USDT.D looks on its native charts, the tendency remains to the downside, and if that bias holds, a daily close below 146 would signal a bearish retest likely expanding toward 125, that’s where we’d expect the next reversal attempt 🧨
$AAVE 📉🔍
Trying to show some strength, but whether it actually translates into follow-through is still unclear.
Given the overall market health and how USDT.D looks on its native charts, the tendency remains to the downside, and if that bias holds, a daily close below 146 would signal a bearish retest likely expanding toward 125, that’s where we’d expect the next reversal attempt 🧨
Trying to show some strength, but whether it actually translates into follow-through is still unclear.
Given the overall market health and how USDT.D looks on its native charts, the tendency remains to the downside, and if that bias holds, a daily close below 146 would signal a bearish retest likely expanding toward 125, that’s where we’d expect the next reversal attempt 🧨
108
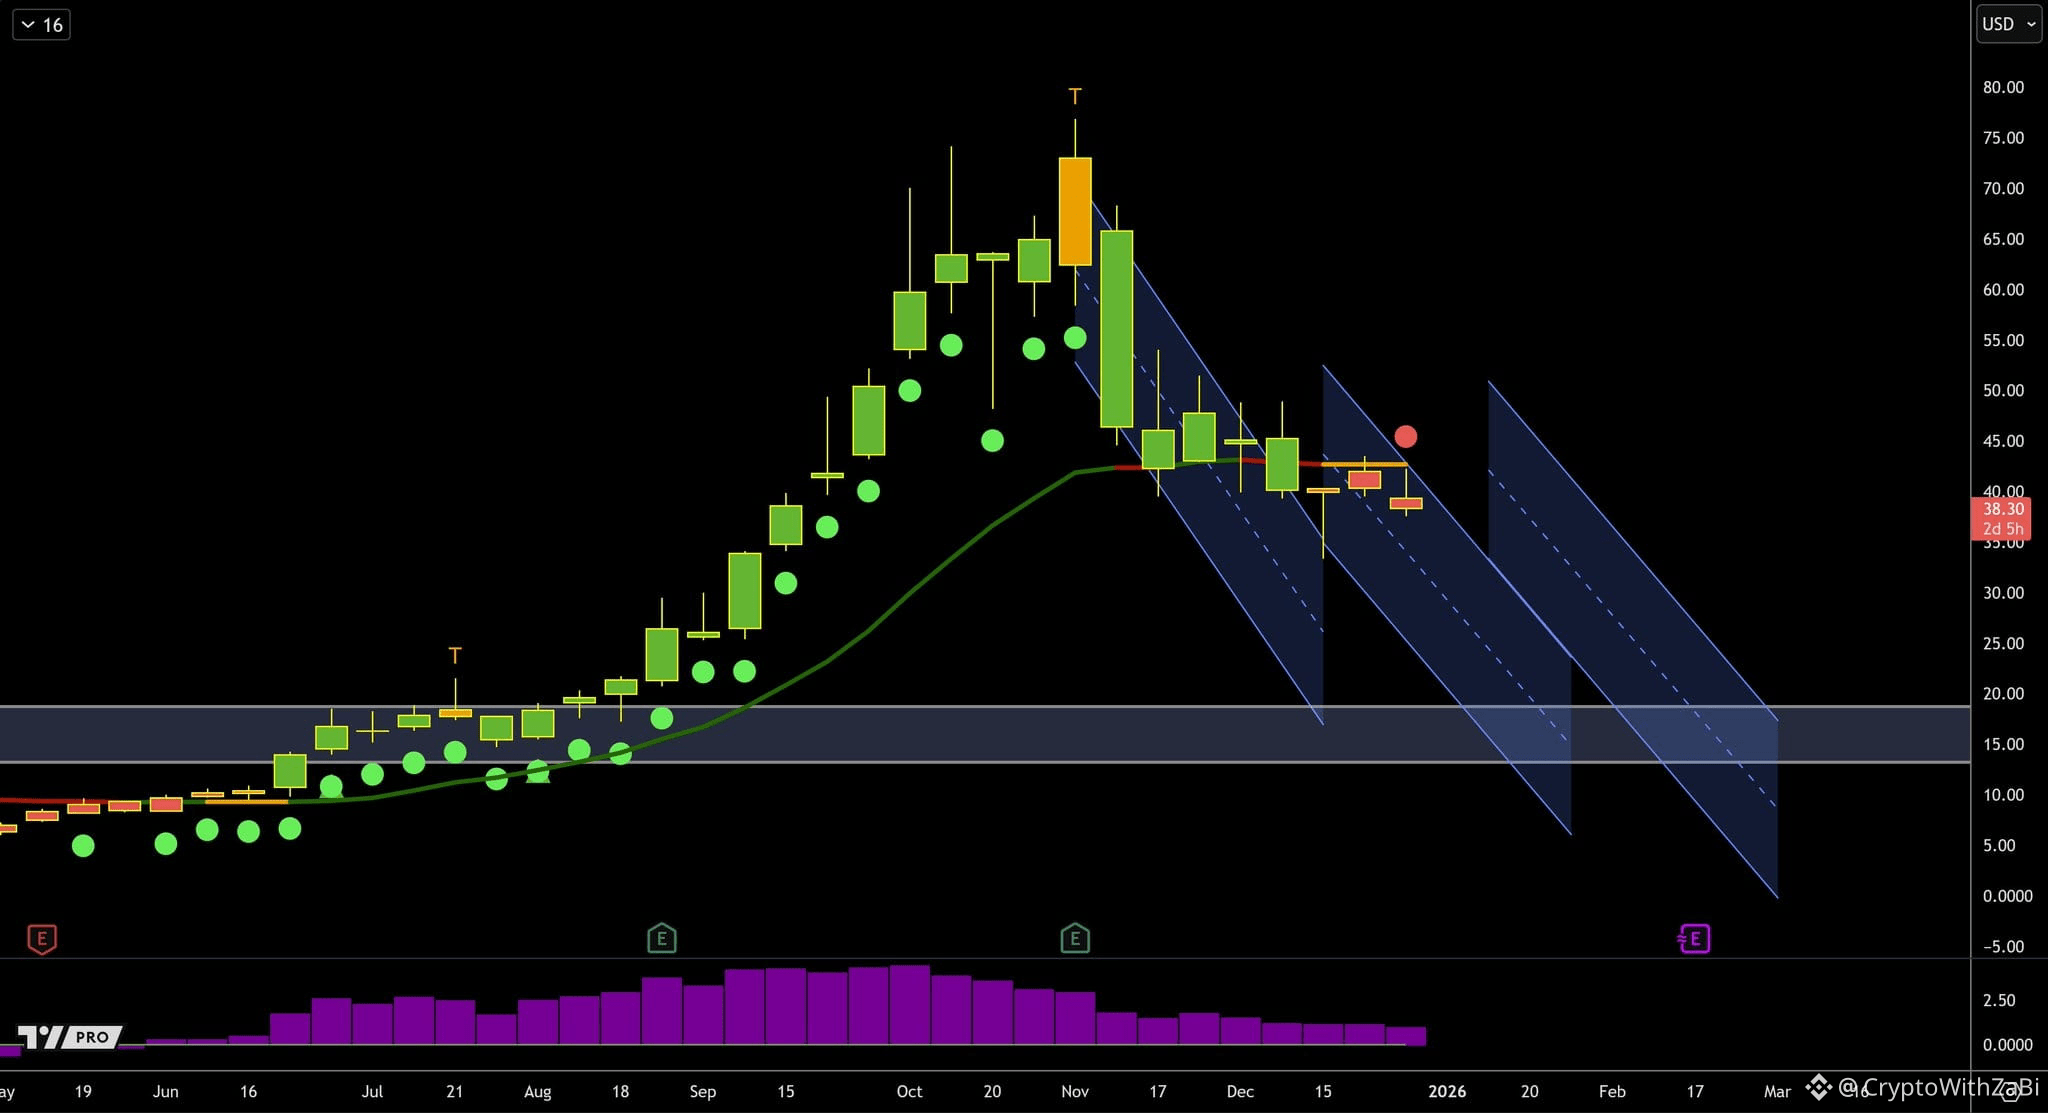
$IREN
I have shorts.
There is no support below.
I actually like IREN. But not anywhere here. $15 has a nice projection if bulls can't hold it.
$IREN
I have shorts.
There is no support below.
I actually like IREN. But not anywhere here. $15 has a nice projection if bulls can't hold it.
I have shorts.
There is no support below.
I actually like IREN. But not anywhere here. $15 has a nice projection if bulls can't hold it.
6
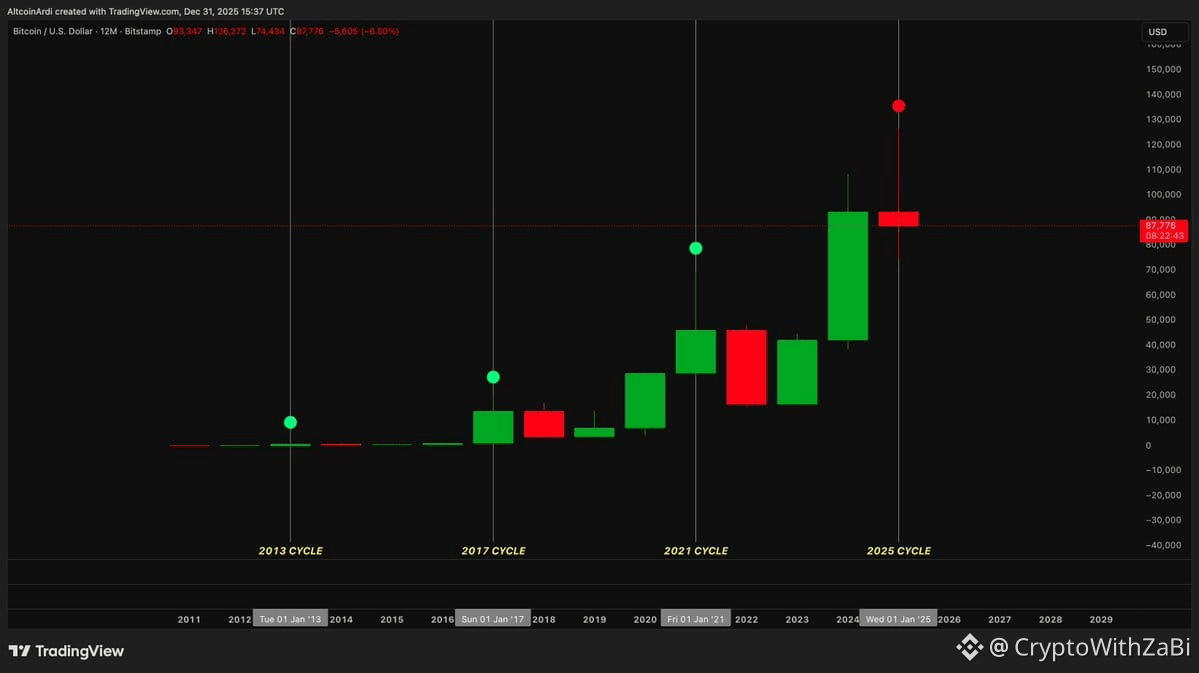
The 2025 cycle for Bitcoin is about to go down in history for all of the wrong reasons.
First time ever in a 4-year halving cycle that the post-halving year (year 4) closes red.
Started the year at $93K, ending $88K. Down ~6% on the year after hitting an ATH of $126K.
The 2025 cycle for Bitcoin is about to go down in history for all of the wrong reasons.
First time ever in a 4-year halving cycle that the post-halving year (year 4) closes red.
Started the year at $93K, ending $88K. Down ~6% on the year after hitting an ATH of $126K.
First time ever in a 4-year halving cycle that the post-halving year (year 4) closes red.
Started the year at $93K, ending $88K. Down ~6% on the year after hitting an ATH of $126K.
125
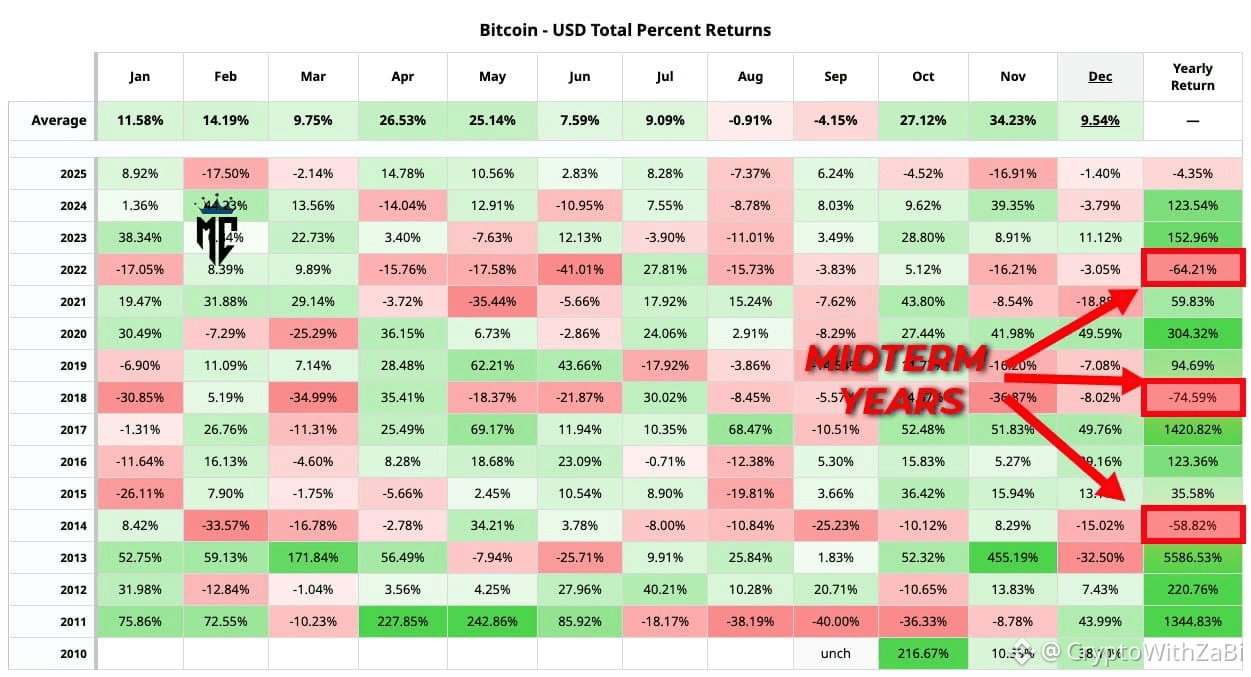
Midterm years are usually bad for Bitcoin…
Will this time be different?
Midterm years are usually bad for Bitcoin…
Will this time be different?
Will this time be different?
2
224
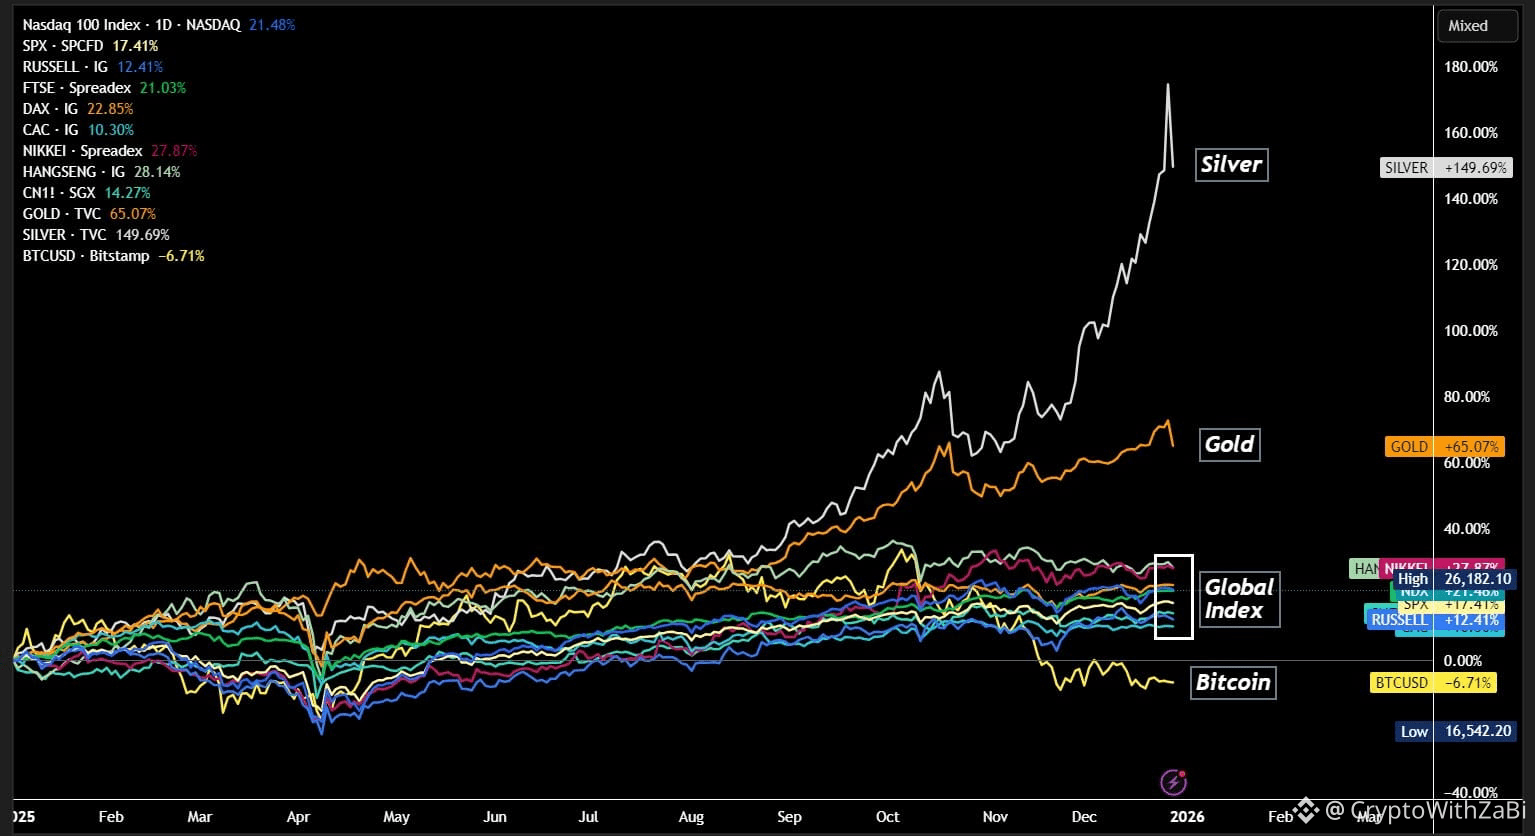
Global Market Performance in 2025
Silver: 160%
Gold: 66%
Nikkei (Japan): 29%
Hang Seng: 29%
SGX (China): 14%
DAX (Germany): 24%
FTSE (Britain): 22%
CAC (France): 11%
Nasdaq: 21%
S&P 500: 17%
Bitcoin: -5%
Global Market Performance in 2025
Silver: 160%
Gold: 66%
Nikkei (Japan): 29%
Hang Seng: 29%
SGX (China): 14%
DAX (Germany): 24%
FTSE (Britain): 22%
CAC (France): 11%
Nasdaq: 21%
S&P 500: 17%
Bitcoin: -5%
Silver: 160%
Gold: 66%
Nikkei (Japan): 29%
Hang Seng: 29%
SGX (China): 14%
DAX (Germany): 24%
FTSE (Britain): 22%
CAC (France): 11%
Nasdaq: 21%
S&P 500: 17%
Bitcoin: -5%
7
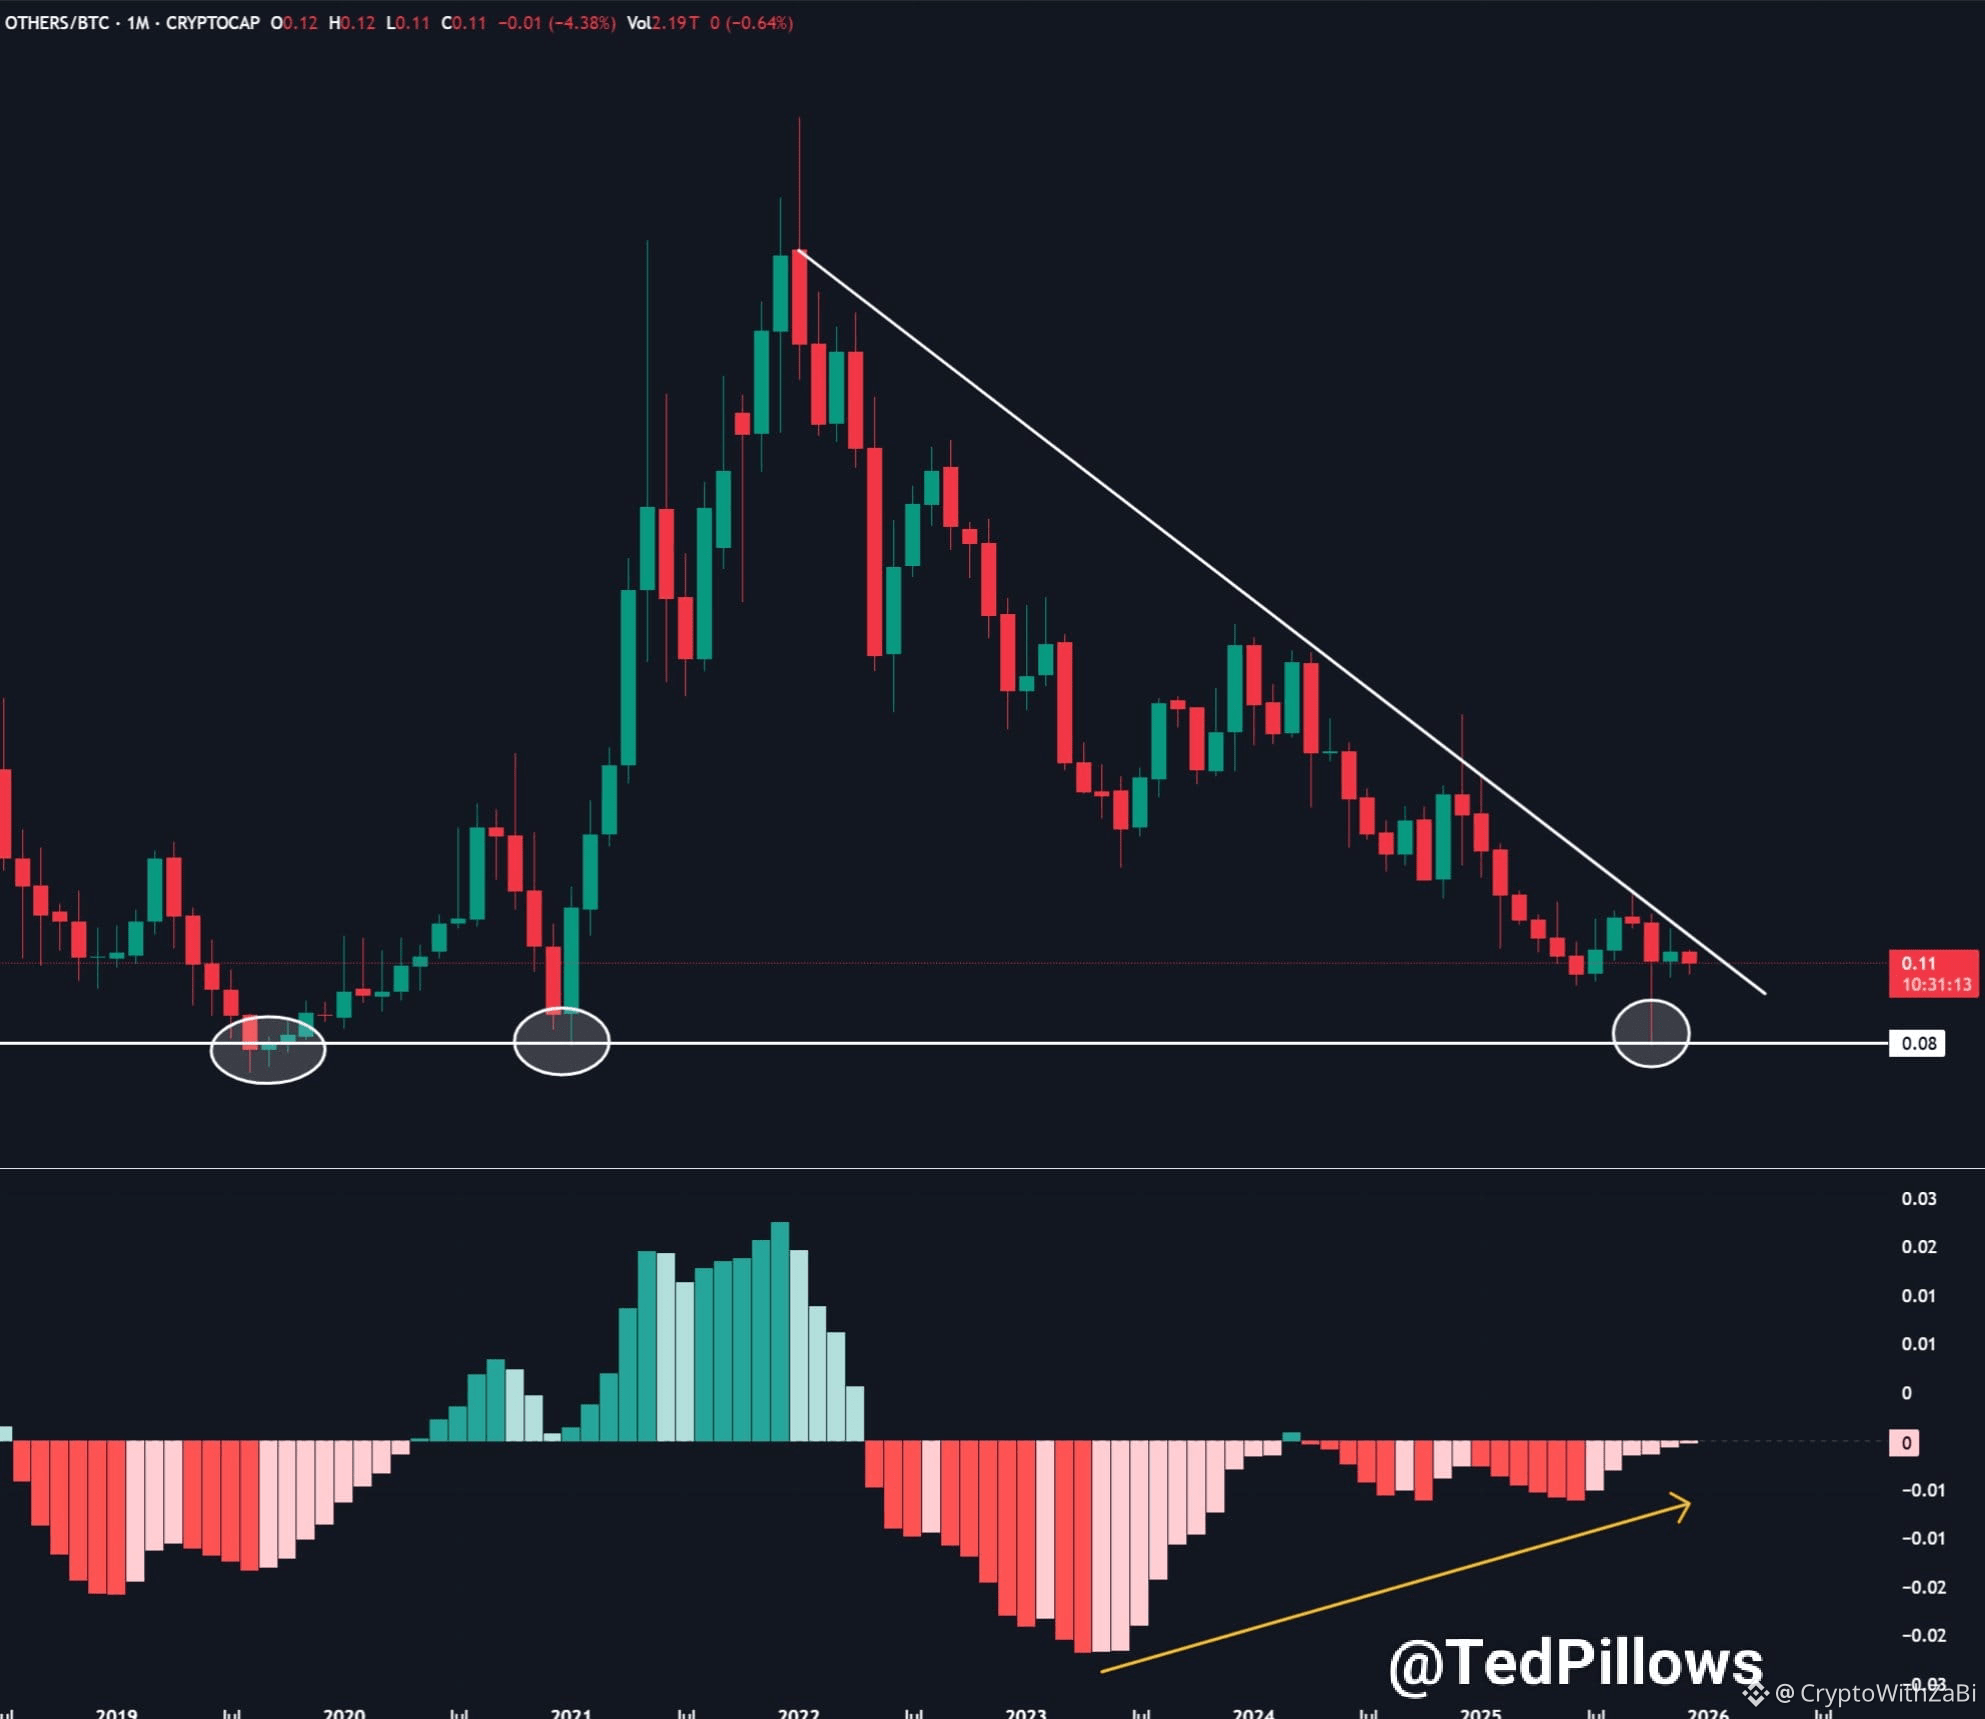
Others/BTC is showing the first signs of reversal since Q4 2023.
Will this be another fakeout?
Others/BTC is showing the first signs of reversal since Q4 2023.
Will this be another fakeout?
Will this be another fakeout?
49
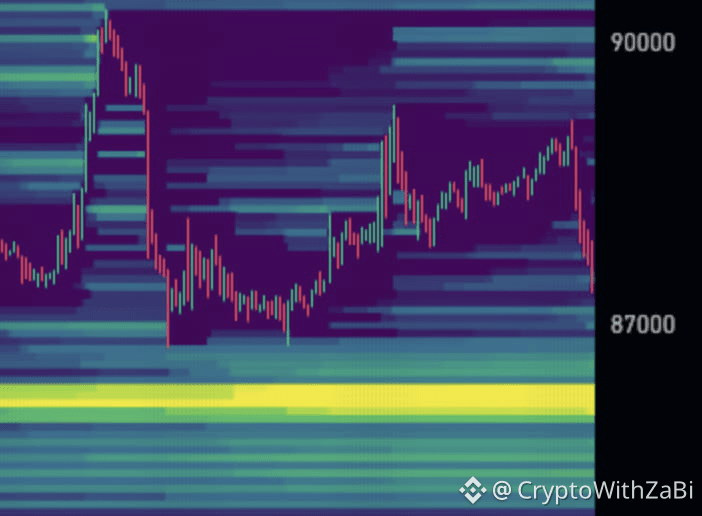
$BTC In case visuals are needed to see the reason for my $86,049 target........ enough said!
$BTC In case visuals are needed to see the reason for my $86,049 target........ enough said!
81
#Bitcoin
Friendly reminder:
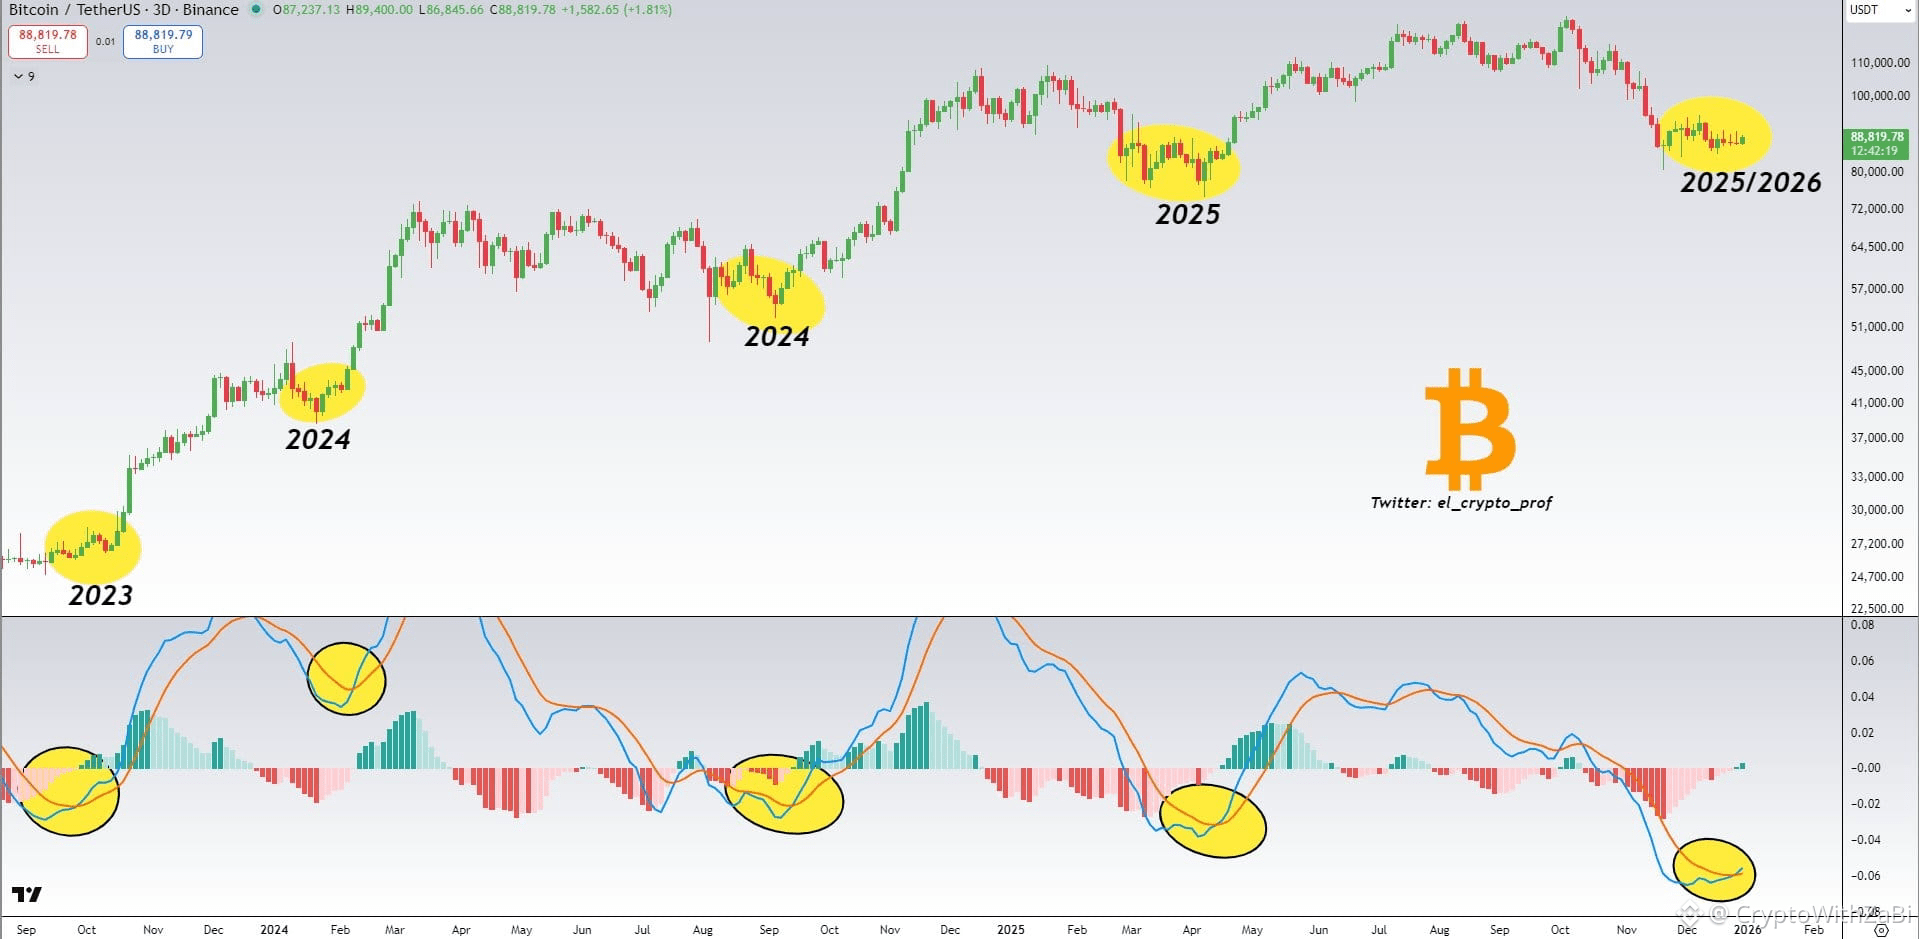
$BTC has made a bullish cross (MACD) 3D chart.👀🔥
The last four times this happened, we saw a rally of at least 66%.
That would put Bitcoin at $140k.
#Bitcoin
Friendly reminder:
$BTC has made a bullish cross (MACD) 3D chart.👀🔥
The last four times this happened, we saw a rally of at least 66%.
That would put Bitcoin at $140k.
Friendly reminder:
$BTC has made a bullish cross (MACD) 3D chart.👀🔥
The last four times this happened, we saw a rally of at least 66%.
That would put Bitcoin at $140k.
6
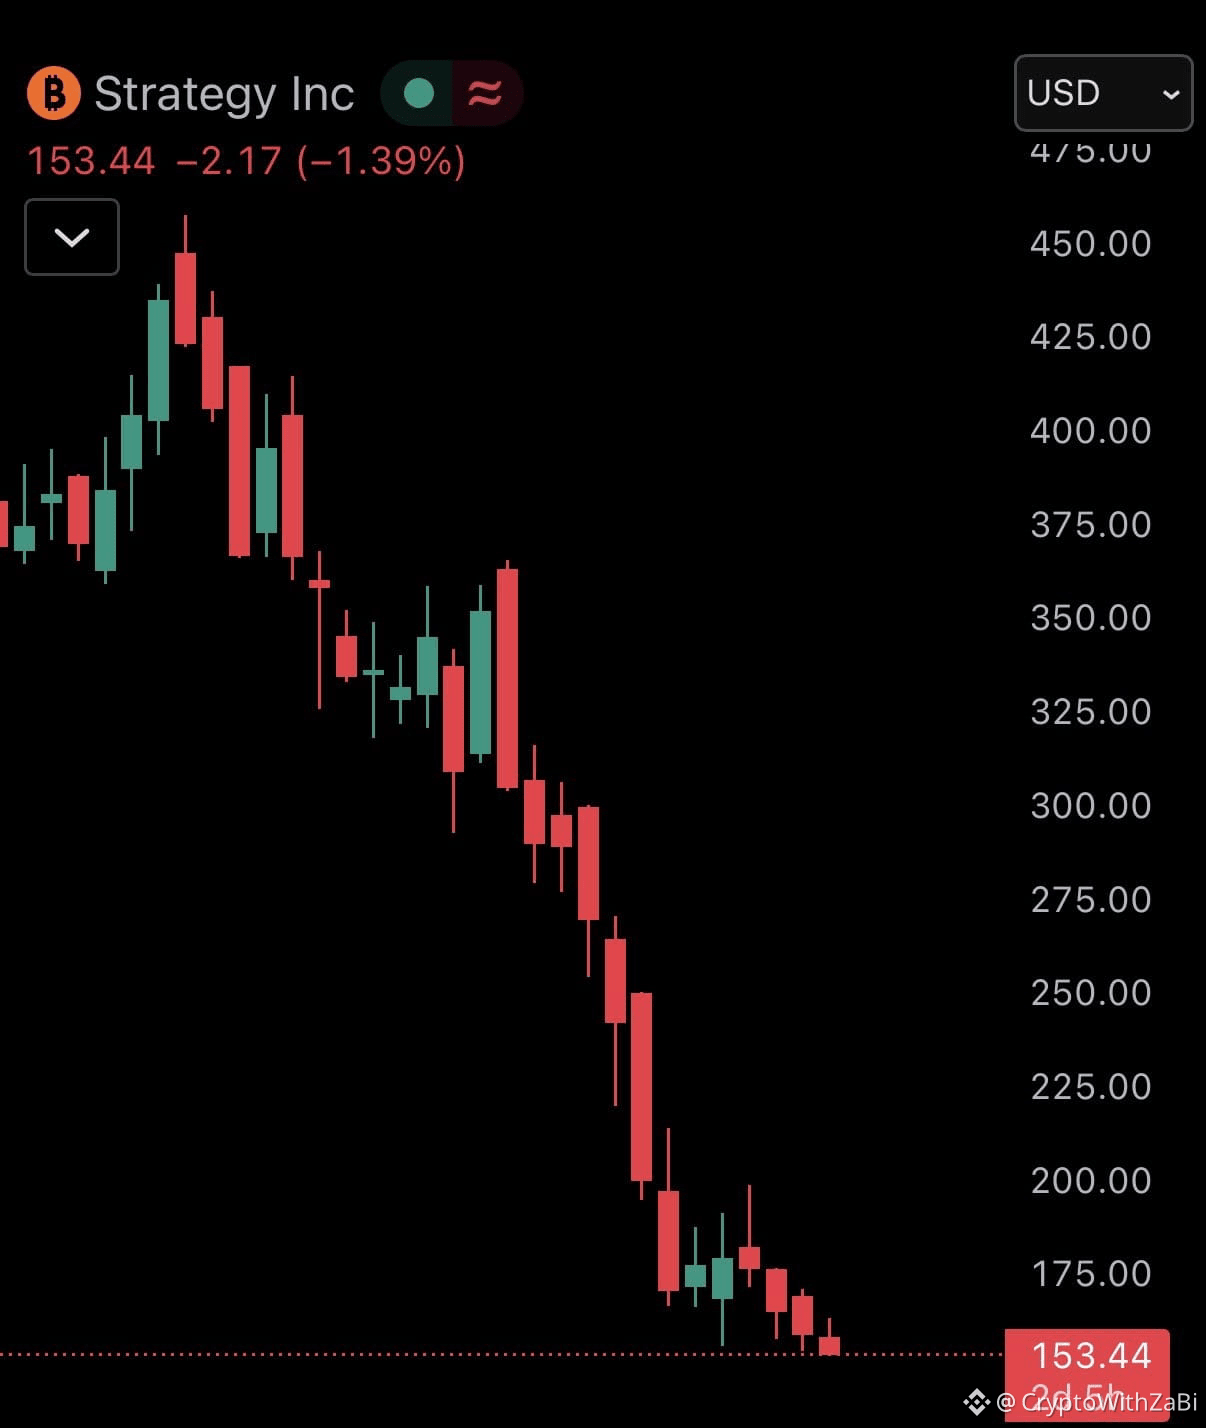
🚨BREAKING: Michael Saylor’s $MSTR has now crashed -66% from $457 to $152 in the last 6 months.
Nearly $90 billion has been wiped out from the strategy’s market cap.
Reasons for this decline are the BTC price crash from $126k to $87k, heavy share dilution, index delisting risks, and NAV premium collapse.
🚨BREAKING: Michael Saylor’s $MSTR has now crashed -66% from $457 to $152 in the last 6 months.
Nearly $90 billion has been wiped out from the strategy’s market cap.
Reasons for this decline are the BTC price crash from $126k to $87k, heavy share dilution, index delisting risks, and NAV premium collapse.
Nearly $90 billion has been wiped out from the strategy’s market cap.
Reasons for this decline are the BTC price crash from $126k to $87k, heavy share dilution, index delisting risks, and NAV premium collapse.
4
223
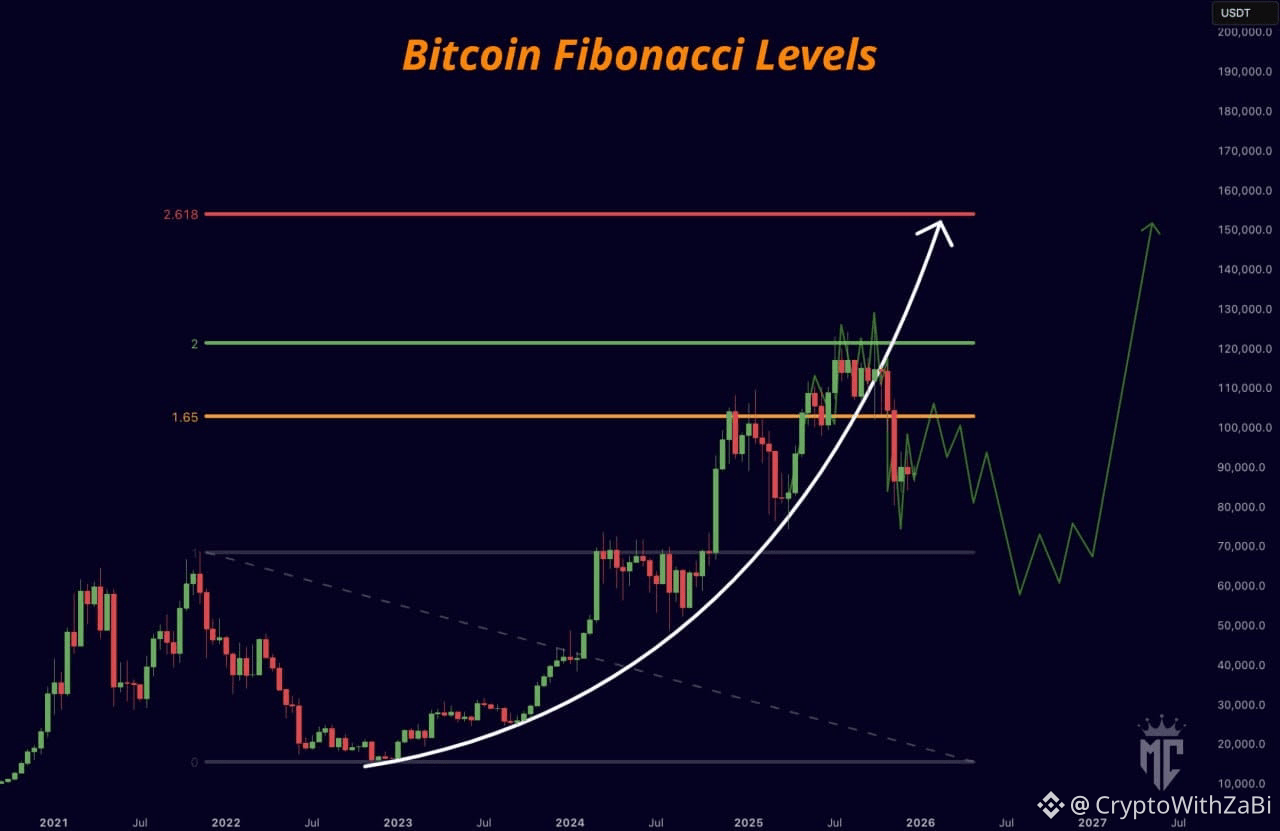
Bitcoin has broken down from this parabola.
Expecting a relief rally, followed by more pressure to the downside.
Bitcoin has broken down from this parabola.
Expecting a relief rally, followed by more pressure to the downside.
Expecting a relief rally, followed by more pressure to the downside.
1
78
·
--
Bullish
🚨 BTC Outlook (Dec – Jan – Feb – April Pattern)
● 21 Dec – 1 Jan
Bullish 🦖 Reversal Window
Most Favourable Bottom: 30 Dec
● 1 Jan – 22 Feb
Strong Bullish 🦖 Momentum (Pump Phase)
● 22 Feb – 27 Feb
Top Formation Zone
Yahin se Bearish 🐻 Move start hoga
● 27 Feb – 12 April
Bearish 🐻 Momentum
● 12 April – 18 April
Extended Bearish 🐻 Phase (Final Dip Window)
🚨 BTC Outlook (Dec – Jan – Feb – April Pattern)
● 21 Dec – 1 Jan
Bullish 🦖 Reversal Window
Most Favourable Bottom: 30 Dec
● 1 Jan – 22 Feb
Strong Bullish 🦖 Momentum (Pump Phase)
● 22 Feb – 27 Feb
Top Formation Zone
Yahin se Bearish 🐻 Move start hoga
● 27 Feb – 12 April
Bearish 🐻 Momentum
● 12 April – 18 April
Extended Bearish 🐻 Phase (Final Dip Window)
● 21 Dec – 1 Jan
Bullish 🦖 Reversal Window
Most Favourable Bottom: 30 Dec
● 1 Jan – 22 Feb
Strong Bullish 🦖 Momentum (Pump Phase)
● 22 Feb – 27 Feb
Top Formation Zone
Yahin se Bearish 🐻 Move start hoga
● 27 Feb – 12 April
Bearish 🐻 Momentum
● 12 April – 18 April
Extended Bearish 🐻 Phase (Final Dip Window)
BUY BOTTOM SELL TOP CALL
START BUYING IN STEPS
17-21 DECEMBER
START SELLING IN STEPS
28 - 30 JANUARY
BUY BOTTOM SELL TOP CALL
START BUYING IN STEPS
17-21 DECEMBER
START SELLING IN STEPS
28 - 30 JANUARY
START BUYING IN STEPS
17-21 DECEMBER
START SELLING IN STEPS
28 - 30 JANUARY
12
Log in to explore more content
Join global crypto users on Binance Square
⚡️ Get latest and useful information about crypto.
💬 Trusted by the world’s largest crypto exchange.
👍 Discover real insights from verified creators.
Email / Phone number
Trending Topics
WhatWillDriveCryptoandStocks’NextRebound?
4,572 views
132 Discussing
Bitcoin Slips Below $70,000 as Dollar Index Hits 19-Month High
Binance News
·8 Likes
·7.6k views
Anthropic’s6xIPODemandSignalsPotentialRecordRaise
1,447 views
60 Discussing
HuangExitNvidiaStrategyInFocus
136,854 views
1,354 Discussing