

Muhammad_Amir_Raza
339 Posts

Muhammad_Amir_Raza
Report
Block User
Passionate Crypto Trader & Analyst | Real-Time Signals, Insights & Guides | Helping You Trade Smarter, Not Harder | #SmartTradersMAT
Open Trade
Frequent Trader
3.2 Years
4 Following
60 Followers
161 Liked
Posts
Portfolio
All
Videos
·
--
Bullish
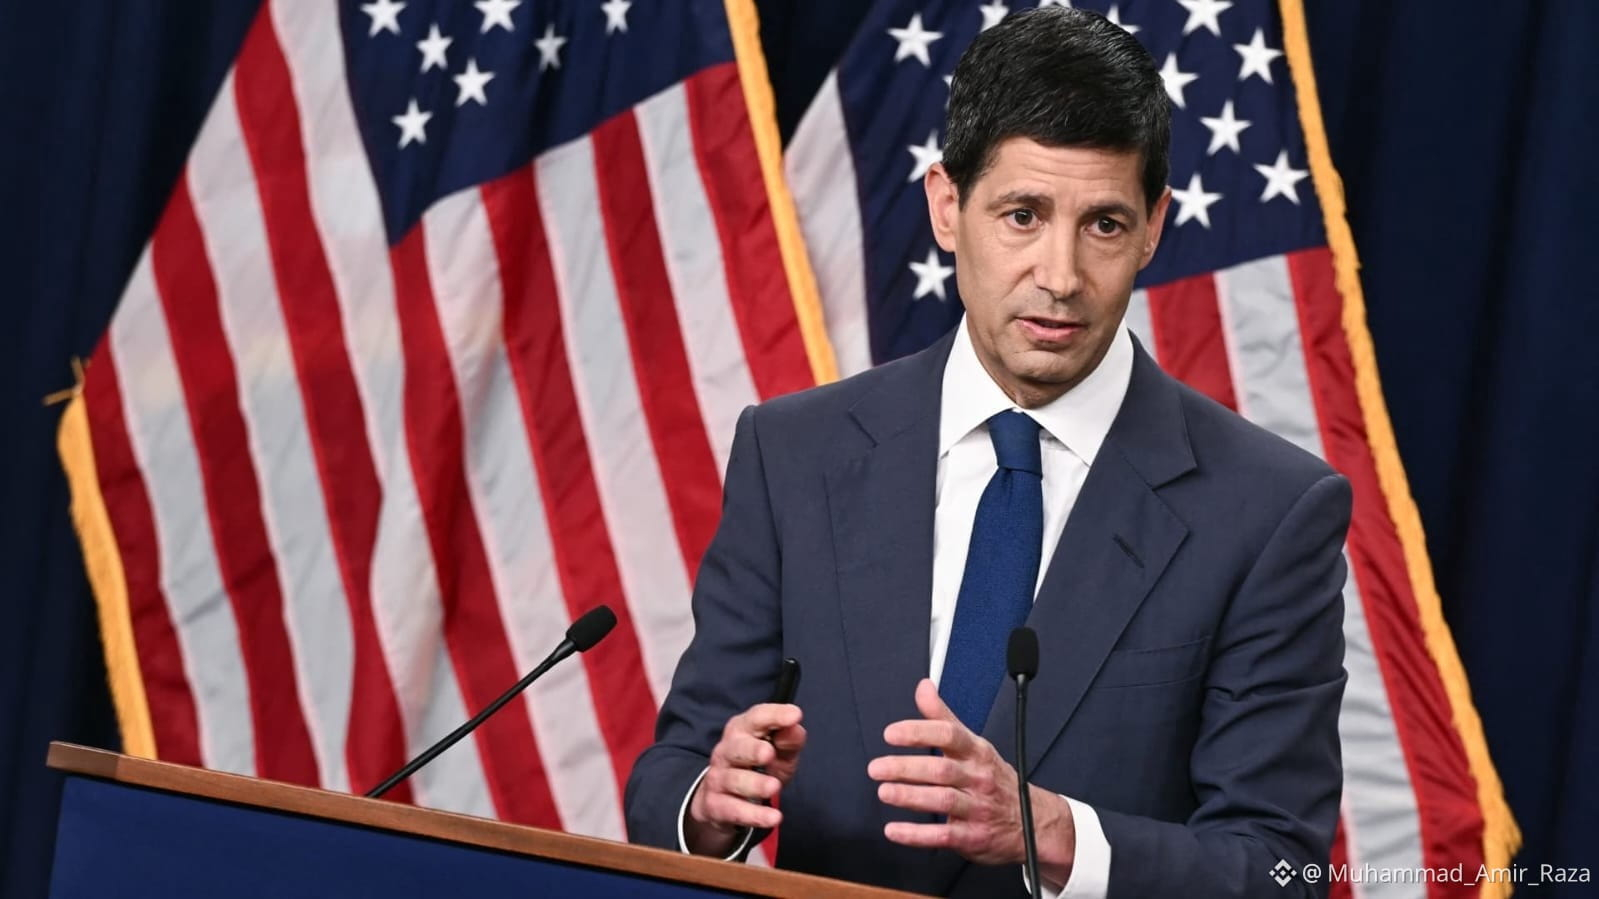
US CPI DATA TODAY
Inflation is expected to rise from 3.4% to 3.6%.
Previous: 3.4%
Forecast: 3.6%
If inflation comes in higher than expected, Bitcoin could come under pressure.
If inflation is lower than expected, $BTC could get a boost.
#CPIWatch
US CPI DATA TODAY
Inflation is expected to rise from 3.4% to 3.6%.
Previous: 3.4%
Forecast: 3.6%
If inflation comes in higher than expected, Bitcoin could come under pressure.
If inflation is lower than expected, $BTC could get a boost.
#CPIWatch
Inflation is expected to rise from 3.4% to 3.6%.
Previous: 3.4%
Forecast: 3.6%
If inflation comes in higher than expected, Bitcoin could come under pressure.
If inflation is lower than expected, $BTC could get a boost.
#CPIWatch
114
·
--
Bearish
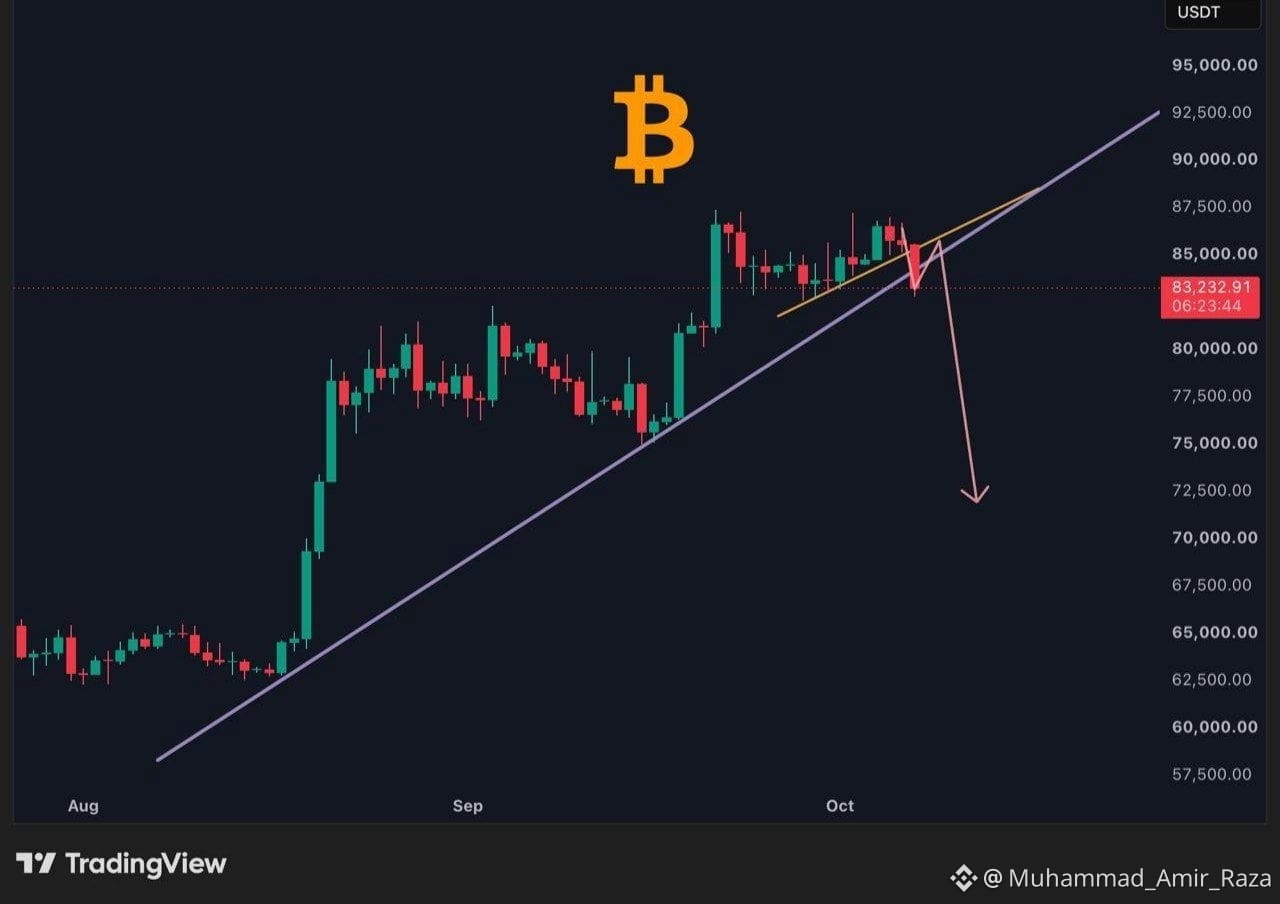
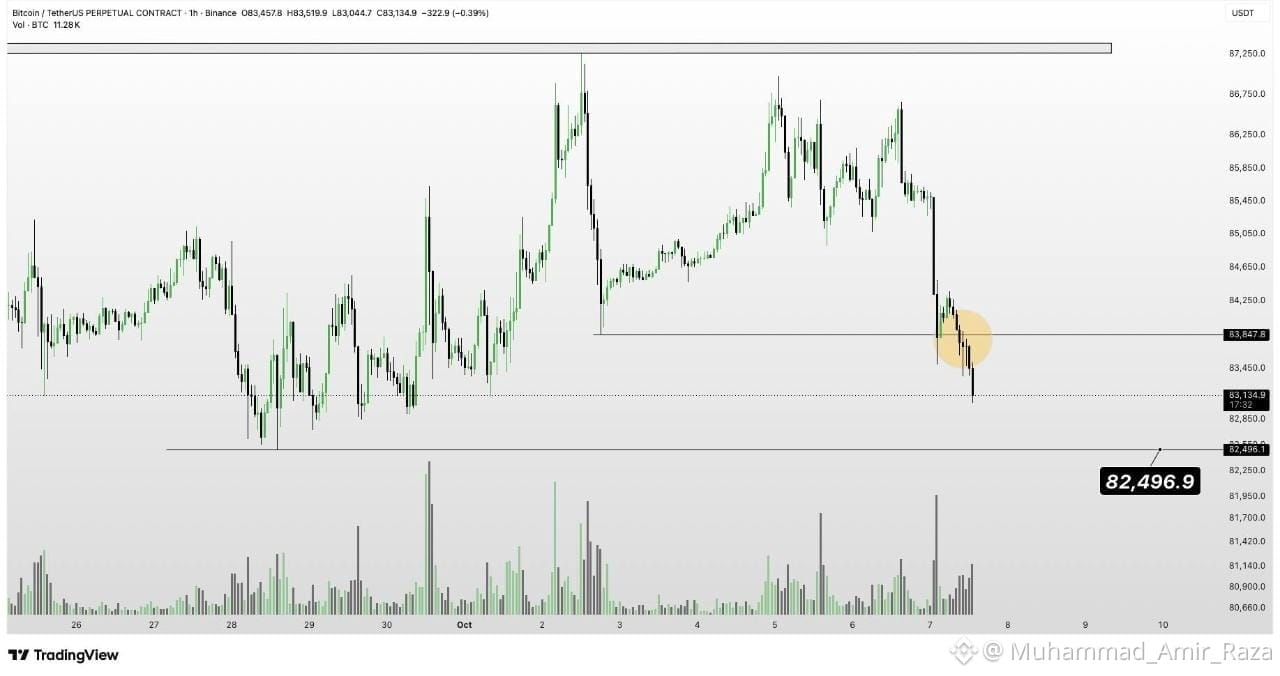
$BTC / USDT | CRITICAL BREAKDOWN ALERT
Bitcoin is testing its long-term ascending trendline from August.
We saw a clear breakdown from the short-term rising wedge (yellow) and now BTC is hovering right around the major trendline support near $83,200.
Bearish Scenario (Playing out):
If BTC fails to reclaim $85,000 - $85,500 quickly and closes below the purple trendline, this is a classic trendline breakdown.
Next downside target: $72,000 - $73,000
That would be a ∼12% correction from current levels.
Bullish Invalidation:
If buyers defend $82,800 and push back above $85,500, the breakdown becomes a fakeout and BTC could continue towards $92,500.
The next 4H - Daily close is very important.
Are you expecting a bounce or $72k incoming?
#Bitcoin #BTC #crypto
101
·
--
Bearish
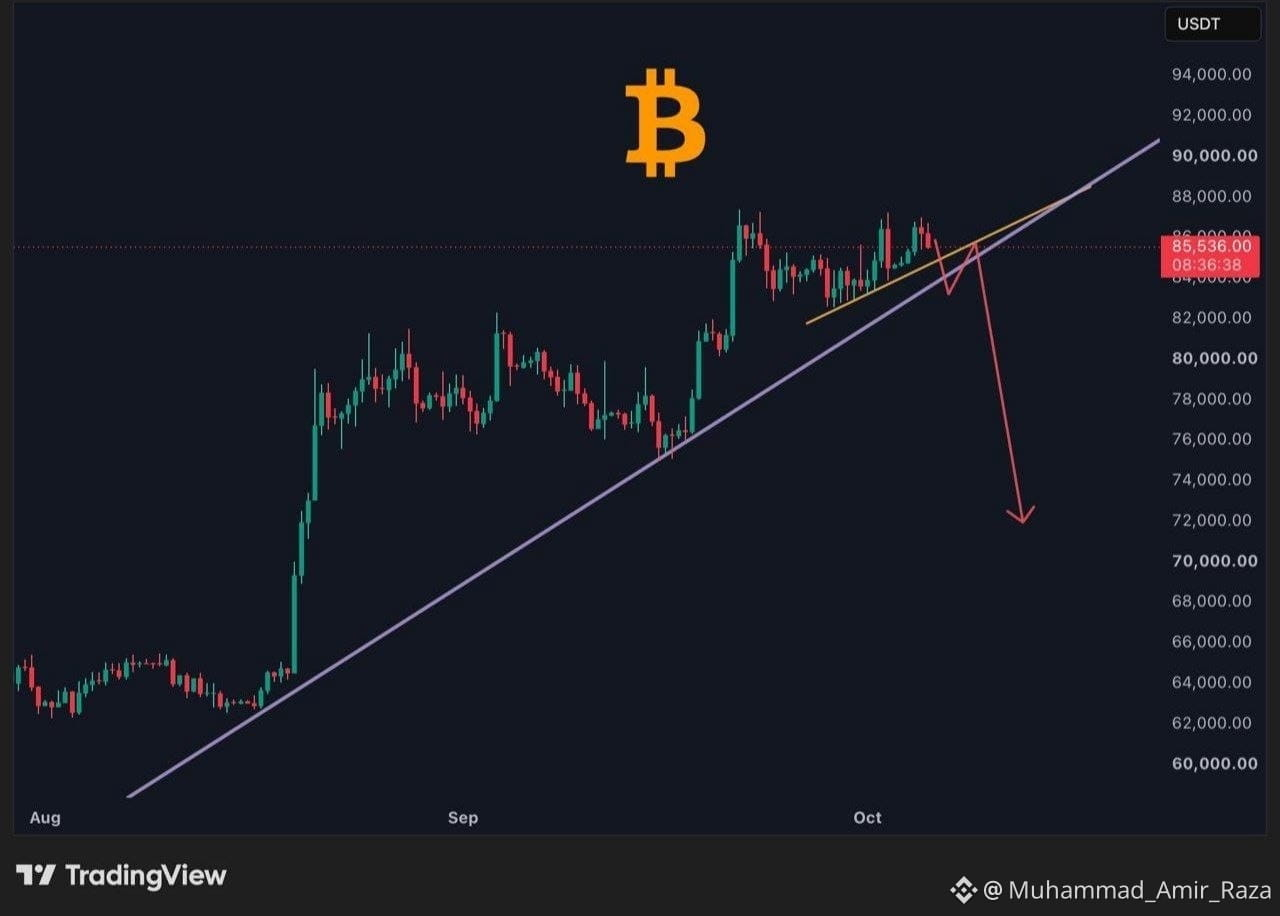
💰 $BTC Keep an eye on these two trendlines.
A breakdown could trigger the start of a 5–10% correction.
#BTC
💰 $BTC Keep an eye on these two trendlines.
A breakdown could trigger the start of a 5–10% correction.
#BTC
A breakdown could trigger the start of a 5–10% correction.
#BTC
116
·
--
Bullish
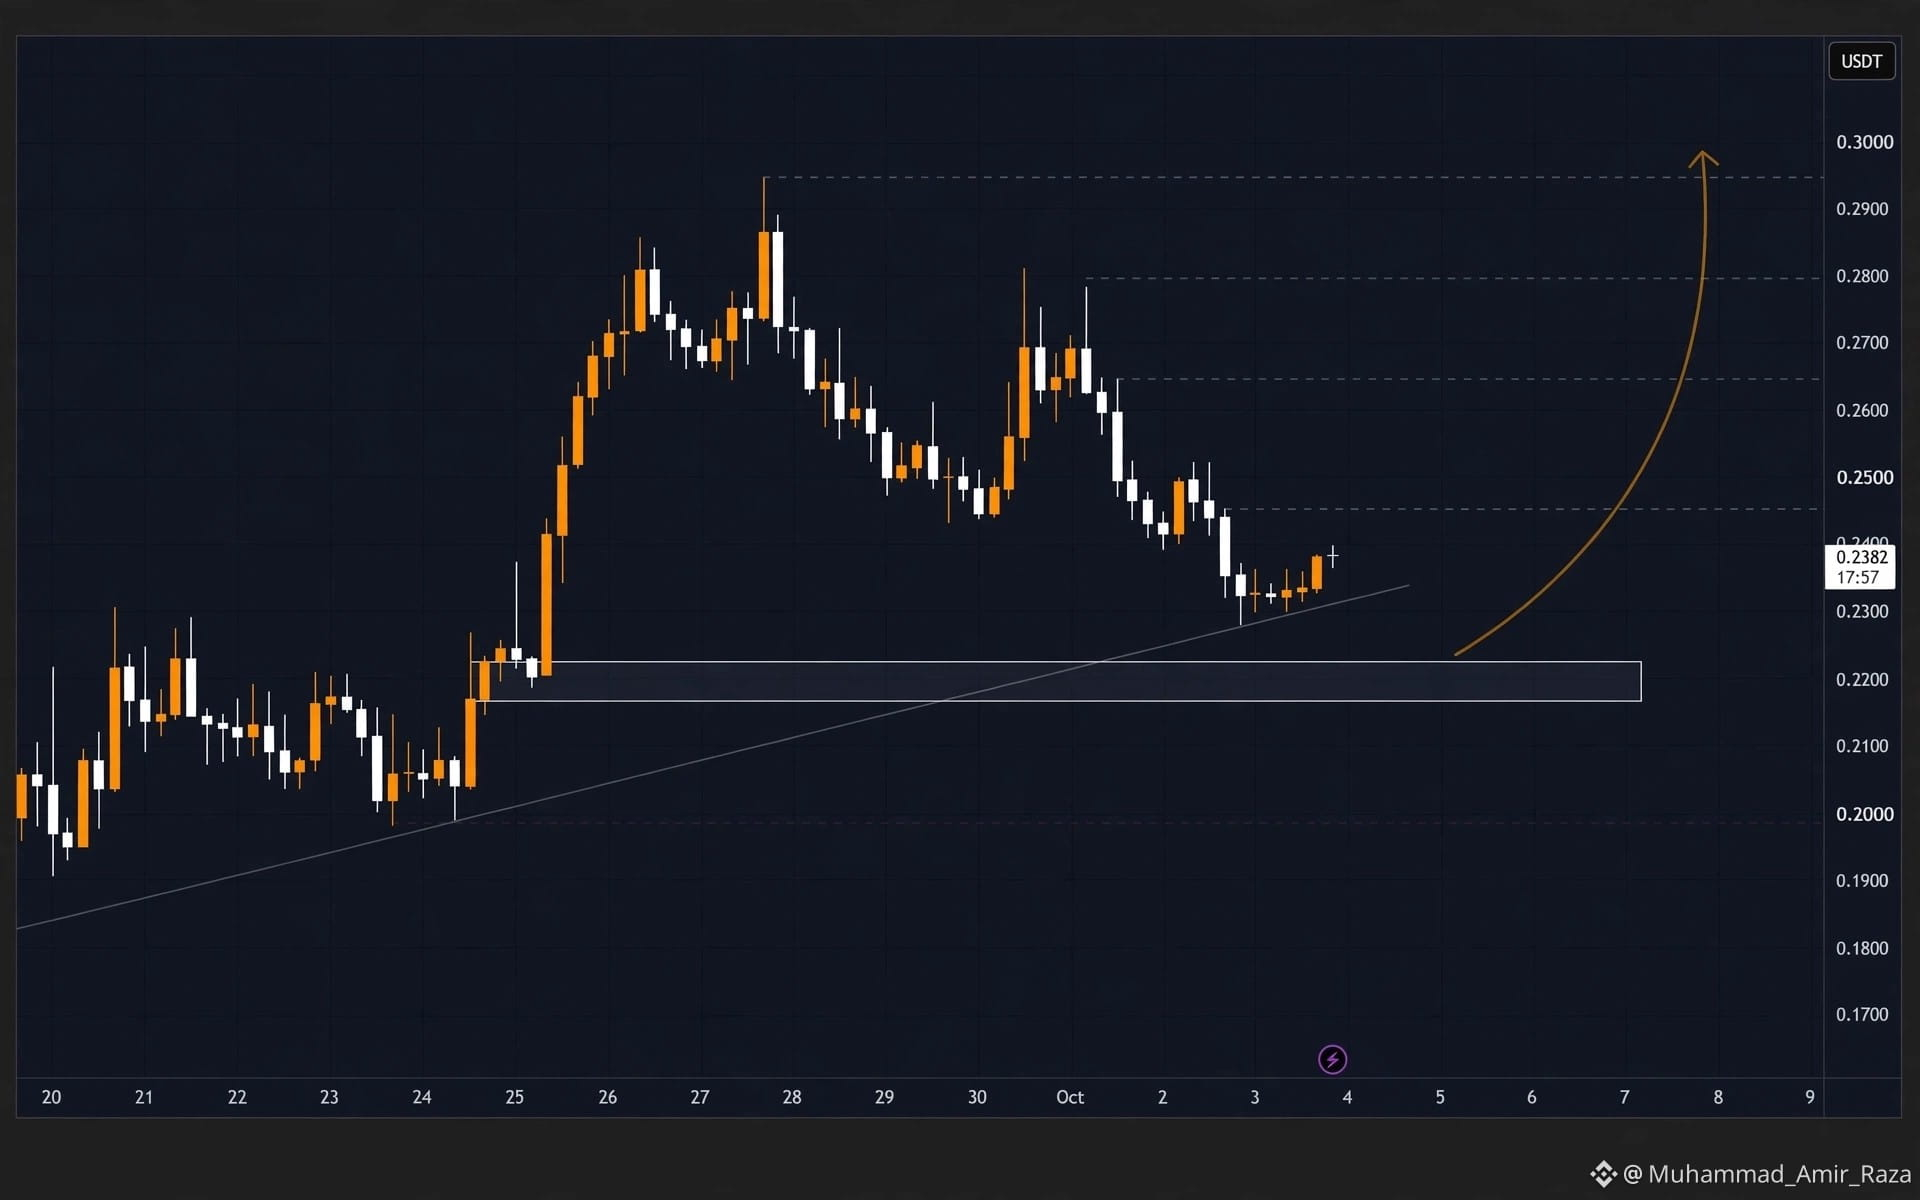
$ENA /USDT | 4H UPDATE
ENA is consolidating above a key support zone around $0.216 - $0.222, while the rising trendline continues to support the bullish structure.
If this zone holds and price continues forming higher lows, we could see a move toward $0.245 - $0.265 - $0.280, with potential for a stronger breakout toward $0.300.
If the support zone breaks, the bullish structure could weaken and a deeper retracement may follow.
#ENA #TrendingTopic
293
·
--
Bullish
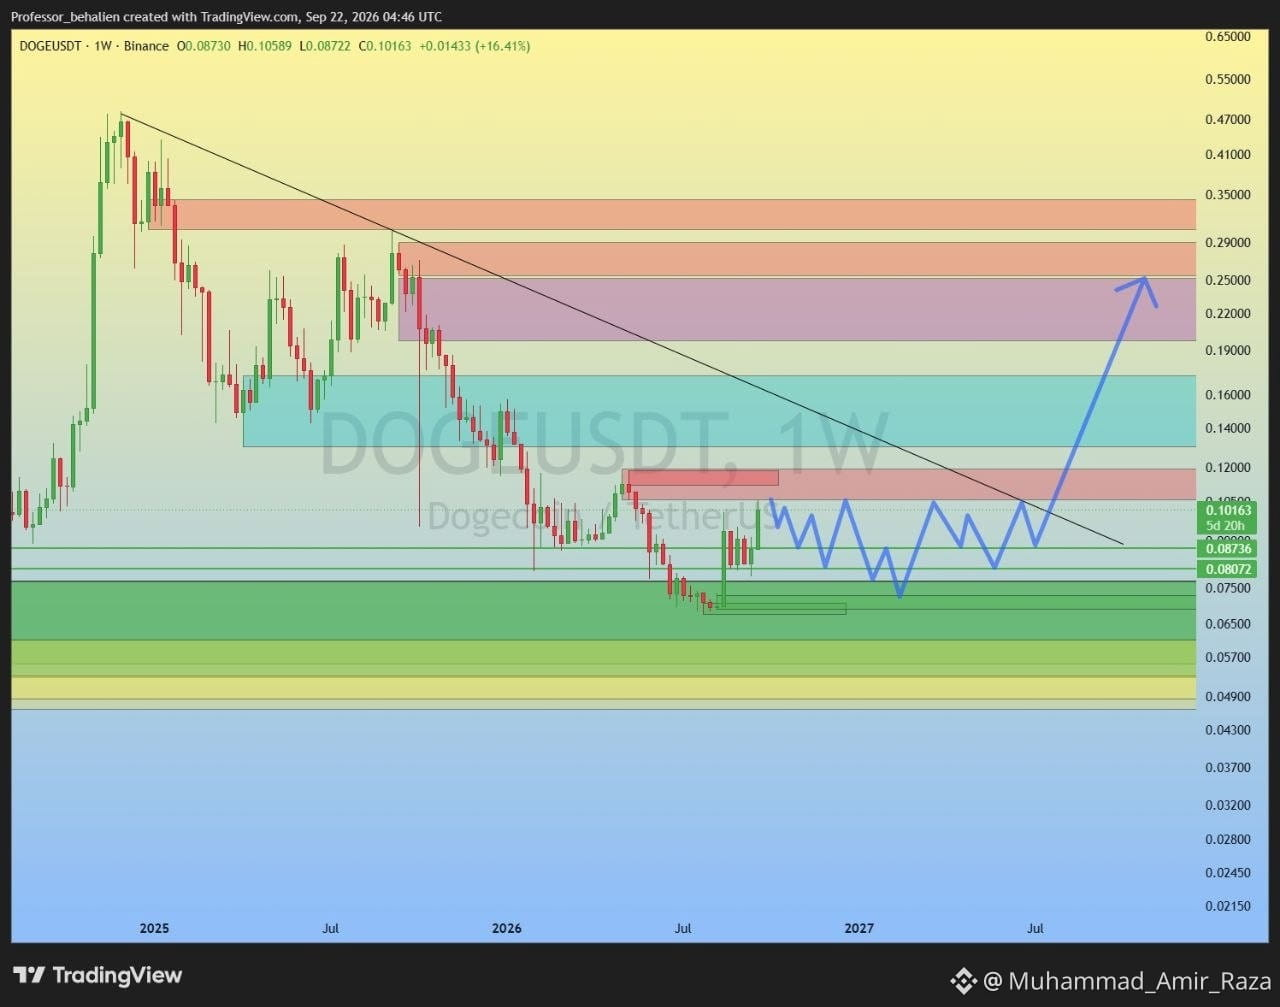
$DOGE / USDT Weekly Technical Outlook
Dogecoin has experienced a swift pump straight into our highlighted major supply zone around $0.105.
Looking at the structural behavior on the weekly time-frame, I am expecting price to respect this key resistance area ($0.105 – $0.120) and follow the blue path, leading to a choppy consolidation and a secondary drop.
📉 Trade Setup (Short Bias):
• Primary Entry Zone: Around $0.105
• DCA / Scale-in Zone: Up to $0.110
• Stop Loss: Daily candle close above $0.120
• Downside Targets: $0.087 first, followed by $0.081
⚠️ Bullish Invalidation & Expansion Scenario:
Should buyers manage a clean breakout and hold above the $0.120 major supply level, the bearish thesis invalidates entirely, opening the path for a powerful macro expansion toward $0.250.
Manage your risk accordingly and stick to the plan.
#DOGE #DOGECOIN #CryptoAnalysis #TechnicalAnalysis #SmartMoney
99
·
--
Bullish
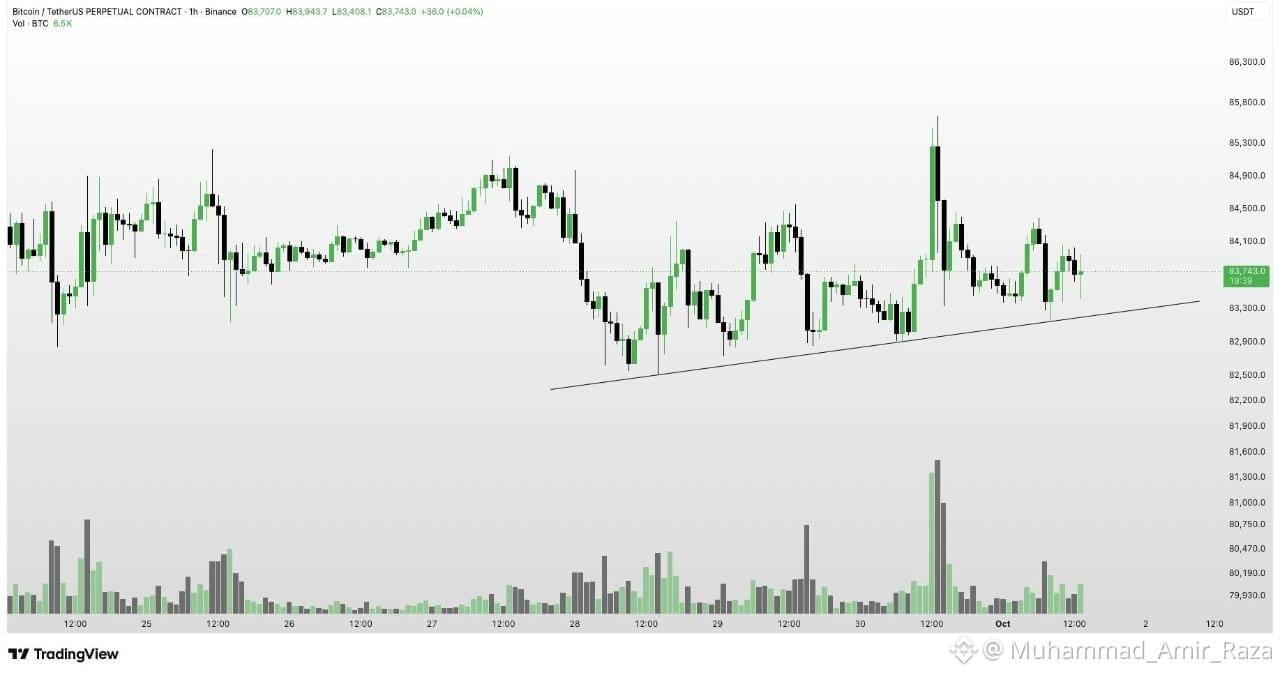
$BTC important support , looks like we are going to see breakdown 😐
$BTC important support , looks like we are going to see breakdown 😐
51
·
--
Bullish
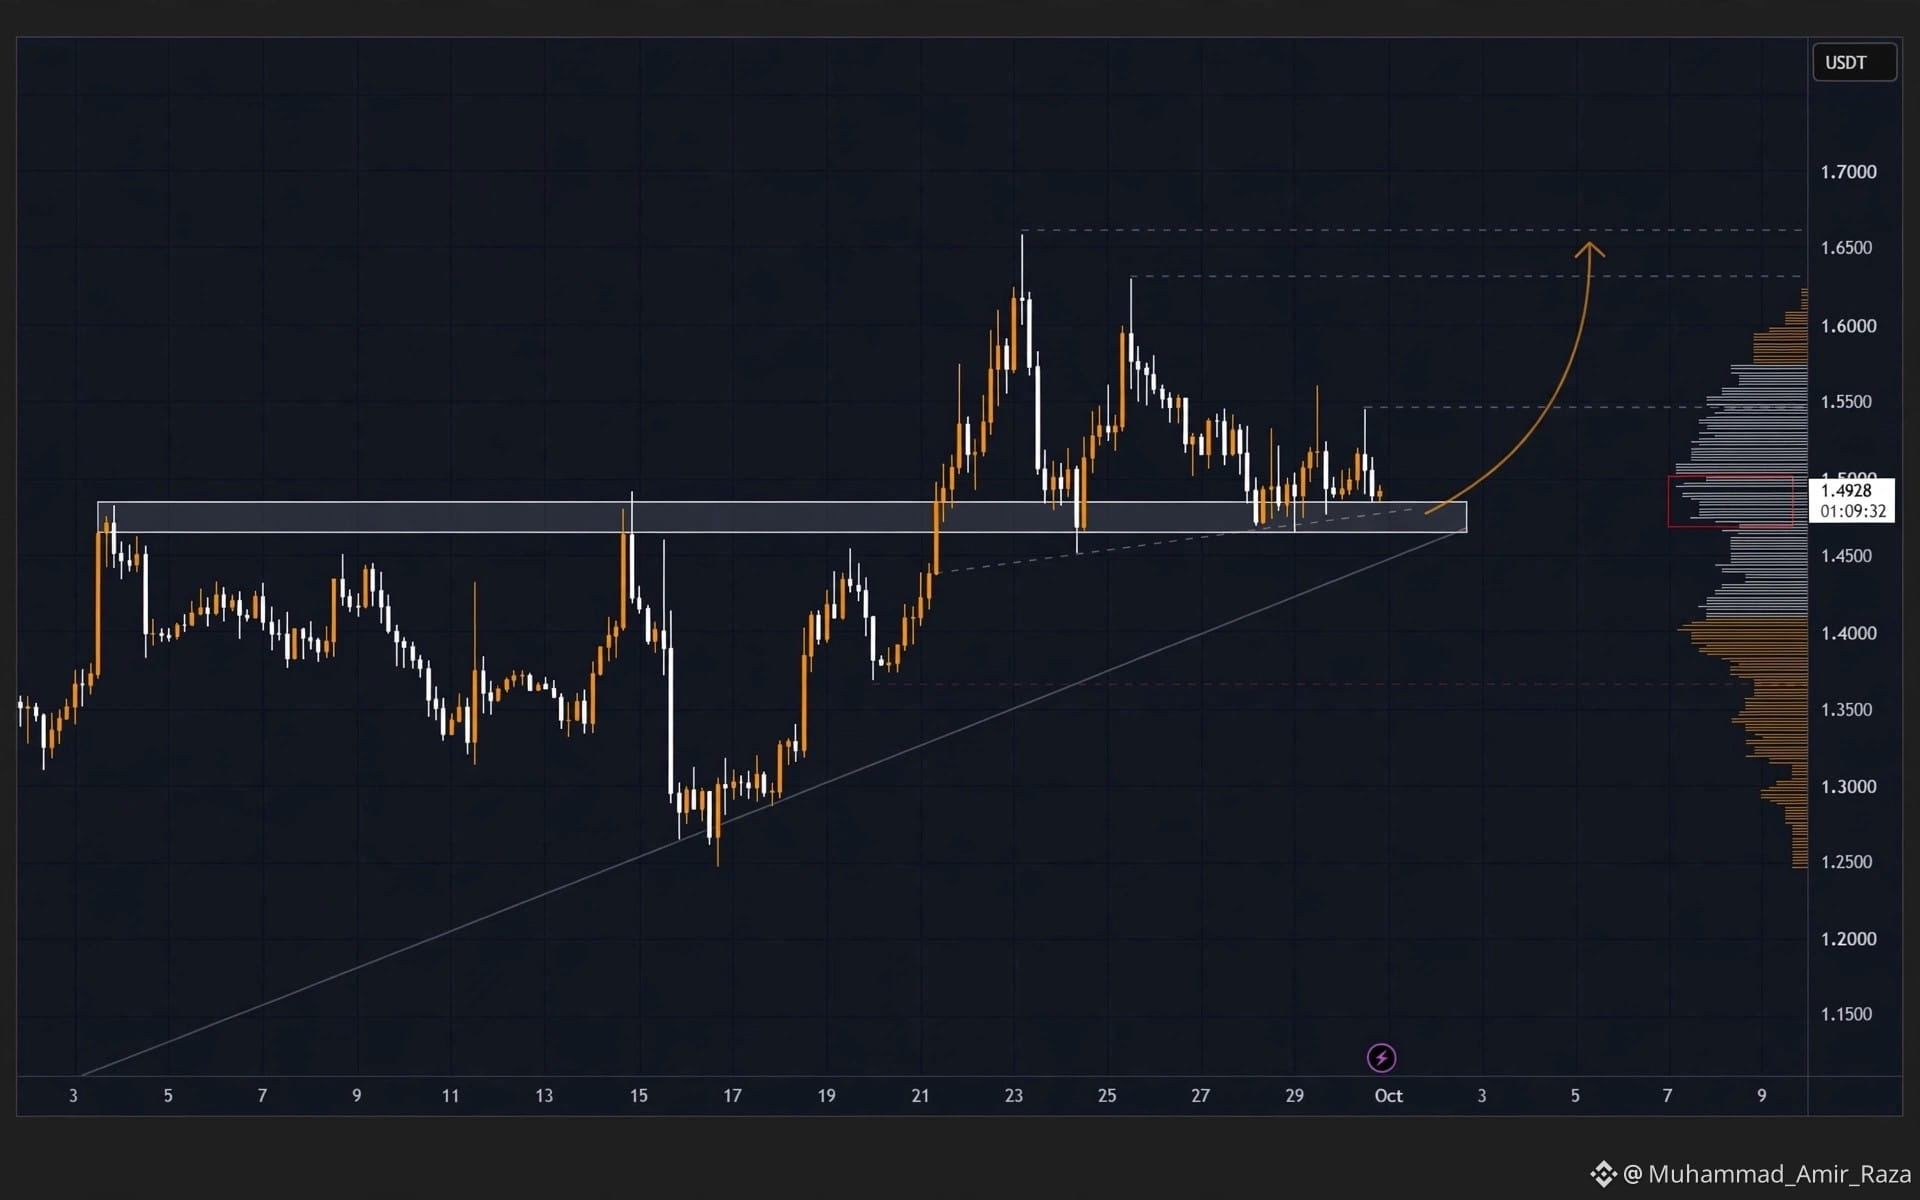
$XRP is consolidating around a key support zone between $1.47 and $1.49, where horizontal support aligns with the rising trendline.
As long as this zone holds, we could see a bullish continuation toward the next resistance levels around $1.53, $1.60, and $1.65.
A successful bounce from this area could give XRP the momentum needed to retest the recent highs. However, a breakdown below support and the ascending trendline could weaken the bullish structure.
88
·
--
Bullish
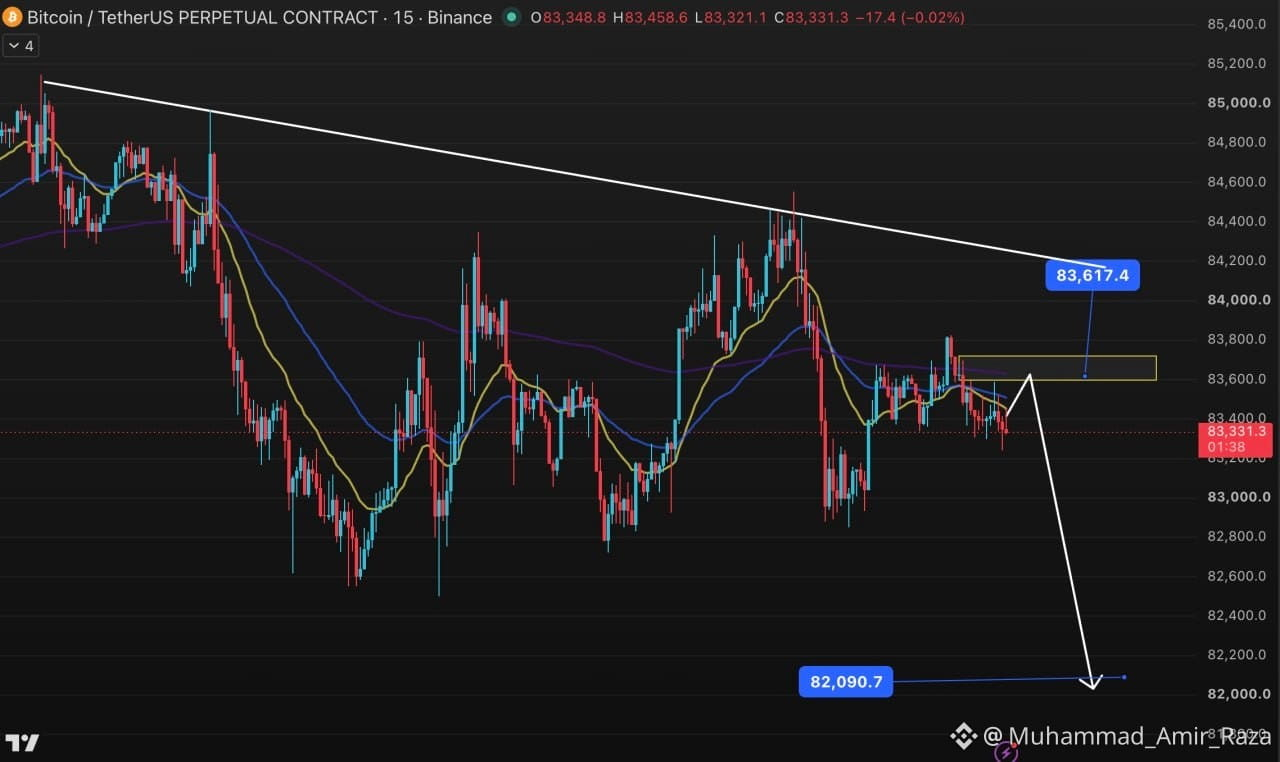
🔥 $BTC UPDATE 30/09 – PRIORITY SHORT ON REBOUND
On M15 and M30, price is currently below the short/medium-term MA cluster. Rebounds are consistently sold off, and the recent structure shows lower highs, indicating that sellers are controlling the 83.6K–83.8K zone. H1 has also not yet reclaimed the key MAs. 📉
#BTC
On M15 and M30, price is currently below the short/medium-term MA cluster. Rebounds are consistently sold off, and the recent structure shows lower highs, indicating that sellers are controlling the 83.6K–83.8K zone. H1 has also not yet reclaimed the key MAs. 📉
#BTC
77
·
--
Bullish
🇺🇸 TODAY: Warsh’s Fed gets another reason to either hike or hold.
The following macro data will give markets a fresh read on the US economy:
- Case-Shiller home prices
- Consumer confidence
- JOLTS job openings
Plus, 4 Fed officials will speak as markets look for clues on the next rate move.
Be ready.
The following macro data will give markets a fresh read on the US economy:
- Case-Shiller home prices
- Consumer confidence
- JOLTS job openings
Plus, 4 Fed officials will speak as markets look for clues on the next rate move.
Be ready.

71
·
--
Bullish
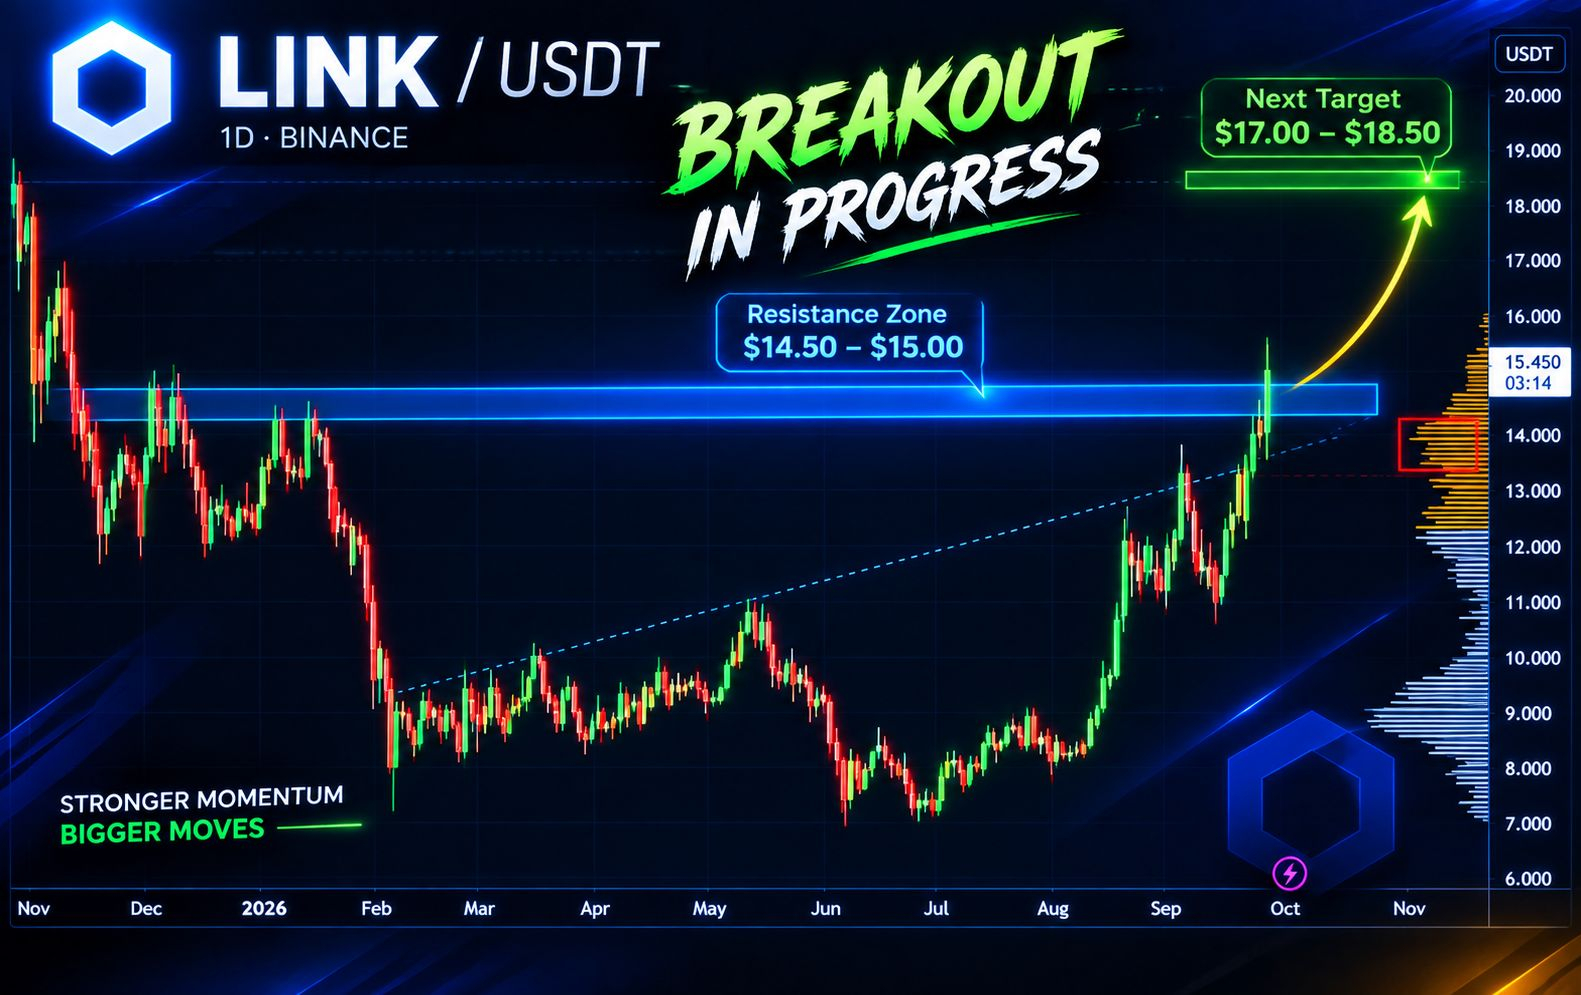
$LINK Daily Chart Update
LINK has broken out strongly from its previous consolidation range and is now approaching a major resistance zone around $14.50–$15.00.
If LINK breaks above this zone and holds it as support, further upside toward $17.00–$18.50 could be possible, where the next major resistance area lies.
#LINK #Chainlink #Crypto #Trading #Altcoins
104
·
--
Bullish
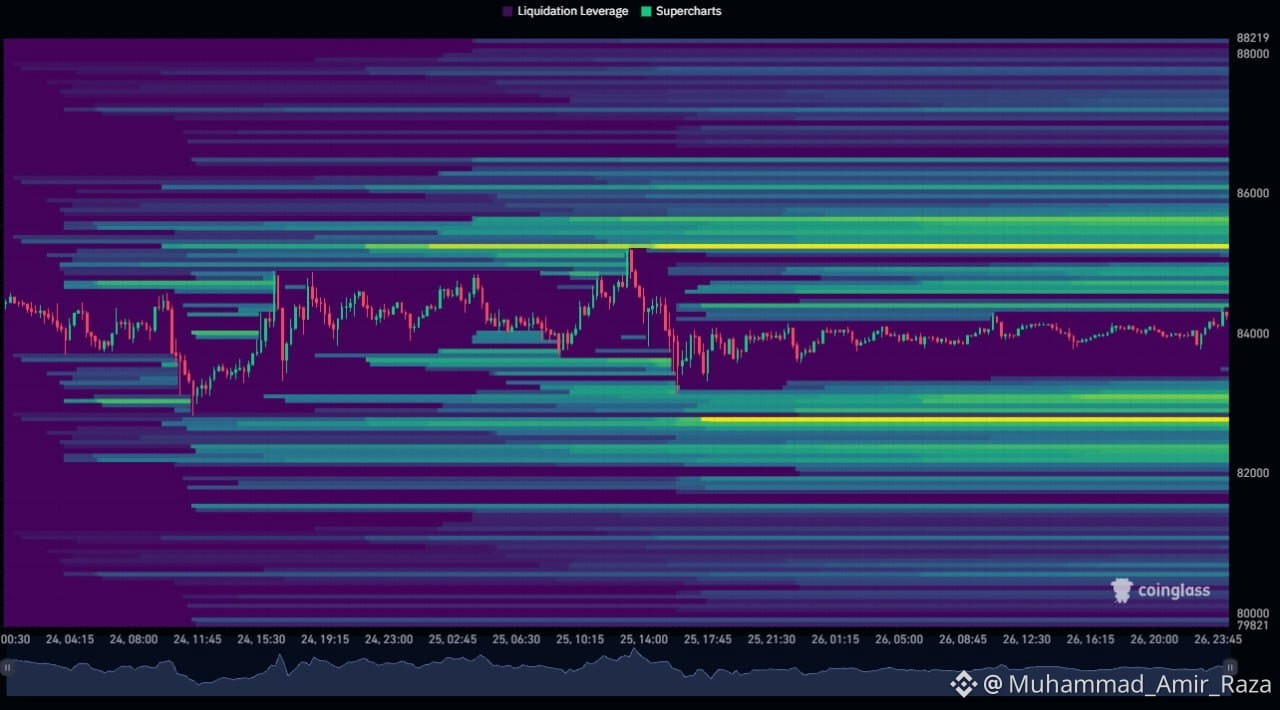
📊 Bitcoin 3-Day Liquidity Heatmap Update
Bitcoin’s liquidation heatmap shows significant liquidity clusters both above and below the current price.
These liquidity zones often act as price magnets, as the market may move toward areas with high concentrations of liquidity.
Expect potential volatility and sharp price movements as BTC approaches these key levels.
$BTC
98
·
--
Bullish
🇺🇸 In reaction to a media boycott, the White House is introducing a 24-hour channel called Trump TV. Major U.S. media organizations had previously opted not to cover Trump events in support of CNN, MSNBC, and Politico, which have been barred from the White House.
🇺🇸 In reaction to a media boycott, the White House is introducing a 24-hour channel called Trump TV. Major U.S. media organizations had previously opted not to cover Trump events in support of CNN, MSNBC, and Politico, which have been barred from the White House.

76
·
--
Bullish
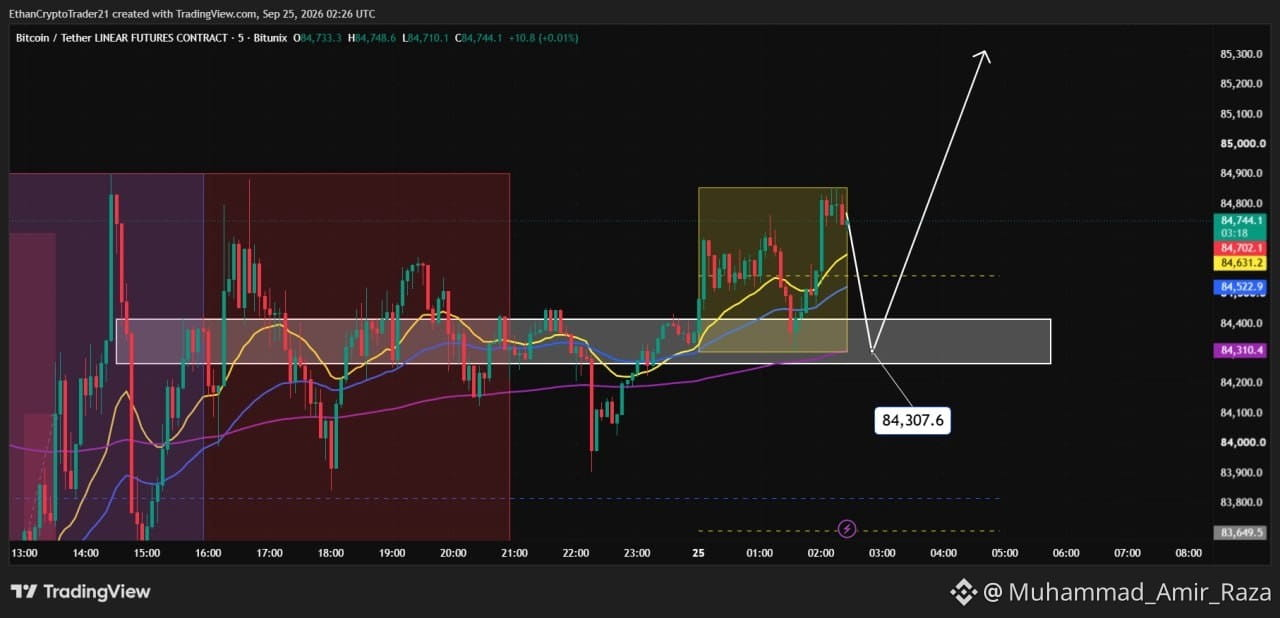
📊 BTC UPDATE — SEPTEMBER 25
BTC is currently around $84.7K and the short-term structure is still showing bullish momentum. Price has pushed above the $84.4K area and is holding above the EMA20/50/200 structure.
🎯 Key zone to watch:
$84.25K – $84.45K
If BTC pulls back into this zone and holds as support, the chart suggests a potential LONG continuation toward:
🚀 TP1: $85.0K
🚀 TP2: $85.3K+
The key is to wait for the pullback and confirmation rather than chase the current move.
💜 Stay patient. Stay disciplined. Let the setup come to us.
#BTC
72
·
--
Bullish
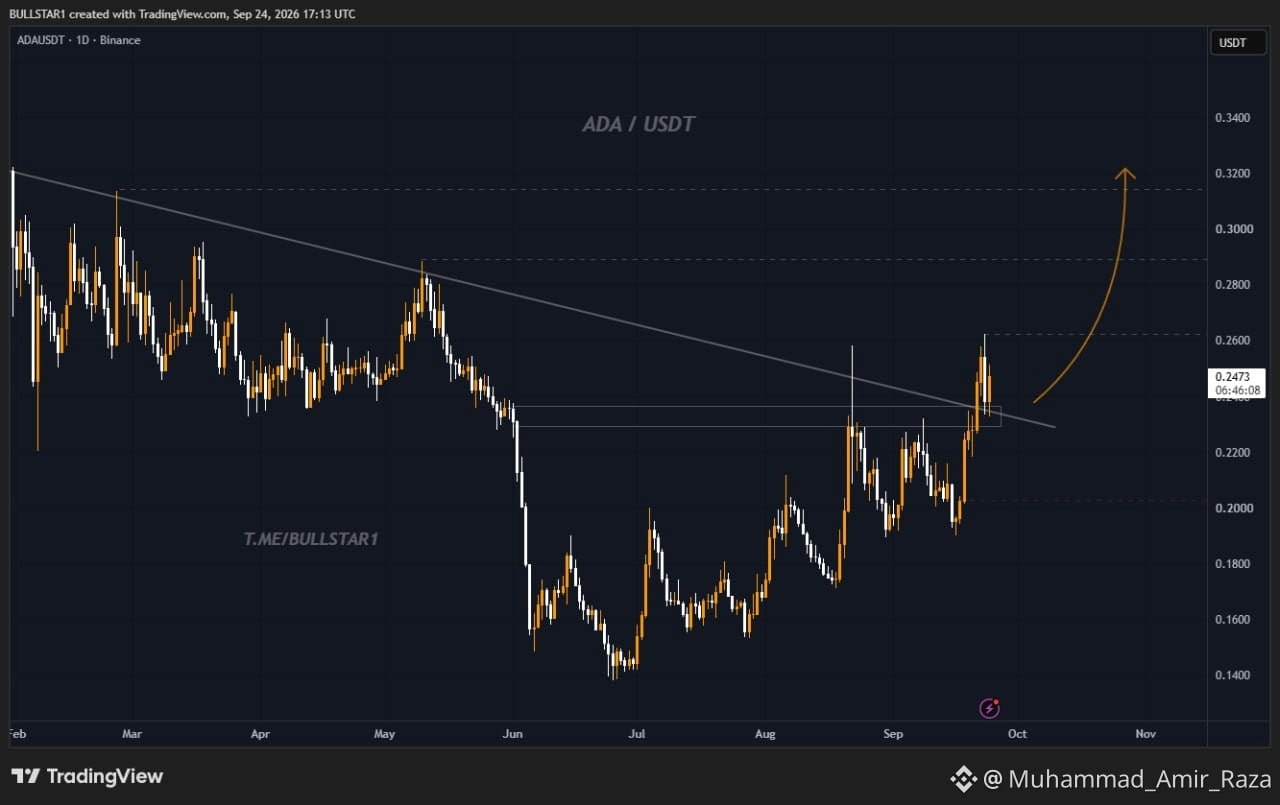
$ADA / USDT | 1D MARKET UPDATE
ADA is approaching a key descending trendline resistance that has been active for several months.
A confirmed breakout above the $0.25–$0.26 zone could open the way toward the next areas around $0.27, $0.30 and $0.32.
The main level to watch now is the trendline breakout and daily confirmation.
ADA is approaching a key descending trendline resistance that has been active for several months.
A confirmed breakout above the $0.25–$0.26 zone could open the way toward the next areas around $0.27, $0.30 and $0.32.
The main level to watch now is the trendline breakout and daily confirmation.
63
·
--
Bullish
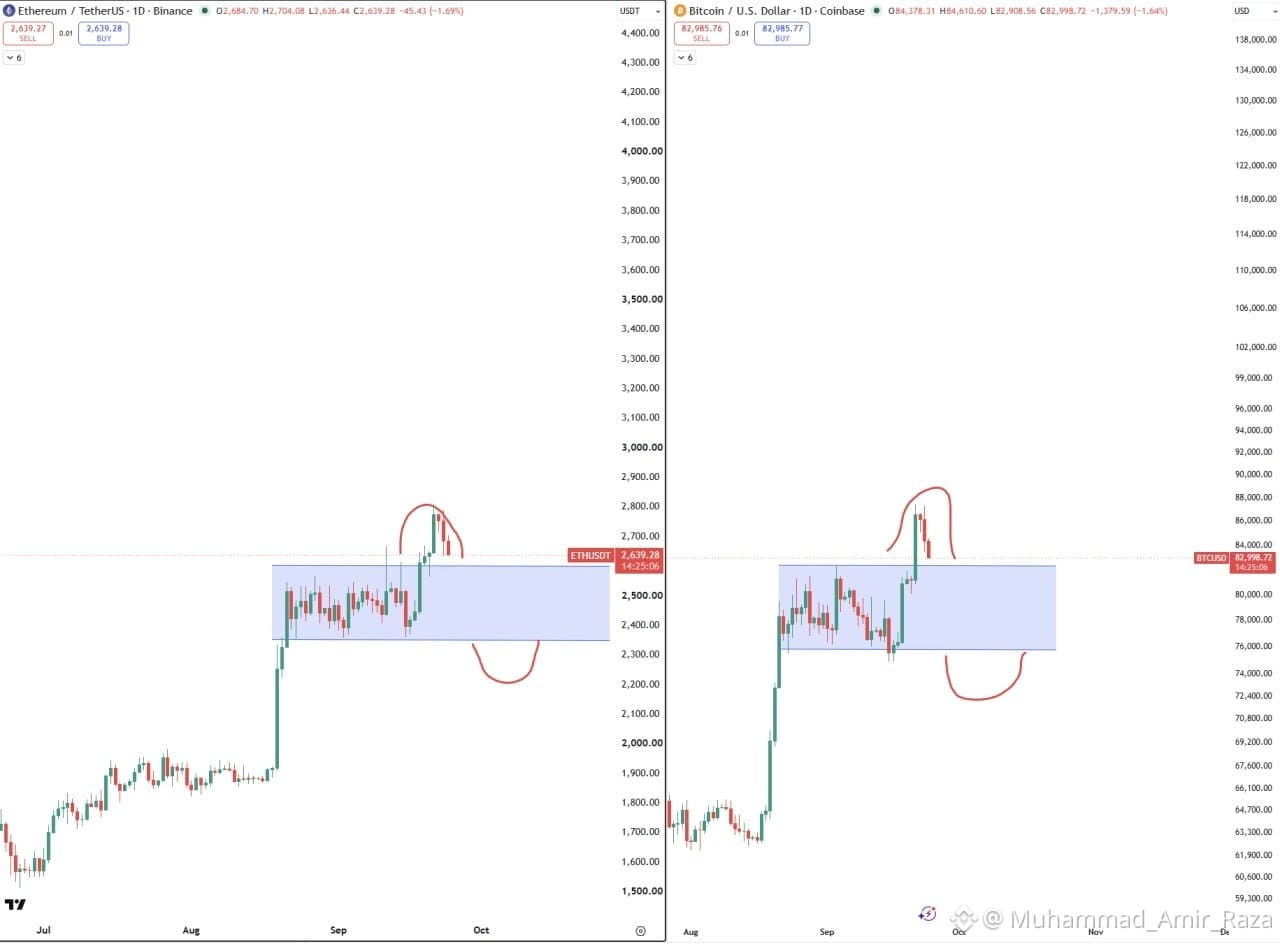
$BTC & $ETH looking ready for a pullback 👀
Both are currently extended above their ranges.
A retest of the support zones could come first:
$BTC → $76K–$78K
$ETC → $2,350–$2,450
If these zones hold, October could bring a much bigger move. 🚀
Patience. Let the market confirm the next move.
$BTC & $ETH looking ready for a pullback 👀
Both are currently extended above their ranges.
A retest of the support zones could come first:
$BTC → $76K–$78K
$ETC → $2,350–$2,450
If these zones hold, October could bring a much bigger move. 🚀
Patience. Let the market confirm the next move.
Both are currently extended above their ranges.
A retest of the support zones could come first:
$BTC → $76K–$78K
$ETC → $2,350–$2,450
If these zones hold, October could bring a much bigger move. 🚀
Patience. Let the market confirm the next move.
77
·
--
Bullish
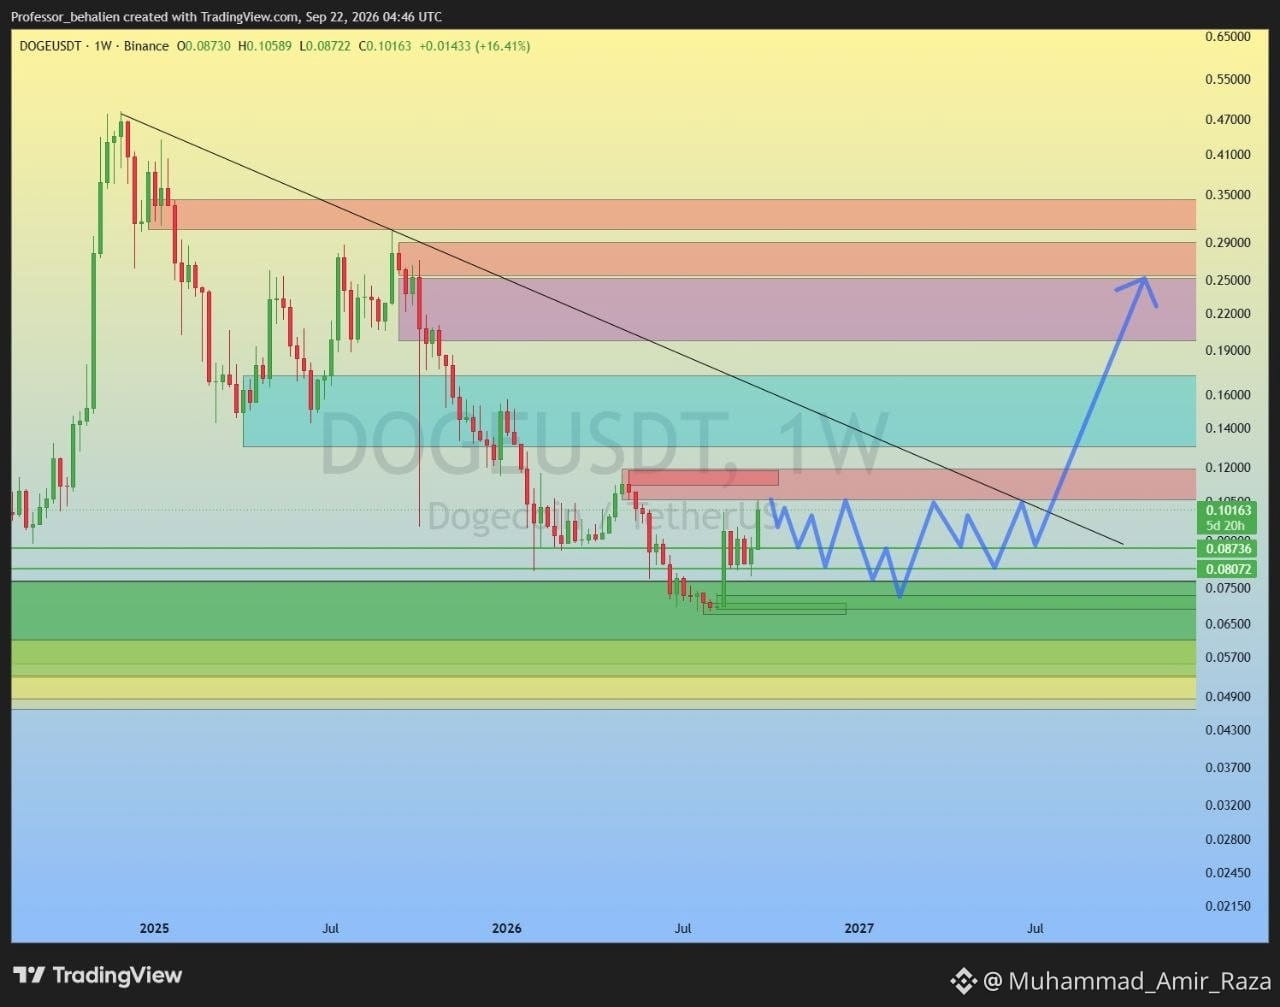
$DOGE / USDT Weekly Technical Outlook 📊
Dogecoin has experienced a swift pump straight into our highlighted major supply zone around $0.105.
Looking at the structural behavior on the weekly time-frame, I am expecting price to respect this key resistance area ($0.105 – $0.120) and follow the blue path, leading to a choppy consolidation and a secondary drop.
📉 Trade Setup (Short Bias):
• Primary Entry Zone: Around $0.105
• DCA / Scale-in Zone: Up to $0.110
• Stop Loss: Daily candle close above $0.120
• Downside Targets: $0.087 first, followed by $0.081
⚠️ Bullish Invalidation & Expansion Scenario:
Should buyers manage a clean breakout and hold above the $0.120 major supply level, the bearish thesis invalidates entirely, opening the path for a powerful macro expansion toward $0.250.
Manage your risk accordingly and stick to the plan.
#DOGE #DOGECOIN #CryptoAnalysis #TechnicalAnalysis #SmartMoney
112
·
--
Bullish
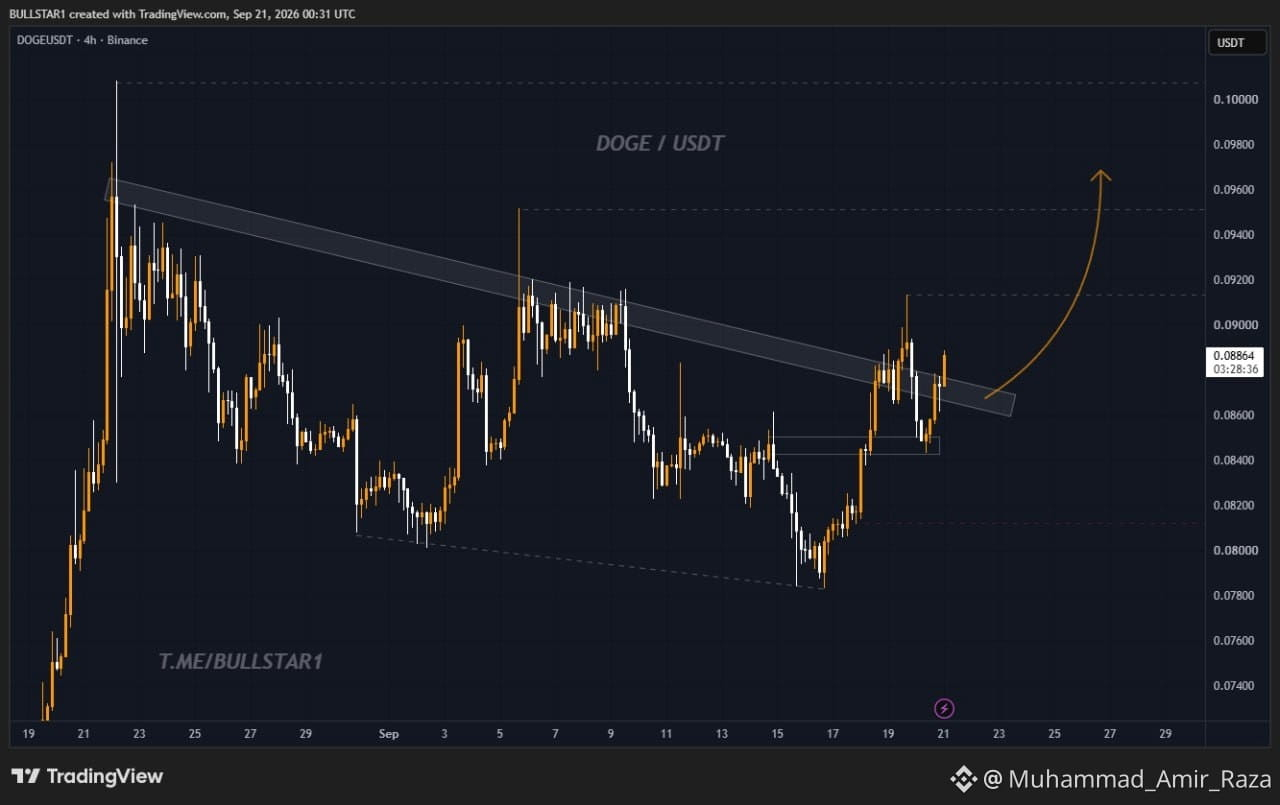
$DOGE is currently testing the descending trendline on the 4H chart.
A confirmed breakout above this trendline could give DOGE room to move toward $0.092, followed by the $0.095 area.
The $0.084 - $0.086 zone remains an important support area to watch.
#DOGE
$DOGE is currently testing the descending trendline on the 4H chart.
A confirmed breakout above this trendline could give DOGE room to move toward $0.092, followed by the $0.095 area.
The $0.084 - $0.086 zone remains an important support area to watch.
#DOGE
A confirmed breakout above this trendline could give DOGE room to move toward $0.092, followed by the $0.095 area.
The $0.084 - $0.086 zone remains an important support area to watch.
#DOGE
87
·
--
Bullish
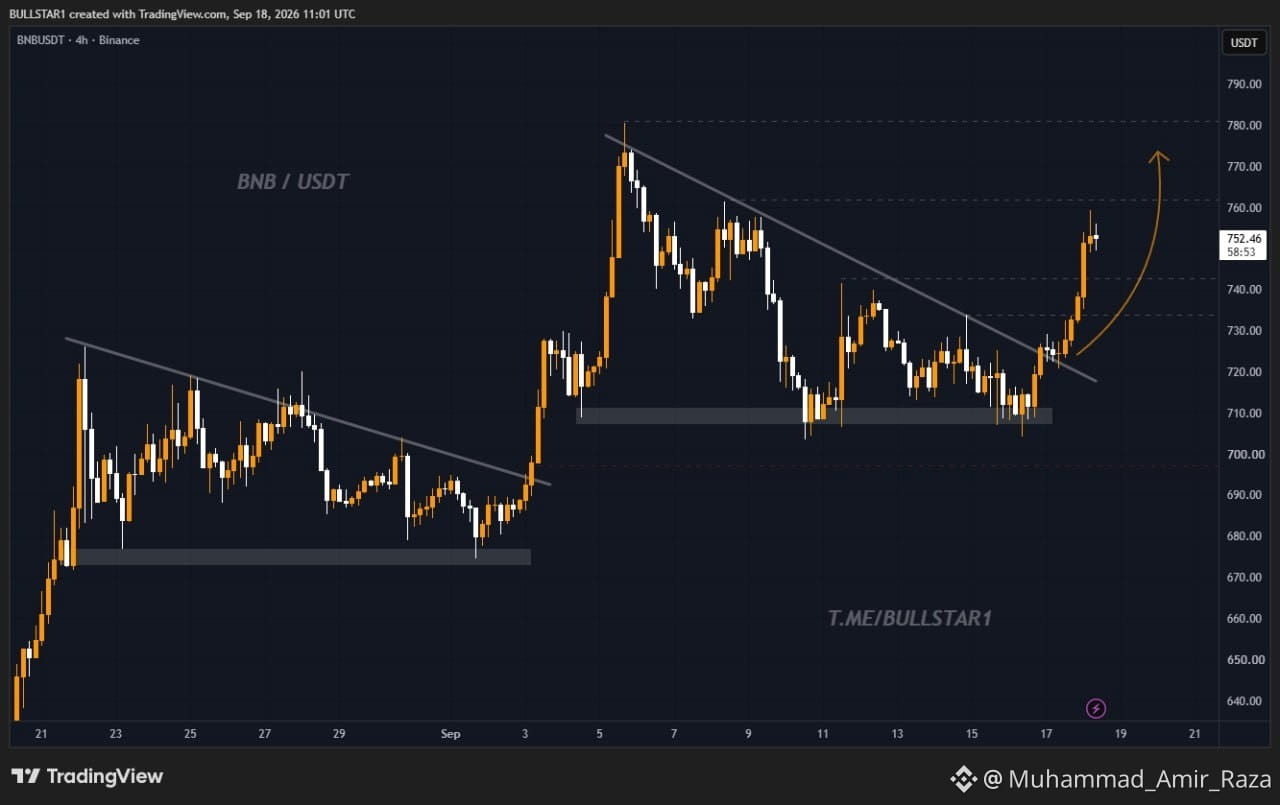
$BNB has now reached the zones we identified in our analysis published several days ago.
The bullish structure played out, with prices moving toward the targets marked on the chart.
Another setup tracked, another analysis played out as expected. 🚀
#bnb #BNB_Market_Update
$BNB has now reached the zones we identified in our analysis published several days ago.
The bullish structure played out, with prices moving toward the targets marked on the chart.
Another setup tracked, another analysis played out as expected. 🚀
#bnb #BNB_Market_Update
The bullish structure played out, with prices moving toward the targets marked on the chart.
Another setup tracked, another analysis played out as expected. 🚀
#bnb #BNB_Market_Update
85
·
--
Bullish
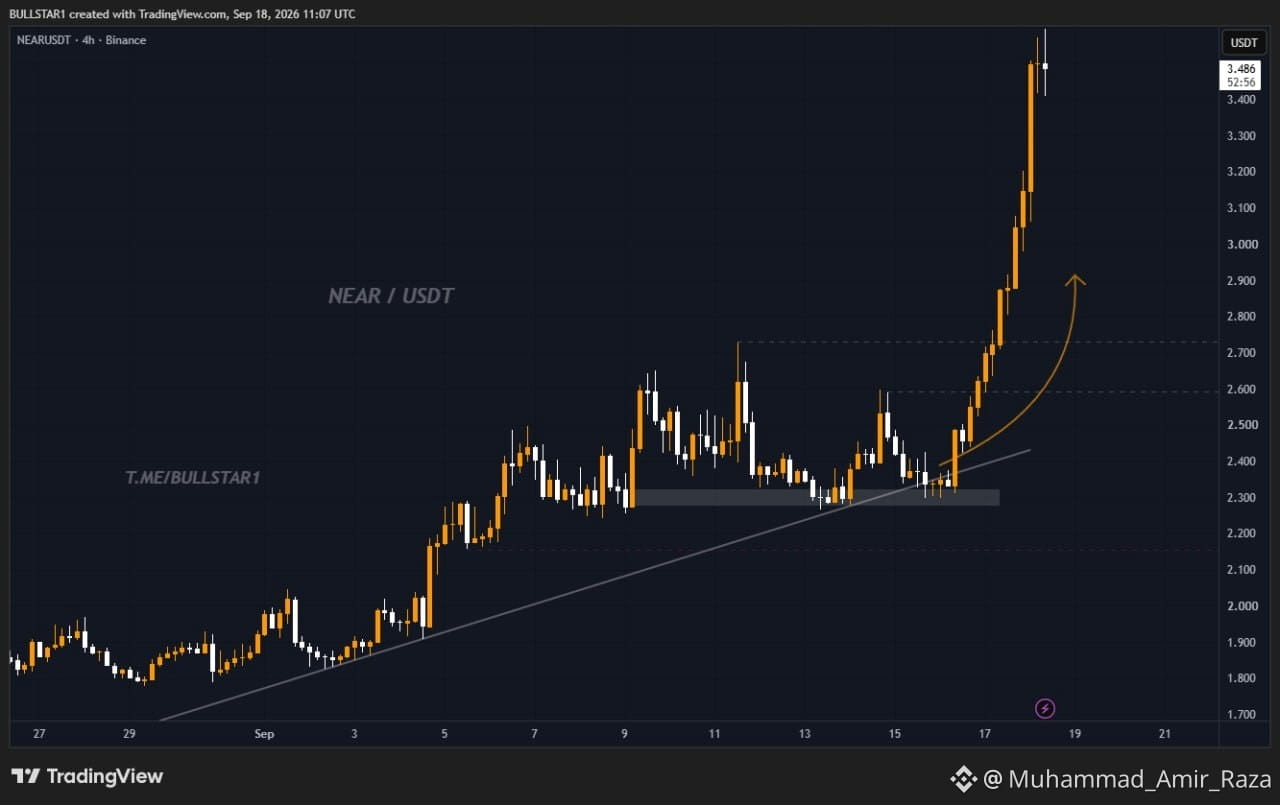
$NEAR didn’t stop at the targets... it pushed far beyond them. 🚀🔥
Our earlier analysis identified the $2.70, $2.80 and $2.90 zones.
Today, NEAR reached $3.48+ and the top is still nowhere in sight. 👀
Another setup that played out in line with our analysis.
#Near
$NEAR didn’t stop at the targets... it pushed far beyond them. 🚀🔥
Our earlier analysis identified the $2.70, $2.80 and $2.90 zones.
Today, NEAR reached $3.48+ and the top is still nowhere in sight. 👀
Another setup that played out in line with our analysis.
#Near
Our earlier analysis identified the $2.70, $2.80 and $2.90 zones.
Today, NEAR reached $3.48+ and the top is still nowhere in sight. 👀
Another setup that played out in line with our analysis.
#Near
1.1k
Log in to explore more content
Join global crypto users on Binance Square
⚡️ Get latest and useful information about crypto.
💬 Trusted by the world’s largest crypto exchange.
👍 Discover real insights from verified creators.
Email / Phone number
Trending Topics
EthereumDropsBelow$2300
1,641 views
74 Discussing
#EthereumDropsBelow$2300 📉 Ethereum Tests Key Support as Price Dips Below $2,300
The second-largest cryptocurrency by market cap has reached a critical technical juncture. Here’s what this recent price movement means for the broader Ethereum ecosystem and digital asset markets.
📰 Core News
Ethereum (ETH) has recently slipped below the $2,300 price level. This movement reflects a combination of broader market volatility, routine profit-taking, and shifting macroeconomic sentiment that continues to influence digital asset valuations.
📊 Market Impact
• Altcoin Sentiment As a primary market leader, ETH’s price action often sets the tone for the broader altcoin market, including Layer 2 scaling solutions and decentralized finance (DeFi) tokens.
•Technical Levels The $2,300 mark serves as a key psychological and historical support zone. Market participants are closely monitoring whether this level holds or if further consolidation occurs in the near term.
• Network Fundamentals Despite short-term price fluctuations, Ethereum’s underlying on-chain metrics, such as staking participation, validator growth, and ongoing network development, continue to progress independently of daily market charts.
💬 Join the Discussion
How do you view this current price level for Ethereum? Do you see it as a critical support zone to watch, or are you expecting further market consolidation? Share your analytical thoughts below! 👇
#Ethereum #ETH #CryptoMarket #DeFi #Web3
This is for educational purposes only. Not Financial Advice (NFA). Always Do Your Own Research (DYOR).
$HUMA $BANK $ETH
User-4d6a0d2
·0 Likes
·98 views
BitcoinSlipsBelow$80KAgain
3,623 views
44 Discussing
ThailandLaunchesWORPTStablecoinToQRPaymentApp
6,020 views
152 Discussing