

ScalpingX
14.5k Posts

ScalpingX
Report
Block User
A short-term trader who embraces high-risk, high-reward strategies with an unconventional mindset.
44 Following
1.7K+ Followers
10.3K+ Liked
Posts
All
Quotes
·
--
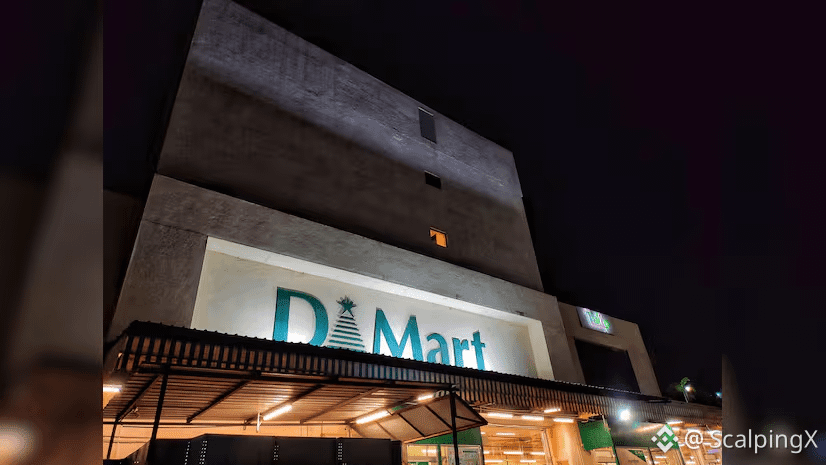
📊 D-Mart reported Q2 FY27 standalone revenue of ₹19,206 crore, up 18.4% year-on-year and 4.7% from the previous quarter. Growth also accelerated from 15.1% in Q1.
📉 Despite this, the stock fell nearly 6% in the first trading session after the update. Revenue growth was only about 1% above expectations, while the market remains cautious about the quality of growth as higher inflation and consumer-goods pricing may have supported the headline figure.
🏬 D-Mart added 15 stores during the quarter, taking its network to 518. However, the current update does not yet include profit, margins or same-store sales data.
🔎 Attention now shifts to the full results on October 10. If margins and transaction growth improve, the current selloff may appear relatively sharp compared with the underlying business performance.
#IndiaStocks $DMART
📊 D-Mart reported Q2 FY27 standalone revenue of ₹19,206 crore, up 18.4% year-on-year and 4.7% from the previous quarter. Growth also accelerated from 15.1% in Q1.
📉 Despite this, the stock fell nearly 6% in the first trading session after the update. Revenue growth was only about 1% above expectations, while the market remains cautious about the quality of growth as higher inflation and consumer-goods pricing may have supported the headline figure.
🏬 D-Mart added 15 stores during the quarter, taking its network to 518. However, the current update does not yet include profit, margins or same-store sales data.
🔎 Attention now shifts to the full results on October 10. If margins and transaction growth improve, the current selloff may appear relatively sharp compared with the underlying business performance.
#IndiaStocks $DMART
📉 Despite this, the stock fell nearly 6% in the first trading session after the update. Revenue growth was only about 1% above expectations, while the market remains cautious about the quality of growth as higher inflation and consumer-goods pricing may have supported the headline figure.
🏬 D-Mart added 15 stores during the quarter, taking its network to 518. However, the current update does not yet include profit, margins or same-store sales data.
🔎 Attention now shifts to the full results on October 10. If margins and transaction growth improve, the current selloff may appear relatively sharp compared with the underlying business performance.
#IndiaStocks $DMART
19
·
--
Bullish
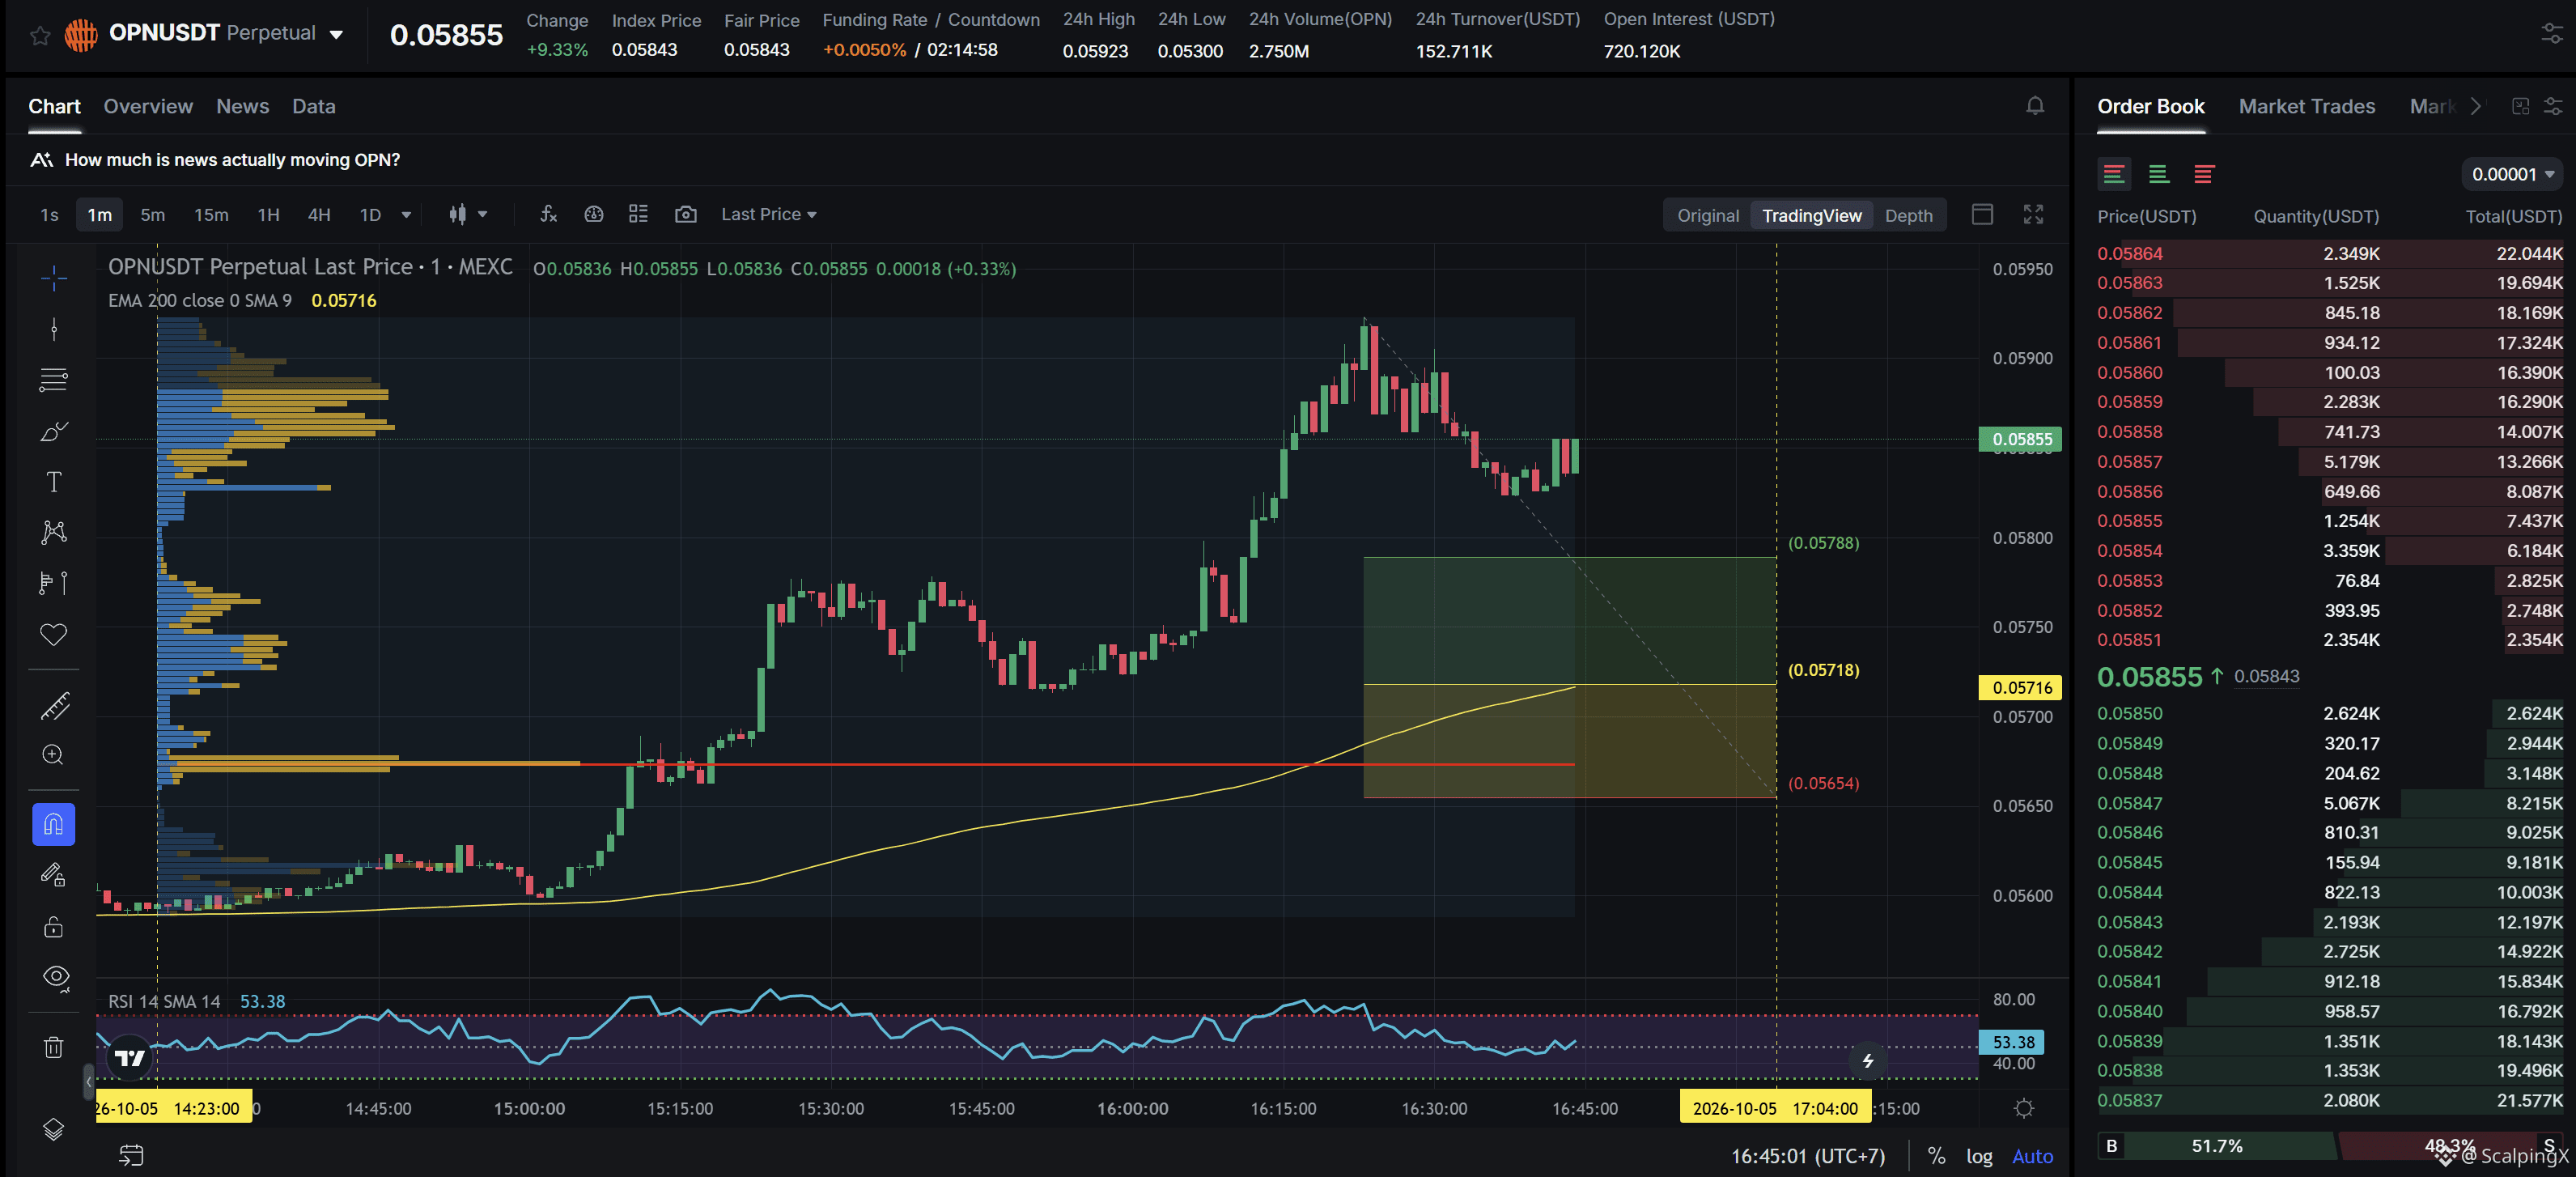
$OPN - Mcap 10.64M$ - 24h Sentiment Neutral
SC02 M1 - pending Long order. Entry contains POC + not affected by any weak zone, the current support zone is approximately 1.11% wide. The uptrend has lasted 2 hours 23 minutes, with a maximum recorded price increase of 5.97%. If price loses this support zone, the trend is highly likely to reverse downward.
$OPN - Mcap 10.64M$ - 24h Sentiment Neutral
SC02 M1 - pending Long order. Entry contains POC + not affected by any weak zone, the current support zone is approximately 1.11% wide. The uptrend has lasted 2 hours 23 minutes, with a maximum recorded price increase of 5.97%. If price loses this support zone, the trend is highly likely to reverse downward.
SC02 M1 - pending Long order. Entry contains POC + not affected by any weak zone, the current support zone is approximately 1.11% wide. The uptrend has lasted 2 hours 23 minutes, with a maximum recorded price increase of 5.97%. If price loses this support zone, the trend is highly likely to reverse downward.
11
·
--
Hang Seng Flat but Sector Divergence Deepens Ahead of Stock Connect Reopening
📉 The Hang Seng was nearly flat around 23,950 points in midday trade, but the underlying market showed clear divergence. Property stocks fell about 0.9% and financials lost 0.7%, while the Hang Seng Tech Index gained 0.3%.
💻 Technology and semiconductor names continued to outperform, with Hua Hong up around 4% and Kingboard Laminates rising 9%. Capital remained concentrated in stocks linked to the AI and chip theme.
🌏 Liquidity was thinner than usual as mainland Chinese markets remained closed for Golden Week and Stock Connect was suspended. As a result, the small move in the Hang Seng may not fully reflect underlying supply and demand.
📅 October 8 will be the key date as mainland markets and Stock Connect reopen. The return of mainland flows should provide a clearer signal on whether the recent weakness was mainly liquidity-driven or reflected broader selling pressure.
#HongKongStocks $CXMT
Hang Seng Flat but Sector Divergence Deepens Ahead of Stock Connect Reopening
📉 The Hang Seng was nearly flat around 23,950 points in midday trade, but the underlying market showed clear divergence. Property stocks fell about 0.9% and financials lost 0.7%, while the Hang Seng Tech Index gained 0.3%.
💻 Technology and semiconductor names continued to outperform, with Hua Hong up around 4% and Kingboard Laminates rising 9%. Capital remained concentrated in stocks linked to the AI and chip theme.
🌏 Liquidity was thinner than usual as mainland Chinese markets remained closed for Golden Week and Stock Connect was suspended. As a result, the small move in the Hang Seng may not fully reflect underlying supply and demand.
📅 October 8 will be the key date as mainland markets and Stock Connect reopen. The return of mainland flows should provide a clearer signal on whether the recent weakness was mainly liquidity-driven or reflected broader selling pressure.
#HongKongStocks $CXMT
📉 The Hang Seng was nearly flat around 23,950 points in midday trade, but the underlying market showed clear divergence. Property stocks fell about 0.9% and financials lost 0.7%, while the Hang Seng Tech Index gained 0.3%.
💻 Technology and semiconductor names continued to outperform, with Hua Hong up around 4% and Kingboard Laminates rising 9%. Capital remained concentrated in stocks linked to the AI and chip theme.
🌏 Liquidity was thinner than usual as mainland Chinese markets remained closed for Golden Week and Stock Connect was suspended. As a result, the small move in the Hang Seng may not fully reflect underlying supply and demand.
📅 October 8 will be the key date as mainland markets and Stock Connect reopen. The return of mainland flows should provide a clearer signal on whether the recent weakness was mainly liquidity-driven or reflected broader selling pressure.
#HongKongStocks $CXMT
94
·
--
Bullish
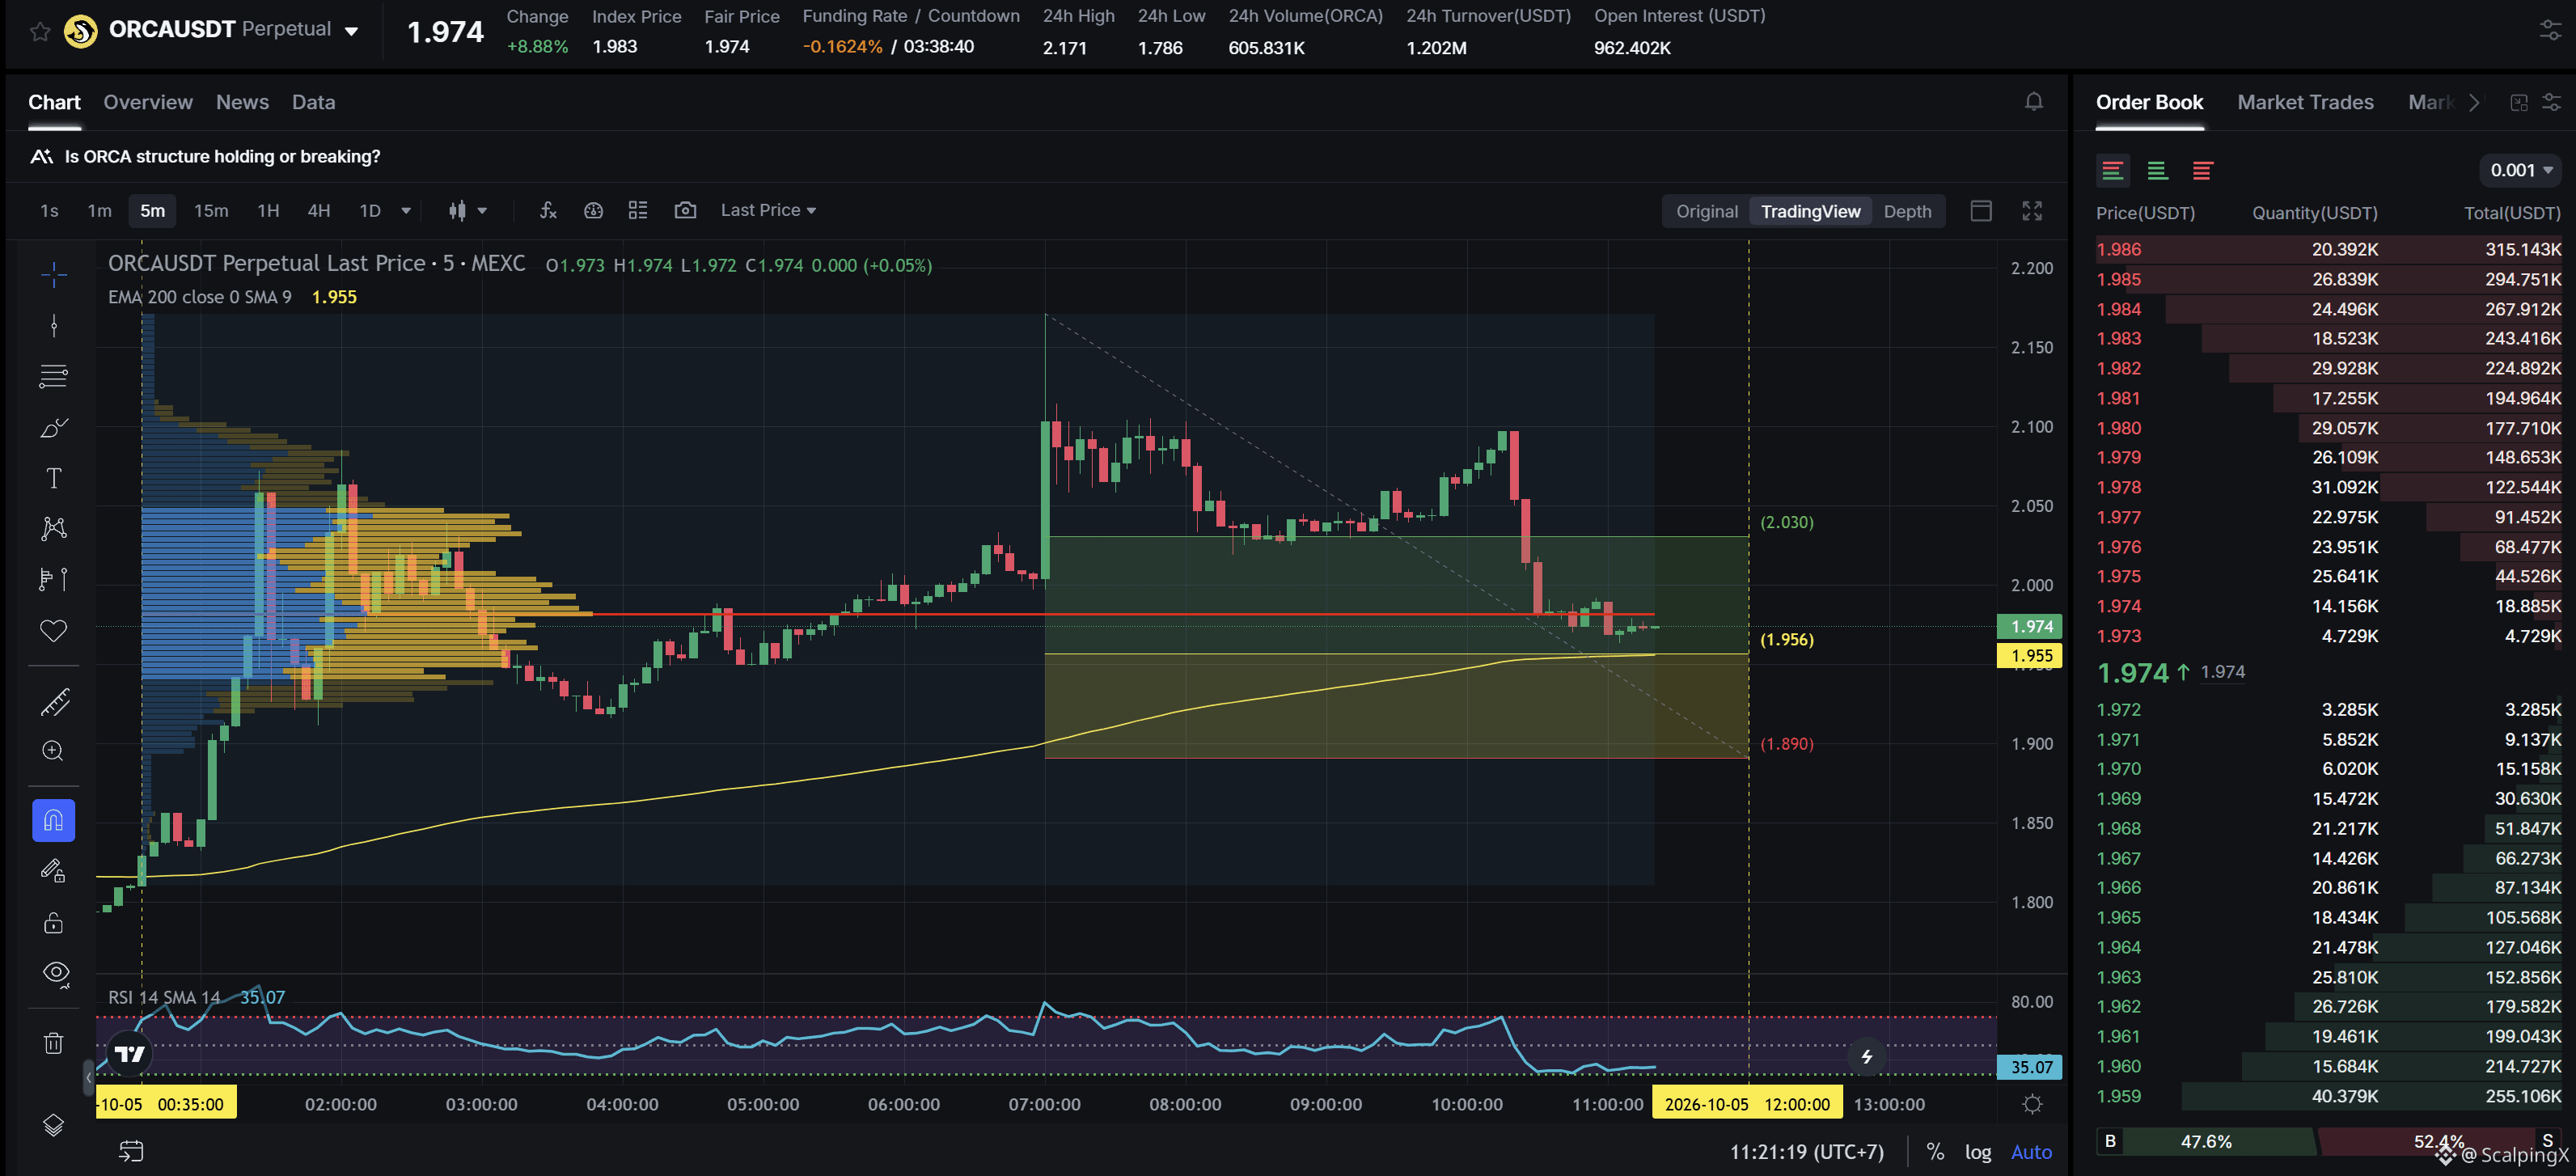
$ORCA - Mcap 120.5M$ - 24h Sentiment +5.12 Bullish
SC02 M5 - pending Long order. Entry lies within LVN + not affected by any weak zone, the current support zone is approximately 3.37% wide. The uptrend has lasted 10 hours 45 minutes, with a maximum recorded price increase of 19.56%. If price loses this support zone, the trend is highly likely to reverse downward.
$ORCA - Mcap 120.5M$ - 24h Sentiment +5.12 Bullish
SC02 M5 - pending Long order. Entry lies within LVN + not affected by any weak zone, the current support zone is approximately 3.37% wide. The uptrend has lasted 10 hours 45 minutes, with a maximum recorded price increase of 19.56%. If price loses this support zone, the trend is highly likely to reverse downward.
SC02 M5 - pending Long order. Entry lies within LVN + not affected by any weak zone, the current support zone is approximately 3.37% wide. The uptrend has lasted 10 hours 45 minutes, with a maximum recorded price increase of 19.56%. If price loses this support zone, the trend is highly likely to reverse downward.
138
·
--
Bullish
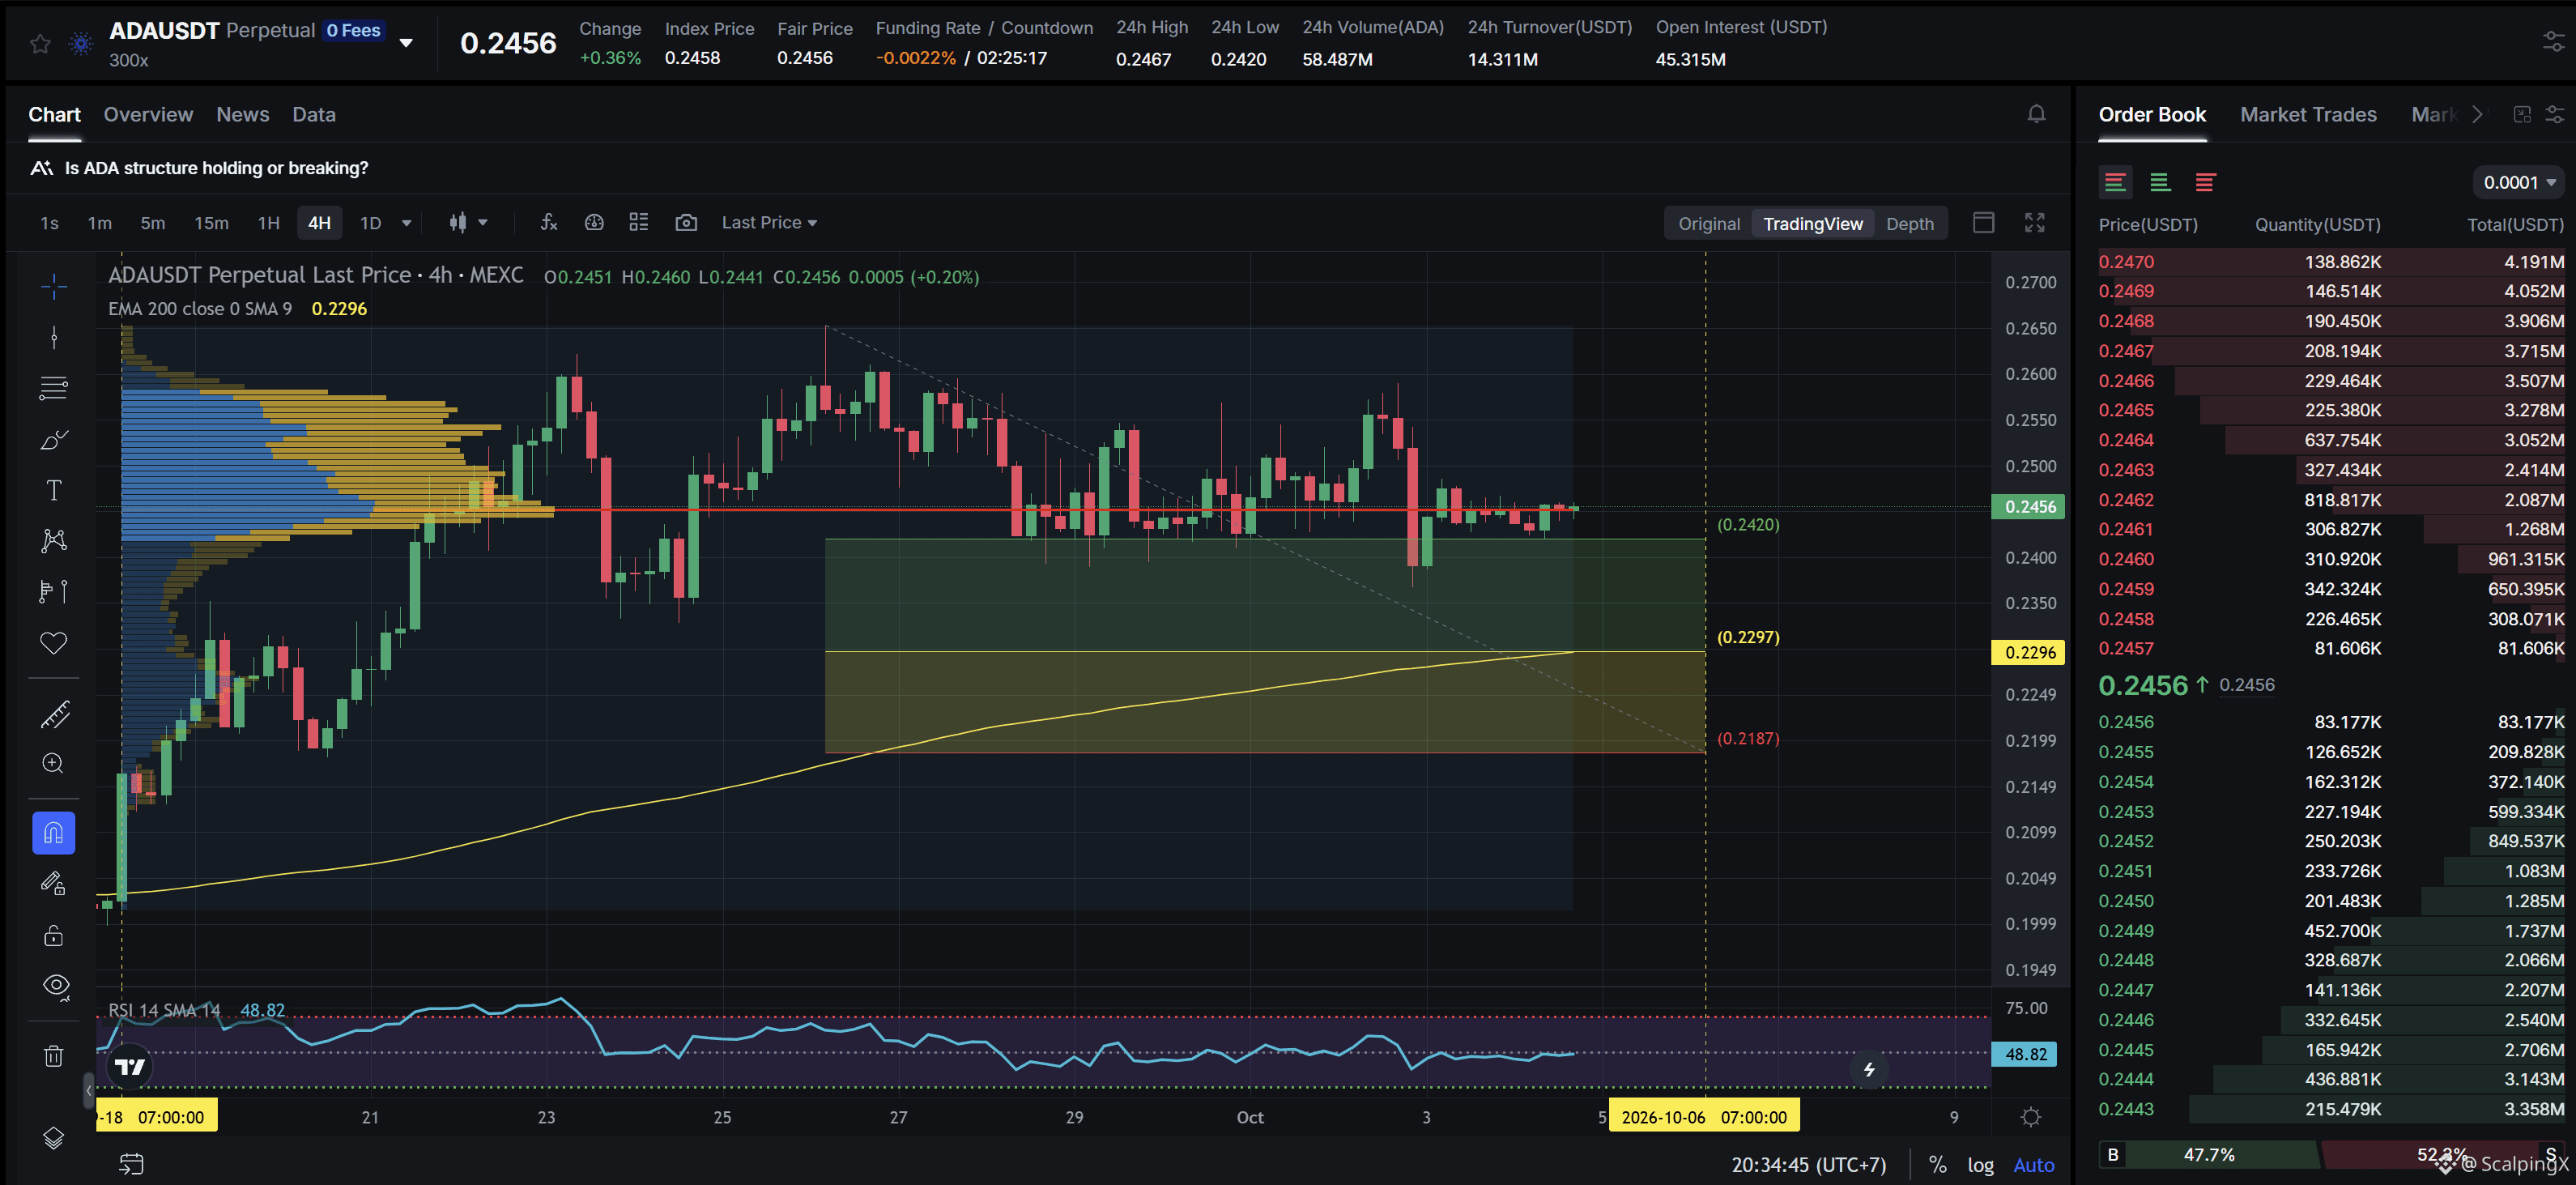
$ADA - Mcap 9.03B$ - 24h Sentiment +2.04 Bullish
SC02 H4 - pending Long order. Entry lies within LVN + not affected by any weak zone, the current support zone is approximately 4.84% wide. The uptrend has lasted 16 days 12 hours, with a maximum recorded price increase of 30.84%. If price loses this support zone, the trend is highly likely to reverse downward.
$ADA - Mcap 9.03B$ - 24h Sentiment +2.04 Bullish
SC02 H4 - pending Long order. Entry lies within LVN + not affected by any weak zone, the current support zone is approximately 4.84% wide. The uptrend has lasted 16 days 12 hours, with a maximum recorded price increase of 30.84%. If price loses this support zone, the trend is highly likely to reverse downward.
SC02 H4 - pending Long order. Entry lies within LVN + not affected by any weak zone, the current support zone is approximately 4.84% wide. The uptrend has lasted 16 days 12 hours, with a maximum recorded price increase of 30.84%. If price loses this support zone, the trend is highly likely to reverse downward.
30
·
--
Bullish
📊 TRADING PERFORMANCE & MARKET SENTIMENT (FGI) REPORT – UPDATED 03/10/2026
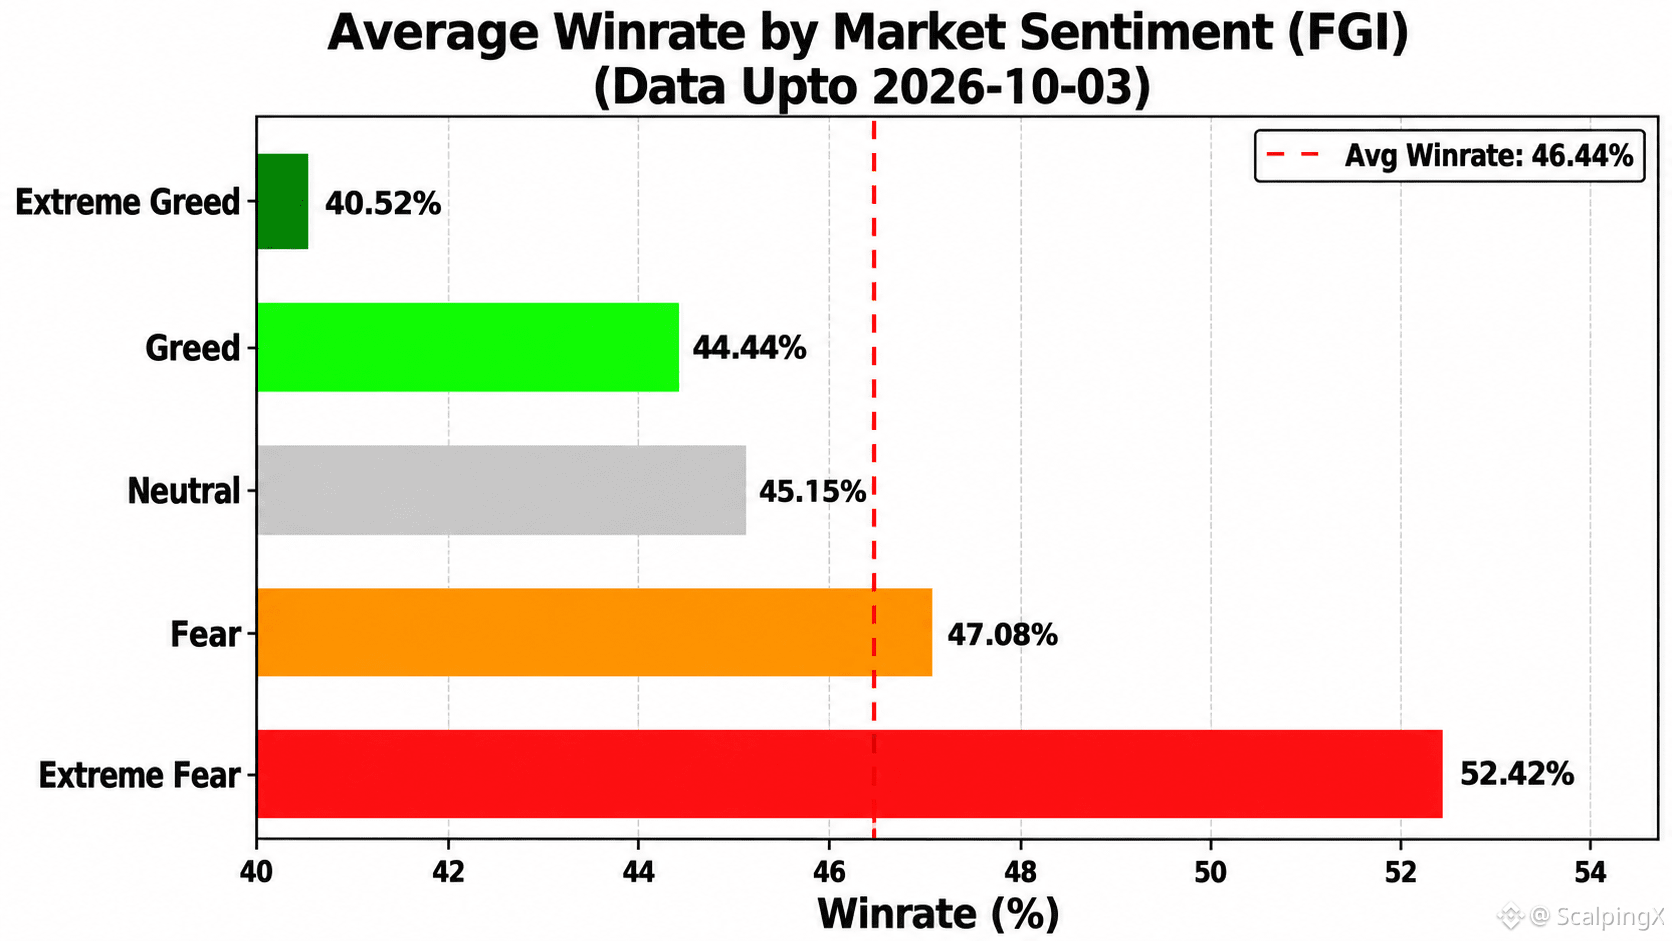
The latest data shows that the correlation between the Fear & Greed Index (FGI) and Win Rate remains low and continues to lean negative, at r ≈ -0.305. This suggests that FGI is not suitable as a standalone tool for determining trade entries, but it still has value for risk assessment. Trading performance generally tends to weaken as market sentiment moves into extreme euphoria, making FGI more useful as an early risk-warning signal than as a signal for expanding profit targets.
Below is a summary of Win Rate (WR), minimum breakeven R:R, and the number of recorded days (n) across each sentiment zone:
🤑 Extreme Greed (≥80): WR 40.5% • R:R=1:1.47 • n=25
😌 Greed (60–80): WR 44.4% • R:R=1:1.25 • n=255
😐 Neutral (40–60): WR 45.2% • R:R=1:1.21 • n=157
😰 Fear (20–40): WR 47.1% • R:R=1:1.12 • n=271
😱 Extreme Fear (<20): WR 52.4% • R:R=1:0.91 • n=115
The share of days with performance above the overall average of 46.44% by sentiment zone:
🤑 Extreme Greed: 8.0%
😌 Greed: 34.1%
😐 Neutral: 38.2%
😰 Fear: 55.7%
😱 Extreme Fear: 67.8%
➤ Short-term traders can use FGI as a reference for adjusting expected profit targets when entering trades:
📈 When FGI is high, a higher expected profit target may be needed to maintain a sufficiently favorable R:R ratio and compensate for the lower win rate.
📉 When FGI is low, expected profit targets can be reduced to support faster capital turnover and make profit realization easier.
#TradingInsights $BTC $ETH $SOL
📊 TRADING PERFORMANCE & MARKET SENTIMENT (FGI) REPORT – UPDATED 03/10/2026
The latest data shows that the correlation between the Fear & Greed Index (FGI) and Win Rate remains low and continues to lean negative, at r ≈ -0.305. This suggests that FGI is not suitable as a standalone tool for determining trade entries, but it still has value for risk assessment. Trading performance generally tends to weaken as market sentiment moves into extreme euphoria, making FGI more useful as an early risk-warning signal than as a signal for expanding profit targets.
Below is a summary of Win Rate (WR), minimum breakeven R:R, and the number of recorded days (n) across each sentiment zone:
🤑 Extreme Greed (≥80): WR 40.5% • R:R=1:1.47 • n=25
😌 Greed (60–80): WR 44.4% • R:R=1:1.25 • n=255
😐 Neutral (40–60): WR 45.2% • R:R=1:1.21 • n=157
😰 Fear (20–40): WR 47.1% • R:R=1:1.12 • n=271
😱 Extreme Fear (<20): WR 52.4% • R:R=1:0.91 • n=115
The share of days with performance above the overall average of 46.44% by sentiment zone:
🤑 Extreme Greed: 8.0%
😌 Greed: 34.1%
😐 Neutral: 38.2%
😰 Fear: 55.7%
😱 Extreme Fear: 67.8%
➤ Short-term traders can use FGI as a reference for adjusting expected profit targets when entering trades:
📈 When FGI is high, a higher expected profit target may be needed to maintain a sufficiently favorable R:R ratio and compensate for the lower win rate.
📉 When FGI is low, expected profit targets can be reduced to support faster capital turnover and make profit realization easier.
#TradingInsights $BTC $ETH $SOL
The latest data shows that the correlation between the Fear & Greed Index (FGI) and Win Rate remains low and continues to lean negative, at r ≈ -0.305. This suggests that FGI is not suitable as a standalone tool for determining trade entries, but it still has value for risk assessment. Trading performance generally tends to weaken as market sentiment moves into extreme euphoria, making FGI more useful as an early risk-warning signal than as a signal for expanding profit targets.
Below is a summary of Win Rate (WR), minimum breakeven R:R, and the number of recorded days (n) across each sentiment zone:
🤑 Extreme Greed (≥80): WR 40.5% • R:R=1:1.47 • n=25
😌 Greed (60–80): WR 44.4% • R:R=1:1.25 • n=255
😐 Neutral (40–60): WR 45.2% • R:R=1:1.21 • n=157
😰 Fear (20–40): WR 47.1% • R:R=1:1.12 • n=271
😱 Extreme Fear (<20): WR 52.4% • R:R=1:0.91 • n=115
The share of days with performance above the overall average of 46.44% by sentiment zone:
🤑 Extreme Greed: 8.0%
😌 Greed: 34.1%
😐 Neutral: 38.2%
😰 Fear: 55.7%
😱 Extreme Fear: 67.8%
➤ Short-term traders can use FGI as a reference for adjusting expected profit targets when entering trades:
📈 When FGI is high, a higher expected profit target may be needed to maintain a sufficiently favorable R:R ratio and compensate for the lower win rate.
📉 When FGI is low, expected profit targets can be reduced to support faster capital turnover and make profit realization easier.
#TradingInsights $BTC $ETH $SOL
164
·
--
Bullish
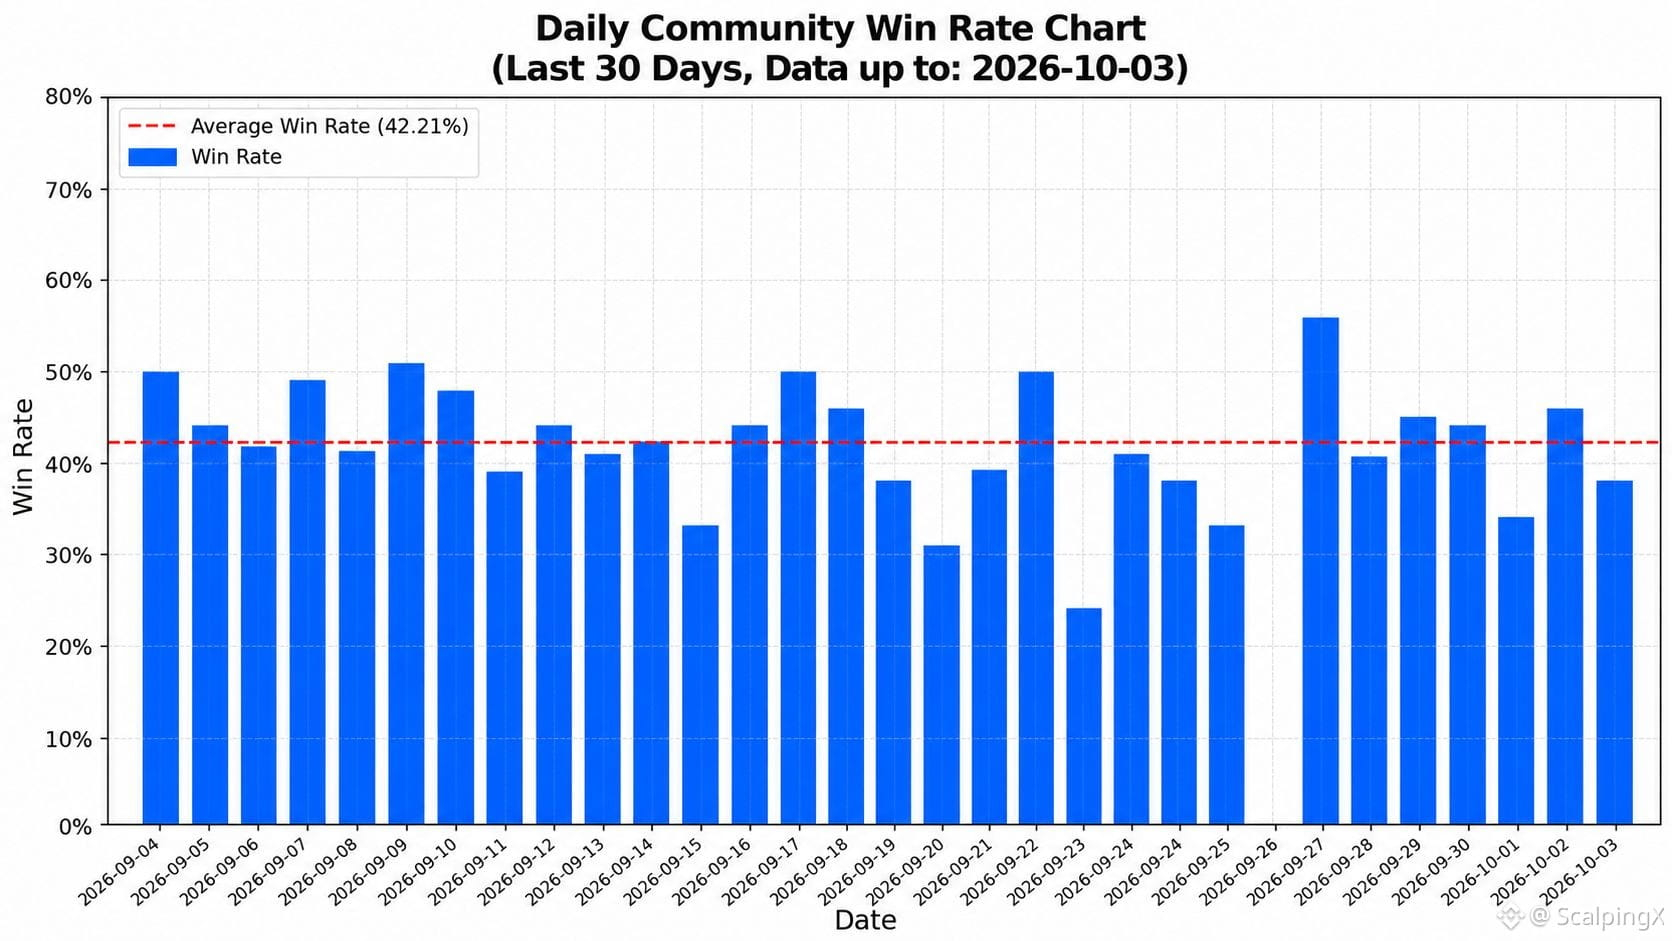
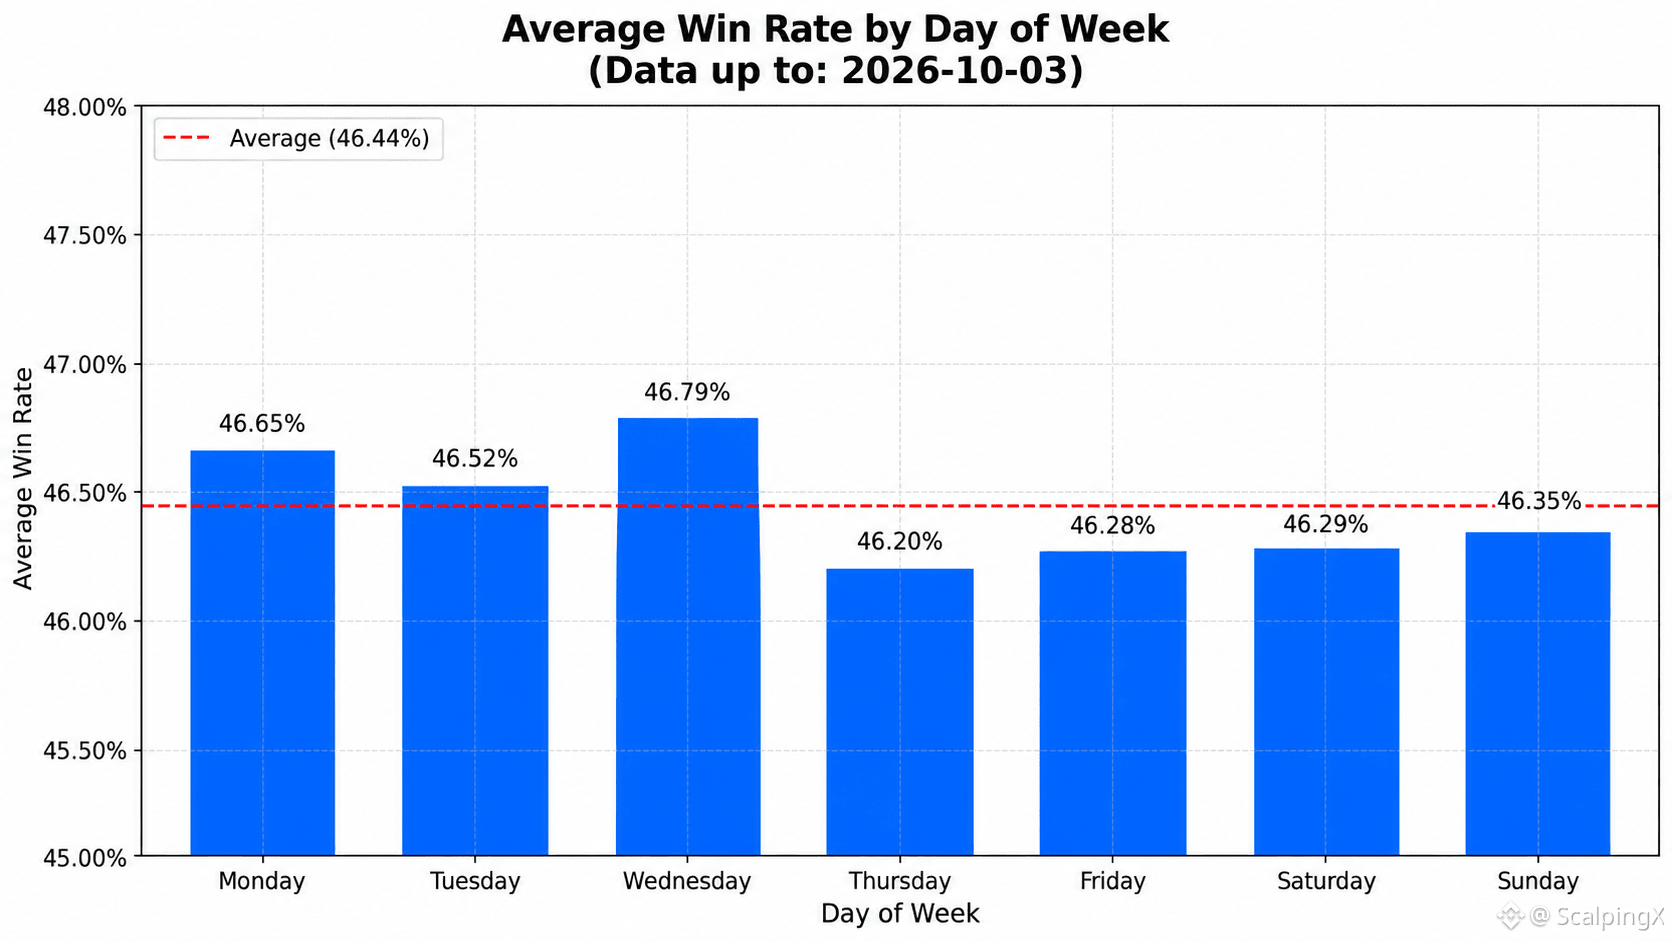
Update 2026-10-03, community-wide trading
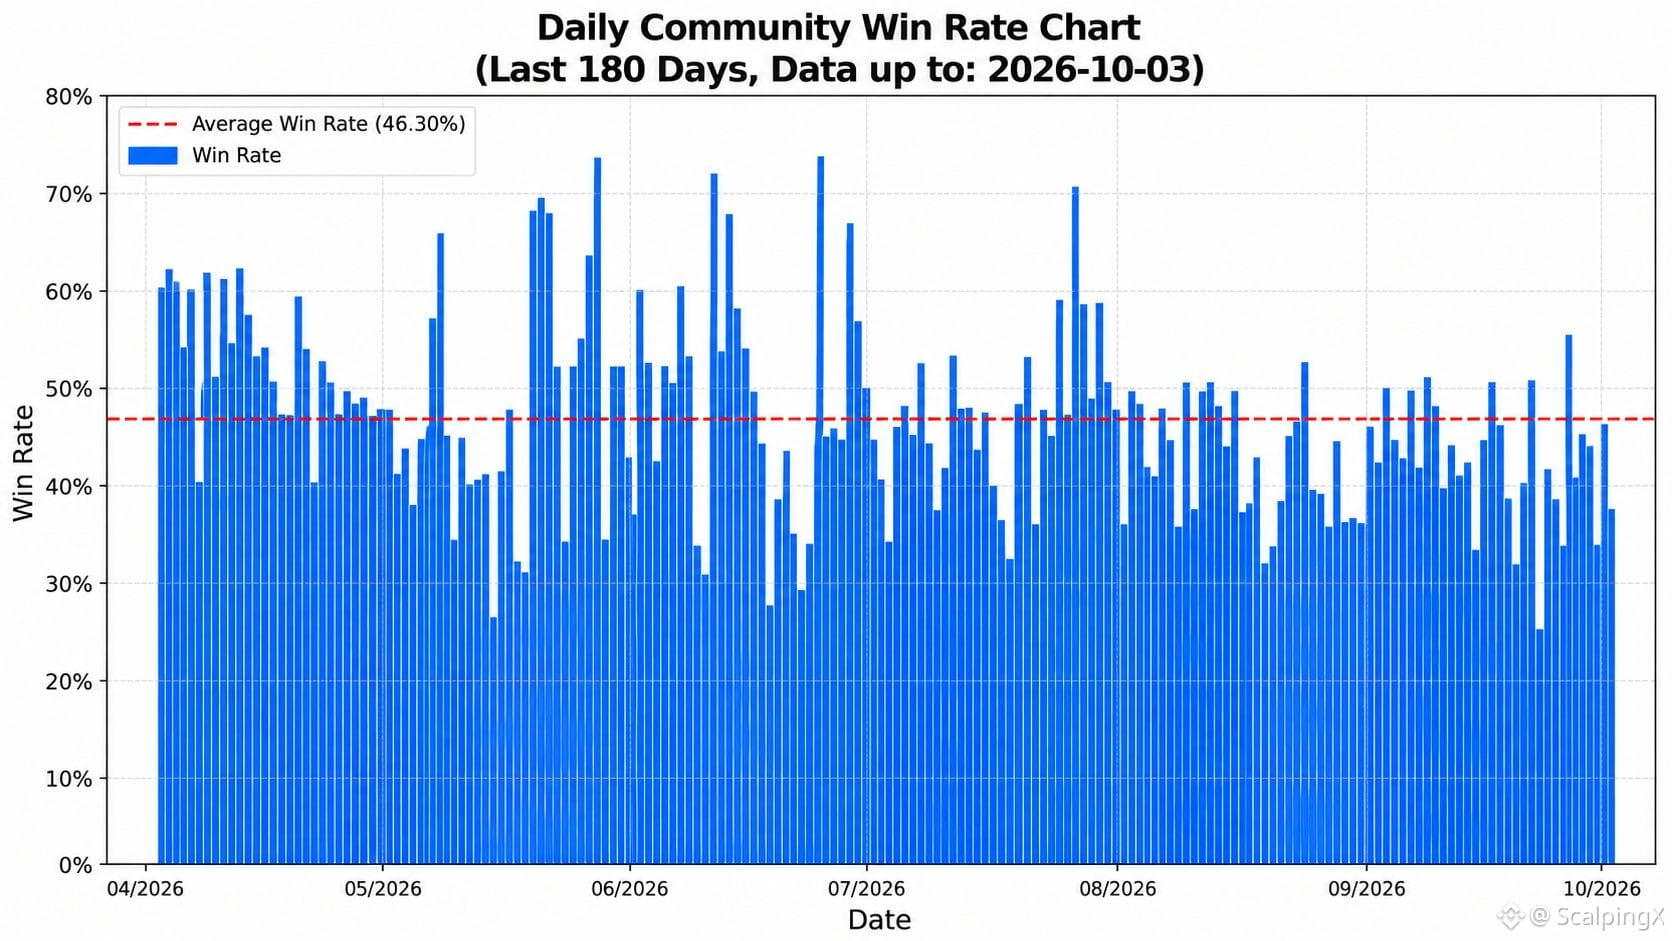
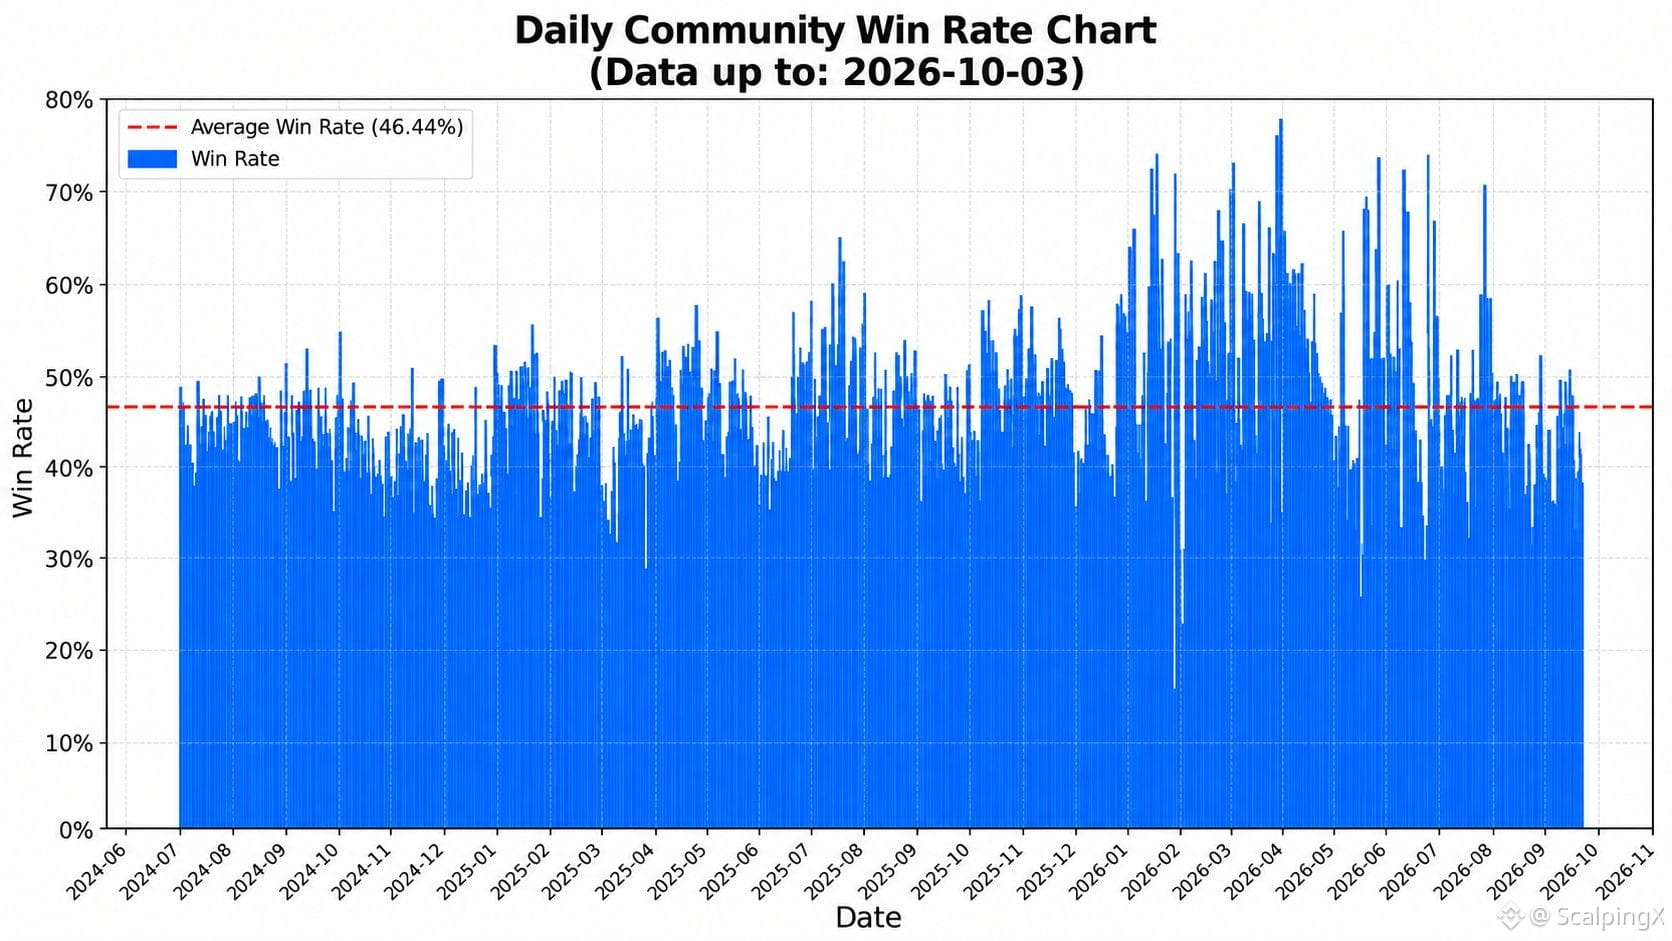
📊 The average win rate is 46.44%
🏆 The highest daily win rate was recorded on 2026-04-01 at 78.08%. The lowest was recorded on 2026-01-25 at 15.69%
📅 Wednesday has the highest average win rate at 46.79%, while Thursday has the lowest at 46.20%
⏱️ The strongest 7-day period ended on 2026-04-05 with an average win rate of 63.27%. The weakest period ended on 2026-06-24 at 35.60%
⚖️ The number of days with a win rate above the overall average is 378, while 445 days were at or below the average
📈 There were 225 days with a win rate above 50%, 440 days between 40%–50%, and 158 days below 40%
#TradingInsights $BTC $SOL $TRX
Update 2026-10-03, community-wide trading
📊 The average win rate is 46.44%
🏆 The highest daily win rate was recorded on 2026-04-01 at 78.08%. The lowest was recorded on 2026-01-25 at 15.69%
📅 Wednesday has the highest average win rate at 46.79%, while Thursday has the lowest at 46.20%
⏱️ The strongest 7-day period ended on 2026-04-05 with an average win rate of 63.27%. The weakest period ended on 2026-06-24 at 35.60%
⚖️ The number of days with a win rate above the overall average is 378, while 445 days were at or below the average
📈 There were 225 days with a win rate above 50%, 440 days between 40%–50%, and 158 days below 40%
#TradingInsights $BTC $SOL $TRX
📊 The average win rate is 46.44%
🏆 The highest daily win rate was recorded on 2026-04-01 at 78.08%. The lowest was recorded on 2026-01-25 at 15.69%
📅 Wednesday has the highest average win rate at 46.79%, while Thursday has the lowest at 46.20%
⏱️ The strongest 7-day period ended on 2026-04-05 with an average win rate of 63.27%. The weakest period ended on 2026-06-24 at 35.60%
⚖️ The number of days with a win rate above the overall average is 378, while 445 days were at or below the average
📈 There were 225 days with a win rate above 50%, 440 days between 40%–50%, and 158 days below 40%
#TradingInsights $BTC $SOL $TRX
98
Log in to explore more content
Join global crypto users on Binance Square
⚡️ Get latest and useful information about crypto.
💬 Trusted by the world’s largest crypto exchange.
👍 Discover real insights from verified creators.
Email / Phone number
Trending Topics
ADAGains10%Above$0.27
899 views
47 Discussing
$ADA breaks through resistance and consolidates above $0.274! Technical analysis of perpetual futures
The ADA/USDT perpetual futures pair is up more than 12% in 24 hours, reaching an intraday high of $0.2768 on trading volume of over 485 million USDT (1.84 billion ADA).
Key levels and indicators on the chart:
The 4-hour candle confirmed a clean breakout above the previous consolidation range ($0.232–$0.251) and moved away from the MA(99) at $0.246. However, the RSI(6) at 89.69 and the StochRSI at 99.26 warn that the move is entering deeply overbought territory, where profit-taking or sideways pauses often occur.
On shorter timeframes, the price is consolidating around the MA(7) at $0.2744, with the MA(25) at $0.2728 acting as the first dynamic support.
As long as this base holds, the immediate bullish structure remains intact. Open interest remains firm at 484 million. This tells us there is enough backing and confidence at these higher levels, preventing the price from suddenly falling like a domino due to a lack of buyers.
To maintain its upward momentum toward the $0.29–$0.30 range, the asset needs to hold $0.270–$0.272 as new support. If the daily indicator's exhaustion forces a cooldown, a healthy pullback could reach the 4-hour MA(25), near $0.251.
Share your entry in the comments!
#ADAGains10%Above$0.27
ALØNDRACRYPTØ1
·3 Likes
·1.4k views
ETHUp70%InQ3ButLiquidityFalls
13,805 views
246 Discussing
EthStakingExitQueueHits2026High
5,157 views
265 Discussing