

roschamomile
27 Posts

roschamomile
Report
Block User
insta / tiktok / twitter @roschamomile
14 Following
1.3K+ Followers
495 Liked
Posts
All
Quotes
Videos
·
--
Article
Bundled token aren’t always badIf you’ve been around memes, you’ll probably see bundled tokens pretty often.
And for me, the fact that something is bundled isn’t enough to tell me whether it’s good or bad. There can be legitimate reasons for supply to be concentrated or coordinated early on.
What I actually want to know is
How much is bundled?
Who might be behind it?
And what happened to that supply after launch?
A token can look well distributed because no single wallet holds a huge amount. But if several of those wallets bought together at launch or are connected onchain, I’d want to understand whether that supply is actually as distributed as it looks.
This is where the new @Bubblemaps.io revamp gets interesting for me.
The whole flow is basically find → vet → buy, without having to jump between different platforms.
1. Find
There’s a Trending + Fresh feed across chains, with Arc supported from day one.
The feed also filters out extremely high-risk tokens and bundles before they surface, which I think is useful when you’re digging through fresh memes.
And I can filter by chain, launchpad, price, volume, liquidity and more.
2. Check the supply
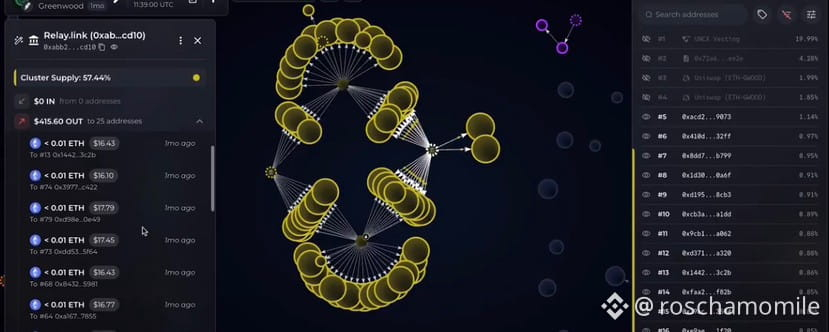
Hover over a token and its bubble map shows up instantly.
My simple way of reading it
1 bubble = 1 holder address.
Bigger bubble = bigger holding.
Connected bubbles = there’s an onchain relationship worth looking into.
So instead of only reading a top-holder list, I can see whether some of those holders are connected.
Connected doesn’t automatically mean insider though.
It could be an LP, exchange, treasury or another entity. That’s where wallet labels, reviewed by professional onchain sleuths, give me more context.
3. Check the bundle
Bundles and clusters tell me slightly different things.
A bundle is more about what happened around launch multiple wallets buying within the same block or a very short time window.
A cluster is more about wallets having onchain connections.
For early memes, I care about both.
Not because bundled = bad.
I just want to understand how much supply was accumulated early, who might be behind those wallets, and how significant that position is relative to the liquidity.
There’s also a Bubblemaps Score that flags insider clusters and bundled wallets, which gives me another place to start digging
4. Go back in time
This is probably the part I find most useful.
With Historical Holder Distribution, I can click a candle and see what the holder distribution looked like at that exact moment.
At launch → who had the supply?
First pump → how did the distribution change?
Now → where did that supply end up?
Because today’s holder list only gives me today’s picture.
For an early meme, I’m much more curious about What happened before I got here?
Project socials are also reviewed, and if I eventually decide to trade, there’s a built-in swap with a 0.5% fee. There’s even in-app token boosting.
So the interesting part of this revamp for me isn’t one individual feature.
It’s having the whole flow in one place !
Find → check the holders → investigate the bundle → look back in time → decide → trade.
We’re not fortune tellers. We don’t know what’s going to pump next.
But we can know a little more about what we’re getting into before we ape.
Who got in before me?
How concentrated was the supply?
What happened to it after launch?
The chart tells what the price is doing.
The bubbles give me more context on what’s happening behind the supply.
#$BMT #Bubblemaps
Bundled token aren’t always bad
If you’ve been around memes, you’ll probably see bundled tokens pretty often.
And for me, the fact that something is bundled isn’t enough to tell me whether it’s good or bad. There can be legitimate reasons for supply to be concentrated or coordinated early on.
What I actually want to know is
How much is bundled?
Who might be behind it?
And what happened to that supply after launch?
A token can look well distributed because no single wallet holds a huge amount. But if several of those wallets bought together at launch or are connected onchain, I’d want to understand whether that supply is actually as distributed as it looks.
This is where the new @Bubblemaps.io revamp gets interesting for me.
The whole flow is basically find → vet → buy, without having to jump between different platforms.
1. Find
There’s a Trending + Fresh feed across chains, with Arc supported from day one.
The feed also filters out extremely high-risk tokens and bundles before they surface, which I think is useful when you’re digging through fresh memes.
And I can filter by chain, launchpad, price, volume, liquidity and more.
2. Check the supply
Hover over a token and its bubble map shows up instantly.
My simple way of reading it
1 bubble = 1 holder address.
Bigger bubble = bigger holding.
Connected bubbles = there’s an onchain relationship worth looking into.
So instead of only reading a top-holder list, I can see whether some of those holders are connected.
Connected doesn’t automatically mean insider though.
It could be an LP, exchange, treasury or another entity. That’s where wallet labels, reviewed by professional onchain sleuths, give me more context.
3. Check the bundle
Bundles and clusters tell me slightly different things.
A bundle is more about what happened around launch multiple wallets buying within the same block or a very short time window.
A cluster is more about wallets having onchain connections.
For early memes, I care about both.
Not because bundled = bad.
I just want to understand how much supply was accumulated early, who might be behind those wallets, and how significant that position is relative to the liquidity.
There’s also a Bubblemaps Score that flags insider clusters and bundled wallets, which gives me another place to start digging
4. Go back in time
This is probably the part I find most useful.
With Historical Holder Distribution, I can click a candle and see what the holder distribution looked like at that exact moment.
At launch → who had the supply?
First pump → how did the distribution change?
Now → where did that supply end up?
Because today’s holder list only gives me today’s picture.
For an early meme, I’m much more curious about What happened before I got here?
Project socials are also reviewed, and if I eventually decide to trade, there’s a built-in swap with a 0.5% fee. There’s even in-app token boosting.
So the interesting part of this revamp for me isn’t one individual feature.
It’s having the whole flow in one place !
Find → check the holders → investigate the bundle → look back in time → decide → trade.
We’re not fortune tellers. We don’t know what’s going to pump next.
But we can know a little more about what we’re getting into before we ape.
Who got in before me?
How concentrated was the supply?
What happened to it after launch?
The chart tells what the price is doing.
The bubbles give me more context on what’s happening behind the supply.
#$BMT #Bubblemaps
And for me, the fact that something is bundled isn’t enough to tell me whether it’s good or bad. There can be legitimate reasons for supply to be concentrated or coordinated early on.
What I actually want to know is
How much is bundled?
Who might be behind it?
And what happened to that supply after launch?
A token can look well distributed because no single wallet holds a huge amount. But if several of those wallets bought together at launch or are connected onchain, I’d want to understand whether that supply is actually as distributed as it looks.
This is where the new @Bubblemaps.io revamp gets interesting for me.
The whole flow is basically find → vet → buy, without having to jump between different platforms.
1. Find
There’s a Trending + Fresh feed across chains, with Arc supported from day one.
The feed also filters out extremely high-risk tokens and bundles before they surface, which I think is useful when you’re digging through fresh memes.
And I can filter by chain, launchpad, price, volume, liquidity and more.
2. Check the supply
Hover over a token and its bubble map shows up instantly.
My simple way of reading it
1 bubble = 1 holder address.
Bigger bubble = bigger holding.
Connected bubbles = there’s an onchain relationship worth looking into.
So instead of only reading a top-holder list, I can see whether some of those holders are connected.
Connected doesn’t automatically mean insider though.
It could be an LP, exchange, treasury or another entity. That’s where wallet labels, reviewed by professional onchain sleuths, give me more context.
3. Check the bundle
Bundles and clusters tell me slightly different things.
A bundle is more about what happened around launch multiple wallets buying within the same block or a very short time window.
A cluster is more about wallets having onchain connections.
For early memes, I care about both.
Not because bundled = bad.
I just want to understand how much supply was accumulated early, who might be behind those wallets, and how significant that position is relative to the liquidity.
There’s also a Bubblemaps Score that flags insider clusters and bundled wallets, which gives me another place to start digging
4. Go back in time
This is probably the part I find most useful.
With Historical Holder Distribution, I can click a candle and see what the holder distribution looked like at that exact moment.
At launch → who had the supply?
First pump → how did the distribution change?
Now → where did that supply end up?
Because today’s holder list only gives me today’s picture.
For an early meme, I’m much more curious about What happened before I got here?
Project socials are also reviewed, and if I eventually decide to trade, there’s a built-in swap with a 0.5% fee. There’s even in-app token boosting.
So the interesting part of this revamp for me isn’t one individual feature.
It’s having the whole flow in one place !
Find → check the holders → investigate the bundle → look back in time → decide → trade.
We’re not fortune tellers. We don’t know what’s going to pump next.
But we can know a little more about what we’re getting into before we ape.
Who got in before me?
How concentrated was the supply?
What happened to it after launch?
The chart tells what the price is doing.
The bubbles give me more context on what’s happening behind the supply.
#$BMT #Bubblemaps
4
10
20.7k
·
--
Good entries mean nothing if your risk control sucks.
Surviving the market > one lucky trade.
Anyway my first futures trade was on binance 🥹🍕
Good entries mean nothing if your risk control sucks.
Surviving the market > one lucky trade.
Anyway my first futures trade was on binance 🥹🍕
Surviving the market > one lucky trade.
Anyway my first futures trade was on binance 🥹🍕
2
419
·
--
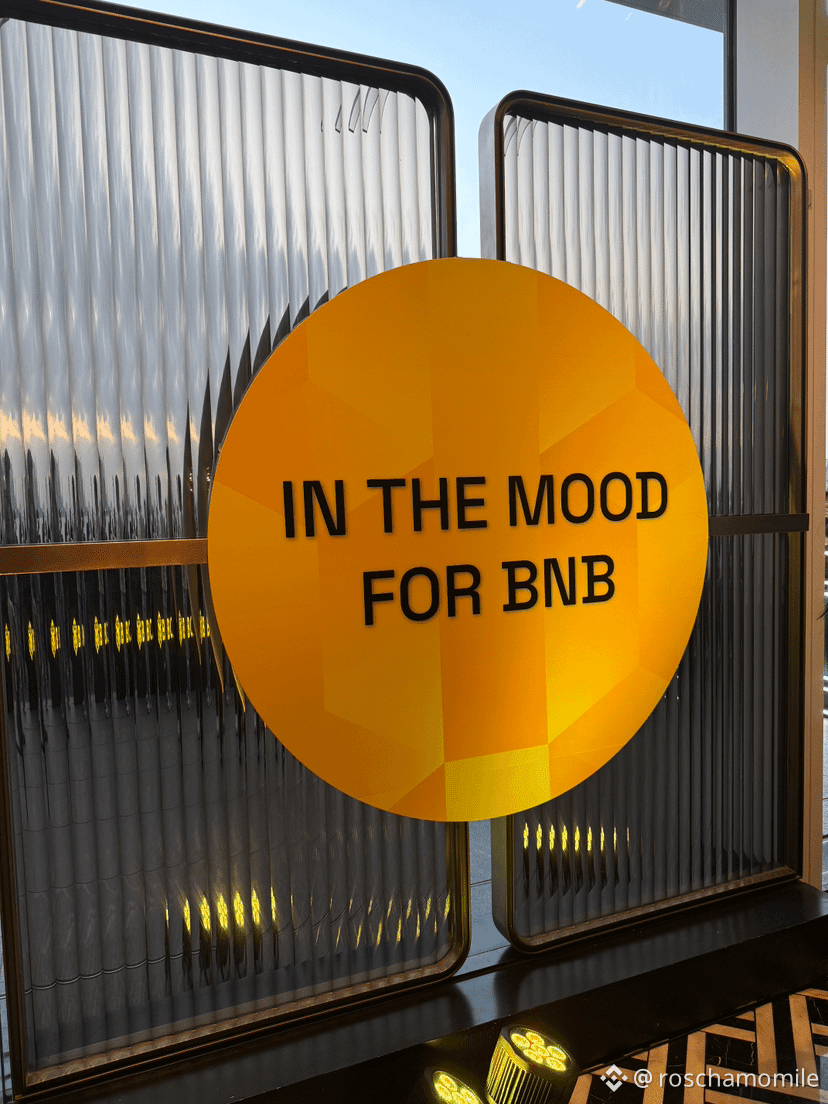
Enjoying moment with bnb chain @ hongkong, alpha soon? 👀
Enjoying moment with bnb chain @ hongkong, alpha soon? 👀


2
203
·
--
Metal trading used to live in Web2.
For crypto traders, that meant switching apps all the time. Onchain metals just simplify things.
Everything stays in one ecosystem.
Metal trading used to live in Web2.
For crypto traders, that meant switching apps all the time. Onchain metals just simplify things.
Everything stays in one ecosystem.
For crypto traders, that meant switching apps all the time. Onchain metals just simplify things.
Everything stays in one ecosystem.
3
5
40
55.7k
·
--
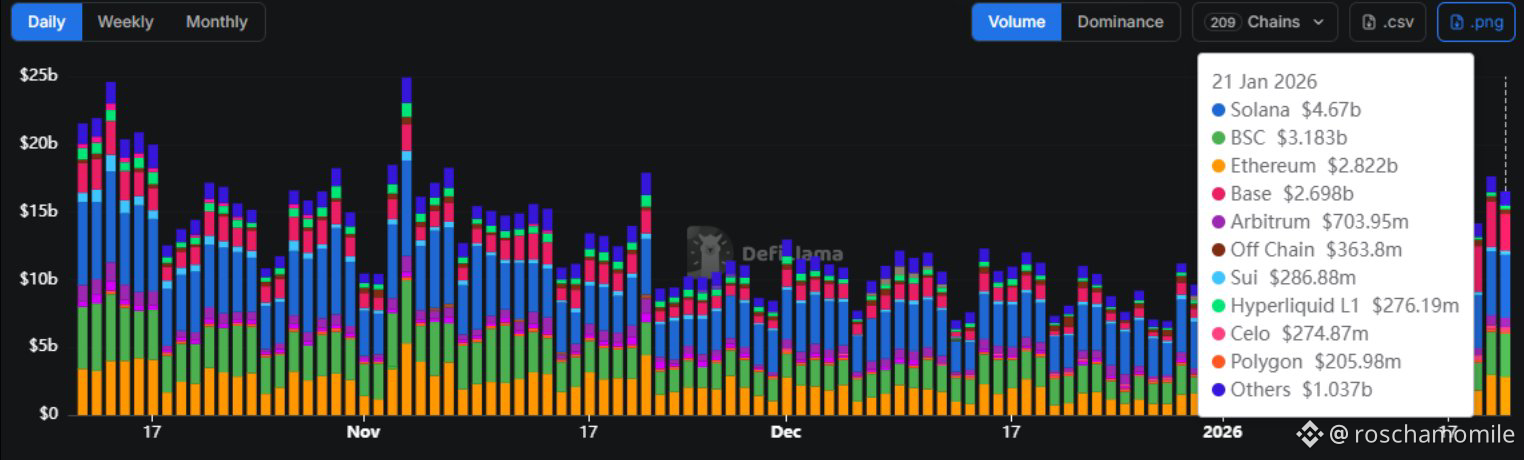
Hype can bring attention, but liquidity is what keeps an ecosystem alive. Without liquidity, users can’t trade efficiently, builders can’t sustain activity, and capital can’t move. Prices become fragile, slippage increases, and trust slowly fades.
Liquidity is the real signal of adoption. It means people are actually using the chain trading, deploying capital, building, and staying. When liquidity flows in, volume follows. When volume stays, ecosystems grow.
Hype can bring attention, but liquidity is what keeps an ecosystem alive. Without liquidity, users can’t trade efficiently, builders can’t sustain activity, and capital can’t move. Prices become fragile, slippage increases, and trust slowly fades.
Liquidity is the real signal of adoption. It means people are actually using the chain trading, deploying capital, building, and staying. When liquidity flows in, volume follows. When volume stays, ecosystems grow.
Liquidity is the real signal of adoption. It means people are actually using the chain trading, deploying capital, building, and staying. When liquidity flows in, volume follows. When volume stays, ecosystems grow.
2
2
16
27.2k
·
--
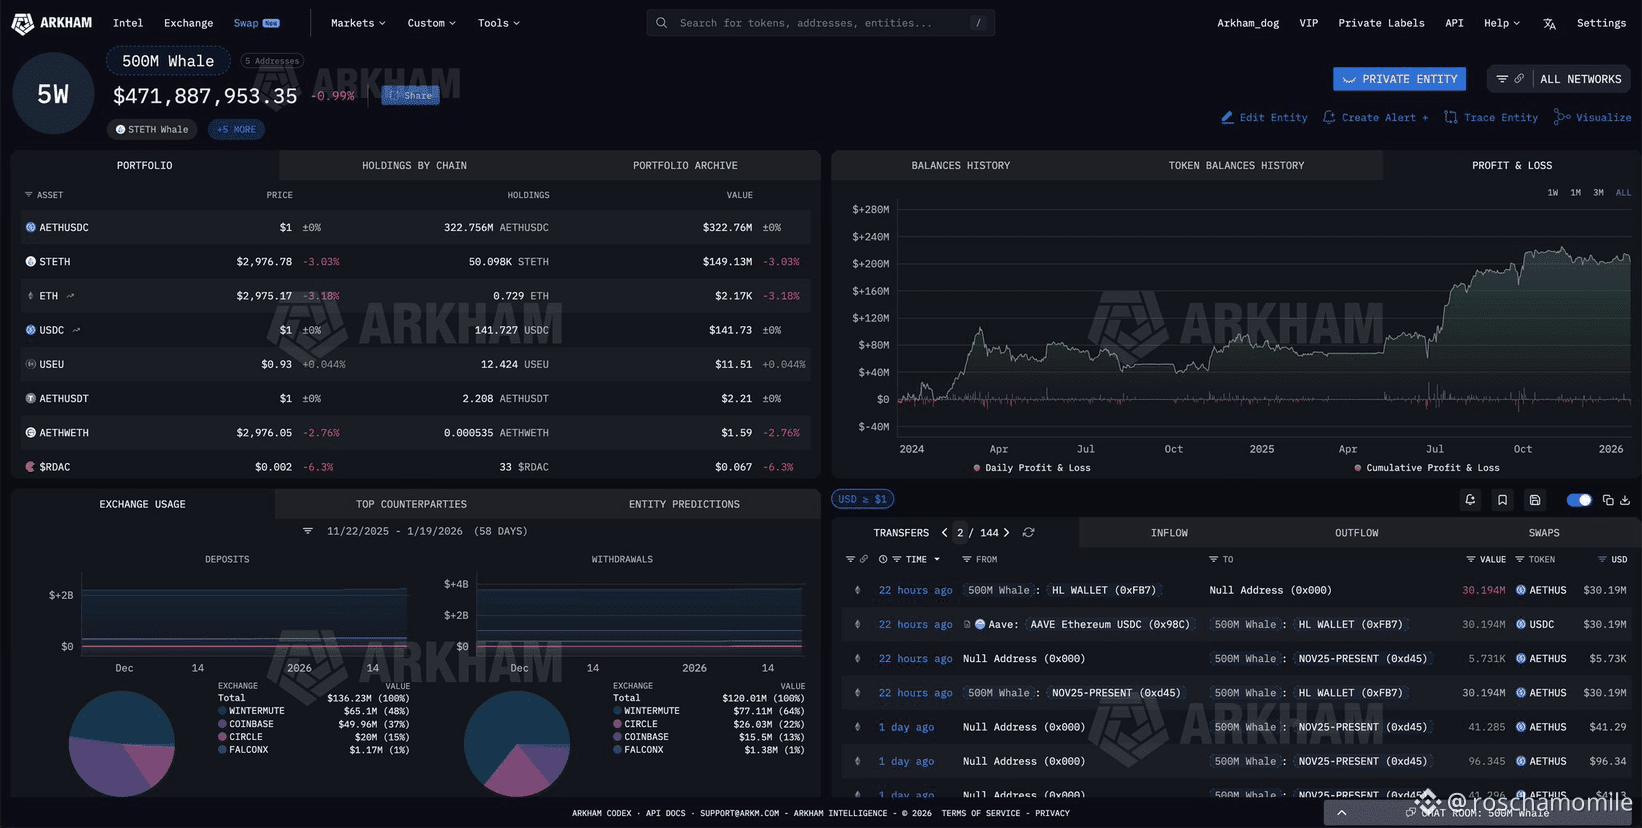
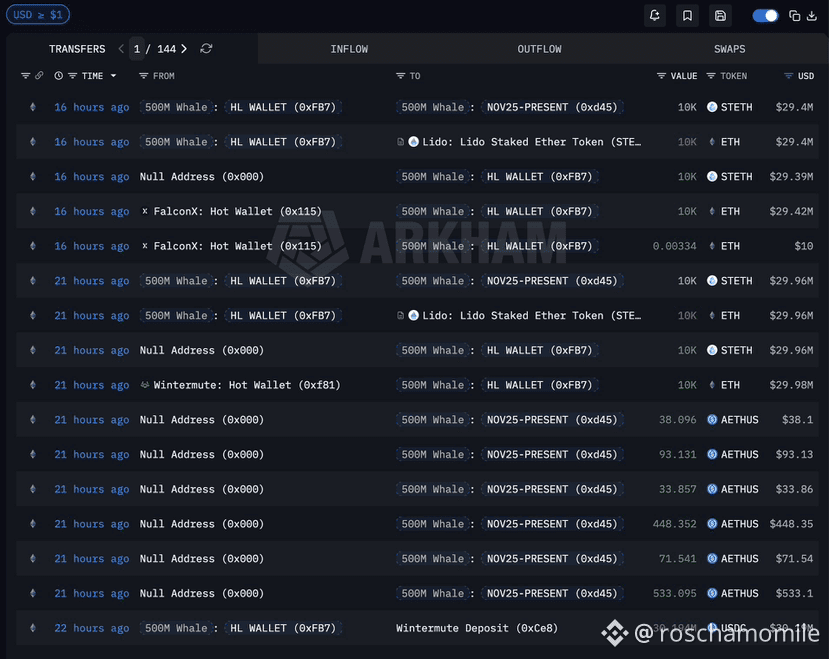
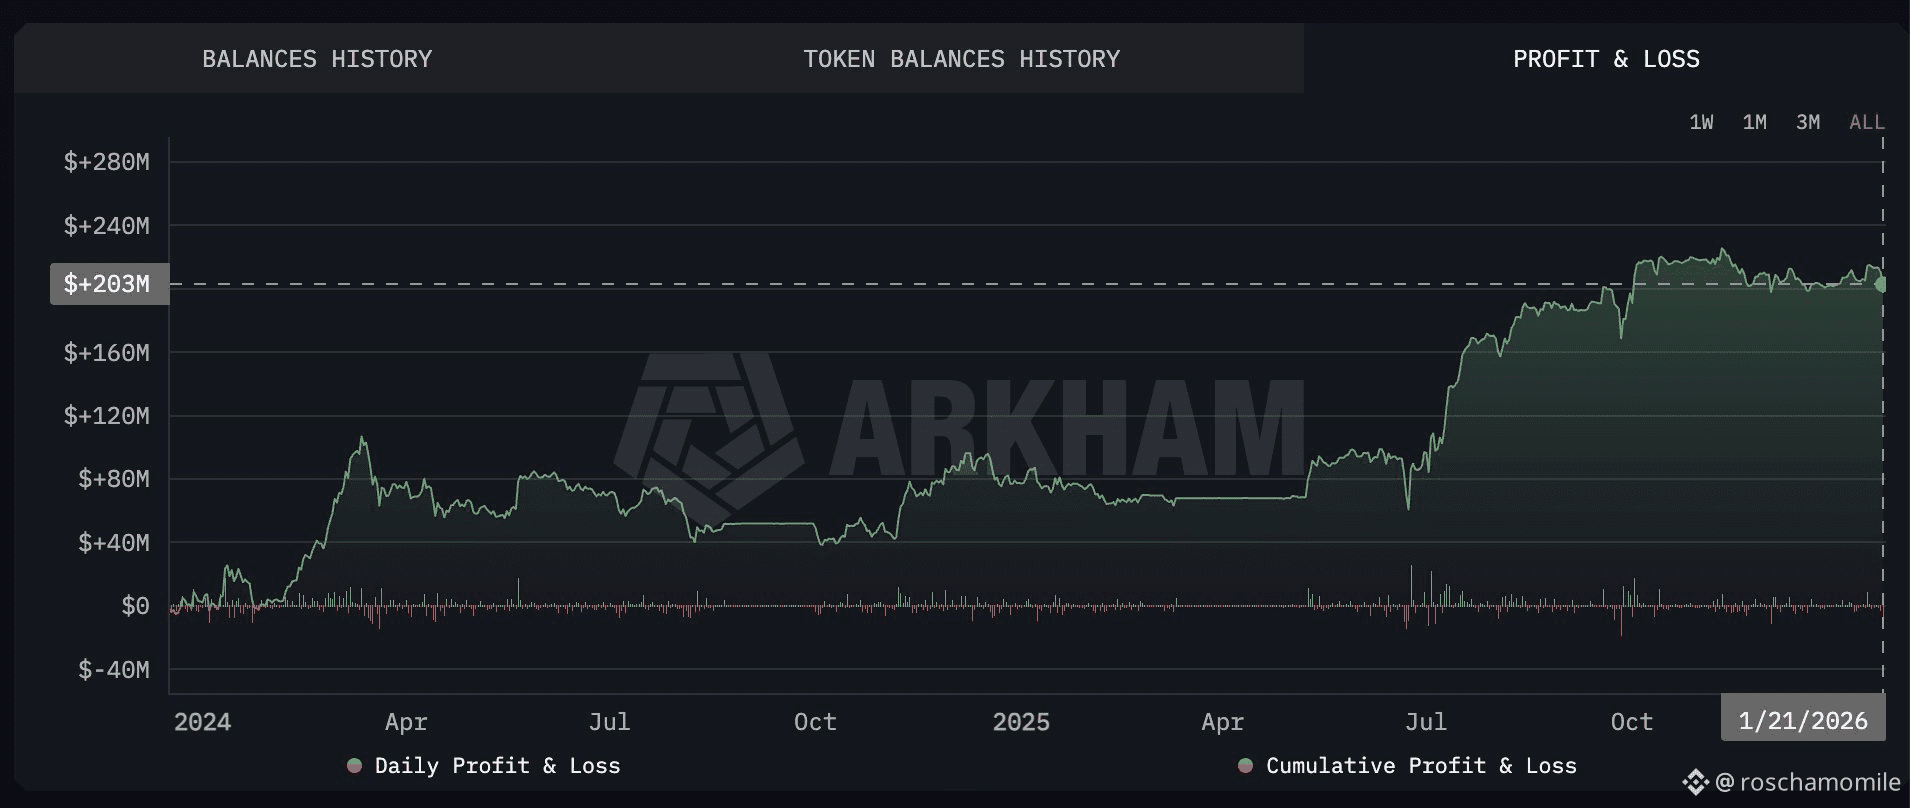
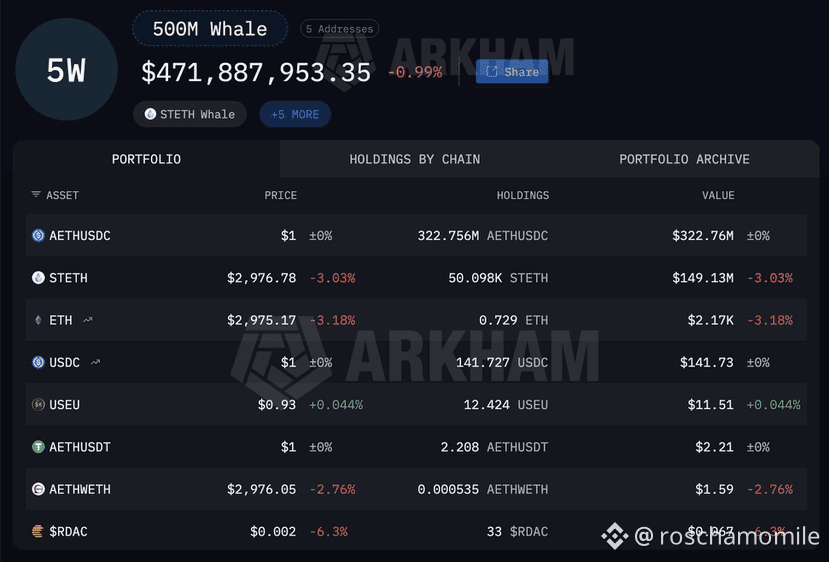
This guy is up $200M+ in total PnL and he’s still buying ETH.
Trader 0xFB7 has made over $200M across multiple wallets, and for the past 2 years, he’s traded ETH only. No distractions.
And right now
He’s quietly accumulating $59.4M worth of ETH via FalconX and Wintermute OTC.
Sometimes it’s not about chasing every coin, it’s about knowing one asset really well.
This guy is up $200M+ in total PnL and he’s still buying ETH.
Trader 0xFB7 has made over $200M across multiple wallets, and for the past 2 years, he’s traded ETH only. No distractions.
And right now
He’s quietly accumulating $59.4M worth of ETH via FalconX and Wintermute OTC.
Sometimes it’s not about chasing every coin, it’s about knowing one asset really well.
Trader 0xFB7 has made over $200M across multiple wallets, and for the past 2 years, he’s traded ETH only. No distractions.
And right now
He’s quietly accumulating $59.4M worth of ETH via FalconX and Wintermute OTC.
Sometimes it’s not about chasing every coin, it’s about knowing one asset really well.
1
1
16
22.4k
·
--
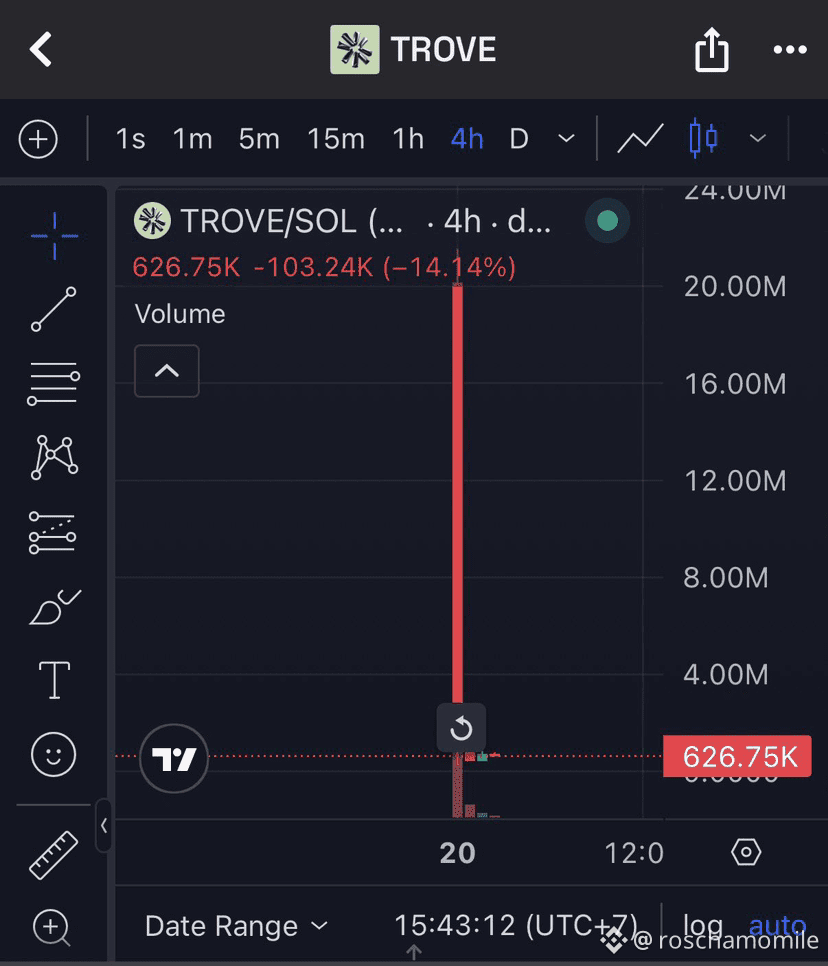
$TROVE feels more like a trust issue than a price issue. The hype was big, expectations were high, and when the plan suddenly changed, people felt misled. Once trust cracked, the dump was almost inevitable. The token may still exist, but value in crypto isn’t just about code or charts it’s about credibility. Sometimes it’s honestly clearer to stay in the trenches playing what you understand and can manage. than chasing narratives that look big but aren’t solid yet.
$TROVE feels more like a trust issue than a price issue. The hype was big, expectations were high, and when the plan suddenly changed, people felt misled. Once trust cracked, the dump was almost inevitable. The token may still exist, but value in crypto isn’t just about code or charts it’s about credibility. Sometimes it’s honestly clearer to stay in the trenches playing what you understand and can manage. than chasing narratives that look big but aren’t solid yet.
18
19.7k
·
--
Macro & Crypto Outlook: Why Markets Stay Bid Despite Geopolitical Noise
Despite elevated geopolitical tensions, global markets especially crypto remain surprisingly resilient. The reason is simple, liquidity expectations are overpowering fear narratives.
On the geopolitical front, risks are real and visible. Ongoing tensions across the Middle East, trade frictions, and political uncertainty in major economies continue to push traditional safe havens like gold and silver to new highs. Normally, this kind of environment would pressure risk assets. But this cycle is different.
The key difference lies in monetary expectations.
During the January 13–14 meetings, policymakers from the Federal Reserve signaled a clear stance:
rates are likely to be held steady, with no urgency to tighten further. Inflation data is cooling but not collapsing, allowing the Fed to remain patient rather than restrictive. Importantly, there was no pushback against current market optimism no strong hawkish surprise.
Markets interpreted this as confirmation that financial conditions will not be tightened aggressively, even with geopolitical risks still unresolved.
This is why capital behavior looks asymmetric:
Hard assets (gold, silver) are rising as hedges against political instability and currency debasement.
Risk assets (equities and crypto) are holding up because liquidity is expected to expand, not contract.
In crypto specifically, Bitcoin is acting less like a speculative asset and more like a macro liquidity barometer. While AI tokens and high-beta sectors show weakness, Bitcoin remains firm supported by institutional flows, ETF demand, and whale accumulation. This divergence suggests smart money is positioning early, while retail remains cautious.
This is not a risk-off environment—it’s a selective risk-on phase.
Hopefully
inflation continues trending lower, and
geopolitical shocks remain contained (not systemic),
liquidity rotation will continue—from cash → bonds → equities → Bitcoin.
Geopolitics explains the fear. Liquidity explains the price action.
Macro & Crypto Outlook: Why Markets Stay Bid Despite Geopolitical Noise
Despite elevated geopolitical tensions, global markets especially crypto remain surprisingly resilient. The reason is simple, liquidity expectations are overpowering fear narratives.
On the geopolitical front, risks are real and visible. Ongoing tensions across the Middle East, trade frictions, and political uncertainty in major economies continue to push traditional safe havens like gold and silver to new highs. Normally, this kind of environment would pressure risk assets. But this cycle is different.
The key difference lies in monetary expectations.
During the January 13–14 meetings, policymakers from the Federal Reserve signaled a clear stance:
rates are likely to be held steady, with no urgency to tighten further. Inflation data is cooling but not collapsing, allowing the Fed to remain patient rather than restrictive. Importantly, there was no pushback against current market optimism no strong hawkish surprise.
Markets interpreted this as confirmation that financial conditions will not be tightened aggressively, even with geopolitical risks still unresolved.
This is why capital behavior looks asymmetric:
Hard assets (gold, silver) are rising as hedges against political instability and currency debasement.
Risk assets (equities and crypto) are holding up because liquidity is expected to expand, not contract.
In crypto specifically, Bitcoin is acting less like a speculative asset and more like a macro liquidity barometer. While AI tokens and high-beta sectors show weakness, Bitcoin remains firm supported by institutional flows, ETF demand, and whale accumulation. This divergence suggests smart money is positioning early, while retail remains cautious.
This is not a risk-off environment—it’s a selective risk-on phase.
Hopefully
inflation continues trending lower, and
geopolitical shocks remain contained (not systemic),
liquidity rotation will continue—from cash → bonds → equities → Bitcoin.
Geopolitics explains the fear. Liquidity explains the price action.
Despite elevated geopolitical tensions, global markets especially crypto remain surprisingly resilient. The reason is simple, liquidity expectations are overpowering fear narratives.
On the geopolitical front, risks are real and visible. Ongoing tensions across the Middle East, trade frictions, and political uncertainty in major economies continue to push traditional safe havens like gold and silver to new highs. Normally, this kind of environment would pressure risk assets. But this cycle is different.
The key difference lies in monetary expectations.
During the January 13–14 meetings, policymakers from the Federal Reserve signaled a clear stance:
rates are likely to be held steady, with no urgency to tighten further. Inflation data is cooling but not collapsing, allowing the Fed to remain patient rather than restrictive. Importantly, there was no pushback against current market optimism no strong hawkish surprise.
Markets interpreted this as confirmation that financial conditions will not be tightened aggressively, even with geopolitical risks still unresolved.
This is why capital behavior looks asymmetric:
Hard assets (gold, silver) are rising as hedges against political instability and currency debasement.
Risk assets (equities and crypto) are holding up because liquidity is expected to expand, not contract.
In crypto specifically, Bitcoin is acting less like a speculative asset and more like a macro liquidity barometer. While AI tokens and high-beta sectors show weakness, Bitcoin remains firm supported by institutional flows, ETF demand, and whale accumulation. This divergence suggests smart money is positioning early, while retail remains cautious.
This is not a risk-off environment—it’s a selective risk-on phase.
Hopefully
inflation continues trending lower, and
geopolitical shocks remain contained (not systemic),
liquidity rotation will continue—from cash → bonds → equities → Bitcoin.
Geopolitics explains the fear. Liquidity explains the price action.
6
4
50
18.1k


·
--
Survived the year.
Still standing, Still degen. If it’s quiet…
Maybee…. it’s accumulation season. Thankyou @binance @BinanceAcademy merry christmas and happy new year 💛💛🎄🎅
Survived the year.
Still standing, Still degen. If it’s quiet…
Maybee…. it’s accumulation season. Thankyou @binance @BinanceAcademy merry christmas and happy new year 💛💛🎄🎅
Still standing, Still degen. If it’s quiet…
Maybee…. it’s accumulation season. Thankyou @binance @BinanceAcademy merry christmas and happy new year 💛💛🎄🎅

6
6
58
21.9k
·
--
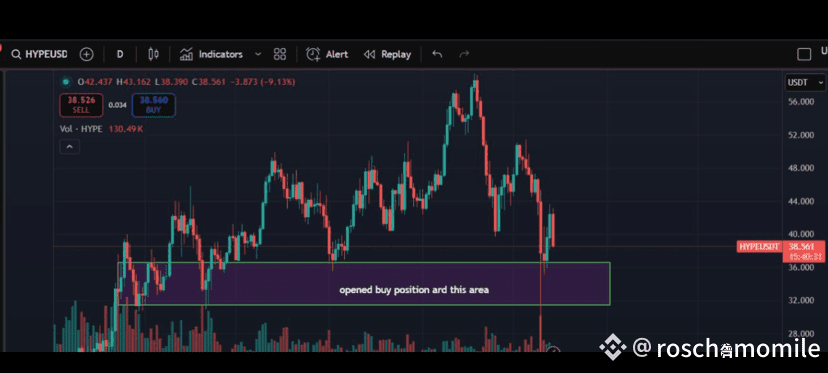
Shared on my private channel to buy hype at bottom $33 was a free entry, today hitted $49 / $HYPE congrats !
Shared on my private channel to buy hype at bottom $33 was a free entry, today hitted $49 / $HYPE congrats !
9
11
61
11.9k
·
--
📉 BTC Technical Update
As mentioned previously, more downside on BTC looks to be playing out and the chart is showing it clearly.
Bitcoin is currently sitting at a major confluence zone:
1) 200 EMA (Daily)
2) Middle of the ascending channel
3) 0.618 Fib retracement from the last swing low
This zone has been holding price up, but momentum looks weak.
If this level breaks down with confirmation, I’ll start buying spot bags around the previously mentioned zones:
Price Target Reminder:
1️⃣ $100,963 –Daily + 0.5 Fib
2️⃣ $92,570 –Channel bottom + 0.618 Fib
Patience is key. A clean break and retest could set the stage for the final shakeout before the next major leg up. ⚡️
📉 BTC Technical Update
As mentioned previously, more downside on BTC looks to be playing out and the chart is showing it clearly.
Bitcoin is currently sitting at a major confluence zone:
1) 200 EMA (Daily)
2) Middle of the ascending channel
3) 0.618 Fib retracement from the last swing low
This zone has been holding price up, but momentum looks weak.
If this level breaks down with confirmation, I’ll start buying spot bags around the previously mentioned zones:
Price Target Reminder:
1️⃣ $100,963 –Daily + 0.5 Fib
2️⃣ $92,570 –Channel bottom + 0.618 Fib
Patience is key. A clean break and retest could set the stage for the final shakeout before the next major leg up. ⚡️
As mentioned previously, more downside on BTC looks to be playing out and the chart is showing it clearly.
Bitcoin is currently sitting at a major confluence zone:
1) 200 EMA (Daily)
2) Middle of the ascending channel
3) 0.618 Fib retracement from the last swing low
This zone has been holding price up, but momentum looks weak.
If this level breaks down with confirmation, I’ll start buying spot bags around the previously mentioned zones:
Price Target Reminder:
1️⃣ $100,963 –Daily + 0.5 Fib
2️⃣ $92,570 –Channel bottom + 0.618 Fib
Patience is key. A clean break and retest could set the stage for the final shakeout before the next major leg up. ⚡️
3
1
22
8k
·
--
Altseason Might Be Closer Than You Think
Here’s what I’m seeing on the charts:
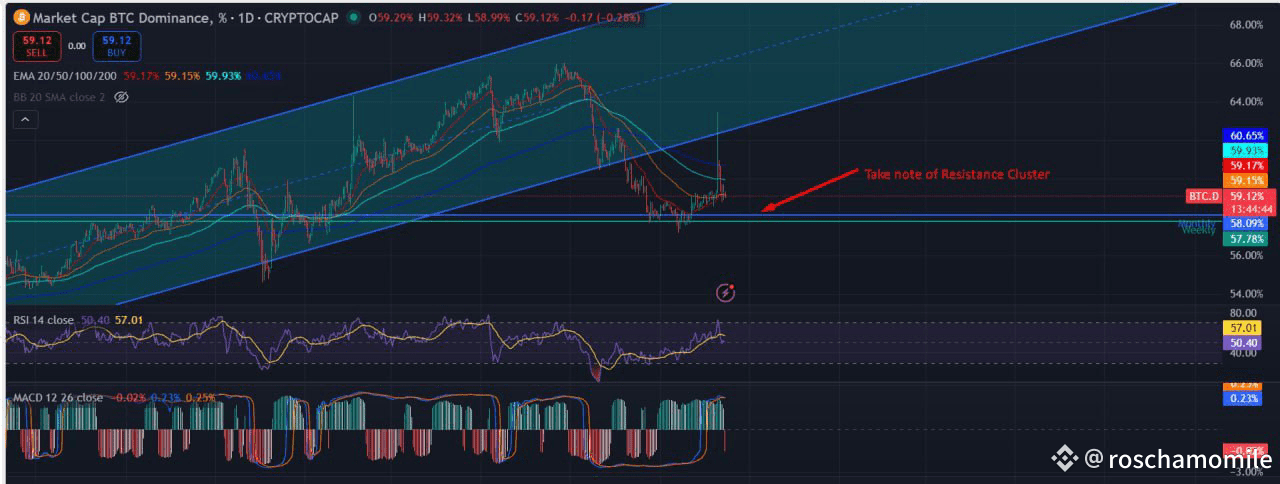
BTC Dominance (BTC.D)
For altseason to happen, BTC.D has to drop, meaning capital starts rotating from BTC into ETH and alts.
From the chart above:
- RSI is sitting high which showing overbought
- MACD just crossover above 0 and printed its first red bar, often a sign of bearish trend shift
This hints that BTC.D could start cooling off, exactly what we want before altseason kicks off.
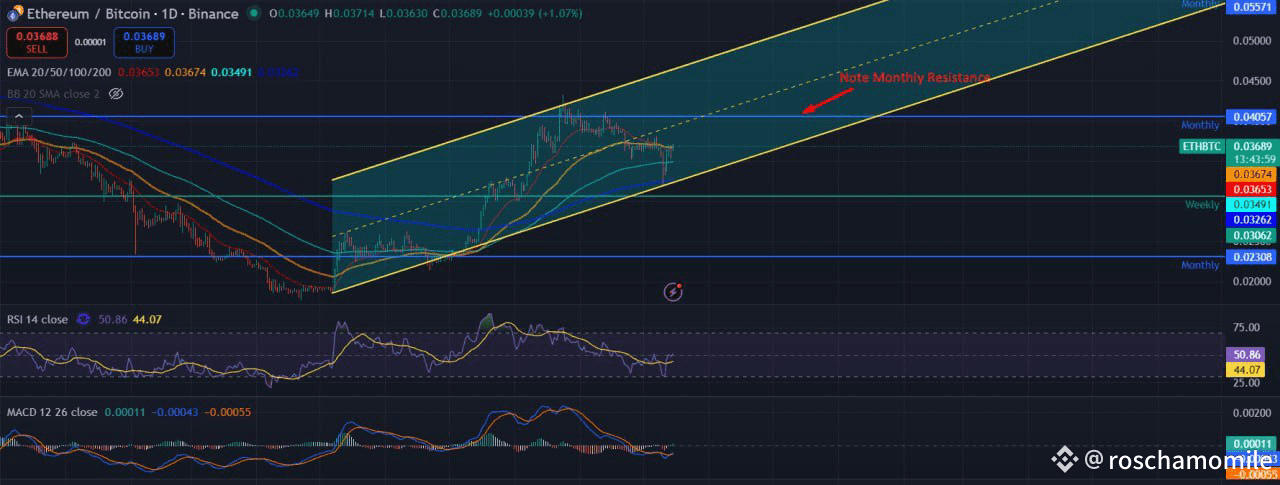
ETH/BTC Pair
On the flip side,
- ETH/BTC is in a clean uptrend channel on the daily showing ETH gaining dominance over BTC
- RSI is low, hinting oversold
- MACD just made a bullish crossover from below 0, early sign of a bull trend reversal
If this plays out, it means ETH could start gaining strength over BTC — a classic signal before alts begin their major run.
⚡️ In Short:
BTC dominance cooling off + ETH gaining momentum = the perfect setup for altseason.
Of course, it requires time to play out and might just be entering the early phase!
Altseason Might Be Closer Than You Think
Here’s what I’m seeing on the charts:
BTC Dominance (BTC.D)
For altseason to happen, BTC.D has to drop, meaning capital starts rotating from BTC into ETH and alts.
From the chart above:
- RSI is sitting high which showing overbought
- MACD just crossover above 0 and printed its first red bar, often a sign of bearish trend shift
This hints that BTC.D could start cooling off, exactly what we want before altseason kicks off.
ETH/BTC Pair
On the flip side,
- ETH/BTC is in a clean uptrend channel on the daily showing ETH gaining dominance over BTC
- RSI is low, hinting oversold
- MACD just made a bullish crossover from below 0, early sign of a bull trend reversal
If this plays out, it means ETH could start gaining strength over BTC — a classic signal before alts begin their major run.
⚡️ In Short:
BTC dominance cooling off + ETH gaining momentum = the perfect setup for altseason.
Of course, it requires time to play out and might just be entering the early phase!
Here’s what I’m seeing on the charts:
BTC Dominance (BTC.D)
For altseason to happen, BTC.D has to drop, meaning capital starts rotating from BTC into ETH and alts.
From the chart above:
- RSI is sitting high which showing overbought
- MACD just crossover above 0 and printed its first red bar, often a sign of bearish trend shift
This hints that BTC.D could start cooling off, exactly what we want before altseason kicks off.
ETH/BTC Pair
On the flip side,
- ETH/BTC is in a clean uptrend channel on the daily showing ETH gaining dominance over BTC
- RSI is low, hinting oversold
- MACD just made a bullish crossover from below 0, early sign of a bull trend reversal
If this plays out, it means ETH could start gaining strength over BTC — a classic signal before alts begin their major run.
⚡️ In Short:
BTC dominance cooling off + ETH gaining momentum = the perfect setup for altseason.
Of course, it requires time to play out and might just be entering the early phase!
5
4
18
6.9k
·
--
🧭 Market Rotation Watch
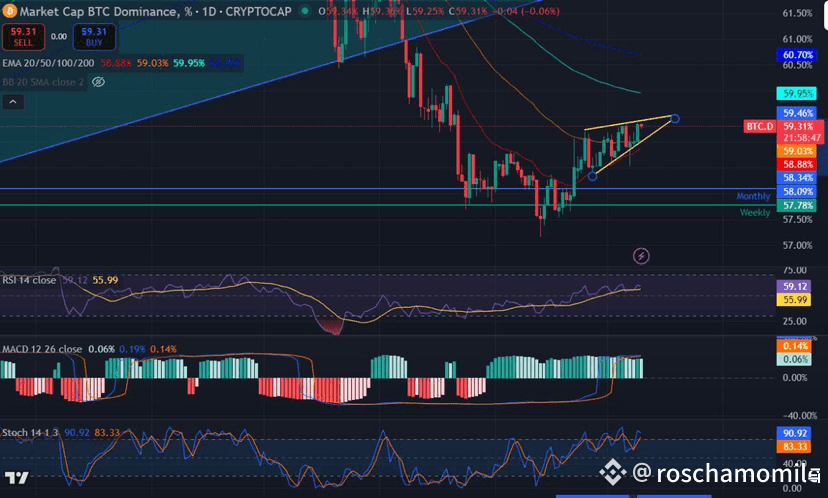
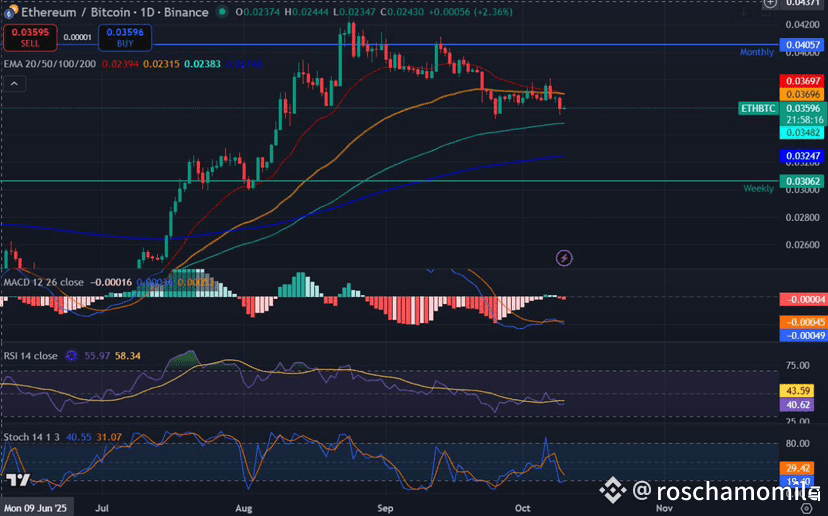
As we are seeing dips across the board, BTC Dominance now overbought while ETH/BTC oversold
This usually hints that the next market pump could shift strength toward ETH, and if that happen, it might just send alts flying... what we all know as Altseason ⚡️
The dip over the last few days was necessary to reset indicators and charge up for the next move
🧭 Market Rotation Watch
As we are seeing dips across the board, BTC Dominance now overbought while ETH/BTC oversold
This usually hints that the next market pump could shift strength toward ETH, and if that happen, it might just send alts flying... what we all know as Altseason ⚡️
The dip over the last few days was necessary to reset indicators and charge up for the next move
As we are seeing dips across the board, BTC Dominance now overbought while ETH/BTC oversold
This usually hints that the next market pump could shift strength toward ETH, and if that happen, it might just send alts flying... what we all know as Altseason ⚡️
The dip over the last few days was necessary to reset indicators and charge up for the next move
1
12
9.9k
·
--
📊 BTC Daily Outlook
BTC continues to move within its long-term ascending channel, currently sitting just below the upper mid-range after rejection near 124.6k.
Indicators are showing signs of cooling off:
- MACD: Potential bearish crossover forming ⚠️
- RSI: Drifting down from neutral-high levels
- Stochastic: Still slightly overbought
🔹 Key Support Zone (IF we continue downward): 118.8k – 116k (Support + Fib 0.5 + 50 EMA)
We could see some sideways or slight pullback movement before the next leg up.
But remember, the market often shakes out traders before the real move, so staying flexible is key. I'll trade accordingly to what the chart shows me
⚠️ Disclaimer: This outlook is purely based on technical analysis.
When the true parabolic phase begins, TA gets thrown out the window, liquidity, sentiment, and momentum will take over.
For now, the market’s just charging up, stay sharp, stay ready.
More outlook join Telegram :
https://t.me/rosrocket/1023
📊 BTC Daily Outlook
BTC continues to move within its long-term ascending channel, currently sitting just below the upper mid-range after rejection near 124.6k.
Indicators are showing signs of cooling off:
- MACD: Potential bearish crossover forming ⚠️
- RSI: Drifting down from neutral-high levels
- Stochastic: Still slightly overbought
🔹 Key Support Zone (IF we continue downward): 118.8k – 116k (Support + Fib 0.5 + 50 EMA)
We could see some sideways or slight pullback movement before the next leg up.
But remember, the market often shakes out traders before the real move, so staying flexible is key. I'll trade accordingly to what the chart shows me
⚠️ Disclaimer: This outlook is purely based on technical analysis.
When the true parabolic phase begins, TA gets thrown out the window, liquidity, sentiment, and momentum will take over.
For now, the market’s just charging up, stay sharp, stay ready.
More outlook join Telegram :
https://t.me/rosrocket/1023
BTC continues to move within its long-term ascending channel, currently sitting just below the upper mid-range after rejection near 124.6k.
Indicators are showing signs of cooling off:
- MACD: Potential bearish crossover forming ⚠️
- RSI: Drifting down from neutral-high levels
- Stochastic: Still slightly overbought
🔹 Key Support Zone (IF we continue downward): 118.8k – 116k (Support + Fib 0.5 + 50 EMA)
We could see some sideways or slight pullback movement before the next leg up.
But remember, the market often shakes out traders before the real move, so staying flexible is key. I'll trade accordingly to what the chart shows me
⚠️ Disclaimer: This outlook is purely based on technical analysis.
When the true parabolic phase begins, TA gets thrown out the window, liquidity, sentiment, and momentum will take over.
For now, the market’s just charging up, stay sharp, stay ready.
More outlook join Telegram :
https://t.me/rosrocket/1023
7
170
·
--
BTC is currently testing resistance at $124K, with its momentum starting to slow down.
On the M15 timeframe, BTC just tapped the liquidity area around $123,500.
Based on the current daily bias, BTC remains vulnerable to a correction and on M15 it may potentially revisit the nearest liquidity area at $121,500.
BTC is currently testing resistance at $124K, with its momentum starting to slow down.
On the M15 timeframe, BTC just tapped the liquidity area around $123,500.
Based on the current daily bias, BTC remains vulnerable to a correction and on M15 it may potentially revisit the nearest liquidity area at $121,500.
On the M15 timeframe, BTC just tapped the liquidity area around $123,500.
Based on the current daily bias, BTC remains vulnerable to a correction and on M15 it may potentially revisit the nearest liquidity area at $121,500.
1
10
4.7k
·
--
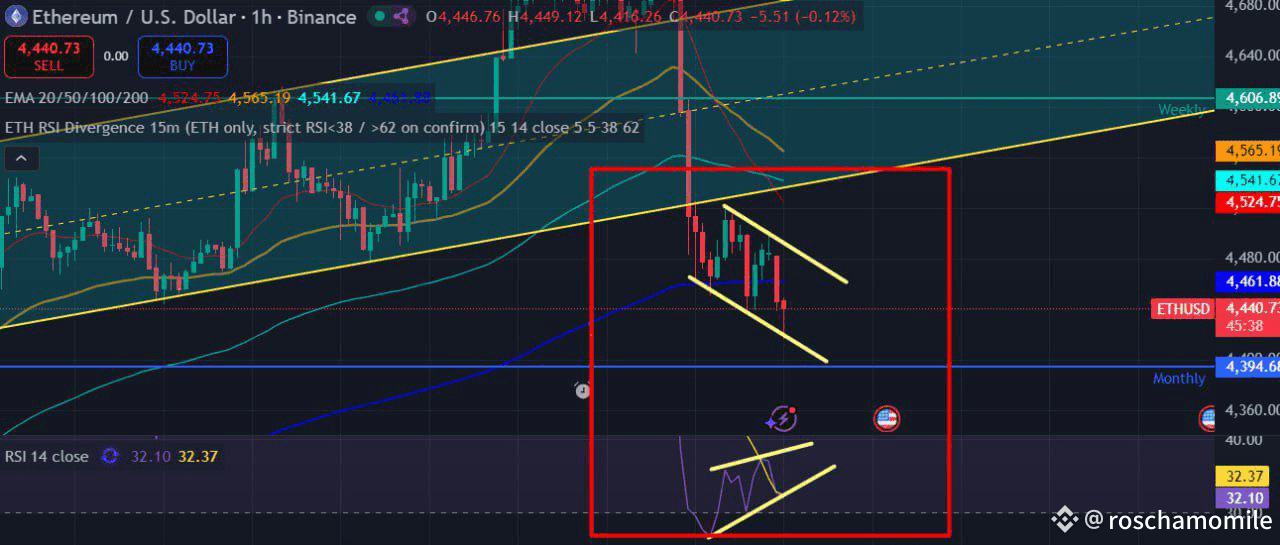
📊 Bullish Divergences Spotted — $SOL & $ETH (1H Chart)
Both $SOL and $ETH showing bullish divergences on the 1-hour timeframe 👀
🧠 What this means:
- Price action making lower lows and lower highs
- RSI showing higher lows and higher highs
This mismatch between price and momentum often signals that selling pressure is weakening and a reversal could be near.
📈 Entered some longs here — will scale in more if confirmation comes in.
Let’s see if this plays out as the next leg up for majors.
Not financial advice. Just sharing my setup and thoughts as always. 💪
📊 Bullish Divergences Spotted — $SOL & $ETH (1H Chart)
Both $SOL and $ETH showing bullish divergences on the 1-hour timeframe 👀
🧠 What this means:
- Price action making lower lows and lower highs
- RSI showing higher lows and higher highs
This mismatch between price and momentum often signals that selling pressure is weakening and a reversal could be near.
📈 Entered some longs here — will scale in more if confirmation comes in.
Let’s see if this plays out as the next leg up for majors.
Not financial advice. Just sharing my setup and thoughts as always. 💪
Both $SOL and $ETH showing bullish divergences on the 1-hour timeframe 👀
🧠 What this means:
- Price action making lower lows and lower highs
- RSI showing higher lows and higher highs
This mismatch between price and momentum often signals that selling pressure is weakening and a reversal could be near.
📈 Entered some longs here — will scale in more if confirmation comes in.
Let’s see if this plays out as the next leg up for majors.
Not financial advice. Just sharing my setup and thoughts as always. 💪
1
11
3.4k
·
--
Article
Will Plasma Survive?XPL (Plasma) Price Correction: What Happened
Since its launch on September 25, 2025, XPL (Plasma) has undergone a sharp correction.
As of October 5, 2025, the price trades around $0.84–$0.87, down approximately 48–50% from its ATH of $1.69 reached in late September.
Meanwhile, the broader crypto market is relatively stable, up about +1–2%, indicating that XPL’s decline is primarily driven by internal and sentiment-related factors.
1. Profit-Taking Post-Launch
• After the Token Generation Event (TGE) on Binance and other exchanges, XPL surged from its ICO price of $0.05 to $1.68, a 1,500% increase in hours.
• Early investors and public sale participants realized profits of 17–20x and sold immediately.
• Around 8% of the total supply (800 million XPL) was unlocked for DeFi activities, increasing sell pressure.
• The $373 million oversubscribed public sale also led to speculative inflows that quickly exited after withdrawals opened.
2. FUD and Insider-Selling Rumors
• On-chain analysts such as ManaMoon reported 600 million XPL transferred to exchanges pre-launch, allegedly through TWAP selling to mask large disposals.
• Rumors tied the team to projects like Blast and Blur, both of which suffered major price collapses in past cycles.
• Founder Paul Faecks denied all claims, stating:
“There is no contract with Wintermute, and team/investor tokens remain locked for 3 years with a 1-year cliff.”
• Despite clarification, the FUD triggered over $3.3 million in long liquidations across exchanges.
3. Market Pressure and Tokenomics
• Circulating supply: 1.8 billion XPL out of a total 10 billion.
• Liquidity concentration: 74% across Binance, Ceffu, and MEXC.
• Low DEX liquidity (~$1.5M) makes price highly sensitive to large transactions.
• A glitch on Aster DEX falsely spiked prices to $4, causing $69M in forced liquidations and damaging trust.
• Despite the Chainlink integration (October 3) being positive, the market deemed it priced in; LINK itself rose 6.7%.
• Plasma’s TVL peaked at $5.5–8B, but most deposits were speculative and may withdraw as volatility continues.
4. Upcoming Token Unlocks
According to official tokenomics and community discussions:
• July 2025: Unlock of 1 billion XPL from U.S. investors (early round allocation). This represents a 55% increase in circulating supply, potentially pressuring prices if demand remains flat.
• Post-July 2025: Team and investor tokens remain locked with a 3-year vesting period and 1-year cliff (since TGE, September 25, 2024). Unlocks are expected gradually between Q4 2025 and 2027.
Community estimates suggest unlocks of 2–5% of total supply per quarter, but this has not been officially confirmed.
Investors should monitor official Plasma channels and on-chain vesting wallets for verification.
Investment Note:
The July 2025 unlock could trigger volatility. Strategic accumulation should be laddered over time, not driven by FOMO.
5. Opportunities and Risks
Short-term (Bearish):
• Potential continuation down to $0.65–$0.80 range if FUD and unlock fears persist.
• Smart money flows have rotated to other assets, signaling caution.
Long-term (Bullish):
• Plasma is positioned as a stablecoin-focused layer enabling zero-fee USDT transfers, EVM compatibility, and institutional integrations.
• Supported by Tether, Bitfinex, and Peter Thiel–backed entities, its narrative aligns with the expansion of the stablecoin economy.
• If execution continues, Plasma could capture market share from Tron (FDV ~$32B), targeting a realistic FDV of $5–15B with $2–3T in stablecoin transfer volume per month.
• Partnerships with Chainlink and Aave (TVL > $6.2B) demonstrate early ecosystem traction.
Tether’s strengthening fundamentals and global investments create a supportive macro environment for stablecoin ecosystems like Plasma.
However, XPL’s short-term price pressure stems from internal factors, profit-taking, liquidity concentration, and supply unlocks.
The long-term thesis remains intact:
Tether-backed infrastructure projects such as Plasma could play a key role in the next phase of stablecoin-driven growth.
But investors must remain disciplined , monitor on-chain metrics, watch vesting schedules, and avoid emotional trading.
Will Plasma Survive?
XPL (Plasma) Price Correction: What Happened
Since its launch on September 25, 2025, XPL (Plasma) has undergone a sharp correction.
As of October 5, 2025, the price trades around $0.84–$0.87, down approximately 48–50% from its ATH of $1.69 reached in late September.
Meanwhile, the broader crypto market is relatively stable, up about +1–2%, indicating that XPL’s decline is primarily driven by internal and sentiment-related factors.
1. Profit-Taking Post-Launch
• After the Token Generation Event (TGE) on Binance and other exchanges, XPL surged from its ICO price of $0.05 to $1.68, a 1,500% increase in hours.
• Early investors and public sale participants realized profits of 17–20x and sold immediately.
• Around 8% of the total supply (800 million XPL) was unlocked for DeFi activities, increasing sell pressure.
• The $373 million oversubscribed public sale also led to speculative inflows that quickly exited after withdrawals opened.
2. FUD and Insider-Selling Rumors
• On-chain analysts such as ManaMoon reported 600 million XPL transferred to exchanges pre-launch, allegedly through TWAP selling to mask large disposals.
• Rumors tied the team to projects like Blast and Blur, both of which suffered major price collapses in past cycles.
• Founder Paul Faecks denied all claims, stating:
“There is no contract with Wintermute, and team/investor tokens remain locked for 3 years with a 1-year cliff.”
• Despite clarification, the FUD triggered over $3.3 million in long liquidations across exchanges.
3. Market Pressure and Tokenomics
• Circulating supply: 1.8 billion XPL out of a total 10 billion.
• Liquidity concentration: 74% across Binance, Ceffu, and MEXC.
• Low DEX liquidity (~$1.5M) makes price highly sensitive to large transactions.
• A glitch on Aster DEX falsely spiked prices to $4, causing $69M in forced liquidations and damaging trust.
• Despite the Chainlink integration (October 3) being positive, the market deemed it priced in; LINK itself rose 6.7%.
• Plasma’s TVL peaked at $5.5–8B, but most deposits were speculative and may withdraw as volatility continues.
4. Upcoming Token Unlocks
According to official tokenomics and community discussions:
• July 2025: Unlock of 1 billion XPL from U.S. investors (early round allocation). This represents a 55% increase in circulating supply, potentially pressuring prices if demand remains flat.
• Post-July 2025: Team and investor tokens remain locked with a 3-year vesting period and 1-year cliff (since TGE, September 25, 2024). Unlocks are expected gradually between Q4 2025 and 2027.
Community estimates suggest unlocks of 2–5% of total supply per quarter, but this has not been officially confirmed.
Investors should monitor official Plasma channels and on-chain vesting wallets for verification.
Investment Note:
The July 2025 unlock could trigger volatility. Strategic accumulation should be laddered over time, not driven by FOMO.
5. Opportunities and Risks
Short-term (Bearish):
• Potential continuation down to $0.65–$0.80 range if FUD and unlock fears persist.
• Smart money flows have rotated to other assets, signaling caution.
Long-term (Bullish):
• Plasma is positioned as a stablecoin-focused layer enabling zero-fee USDT transfers, EVM compatibility, and institutional integrations.
• Supported by Tether, Bitfinex, and Peter Thiel–backed entities, its narrative aligns with the expansion of the stablecoin economy.
• If execution continues, Plasma could capture market share from Tron (FDV ~$32B), targeting a realistic FDV of $5–15B with $2–3T in stablecoin transfer volume per month.
• Partnerships with Chainlink and Aave (TVL > $6.2B) demonstrate early ecosystem traction.
Tether’s strengthening fundamentals and global investments create a supportive macro environment for stablecoin ecosystems like Plasma.
However, XPL’s short-term price pressure stems from internal factors, profit-taking, liquidity concentration, and supply unlocks.
The long-term thesis remains intact:
Tether-backed infrastructure projects such as Plasma could play a key role in the next phase of stablecoin-driven growth.
But investors must remain disciplined , monitor on-chain metrics, watch vesting schedules, and avoid emotional trading.
Since its launch on September 25, 2025, XPL (Plasma) has undergone a sharp correction.
As of October 5, 2025, the price trades around $0.84–$0.87, down approximately 48–50% from its ATH of $1.69 reached in late September.
Meanwhile, the broader crypto market is relatively stable, up about +1–2%, indicating that XPL’s decline is primarily driven by internal and sentiment-related factors.
1. Profit-Taking Post-Launch
• After the Token Generation Event (TGE) on Binance and other exchanges, XPL surged from its ICO price of $0.05 to $1.68, a 1,500% increase in hours.
• Early investors and public sale participants realized profits of 17–20x and sold immediately.
• Around 8% of the total supply (800 million XPL) was unlocked for DeFi activities, increasing sell pressure.
• The $373 million oversubscribed public sale also led to speculative inflows that quickly exited after withdrawals opened.
2. FUD and Insider-Selling Rumors
• On-chain analysts such as ManaMoon reported 600 million XPL transferred to exchanges pre-launch, allegedly through TWAP selling to mask large disposals.
• Rumors tied the team to projects like Blast and Blur, both of which suffered major price collapses in past cycles.
• Founder Paul Faecks denied all claims, stating:
“There is no contract with Wintermute, and team/investor tokens remain locked for 3 years with a 1-year cliff.”
• Despite clarification, the FUD triggered over $3.3 million in long liquidations across exchanges.
3. Market Pressure and Tokenomics
• Circulating supply: 1.8 billion XPL out of a total 10 billion.
• Liquidity concentration: 74% across Binance, Ceffu, and MEXC.
• Low DEX liquidity (~$1.5M) makes price highly sensitive to large transactions.
• A glitch on Aster DEX falsely spiked prices to $4, causing $69M in forced liquidations and damaging trust.
• Despite the Chainlink integration (October 3) being positive, the market deemed it priced in; LINK itself rose 6.7%.
• Plasma’s TVL peaked at $5.5–8B, but most deposits were speculative and may withdraw as volatility continues.
4. Upcoming Token Unlocks
According to official tokenomics and community discussions:
• July 2025: Unlock of 1 billion XPL from U.S. investors (early round allocation). This represents a 55% increase in circulating supply, potentially pressuring prices if demand remains flat.
• Post-July 2025: Team and investor tokens remain locked with a 3-year vesting period and 1-year cliff (since TGE, September 25, 2024). Unlocks are expected gradually between Q4 2025 and 2027.
Community estimates suggest unlocks of 2–5% of total supply per quarter, but this has not been officially confirmed.
Investors should monitor official Plasma channels and on-chain vesting wallets for verification.
Investment Note:
The July 2025 unlock could trigger volatility. Strategic accumulation should be laddered over time, not driven by FOMO.
5. Opportunities and Risks
Short-term (Bearish):
• Potential continuation down to $0.65–$0.80 range if FUD and unlock fears persist.
• Smart money flows have rotated to other assets, signaling caution.
Long-term (Bullish):
• Plasma is positioned as a stablecoin-focused layer enabling zero-fee USDT transfers, EVM compatibility, and institutional integrations.
• Supported by Tether, Bitfinex, and Peter Thiel–backed entities, its narrative aligns with the expansion of the stablecoin economy.
• If execution continues, Plasma could capture market share from Tron (FDV ~$32B), targeting a realistic FDV of $5–15B with $2–3T in stablecoin transfer volume per month.
• Partnerships with Chainlink and Aave (TVL > $6.2B) demonstrate early ecosystem traction.
Tether’s strengthening fundamentals and global investments create a supportive macro environment for stablecoin ecosystems like Plasma.
However, XPL’s short-term price pressure stems from internal factors, profit-taking, liquidity concentration, and supply unlocks.
The long-term thesis remains intact:
Tether-backed infrastructure projects such as Plasma could play a key role in the next phase of stablecoin-driven growth.
But investors must remain disciplined , monitor on-chain metrics, watch vesting schedules, and avoid emotional trading.
5
4.4k
Log in to explore more content
Join global crypto users on Binance Square
⚡️ Get latest and useful information about crypto.
💬 Trusted by the world’s largest crypto exchange.
👍 Discover real insights from verified creators.
Email / Phone number
Trending Topics
BitwiseFilesFinalNEARSpotETFProspectus
51,262 views
1,141 Discussing
#bitwisefilesfinalnearspotetfprospectus
Can $NEAR REALLY reach $562 with an ETF approval? 🚀
The crypto market is buzzing as Bitwise files its final prospectus for a Spot NEAR ETF (Ticker: NRR on NYSE Arca)! 📊🔥
Is institutional money about to unleash the biggest pump in NEAR’s history? Analysts are throwing around mind-blowing price targets:
🎯 Intermediate Target: $155
🎯 2030 Long-Term Target: $562
💡 Let's do the math:
At $562, $NEAR would sit at roughly a $680 Billion market cap—putting it right up there with Ethereum's potential valuation. With NEAR leading the Chain Abstraction & AI crypto narrative, this might not be as crazy as it sounds!
With SEC regulations turning more crypto-friendly and Wall Street knocking on the door, are you Accumulating or Holding?
👇 Drop your realistic price prediction for $NEAR in the comments! 👇
#BitwiseFilesFinalNEARSpotETFProspectus #Altcoins #CryptoNews #ETF
Doomsday-Trader
·5 Likes
·3.4k views
BitgetHackerMoves$83MStolenXRP
24,838 views
149 Discussing
SOLSpotETFWeeklyInflow$188M
14,728 views
117 Discussing