
bullsclub
540 Posts

bullsclub
Report
Block User
just hype
Frequent Trader
9.1 Years
593 Following
687 Followers
879 Liked
Posts
All
Quotes
·
--
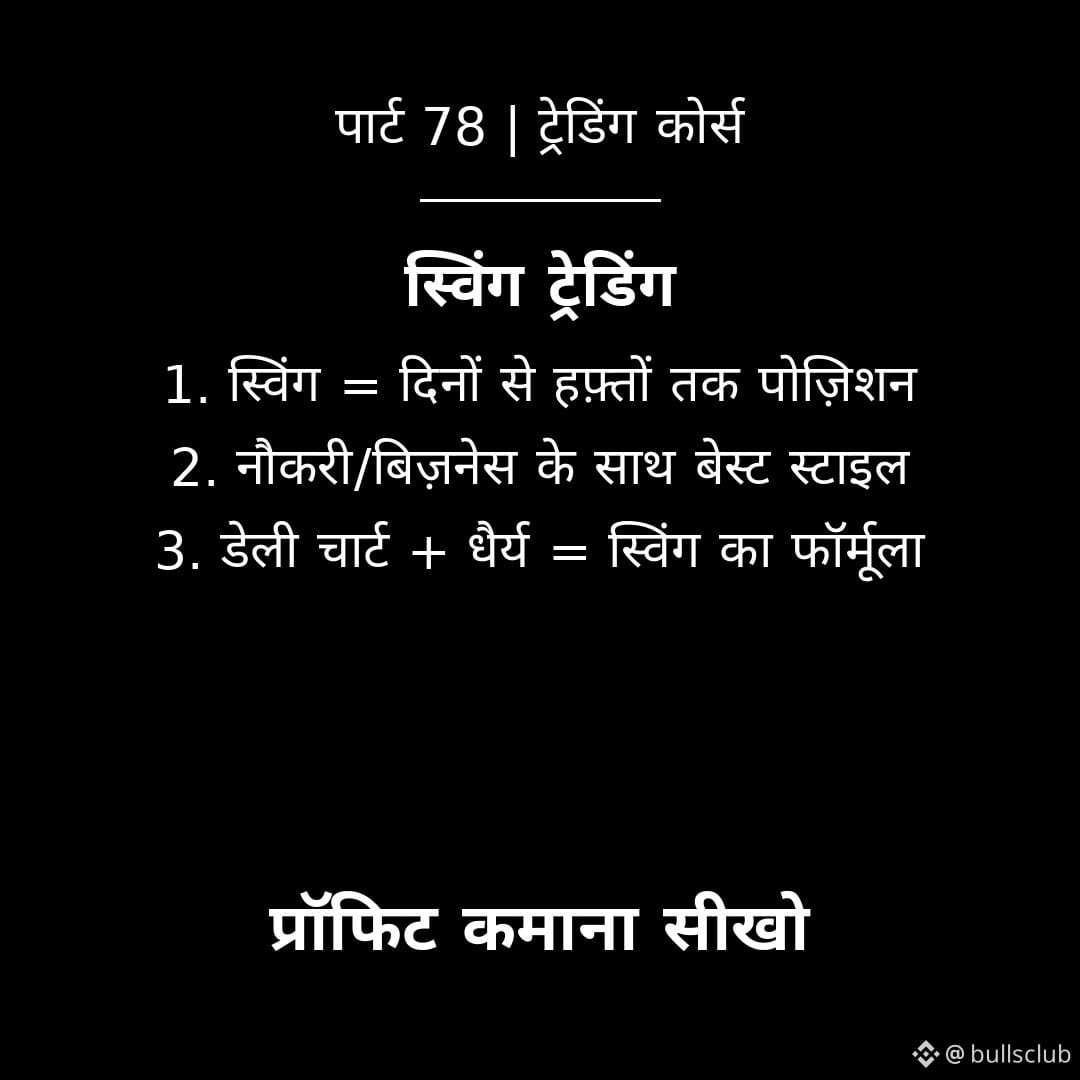
Part 78 | Swing Trading
In swing trading, positions are held for days to weeks — making money from major price swings. It’s one of the best styles to combine with a job or business because you don’t have to stay glued to the screen every day.
How to do it:
1. Check the trend and levels on the daily chart
2. Enter on a pullback, exit at the swing high
3. Be patient — swings take time
Remember: Swing trading is the best place for new traders to start — slow but steady.
Follow 👇
#DayTrading #SwingTrading #Crypto $BTC
Part 78 | Swing Trading
In swing trading, positions are held for days to weeks — making money from major price swings. It’s one of the best styles to combine with a job or business because you don’t have to stay glued to the screen every day.
How to do it:
1. Check the trend and levels on the daily chart
2. Enter on a pullback, exit at the swing high
3. Be patient — swings take time
Remember: Swing trading is the best place for new traders to start — slow but steady.
Follow 👇
#DayTrading #SwingTrading #Crypto $BTC
In swing trading, positions are held for days to weeks — making money from major price swings. It’s one of the best styles to combine with a job or business because you don’t have to stay glued to the screen every day.
How to do it:
1. Check the trend and levels on the daily chart
2. Enter on a pullback, exit at the swing high
3. Be patient — swings take time
Remember: Swing trading is the best place for new traders to start — slow but steady.
Follow 👇
#DayTrading #SwingTrading #Crypto $BTC
4
·
--
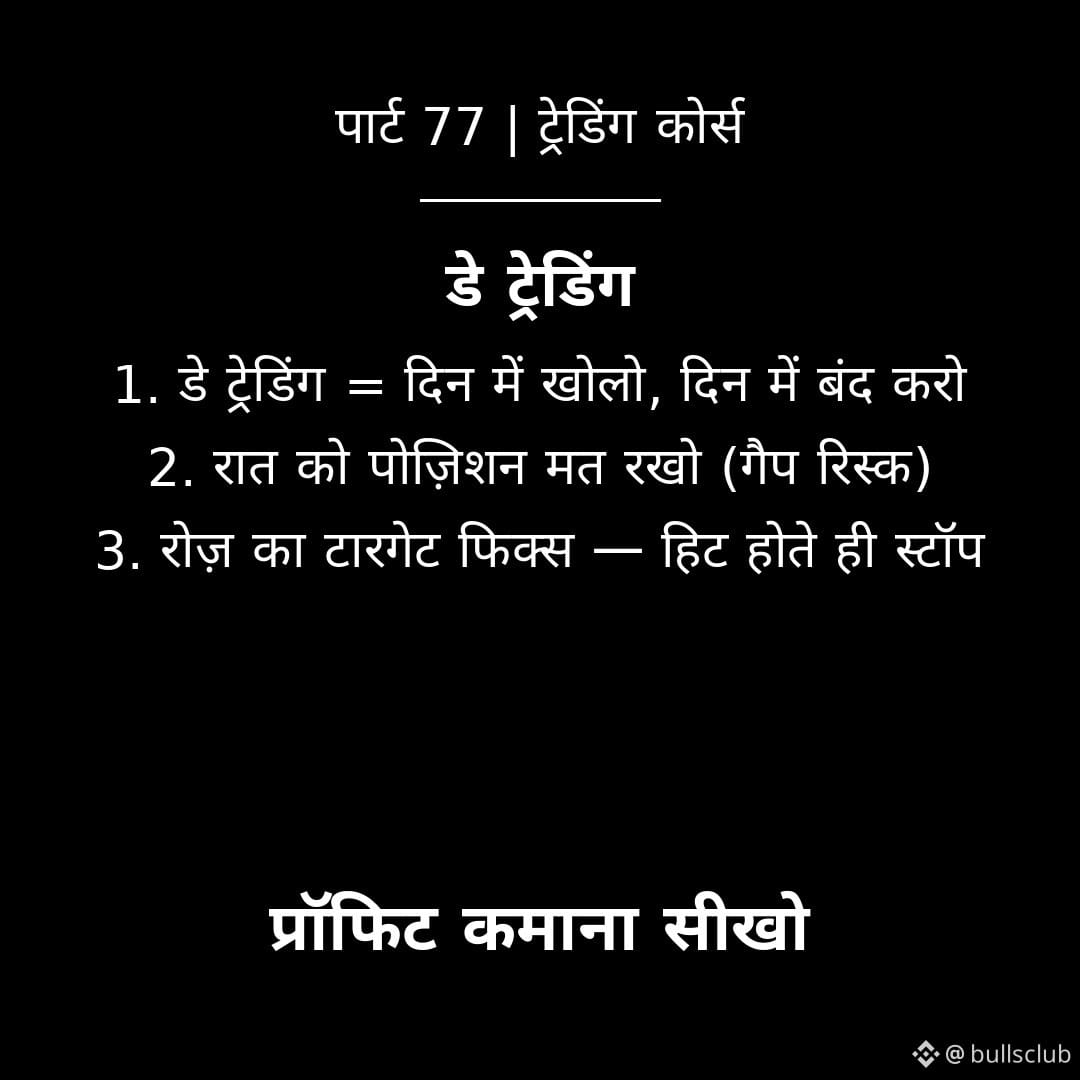
Part 77 | Day Trading
In day trading, positions are opened and closed on the same day—no positions are held overnight. This helps avoid overnight gap risk. Set a fixed daily target—once you hit it, turn off your screen.
How to do it:
1. Make a plan in the morning and stick to it throughout the day
2. Hit your target or maximum loss = the day is over
3. Holding positions overnight isn’t day trading—it’s gambling
Remember: A day trader’s earnings are determined daily—don’t work overtime out of greed.
Follow 👇
#PriceAction #TradingStrategy #DayTrading $BNB
Part 77 | Day Trading
In day trading, positions are opened and closed on the same day—no positions are held overnight. This helps avoid overnight gap risk. Set a fixed daily target—once you hit it, turn off your screen.
How to do it:
1. Make a plan in the morning and stick to it throughout the day
2. Hit your target or maximum loss = the day is over
3. Holding positions overnight isn’t day trading—it’s gambling
Remember: A day trader’s earnings are determined daily—don’t work overtime out of greed.
Follow 👇
#PriceAction #TradingStrategy #DayTrading $BNB
In day trading, positions are opened and closed on the same day—no positions are held overnight. This helps avoid overnight gap risk. Set a fixed daily target—once you hit it, turn off your screen.
How to do it:
1. Make a plan in the morning and stick to it throughout the day
2. Hit your target or maximum loss = the day is over
3. Holding positions overnight isn’t day trading—it’s gambling
Remember: A day trader’s earnings are determined daily—don’t work overtime out of greed.
Follow 👇
#PriceAction #TradingStrategy #DayTrading $BNB
14
·
--
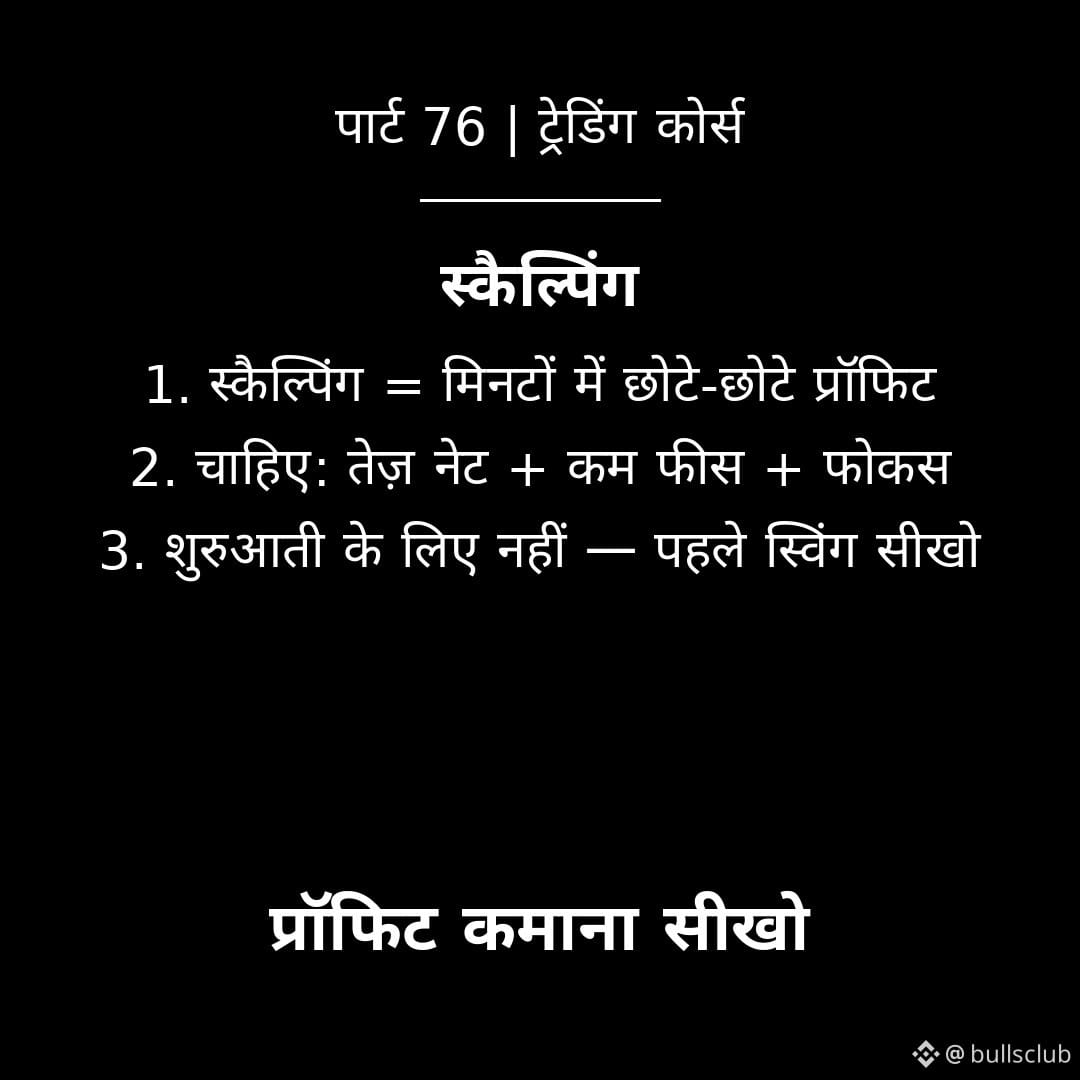
Part 76 | Scalping
Scalping involves taking small profits within minutes — dozens of trades a day. It requires fast internet, a low-fee exchange, and complete focus. It’s not for beginners — learn swing trading first.
How to understand it:
1. Small profit × many trades = daily earnings
2. One big mistake can wipe out all your small profits
3. Fees are a scalper’s biggest enemy
Remember: Scalping is the fastest style — and the fastest way to lose everything, too.
Follow 👇
#SwingTrading #Crypto #PriceAction $BTC
Part 76 | Scalping
Scalping involves taking small profits within minutes — dozens of trades a day. It requires fast internet, a low-fee exchange, and complete focus. It’s not for beginners — learn swing trading first.
How to understand it:
1. Small profit × many trades = daily earnings
2. One big mistake can wipe out all your small profits
3. Fees are a scalper’s biggest enemy
Remember: Scalping is the fastest style — and the fastest way to lose everything, too.
Follow 👇
#SwingTrading #Crypto #PriceAction $BTC
Scalping involves taking small profits within minutes — dozens of trades a day. It requires fast internet, a low-fee exchange, and complete focus. It’s not for beginners — learn swing trading first.
How to understand it:
1. Small profit × many trades = daily earnings
2. One big mistake can wipe out all your small profits
3. Fees are a scalper’s biggest enemy
Remember: Scalping is the fastest style — and the fastest way to lose everything, too.
Follow 👇
#SwingTrading #Crypto #PriceAction $BTC
6
·
--
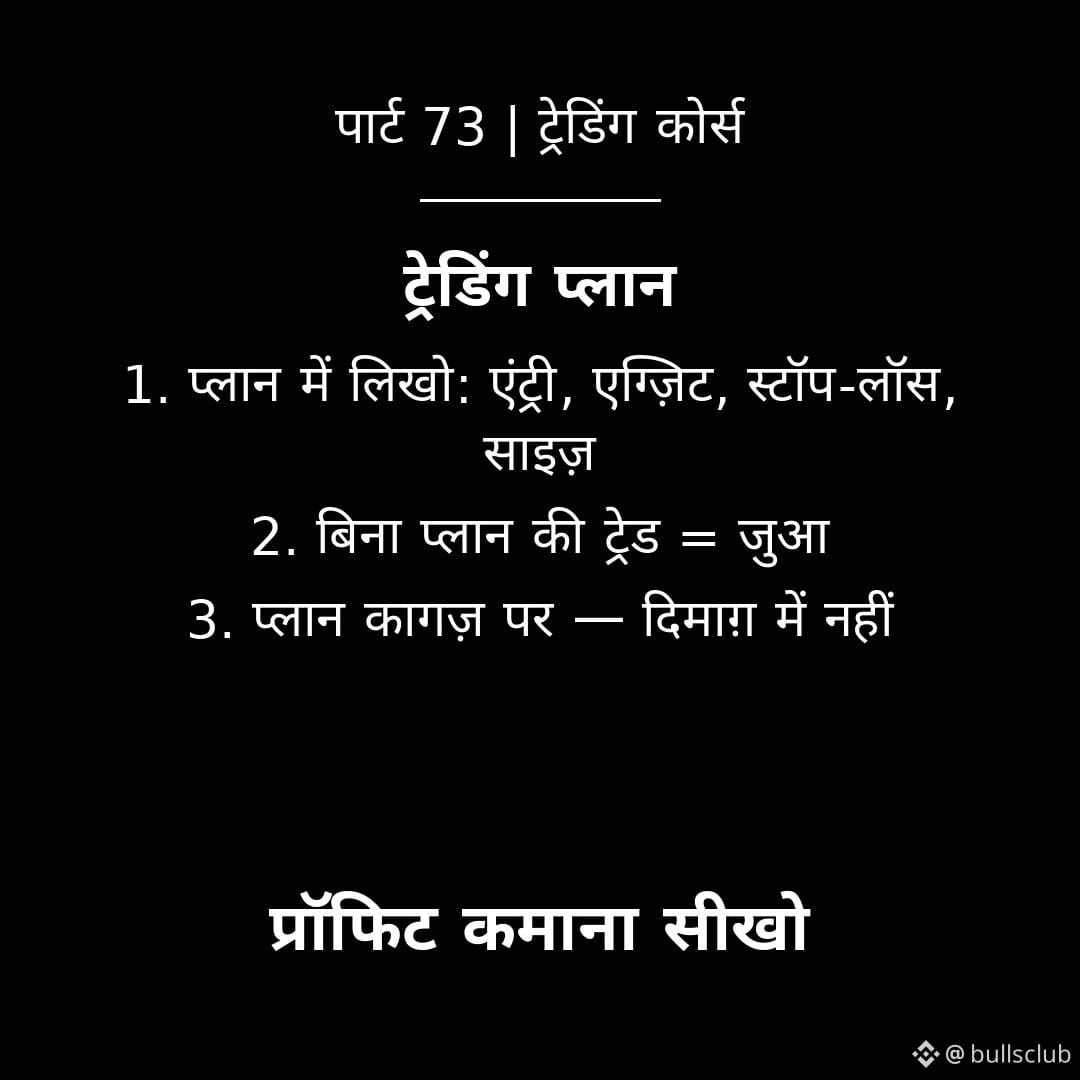
Part 73 | Trading Plan
Write down your trading plan—where to enter, where to exit, how much to risk on a stop-loss, and what position size to take. Trading without a plan is gambling, no matter how good the chart looks. Your plan should be on paper, not just in your head.
How to create one:
1. Write your setup in one paragraph
2. Tick off your checklist before every trade
3. Review your plan each week
Remember: What you write down, you follow through on—a plan kept in your head gets swept away by emotions.
Follow 👇
#DayTrading #SwingTrading #Crypto $BNB
Part 73 | Trading Plan
Write down your trading plan—where to enter, where to exit, how much to risk on a stop-loss, and what position size to take. Trading without a plan is gambling, no matter how good the chart looks. Your plan should be on paper, not just in your head.
How to create one:
1. Write your setup in one paragraph
2. Tick off your checklist before every trade
3. Review your plan each week
Remember: What you write down, you follow through on—a plan kept in your head gets swept away by emotions.
Follow 👇
#DayTrading #SwingTrading #Crypto $BNB
Write down your trading plan—where to enter, where to exit, how much to risk on a stop-loss, and what position size to take. Trading without a plan is gambling, no matter how good the chart looks. Your plan should be on paper, not just in your head.
How to create one:
1. Write your setup in one paragraph
2. Tick off your checklist before every trade
3. Review your plan each week
Remember: What you write down, you follow through on—a plan kept in your head gets swept away by emotions.
Follow 👇
#DayTrading #SwingTrading #Crypto $BNB
10
·
--
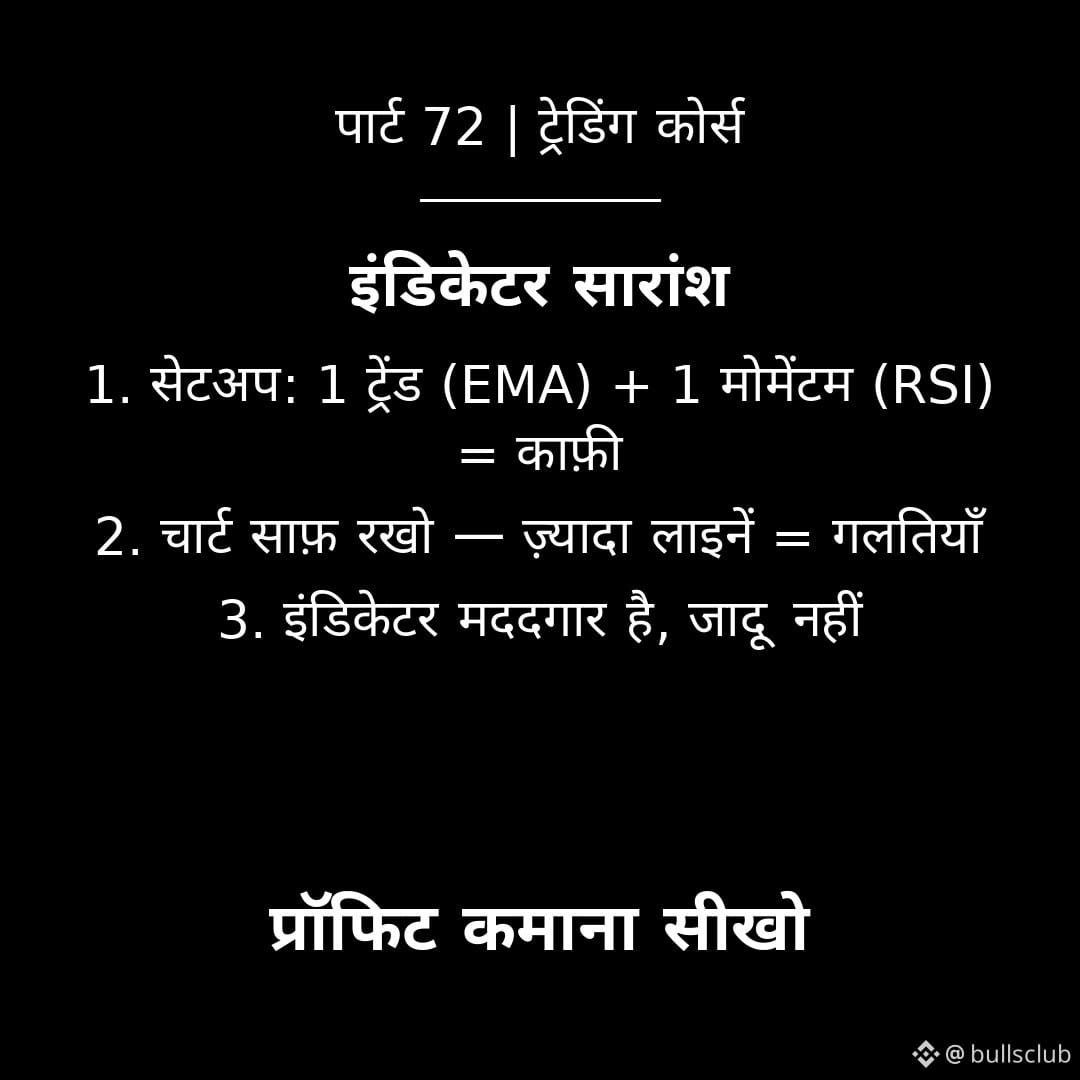
Part 72 | Indicator Summary
The takeaway from the indicator series: 1 trend indicator (EMA) + 1 momentum indicator (RSI) = enough for most traders. Keep your chart clean — more lines mean more confusion and more mistakes.
Review:
1. A simple setup = clear decisions
2. An indicator is helpful, not magic
3. A stop-loss is essential for every signal
Remember: Pro charts look empty — because decisions are made with your mind, not with lines.
Follow 👇
#TradingView #Indicators #RSI $BTC
Part 72 | Indicator Summary
The takeaway from the indicator series: 1 trend indicator (EMA) + 1 momentum indicator (RSI) = enough for most traders. Keep your chart clean — more lines mean more confusion and more mistakes.
Review:
1. A simple setup = clear decisions
2. An indicator is helpful, not magic
3. A stop-loss is essential for every signal
Remember: Pro charts look empty — because decisions are made with your mind, not with lines.
Follow 👇
#TradingView #Indicators #RSI $BTC
The takeaway from the indicator series: 1 trend indicator (EMA) + 1 momentum indicator (RSI) = enough for most traders. Keep your chart clean — more lines mean more confusion and more mistakes.
Review:
1. A simple setup = clear decisions
2. An indicator is helpful, not magic
3. A stop-loss is essential for every signal
Remember: Pro charts look empty — because decisions are made with your mind, not with lines.
Follow 👇
#TradingView #Indicators #RSI $BTC
9
·
--
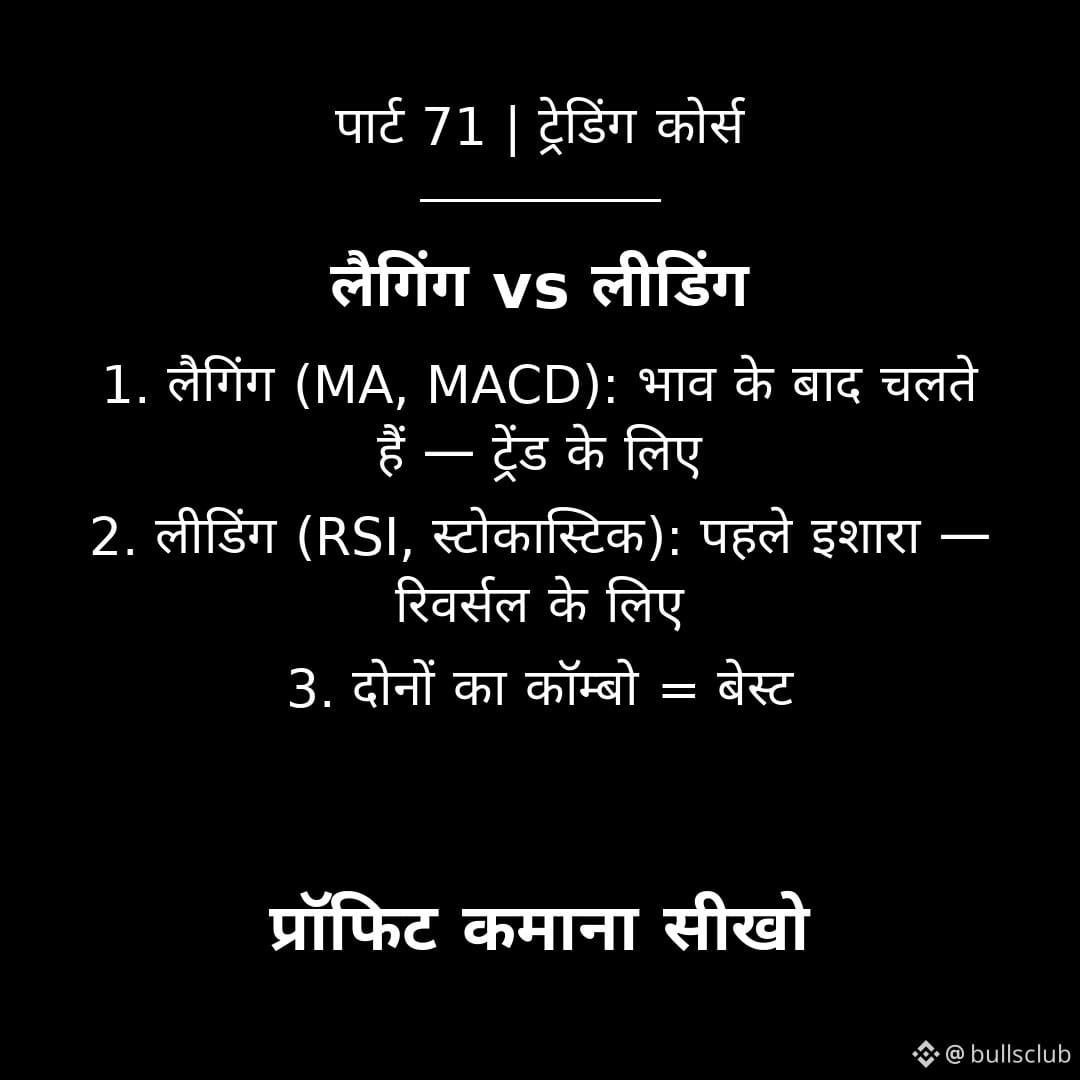
Part 71 | Lagging vs. Leading Indicators
Lagging indicators (MA, MACD) follow price movements—they’re best for confirming trends. Leading indicators (RSI, Stochastic) give an early signal—they’re useful for spotting reversals. Both have their place, and both have their limitations.
How to understand them:
1. Want to know the trend direction? Look at lagging indicators.
2. Want to anticipate a reversal? Look at leading indicators.
3. A combination of one lagging and one leading indicator is the most balanced.
Remember: no indicator predicts the future—they’re all just different lenses through which to view price.
Follow 👇
#MACD #TechnicalAnalysis #TradingView $ETH
Part 71 | Lagging vs. Leading Indicators
Lagging indicators (MA, MACD) follow price movements—they’re best for confirming trends. Leading indicators (RSI, Stochastic) give an early signal—they’re useful for spotting reversals. Both have their place, and both have their limitations.
How to understand them:
1. Want to know the trend direction? Look at lagging indicators.
2. Want to anticipate a reversal? Look at leading indicators.
3. A combination of one lagging and one leading indicator is the most balanced.
Remember: no indicator predicts the future—they’re all just different lenses through which to view price.
Follow 👇
#MACD #TechnicalAnalysis #TradingView $ETH
Lagging indicators (MA, MACD) follow price movements—they’re best for confirming trends. Leading indicators (RSI, Stochastic) give an early signal—they’re useful for spotting reversals. Both have their place, and both have their limitations.
How to understand them:
1. Want to know the trend direction? Look at lagging indicators.
2. Want to anticipate a reversal? Look at leading indicators.
3. A combination of one lagging and one leading indicator is the most balanced.
Remember: no indicator predicts the future—they’re all just different lenses through which to view price.
Follow 👇
#MACD #TechnicalAnalysis #TradingView $ETH
1
·
--
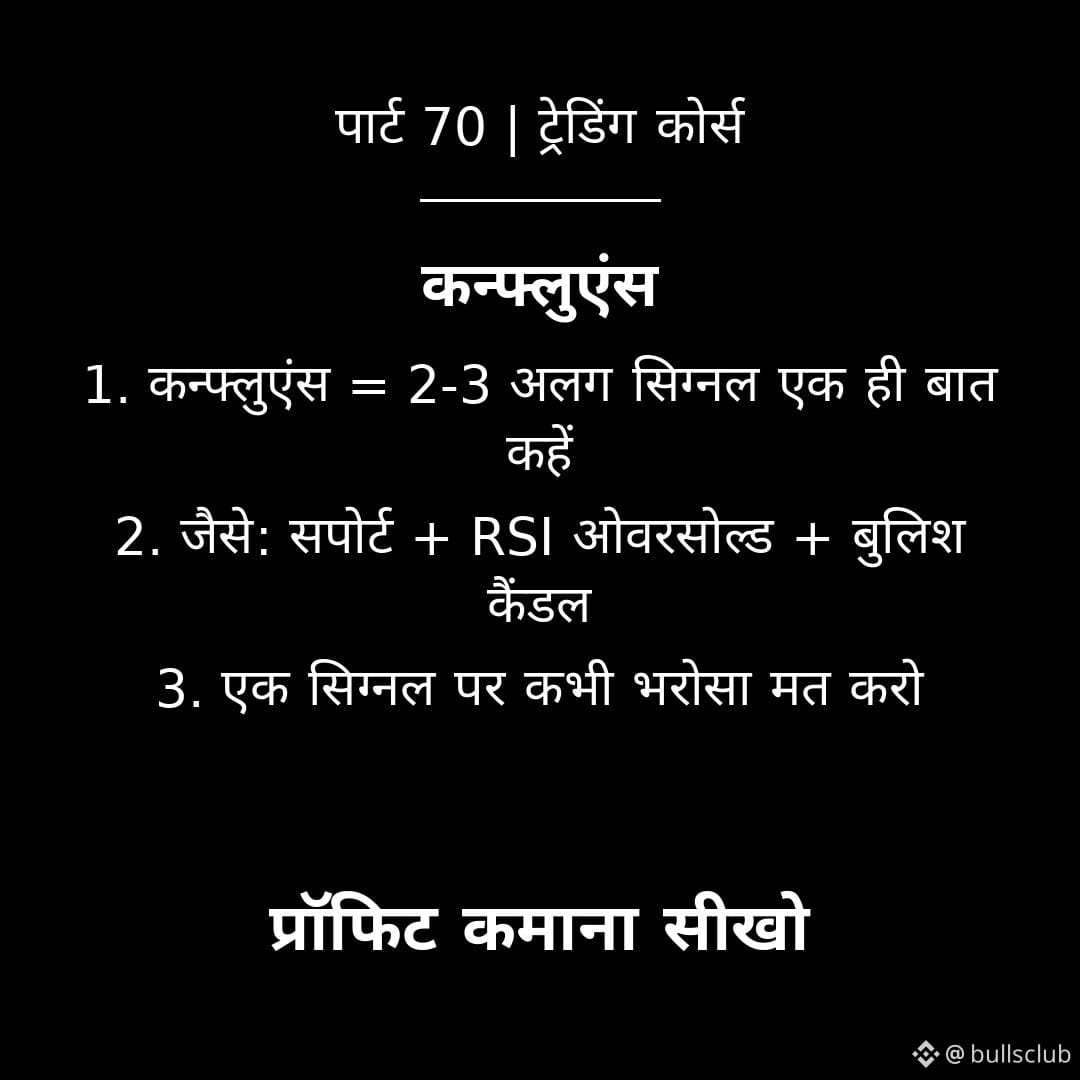
Part 70 | Confluence
Confluence means 2–3 different signals are saying the same thing — like a support level + RSI oversold + a bullish candle. Relying on one signal is gambling; trading confluence is a system.
How to build it:
1. Level (support/resistance) + indicator (RSI/MACD) + candlestick pattern
2. Enter only when all three point in the same direction
3. The stronger the confluence, the larger the position size (within limits)
Remember: one witness isn’t enough to make a decision — you need three witnesses.
Follow 👇
#Indicators #RSI #MACD #TechnicalAnalysis $BTC
Part 70 | Confluence
Confluence means 2–3 different signals are saying the same thing — like a support level + RSI oversold + a bullish candle. Relying on one signal is gambling; trading confluence is a system.
How to build it:
1. Level (support/resistance) + indicator (RSI/MACD) + candlestick pattern
2. Enter only when all three point in the same direction
3. The stronger the confluence, the larger the position size (within limits)
Remember: one witness isn’t enough to make a decision — you need three witnesses.
Follow 👇
#Indicators #RSI #MACD #TechnicalAnalysis $BTC
Confluence means 2–3 different signals are saying the same thing — like a support level + RSI oversold + a bullish candle. Relying on one signal is gambling; trading confluence is a system.
How to build it:
1. Level (support/resistance) + indicator (RSI/MACD) + candlestick pattern
2. Enter only when all three point in the same direction
3. The stronger the confluence, the larger the position size (within limits)
Remember: one witness isn’t enough to make a decision — you need three witnesses.
Follow 👇
#Indicators #RSI #MACD #TechnicalAnalysis $BTC
5
·
--
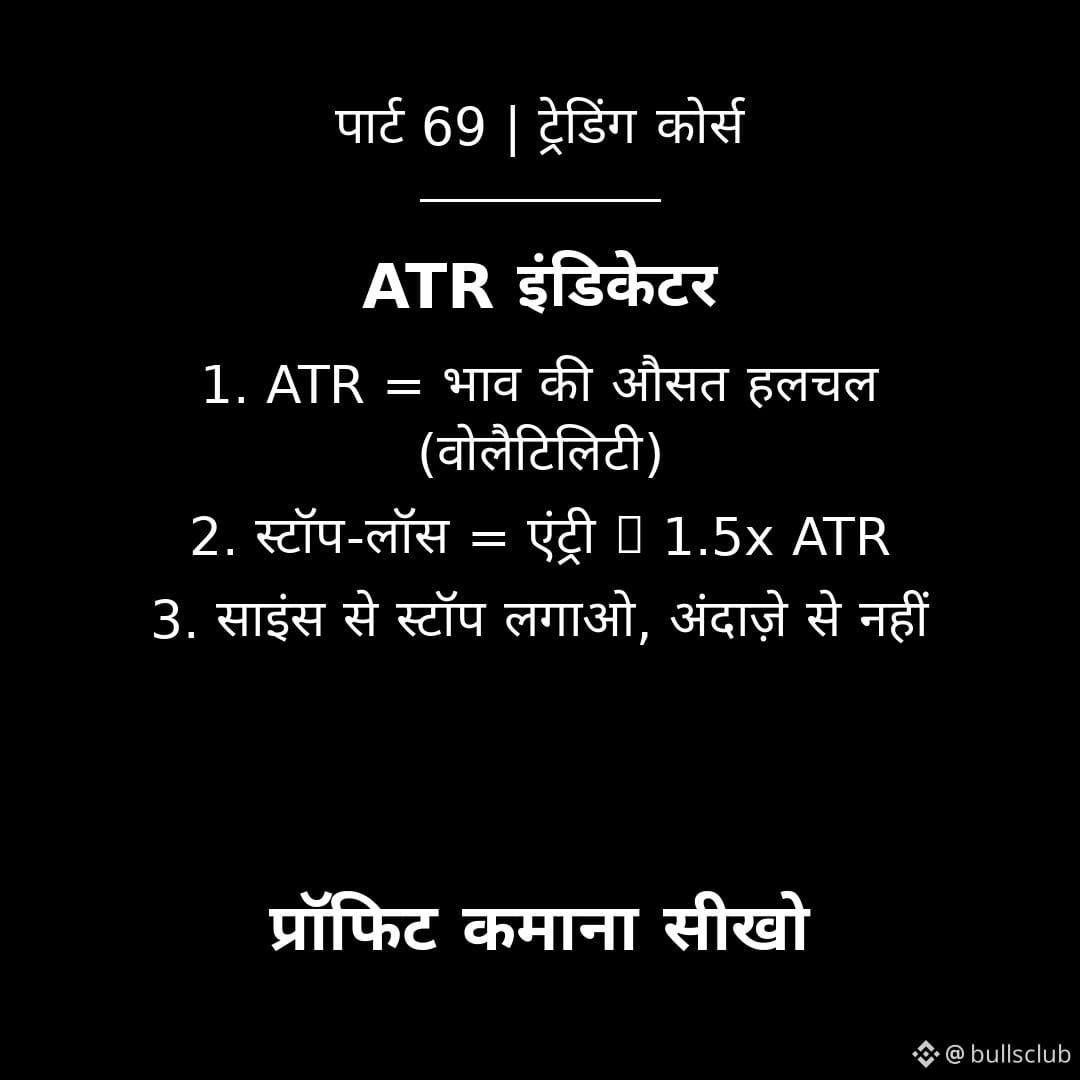
Part 69 | ATR Indicator
ATR stands for Average True Range—it shows how much the price moves on average. It’s best used for setting stop-losses: Stop = Entry ± 1.5 × ATR. This way, you set your stop based on science, not guesswork.
How to use it:
1. Calculate the ATR; 1.5 × ATR = stop distance
2. Higher ATR = wider stop = smaller position
3. Lower ATR = a tighter stop may work
Remember: A stop set by guesswork either gets hit too soon or is unnecessarily far away.
Follow 👇
#TechnicalAnalysis #TradingView #Indicators $ETH
Part 69 | ATR Indicator
ATR stands for Average True Range—it shows how much the price moves on average. It’s best used for setting stop-losses: Stop = Entry ± 1.5 × ATR. This way, you set your stop based on science, not guesswork.
How to use it:
1. Calculate the ATR; 1.5 × ATR = stop distance
2. Higher ATR = wider stop = smaller position
3. Lower ATR = a tighter stop may work
Remember: A stop set by guesswork either gets hit too soon or is unnecessarily far away.
Follow 👇
#TechnicalAnalysis #TradingView #Indicators $ETH
ATR stands for Average True Range—it shows how much the price moves on average. It’s best used for setting stop-losses: Stop = Entry ± 1.5 × ATR. This way, you set your stop based on science, not guesswork.
How to use it:
1. Calculate the ATR; 1.5 × ATR = stop distance
2. Higher ATR = wider stop = smaller position
3. Lower ATR = a tighter stop may work
Remember: A stop set by guesswork either gets hit too soon or is unnecessarily far away.
Follow 👇
#TechnicalAnalysis #TradingView #Indicators $ETH
2
·
--
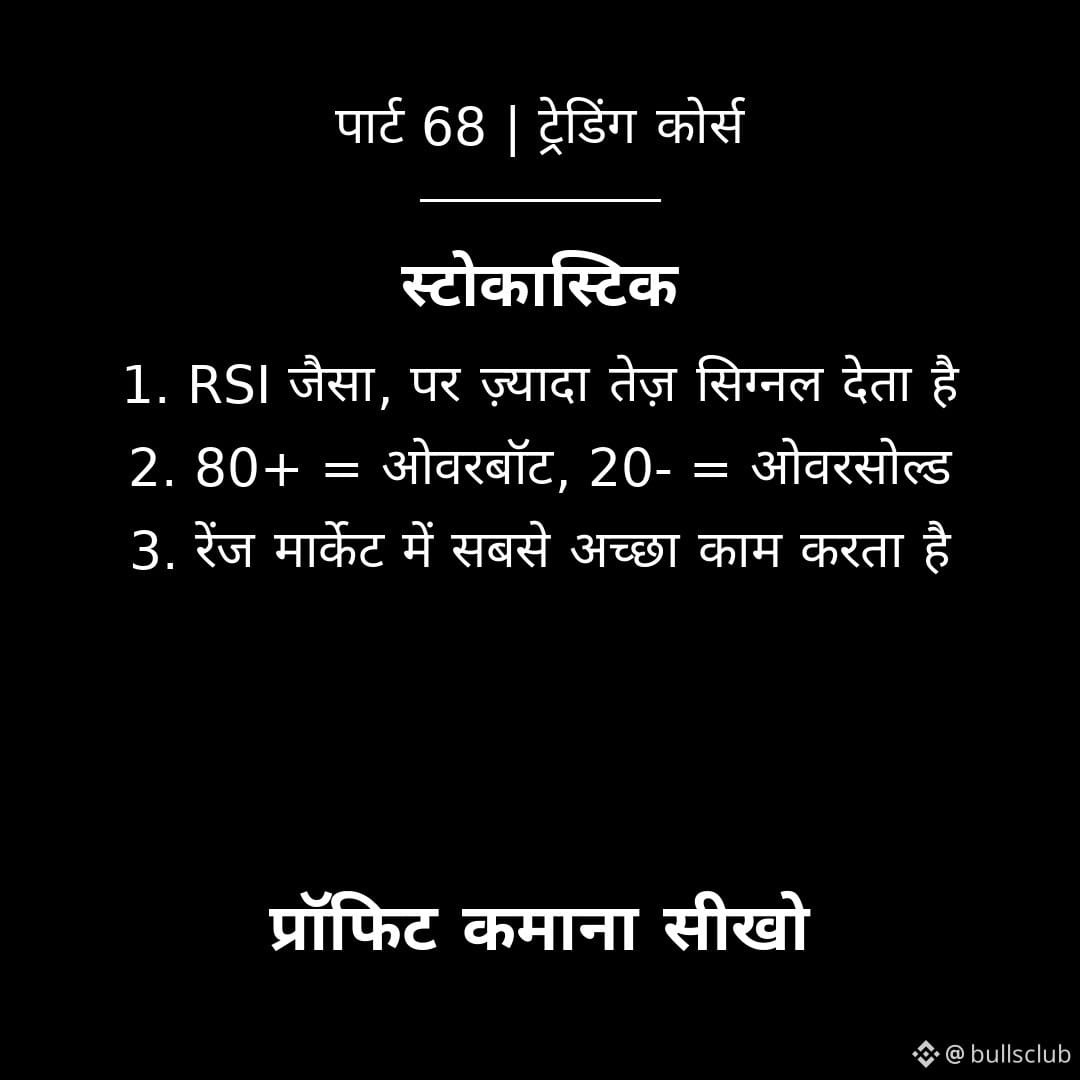
Part 68 | Stochastic
Stochastic is a momentum indicator like RSI, but it gives faster signals. Above 80 is overbought; below 20 is oversold. It works best in range-bound markets and can give false signals in trending markets.
How to use it:
1. Near the lower end of the range + Stochastic oversold = look for a buy
2. Near the upper end + overbought = look for a sell
3. A crossover of the two lines = a timing signal
Remember: a faster indicator = more noise — always use it alongside the trend.
Follow 👇
#RSI #MACD #TechnicalAnalysis $BTC
Part 68 | Stochastic
Stochastic is a momentum indicator like RSI, but it gives faster signals. Above 80 is overbought; below 20 is oversold. It works best in range-bound markets and can give false signals in trending markets.
How to use it:
1. Near the lower end of the range + Stochastic oversold = look for a buy
2. Near the upper end + overbought = look for a sell
3. A crossover of the two lines = a timing signal
Remember: a faster indicator = more noise — always use it alongside the trend.
Follow 👇
#RSI #MACD #TechnicalAnalysis $BTC
Stochastic is a momentum indicator like RSI, but it gives faster signals. Above 80 is overbought; below 20 is oversold. It works best in range-bound markets and can give false signals in trending markets.
How to use it:
1. Near the lower end of the range + Stochastic oversold = look for a buy
2. Near the upper end + overbought = look for a sell
3. A crossover of the two lines = a timing signal
Remember: a faster indicator = more noise — always use it alongside the trend.
Follow 👇
#RSI #MACD #TechnicalAnalysis $BTC
2
·
--
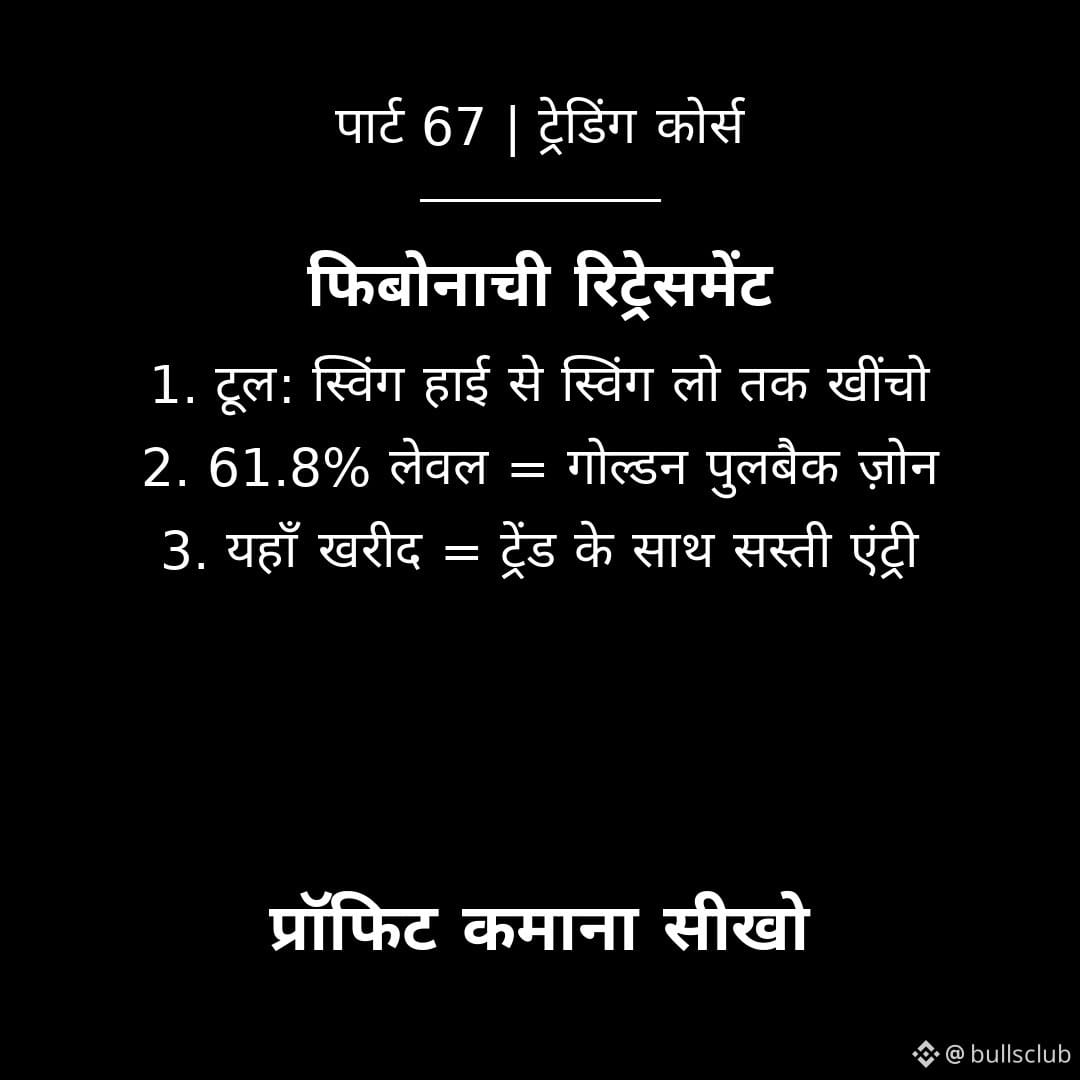
Part 67 | Fibonacci Retracement
Draw the Fibonacci tool from the swing high to the swing low—it shows where a pullback might stop. The 61.8% level is called the Golden Zone, where price often reverses in the direction of the trend.
How to use it:
1. In an uptrend, the 50–61.8% zone = buying opportunity
2. A bullish candle at the zone = confirmation
3. Place the stop-loss below 78.6%
Remember: Fibonacci levels indicate probabilities, not walls—don't jump in without confirmation.
Follow 👇
#TradingView #Indicators #RSI $ETH
Part 67 | Fibonacci Retracement
Draw the Fibonacci tool from the swing high to the swing low—it shows where a pullback might stop. The 61.8% level is called the Golden Zone, where price often reverses in the direction of the trend.
How to use it:
1. In an uptrend, the 50–61.8% zone = buying opportunity
2. A bullish candle at the zone = confirmation
3. Place the stop-loss below 78.6%
Remember: Fibonacci levels indicate probabilities, not walls—don't jump in without confirmation.
Follow 👇
#TradingView #Indicators #RSI $ETH
Draw the Fibonacci tool from the swing high to the swing low—it shows where a pullback might stop. The 61.8% level is called the Golden Zone, where price often reverses in the direction of the trend.
How to use it:
1. In an uptrend, the 50–61.8% zone = buying opportunity
2. A bullish candle at the zone = confirmation
3. Place the stop-loss below 78.6%
Remember: Fibonacci levels indicate probabilities, not walls—don't jump in without confirmation.
Follow 👇
#TradingView #Indicators #RSI $ETH
10
·
--
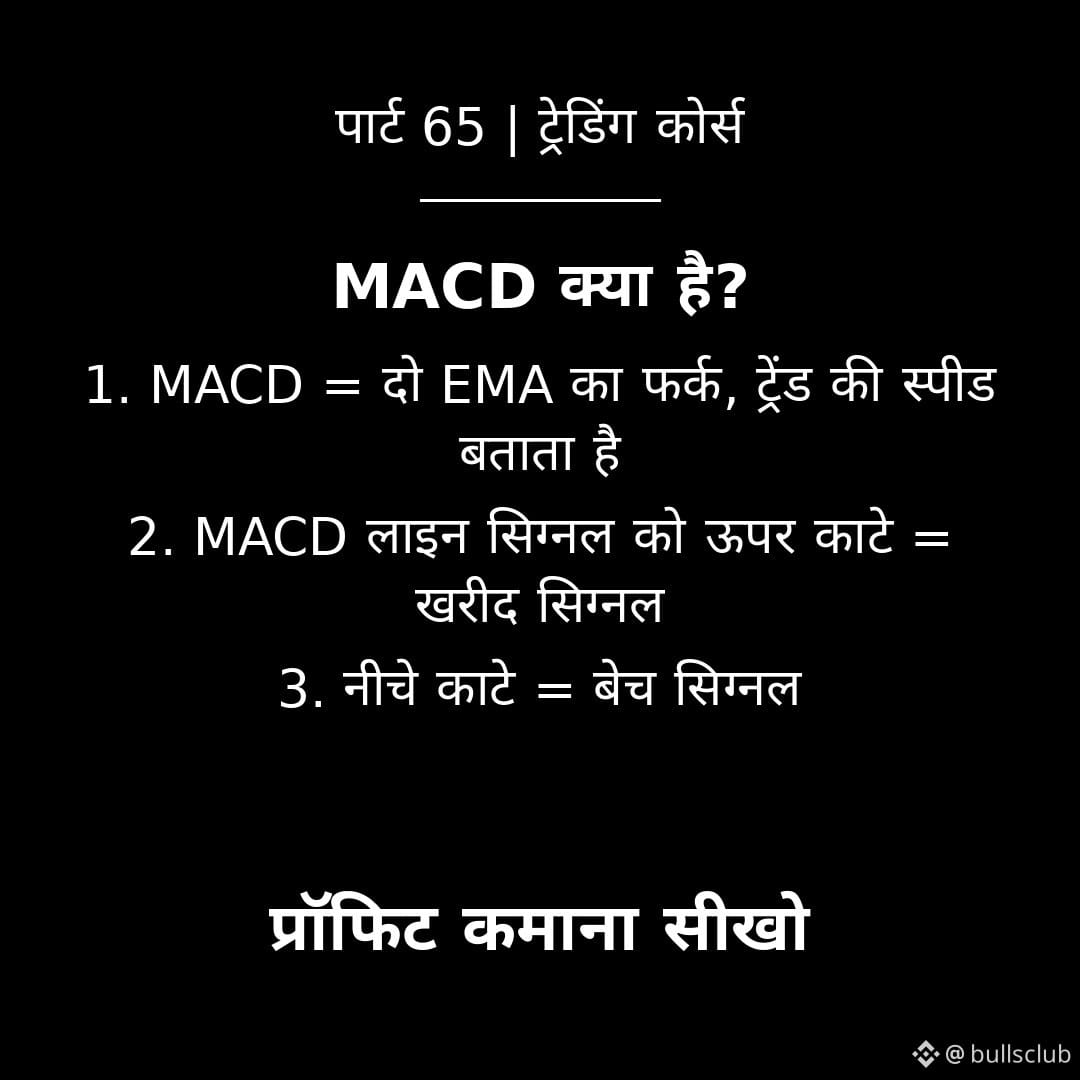
Part 65 | What is MACD?
MACD shows the speed and direction of a trend based on the difference between two EMAs. When the MACD line crosses above the signal line, it’s a buy signal. When it crosses below, it’s a sell signal. The histogram bars show the strength of momentum.
How to use it:
1. Crossover above = a possible start of an uptrend
2. Crossover below = a possible start of a downtrend
3. Signals above the zero line are more reliable
Remember: MACD works best in trending markets and gives false signals in ranging markets.
Follow 👇
#Indicators #RSI #MACD #TechnicalAnalysis $ETH
Part 65 | What is MACD?
MACD shows the speed and direction of a trend based on the difference between two EMAs. When the MACD line crosses above the signal line, it’s a buy signal. When it crosses below, it’s a sell signal. The histogram bars show the strength of momentum.
How to use it:
1. Crossover above = a possible start of an uptrend
2. Crossover below = a possible start of a downtrend
3. Signals above the zero line are more reliable
Remember: MACD works best in trending markets and gives false signals in ranging markets.
Follow 👇
#Indicators #RSI #MACD #TechnicalAnalysis $ETH
MACD shows the speed and direction of a trend based on the difference between two EMAs. When the MACD line crosses above the signal line, it’s a buy signal. When it crosses below, it’s a sell signal. The histogram bars show the strength of momentum.
How to use it:
1. Crossover above = a possible start of an uptrend
2. Crossover below = a possible start of a downtrend
3. Signals above the zero line are more reliable
Remember: MACD works best in trending markets and gives false signals in ranging markets.
Follow 👇
#Indicators #RSI #MACD #TechnicalAnalysis $ETH
30
·
--
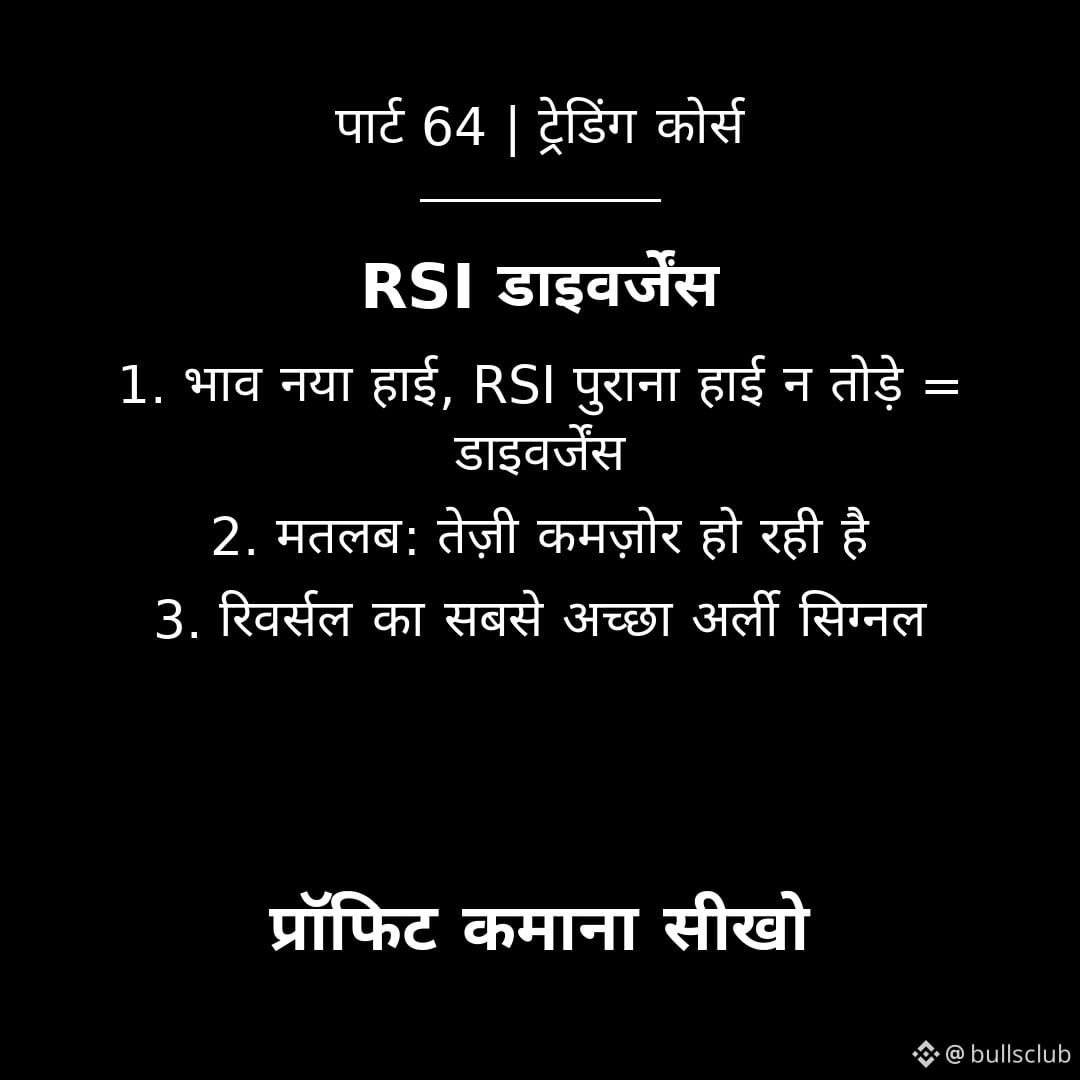
Part 64 | RSI Divergence
Divergence means the price is making a new high, but the RSI is unable to break its previous high — meaning the upward momentum is weakening from within. This is one of the best early warning signals of a reversal and a favorite among pro traders.
How to identify it:
1. Price up, RSI down = Bearish divergence (a decline may follow)
2. Price down, RSI up = Bullish divergence (a reversal may follow)
3. Divergence on higher timeframes is more reliable
Remember: Divergence is a warning, not an entry signal — confirmation is essential.
Follow 👇
#TechnicalAnalysis #TradingView #Indicators $BTC
Part 64 | RSI Divergence
Divergence means the price is making a new high, but the RSI is unable to break its previous high — meaning the upward momentum is weakening from within. This is one of the best early warning signals of a reversal and a favorite among pro traders.
How to identify it:
1. Price up, RSI down = Bearish divergence (a decline may follow)
2. Price down, RSI up = Bullish divergence (a reversal may follow)
3. Divergence on higher timeframes is more reliable
Remember: Divergence is a warning, not an entry signal — confirmation is essential.
Follow 👇
#TechnicalAnalysis #TradingView #Indicators $BTC
Divergence means the price is making a new high, but the RSI is unable to break its previous high — meaning the upward momentum is weakening from within. This is one of the best early warning signals of a reversal and a favorite among pro traders.
How to identify it:
1. Price up, RSI down = Bearish divergence (a decline may follow)
2. Price down, RSI up = Bullish divergence (a reversal may follow)
3. Divergence on higher timeframes is more reliable
Remember: Divergence is a warning, not an entry signal — confirmation is essential.
Follow 👇
#TechnicalAnalysis #TradingView #Indicators $BTC
35
·
--
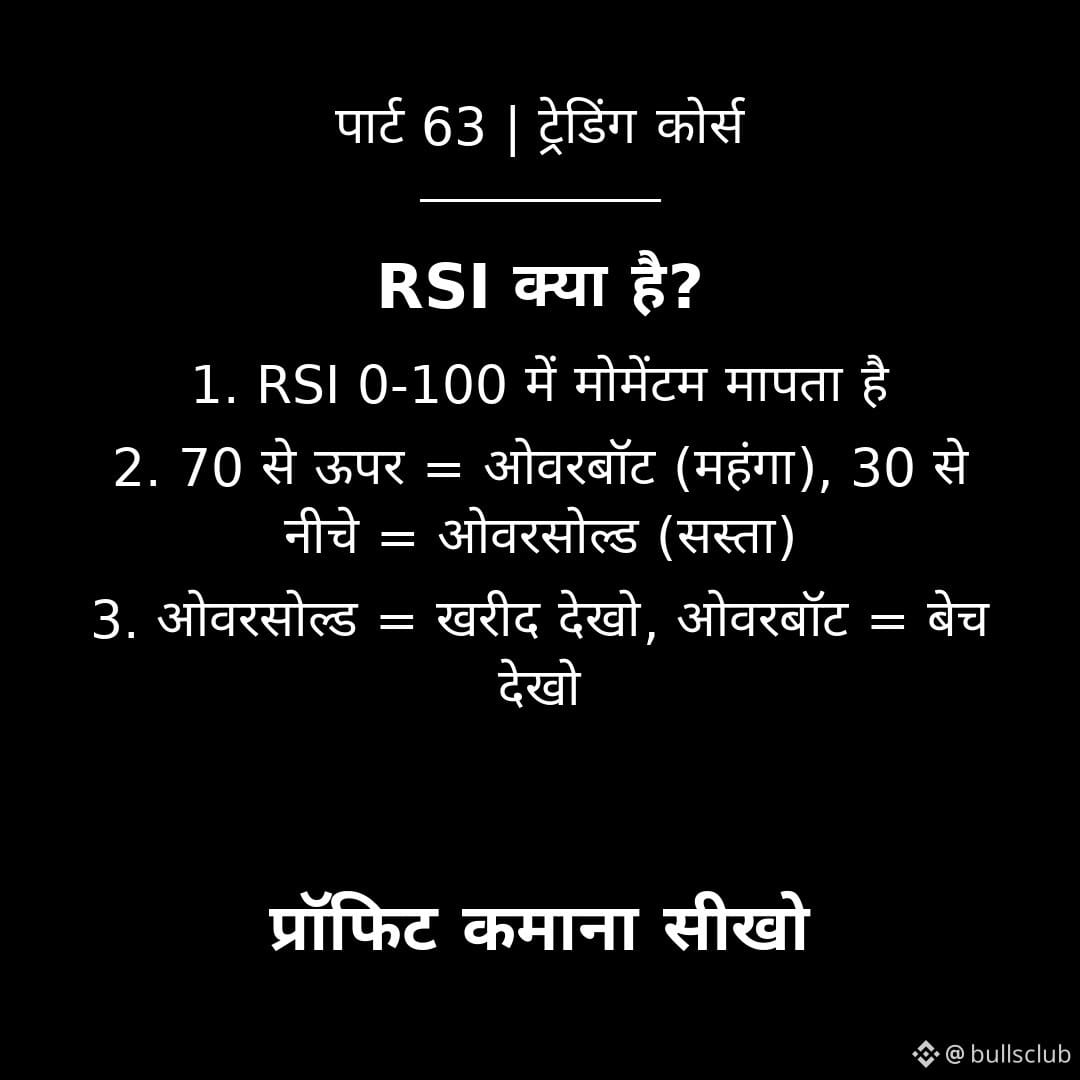
Part 63 | What is RSI?
RSI measures momentum on a scale of 0 to 100. Above 70 means overbought — the price has become expensive, so be cautious. Below 30 means oversold — the price is cheap, so look for a buying opportunity. It’s the most popular tool for spotting reversals.
How to use it:
1. RSI below 30 = watch for a buying zone
2. RSI above 70 = consider booking profits
3. In a strong trend, RSI can stay at extreme levels for a long time
Remember: Don’t trade based on RSI alone — use it alongside the trend.
Follow 👇
#RSI #MACD #TechnicalAnalysis $ETH
Part 63 | What is RSI?
RSI measures momentum on a scale of 0 to 100. Above 70 means overbought — the price has become expensive, so be cautious. Below 30 means oversold — the price is cheap, so look for a buying opportunity. It’s the most popular tool for spotting reversals.
How to use it:
1. RSI below 30 = watch for a buying zone
2. RSI above 70 = consider booking profits
3. In a strong trend, RSI can stay at extreme levels for a long time
Remember: Don’t trade based on RSI alone — use it alongside the trend.
Follow 👇
#RSI #MACD #TechnicalAnalysis $ETH
RSI measures momentum on a scale of 0 to 100. Above 70 means overbought — the price has become expensive, so be cautious. Below 30 means oversold — the price is cheap, so look for a buying opportunity. It’s the most popular tool for spotting reversals.
How to use it:
1. RSI below 30 = watch for a buying zone
2. RSI above 70 = consider booking profits
3. In a strong trend, RSI can stay at extreme levels for a long time
Remember: Don’t trade based on RSI alone — use it alongside the trend.
Follow 👇
#RSI #MACD #TechnicalAnalysis $ETH
54
·
--
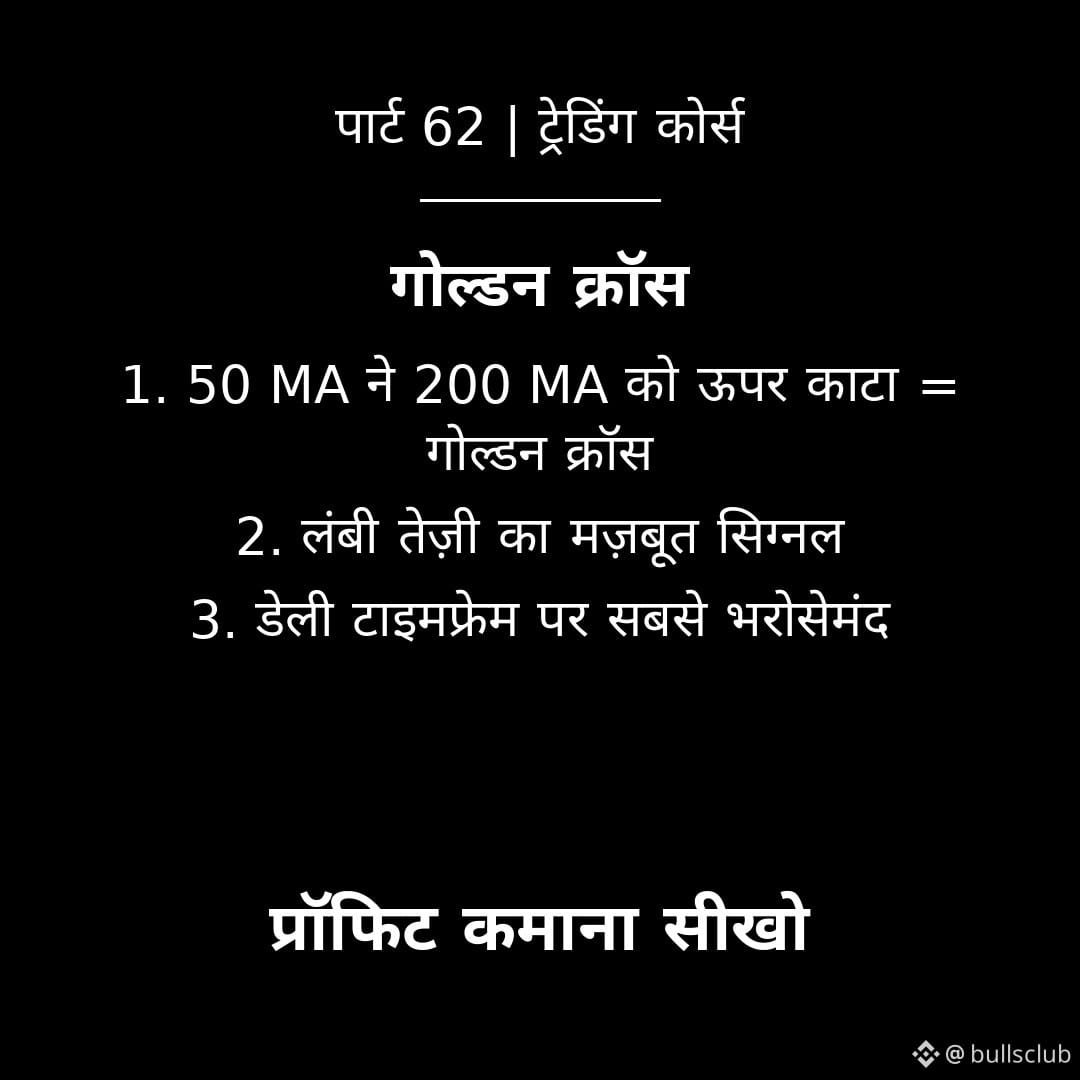
Part 62 | Golden Cross
When the 50-day MA crosses above the 200-day MA, it’s called a Golden Cross. It’s considered one of the strongest signals of a long-term uptrend, especially on the daily timeframe.
How to use it:
1. Look for confirmation of the cross on the daily chart
2. It’s usually better to enter on a pullback after the cross
3. Its opposite (the Death Cross) signals a downtrend
Remember: The Golden Cross is a lagging signal—but a reliable one.
Follow 👇
#TradingView #Indicators #RSI $BTC
Part 62 | Golden Cross
When the 50-day MA crosses above the 200-day MA, it’s called a Golden Cross. It’s considered one of the strongest signals of a long-term uptrend, especially on the daily timeframe.
How to use it:
1. Look for confirmation of the cross on the daily chart
2. It’s usually better to enter on a pullback after the cross
3. Its opposite (the Death Cross) signals a downtrend
Remember: The Golden Cross is a lagging signal—but a reliable one.
Follow 👇
#TradingView #Indicators #RSI $BTC
When the 50-day MA crosses above the 200-day MA, it’s called a Golden Cross. It’s considered one of the strongest signals of a long-term uptrend, especially on the daily timeframe.
How to use it:
1. Look for confirmation of the cross on the daily chart
2. It’s usually better to enter on a pullback after the cross
3. Its opposite (the Death Cross) signals a downtrend
Remember: The Golden Cross is a lagging signal—but a reliable one.
Follow 👇
#TradingView #Indicators #RSI $BTC
69
·
--
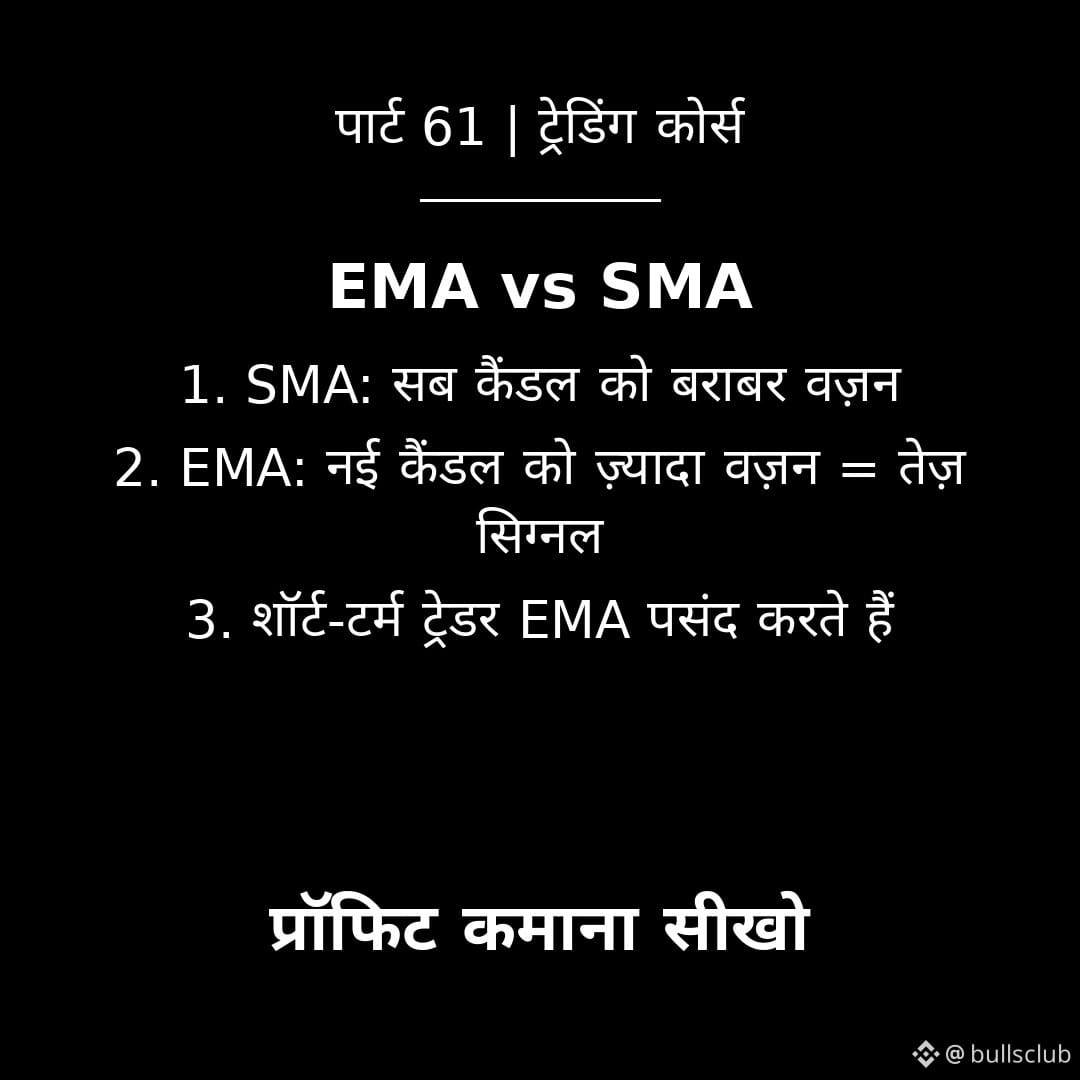
Part 61 | EMA vs SMA
SMA gives all candles equal weight, while EMA gives more weight to newer candles—so EMA reacts faster to price movements. Short-term traders prefer EMA, while long-term investors prefer SMA.
How to choose:
1. Fast trading (day/scalp) = EMA
2. Longer-term outlook (swing) = SMA works too
3. The 20 EMA and 50 EMA combo is the most popular
Remember: no MA is perfect—choose based on your timeframe.
Follow 👇
#MACD #TechnicalAnalysis #TradingView $ETH
Part 61 | EMA vs SMA
SMA gives all candles equal weight, while EMA gives more weight to newer candles—so EMA reacts faster to price movements. Short-term traders prefer EMA, while long-term investors prefer SMA.
How to choose:
1. Fast trading (day/scalp) = EMA
2. Longer-term outlook (swing) = SMA works too
3. The 20 EMA and 50 EMA combo is the most popular
Remember: no MA is perfect—choose based on your timeframe.
Follow 👇
#MACD #TechnicalAnalysis #TradingView $ETH
SMA gives all candles equal weight, while EMA gives more weight to newer candles—so EMA reacts faster to price movements. Short-term traders prefer EMA, while long-term investors prefer SMA.
How to choose:
1. Fast trading (day/scalp) = EMA
2. Longer-term outlook (swing) = SMA works too
3. The 20 EMA and 50 EMA combo is the most popular
Remember: no MA is perfect—choose based on your timeframe.
Follow 👇
#MACD #TechnicalAnalysis #TradingView $ETH
1
77
·
--
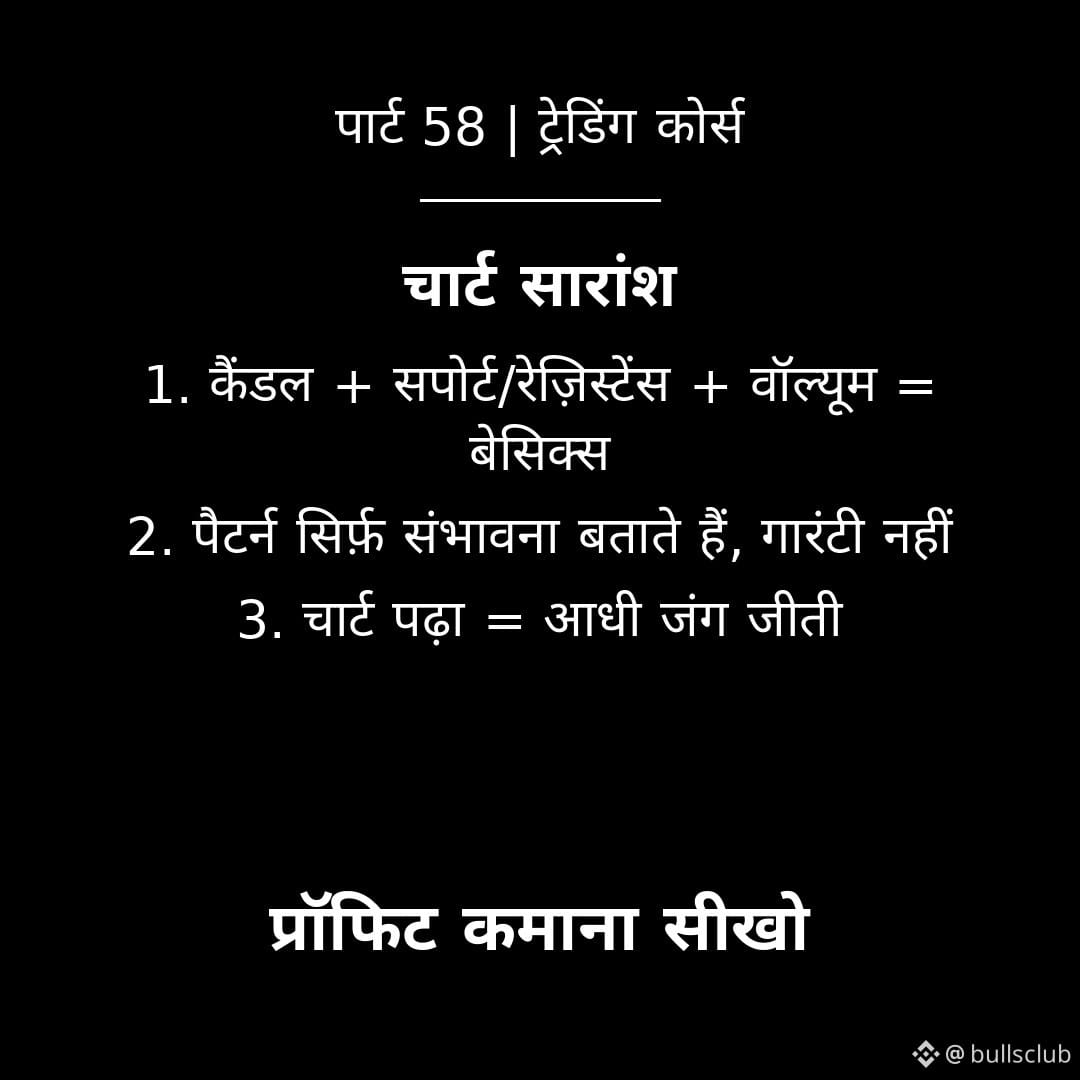
Part 58 | Chart Summary
The takeaway from the chart series: Candles + support/resistance + volume = the foundation of reading charts. Patterns indicate possibilities; they don't guarantee outcomes. If you've learned to read charts, you've won half the battle.
Review:
1. Candles = the language of the market
2. Support/resistance = the battlefronts
3. Volume = the truth behind a move
Remember: A chart isn't a guess; it's a map of probabilities — always use a stop-loss.
Follow 👇
Part 58 | Chart Summary
The takeaway from the chart series: Candles + support/resistance + volume = the foundation of reading charts. Patterns indicate possibilities; they don't guarantee outcomes. If you've learned to read charts, you've won half the battle.
Review:
1. Candles = the language of the market
2. Support/resistance = the battlefronts
3. Volume = the truth behind a move
Remember: A chart isn't a guess; it's a map of probabilities — always use a stop-loss.
Follow 👇
The takeaway from the chart series: Candles + support/resistance + volume = the foundation of reading charts. Patterns indicate possibilities; they don't guarantee outcomes. If you've learned to read charts, you've won half the battle.
Review:
1. Candles = the language of the market
2. Support/resistance = the battlefronts
3. Volume = the truth behind a move
Remember: A chart isn't a guess; it's a map of probabilities — always use a stop-loss.
Follow 👇
11
·
--
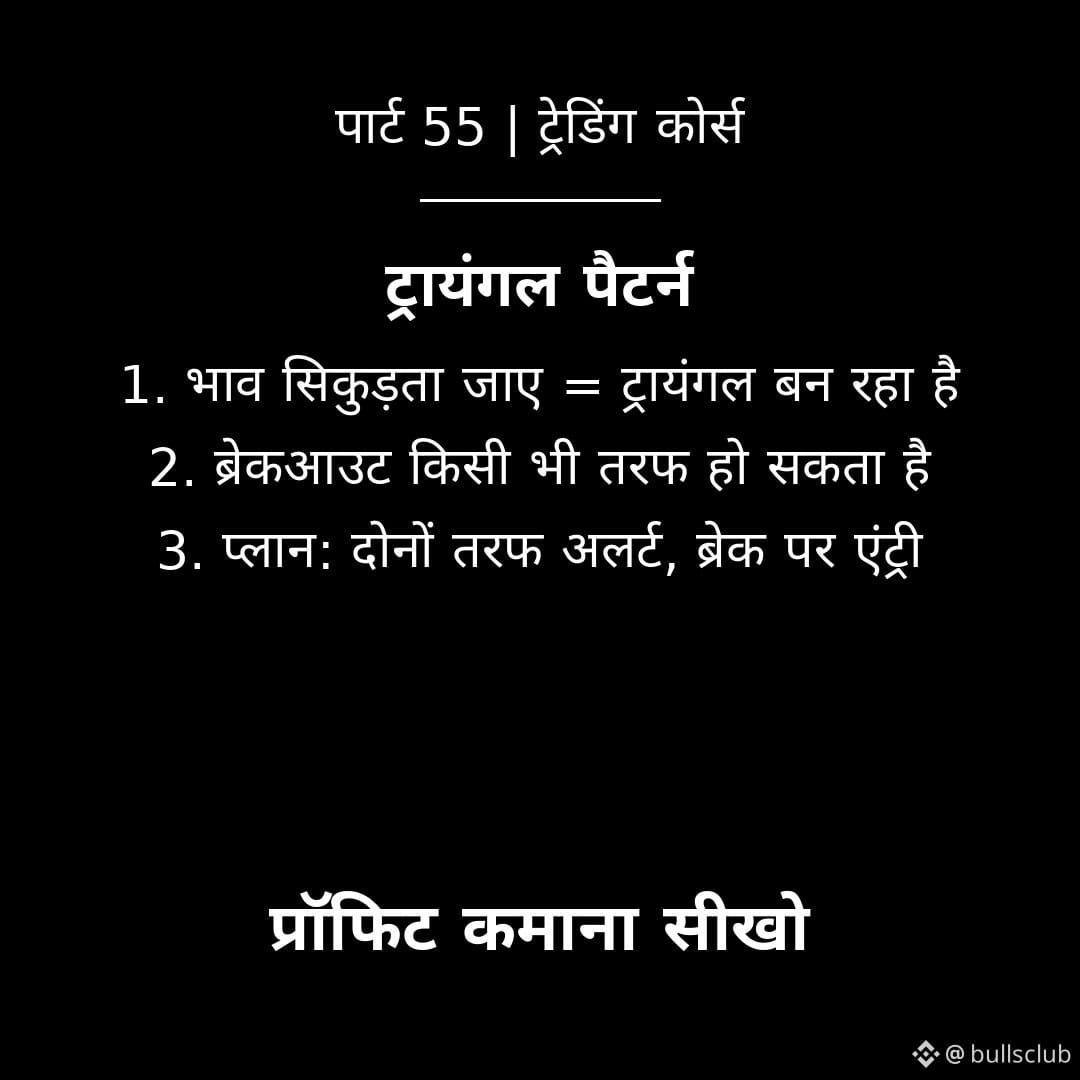
Part 55 | Triangle Pattern
In a triangle, price gradually contracts — highs get lower, and lows get higher. This means a big move is coming, but it could go in either direction. A savvy trader prepares for both possibilities in advance.
How to trade:
1. Set alerts at both edges of the triangle
2. Enter in the direction of the breakout when it’s accompanied by volume
3. Don’t jump in by guessing before the breakout
Remember: contracting price = a powder keg; the spark could come from either side.
Follow 👇
Part 55 | Triangle Pattern
In a triangle, price gradually contracts — highs get lower, and lows get higher. This means a big move is coming, but it could go in either direction. A savvy trader prepares for both possibilities in advance.
How to trade:
1. Set alerts at both edges of the triangle
2. Enter in the direction of the breakout when it’s accompanied by volume
3. Don’t jump in by guessing before the breakout
Remember: contracting price = a powder keg; the spark could come from either side.
Follow 👇
In a triangle, price gradually contracts — highs get lower, and lows get higher. This means a big move is coming, but it could go in either direction. A savvy trader prepares for both possibilities in advance.
How to trade:
1. Set alerts at both edges of the triangle
2. Enter in the direction of the breakout when it’s accompanied by volume
3. Don’t jump in by guessing before the breakout
Remember: contracting price = a powder keg; the spark could come from either side.
Follow 👇
5
·
--
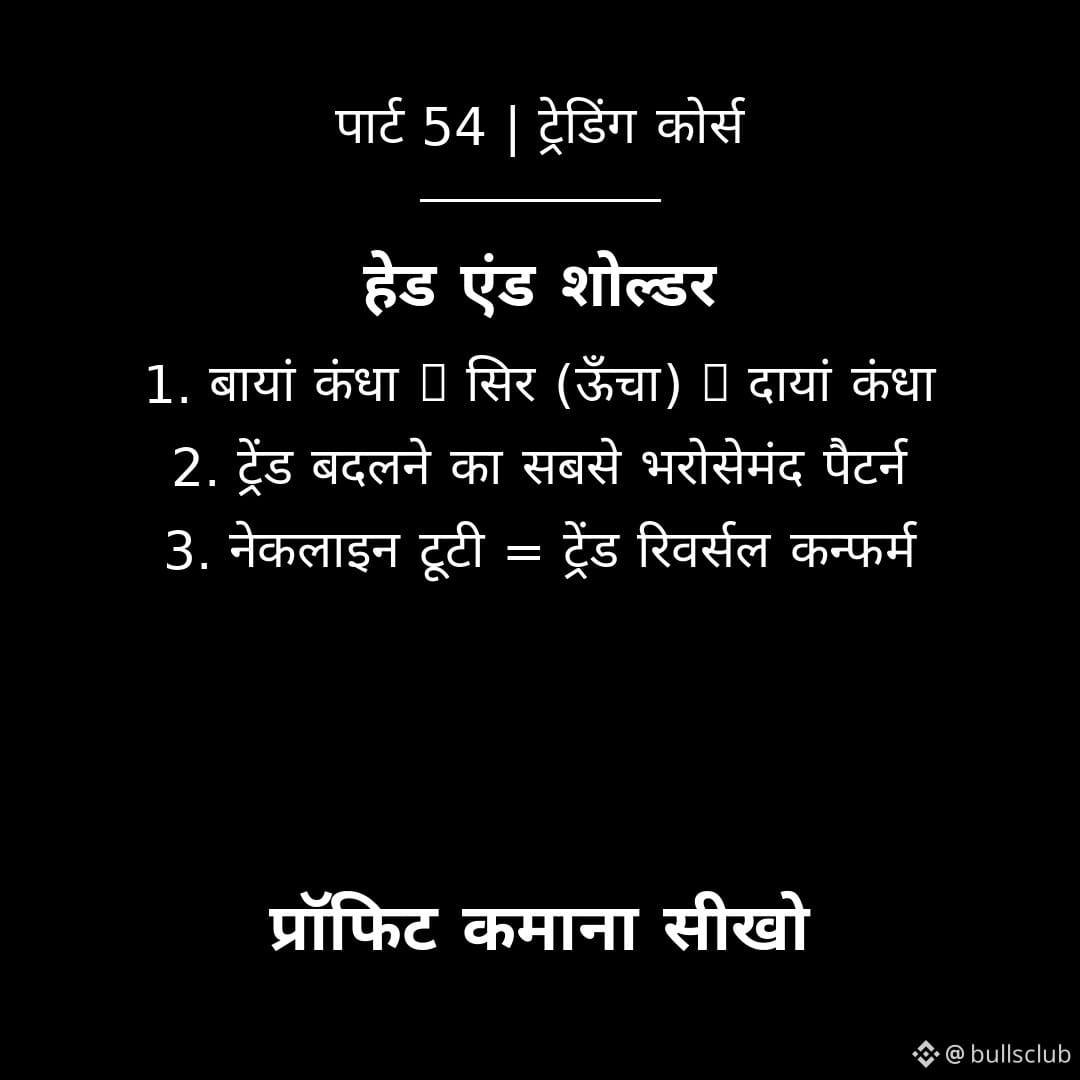
Part 54 | Head and Shoulders
The Head and Shoulders pattern forms three peaks — the left shoulder, the higher head, and the right shoulder. It is considered one of the most reliable trend reversal patterns. When the neckline breaks, it confirms the end of the uptrend.
How to trade:
1. The right shoulder forms lower than the head = weakness
2. The neckline breaks = trend reversal confirmed
3. Enter on a retest of the neckline, with a stop above the right shoulder
Remember: Don’t trade an incomplete pattern — let it fully form.
Follow 👇
Part 54 | Head and Shoulders
The Head and Shoulders pattern forms three peaks — the left shoulder, the higher head, and the right shoulder. It is considered one of the most reliable trend reversal patterns. When the neckline breaks, it confirms the end of the uptrend.
How to trade:
1. The right shoulder forms lower than the head = weakness
2. The neckline breaks = trend reversal confirmed
3. Enter on a retest of the neckline, with a stop above the right shoulder
Remember: Don’t trade an incomplete pattern — let it fully form.
Follow 👇
The Head and Shoulders pattern forms three peaks — the left shoulder, the higher head, and the right shoulder. It is considered one of the most reliable trend reversal patterns. When the neckline breaks, it confirms the end of the uptrend.
How to trade:
1. The right shoulder forms lower than the head = weakness
2. The neckline breaks = trend reversal confirmed
3. Enter on a retest of the neckline, with a stop above the right shoulder
Remember: Don’t trade an incomplete pattern — let it fully form.
Follow 👇
2
·
--
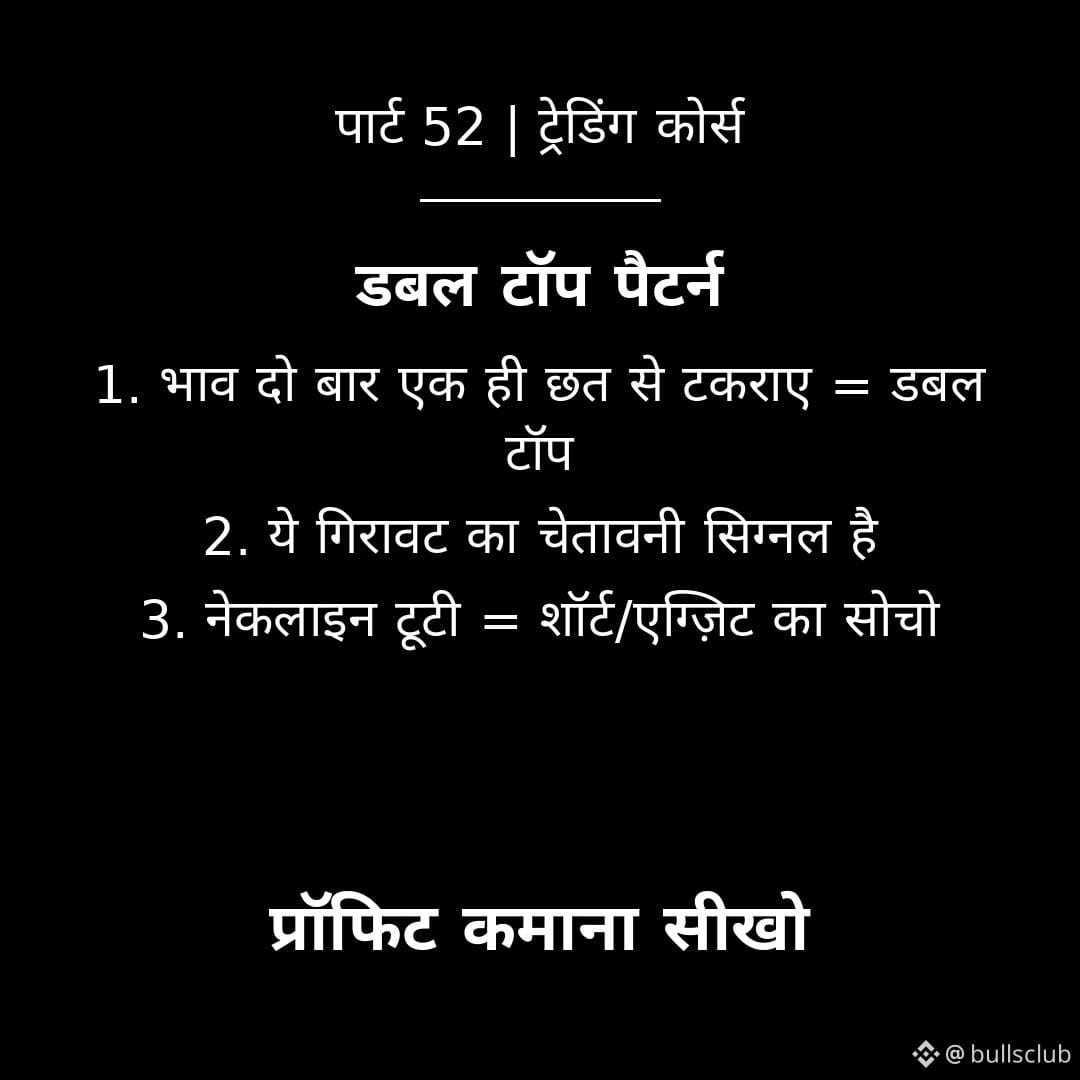
Part 52 | Double Top Pattern
In a double top, the price hits the same ceiling twice and falls—like knocking on a door twice and turning back. This is a warning signal of a possible decline. The pattern is confirmed when the neckline in the middle breaks.
How to trade:
1. Rejection at the ceiling for the second time = a sign to be cautious
2. Neckline breaks = consider going short or exiting
3. Target = below the neckline by the height of the pattern
Remember: a pattern indicates probability, not certainty—always use a stop-loss.
Follow 👇
Part 52 | Double Top Pattern
In a double top, the price hits the same ceiling twice and falls—like knocking on a door twice and turning back. This is a warning signal of a possible decline. The pattern is confirmed when the neckline in the middle breaks.
How to trade:
1. Rejection at the ceiling for the second time = a sign to be cautious
2. Neckline breaks = consider going short or exiting
3. Target = below the neckline by the height of the pattern
Remember: a pattern indicates probability, not certainty—always use a stop-loss.
Follow 👇
In a double top, the price hits the same ceiling twice and falls—like knocking on a door twice and turning back. This is a warning signal of a possible decline. The pattern is confirmed when the neckline in the middle breaks.
How to trade:
1. Rejection at the ceiling for the second time = a sign to be cautious
2. Neckline breaks = consider going short or exiting
3. Target = below the neckline by the height of the pattern
Remember: a pattern indicates probability, not certainty—always use a stop-loss.
Follow 👇
3
Log in to explore more content
Join global crypto users on Binance Square
⚡️ Get latest and useful information about crypto.
💬 Trusted by the world’s largest crypto exchange.
👍 Discover real insights from verified creators.
Email / Phone number
Trending Topics
WhatWillDriveCryptoandStocks’NextRebound?
51 views
19 Discussing
Bitcoin Slips Below $70,000 as Dollar Index Hits 19-Month High
Binance News
·0 Likes
·599 views
Anthropic’s6xIPODemandSignalsPotentialRecordRaise
2 views
4 Discussing
HuangExitNvidiaStrategyInFocus
121,950 views
1,274 Discussing