
rayObee
43 Posts

rayObee
Open Trade
Frequent Trader
5.7 Years
24 Following
38 Followers
107 Liked
Posts
Portfolio
All
Quotes
es


Ualifi Araújo
·
--
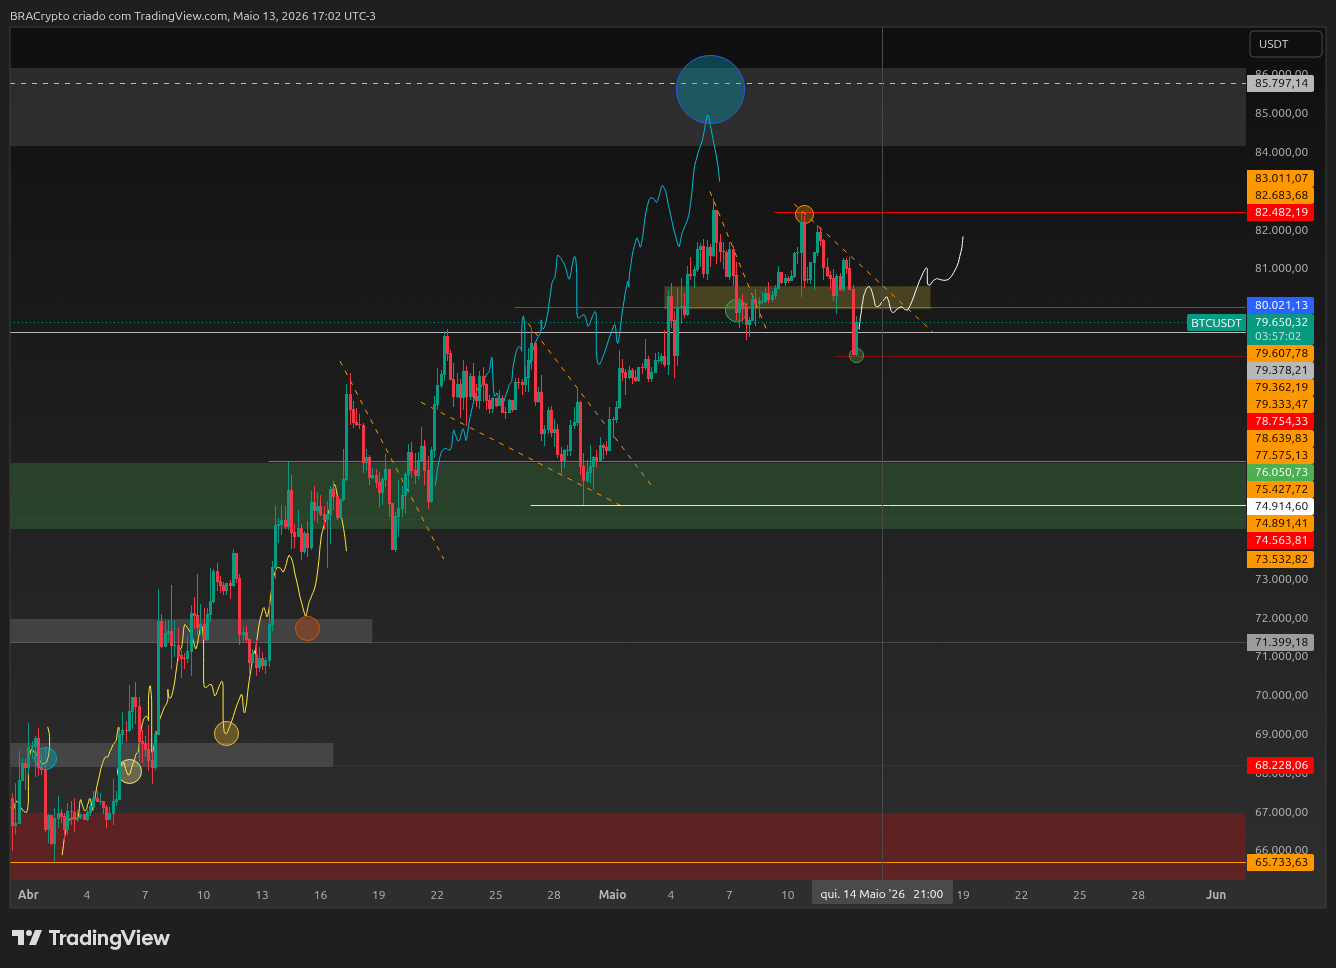
BullishWe saw a new attack from the BEARS on #BTC today, which pushed us down to $78.7K, but it's likely they only managed this due to the terrible economic data released earlier.
Even though we're below $80K, it doesn't seem like we're heading towards $74K at the moment, as we were quickly pushed back up again. The last 4h candlestick, which will close the daily, should place us back at $80K, making the chart more comfortable for the BULLS tomorrow.
I hope we start to see a solid rise towards the yellow range tomorrow and then find support to continue advancing.
It's natural for the BIG bears to be euphoric here, as they believe it will be easier to break the bullish structure being built below $80K. However, they will likely be wrong about this, and the current pullback caused by news does not break or invalidate the core thesis of $86K.
The RSI has cooled off quickly, not just on Bitcoin, but on almost all altcoins. Today, in fact, altcoins showed good strength against BTC, with some barely moving downwards.
Bitcoin continues to absorb negative macro news without losing its structure, and this brings more clarity about the continuation of the bullish trend towards $86K.
So far, the BEARS have had the week all to themselves. Let's see how the market behaves starting tomorrow.
The thought remains the same:
"$78K is the new support that the BULLS will defend at all costs, and this will take us to $86K. I'm not in a rush here. The RSI is already improving on the larger timeframes. With a bit more time, we'll keep climbing."
$86K loading...
Even though we're below $80K, it doesn't seem like we're heading towards $74K at the moment, as we were quickly pushed back up again. The last 4h candlestick, which will close the daily, should place us back at $80K, making the chart more comfortable for the BULLS tomorrow.
I hope we start to see a solid rise towards the yellow range tomorrow and then find support to continue advancing.
It's natural for the BIG bears to be euphoric here, as they believe it will be easier to break the bullish structure being built below $80K. However, they will likely be wrong about this, and the current pullback caused by news does not break or invalidate the core thesis of $86K.
The RSI has cooled off quickly, not just on Bitcoin, but on almost all altcoins. Today, in fact, altcoins showed good strength against BTC, with some barely moving downwards.
Bitcoin continues to absorb negative macro news without losing its structure, and this brings more clarity about the continuation of the bullish trend towards $86K.
So far, the BEARS have had the week all to themselves. Let's see how the market behaves starting tomorrow.
The thought remains the same:
"$78K is the new support that the BULLS will defend at all costs, and this will take us to $86K. I'm not in a rush here. The RSI is already improving on the larger timeframes. With a bit more time, we'll keep climbing."
$86K loading...
$ETH

Diann Staudenmeier TpY6
·
--
#ETH
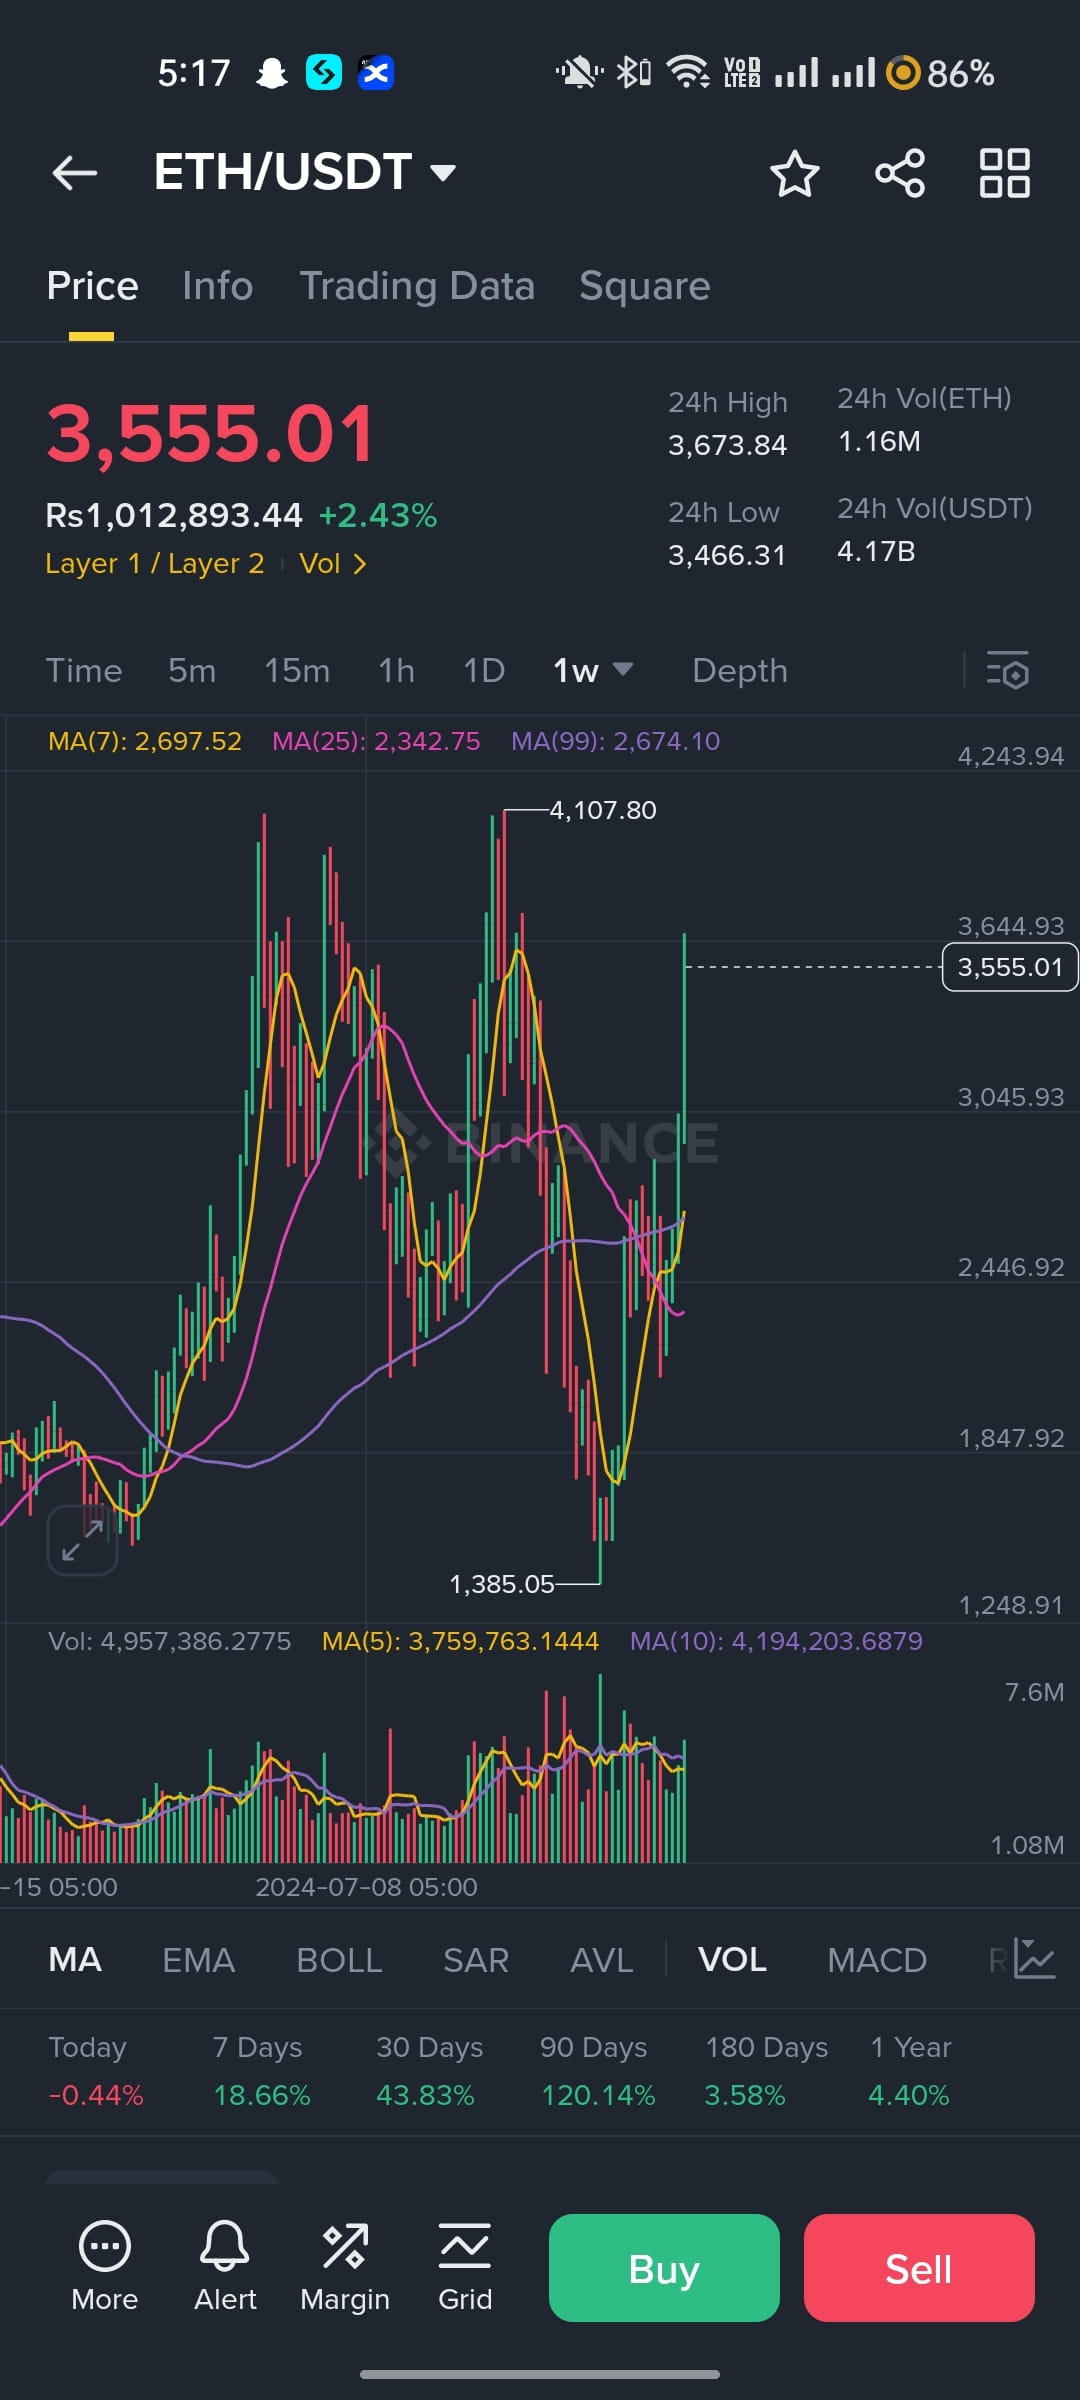
#ETH/USDT Weekly Chart Analysis – (Binance)
Current Price: $3,555.01
Timeframe: 1W (Weekly)
Price Change: +2.43%
Volume (24h):
ETH: 1.16M
USDT: 4.17B
---
🔍 Chart Observations:
📈 1. Trend Reversal & Strong Bullish Candle
ETH has printed a strong bullish engulfing candle this week with a long body, suggesting momentum is shifting to the upside.
Price jumped from ~2,900 to over 3,500+ in one weekly candle—very strong buyer interest.
🟢 2. Moving Averages (MA)
MA(7): 2,697 (yellow)
MA(25): 2,342 (pink)
MA(99): 2,674 (blue)
➡️ Price has broken above all major MAs, confirming a bullish breakout.
The shorter MA(7) is about to cross the longer ones (bullish crossover likely next week).
💸 3. Volume
Weekly volume is spiking — almost 5 million, highest in recent weeks.
Volume confirms the strength of this bullish move. Breakouts with volume are more reliable.
🧱 4. Key Resistance Levels
Immediate resistance: $3,665 - $3,673 (24h high zone)
Major resistance: $4,107 (weekly top)
Break above $4,100 would likely send ETH to new 2024 highs.
🛡️ 5. Support Levels
Support 1: $3,045
Support 2: $2,675 (MA99)
Strong base has formed near $2,900
🔁 6. MACRO Trend
ETH rebounded from a long-term low around $1,385.
Now it's making higher highs and higher lows, signaling a long-term bullish reversal.
---
🧭 What’s Next for ETH/USDT?
✅ Bullish Scenario (High Probability)
If ETH sustains above $3,500 this week and breaks $3,673 → next target is $4,100.
Above $4,100 = blue skies up to $4,300–$4,400 short-term.
⚠️ Bearish Risk
Rejection near $3,673 could lead to short-term consolidation back to $3,000–$3,100.
Failure to hold $3,000 may revisit $2,675–$2,700 support zone.
---
📊 Verdict: BULLISH MOMENTUM CONFIRMED
Breakout + Volume + MA Crossovers = strong confirmation for upside. ETH is likely heading toward $4,100+ if $3,673 breaks with volume.
........
#ETH/USDT Weekly Chart Analysis – (Binance)
Current Price: $3,555.01
Timeframe: 1W (Weekly)
Price Change: +2.43%
Volume (24h):
ETH: 1.16M
USDT: 4.17B
---
🔍 Chart Observations:
📈 1. Trend Reversal & Strong Bullish Candle
ETH has printed a strong bullish engulfing candle this week with a long body, suggesting momentum is shifting to the upside.
Price jumped from ~2,900 to over 3,500+ in one weekly candle—very strong buyer interest.
🟢 2. Moving Averages (MA)
MA(7): 2,697 (yellow)
MA(25): 2,342 (pink)
MA(99): 2,674 (blue)
➡️ Price has broken above all major MAs, confirming a bullish breakout.
The shorter MA(7) is about to cross the longer ones (bullish crossover likely next week).
💸 3. Volume
Weekly volume is spiking — almost 5 million, highest in recent weeks.
Volume confirms the strength of this bullish move. Breakouts with volume are more reliable.
🧱 4. Key Resistance Levels
Immediate resistance: $3,665 - $3,673 (24h high zone)
Major resistance: $4,107 (weekly top)
Break above $4,100 would likely send ETH to new 2024 highs.
🛡️ 5. Support Levels
Support 1: $3,045
Support 2: $2,675 (MA99)
Strong base has formed near $2,900
🔁 6. MACRO Trend
ETH rebounded from a long-term low around $1,385.
Now it's making higher highs and higher lows, signaling a long-term bullish reversal.
---
🧭 What’s Next for ETH/USDT?
✅ Bullish Scenario (High Probability)
If ETH sustains above $3,500 this week and breaks $3,673 → next target is $4,100.
Above $4,100 = blue skies up to $4,300–$4,400 short-term.
⚠️ Bearish Risk
Rejection near $3,673 could lead to short-term consolidation back to $3,000–$3,100.
Failure to hold $3,000 may revisit $2,675–$2,700 support zone.
---
📊 Verdict: BULLISH MOMENTUM CONFIRMED
Breakout + Volume + MA Crossovers = strong confirmation for upside. ETH is likely heading toward $4,100+ if $3,673 breaks with volume.
........
here

广东茂名猪头
·
--
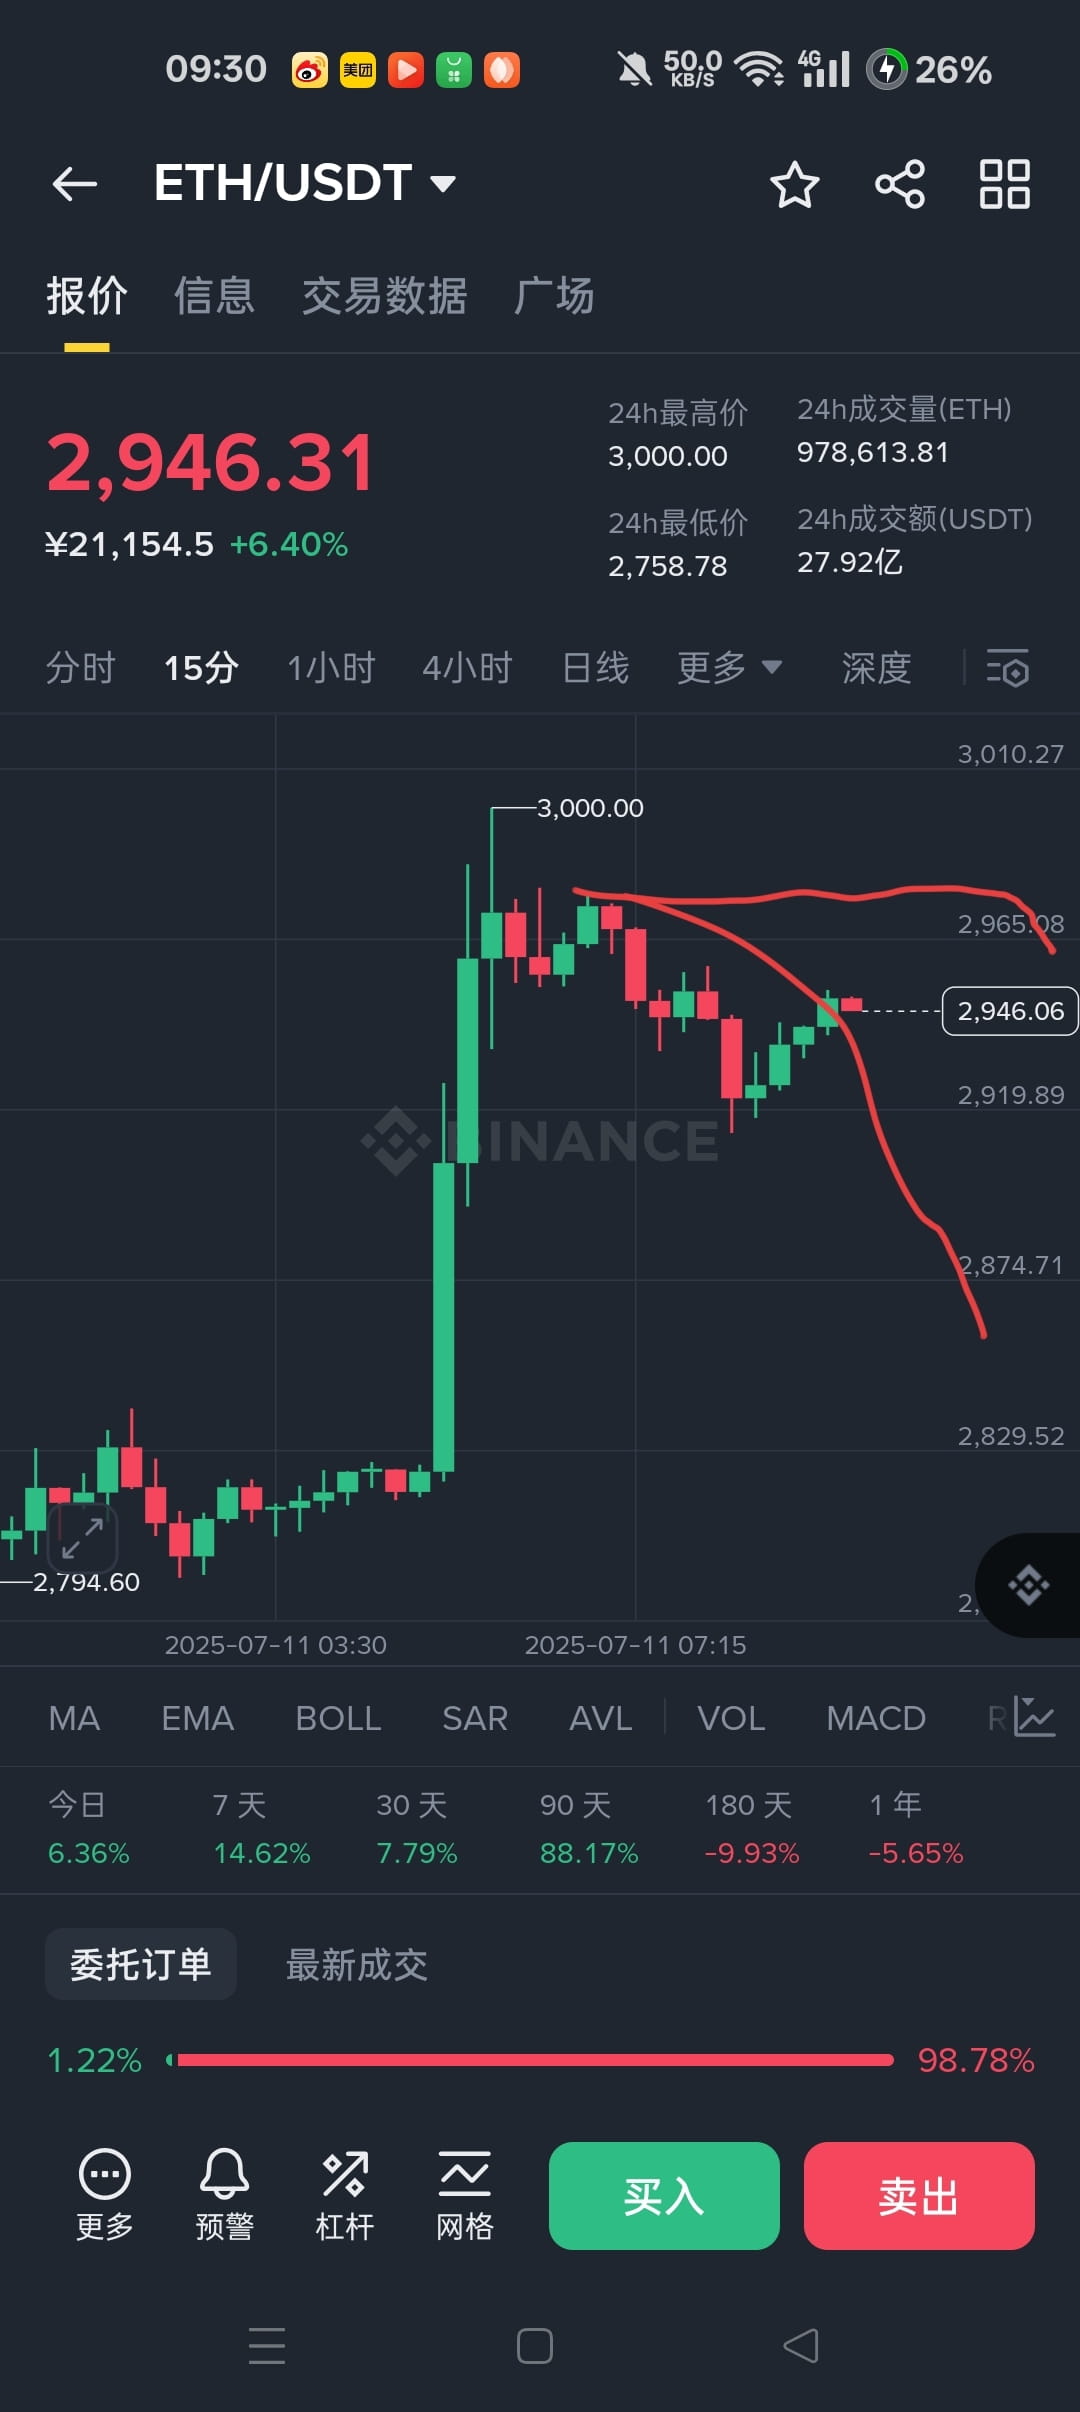
BearishJuly 11 Trading Strategy Suggestion: Short Ethereum at the current price of 2949, targeting around 2902-2852, looking for a break towards 2700. Hurry and short it, bears. A big drop and black swan is coming soon, with resistance levels at 2965-2980 on the hourly chart. Quickly short it to capture the big profit. Weekend crash $ETH $BTC $SOL #BTC再创新高 #币安八周年
here

亮哥论趋势
·
--
Ethereum (ETH) Market Analysis on July 10, 2025 and Tomorrow's Trend Forecast
I. Today's Core Market Data (as of July 10, 2025, 21:46 UTC)
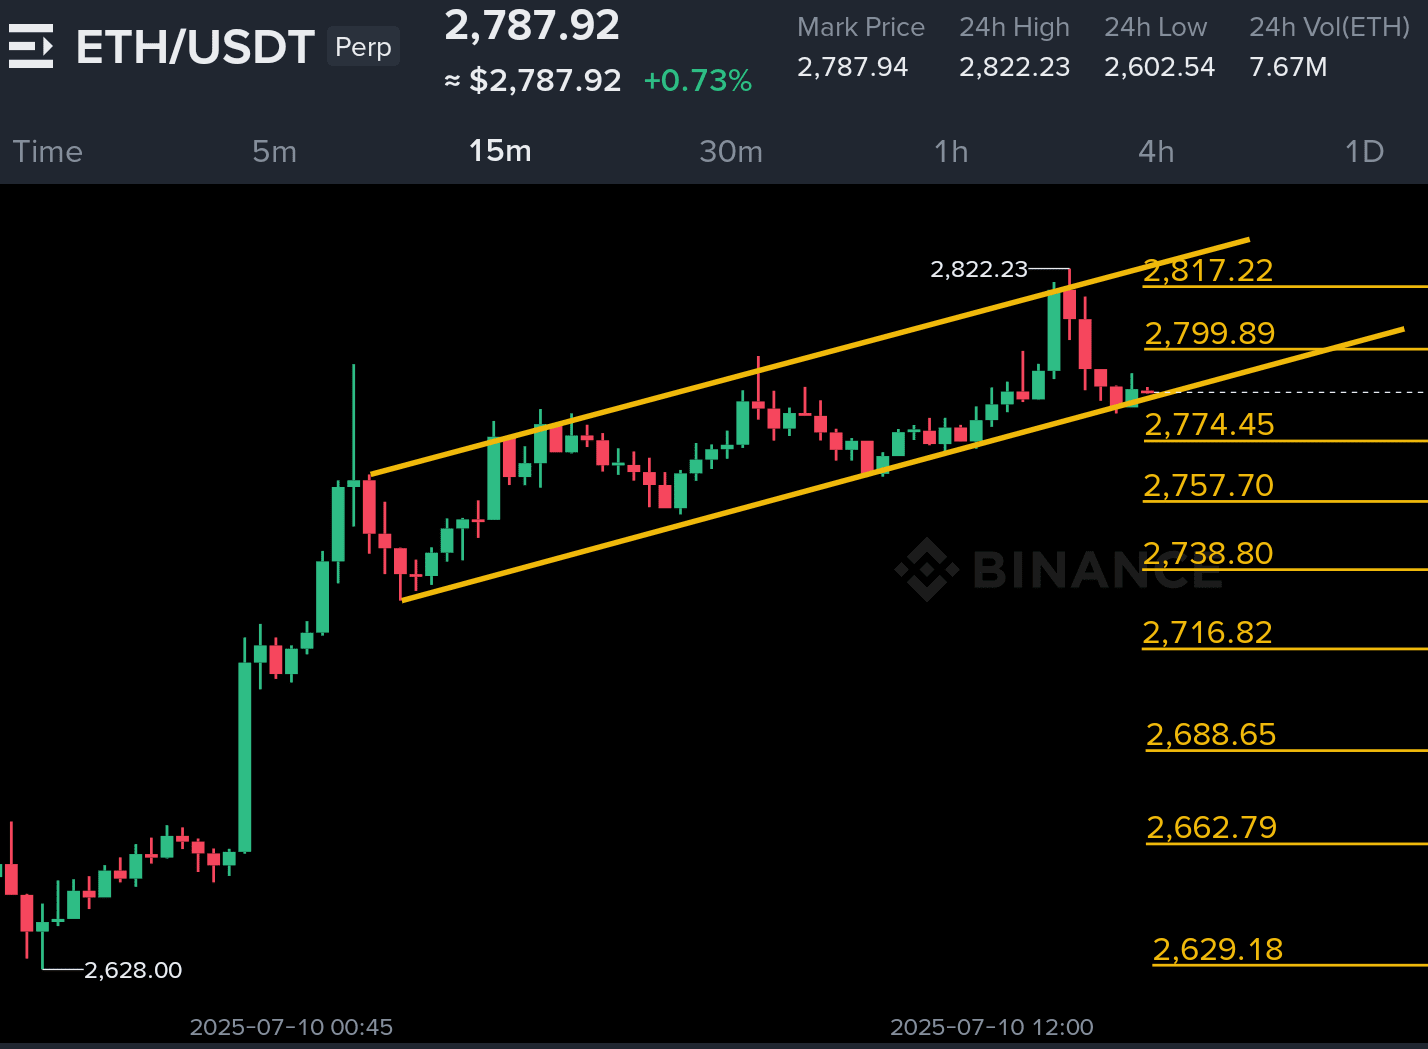
Price Performance
Current Price: $2,792.97 (up 5.21% from yesterday)
Intraday High: $2,823.18 (breaking key resistance level)
Intraday Low: $2,629.51 (support level verified)
24-Hour Volatility: 7.37% (volatility remains high)
24-Hour Trading Volume: $28.8 billion (trading activity has significantly increased)
On-Chain Data
Whale Movements: A whale withdrew 46,954 ETH (worth over $126 million) from Kraken in the last 12 hours, indicating continuous inflow of institutional-level capital.
ETF Fund Flows: Seven institutions bought approximately $358 million worth of ETH within 24 hours, with ETF fund inflows becoming a core driving force.
Price Performance
Current Price: $2,792.97 (up 5.21% from yesterday)
Intraday High: $2,823.18 (breaking key resistance level)
Intraday Low: $2,629.51 (support level verified)
24-Hour Volatility: 7.37% (volatility remains high)
24-Hour Trading Volume: $28.8 billion (trading activity has significantly increased)
On-Chain Data
Whale Movements: A whale withdrew 46,954 ETH (worth over $126 million) from Kraken in the last 12 hours, indicating continuous inflow of institutional-level capital.
ETF Fund Flows: Seven institutions bought approximately $358 million worth of ETH within 24 hours, with ETF fund inflows becoming a core driving force.
good

INSIDERMAXXI
·
--
Bearish$ETH if you are legend 😎 then you will do bull or bear my question ❓ i know what to do but I'm testing your quality
hahahaha

Green Link
·
--
Me when ETH hits $10K.
here

shahzi crypto master
·
--
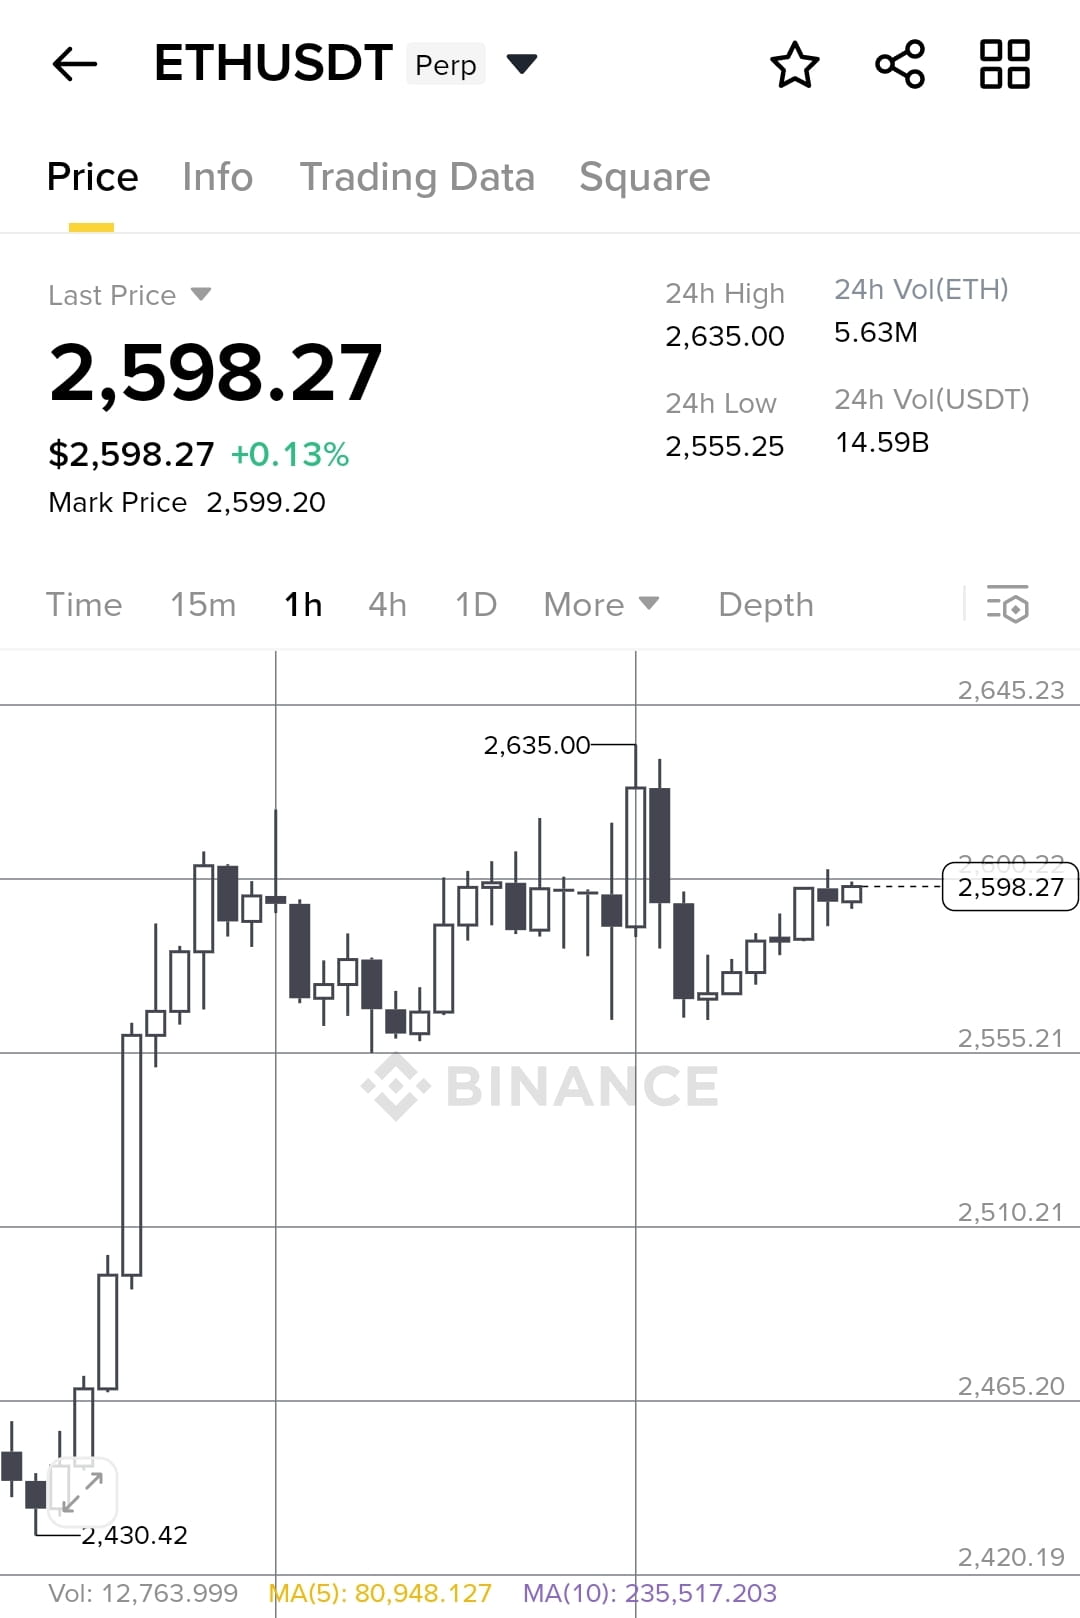
Bullish🟣 $ETH
/USDT (Perp) – Binance Futures
📈 Price Summary
Last Price: $2,598.27
Mark Price: $2,599.20
24h Change: +0.13%
24h High / Low: $2,635.00 / $2,555.25
24h Volume:
ETH: 5.63M
USDT: $14.59B
---
📊 Technical Indicators
MA(5): 80,948 ETH
MA(10): 235,517 ETH
Current Volume: 12,764 ETH (trading activity down compared to averages)
🧠 Interpretation:
Price is near mid-range of 24h high/low.
Low short-term volume suggests market indecision or consolidation.
---
⚔️ Support & Resistance Levels
Resistance:
$2,635 – Strong 24h high, first resistance
$2,645.23 – Visible book resistance
Support:
$2,555 – Key short-term support
$2,510.21 → $2,465.20 – Deeper range, heavy buy zone
$2,430.42 → $2,420.19 – Potential breakdown area
---
📉 Trend & Momentum
ETH is in a sideways-to-slightly-bullish structure in the short term.
Despite a positive 24h % change, volume is lower, signaling reduced momentum.
Mark price being slightly above last traded price may hint at buying pressure building.
---
🔄 Trade Ideas (Short-Term Futures)
🟢 Long Scenario
Entry: On breakout above $2,635
Target: $2,680 – $2,720
Stop: Below $2,590
🔴 Short Scenario
Entry: If $2,555 support breaks
Target: $2,510 → $2,465
Stop: Above $2,600
#ETHETFsApproved #ETH🔥🔥🔥🔥🔥🔥 #NODEBinanceTGE #NFPWatch #Write2Earn
/USDT (Perp) – Binance Futures
📈 Price Summary
Last Price: $2,598.27
Mark Price: $2,599.20
24h Change: +0.13%
24h High / Low: $2,635.00 / $2,555.25
24h Volume:
ETH: 5.63M
USDT: $14.59B
---
📊 Technical Indicators
MA(5): 80,948 ETH
MA(10): 235,517 ETH
Current Volume: 12,764 ETH (trading activity down compared to averages)
🧠 Interpretation:
Price is near mid-range of 24h high/low.
Low short-term volume suggests market indecision or consolidation.
---
⚔️ Support & Resistance Levels
Resistance:
$2,635 – Strong 24h high, first resistance
$2,645.23 – Visible book resistance
Support:
$2,555 – Key short-term support
$2,510.21 → $2,465.20 – Deeper range, heavy buy zone
$2,430.42 → $2,420.19 – Potential breakdown area
---
📉 Trend & Momentum
ETH is in a sideways-to-slightly-bullish structure in the short term.
Despite a positive 24h % change, volume is lower, signaling reduced momentum.
Mark price being slightly above last traded price may hint at buying pressure building.
---
🔄 Trade Ideas (Short-Term Futures)
🟢 Long Scenario
Entry: On breakout above $2,635
Target: $2,680 – $2,720
Stop: Below $2,590
🔴 Short Scenario
Entry: If $2,555 support breaks
Target: $2,510 → $2,465
Stop: Above $2,600
#ETHETFsApproved #ETH🔥🔥🔥🔥🔥🔥 #NODEBinanceTGE #NFPWatch #Write2Earn
ahahh

Crypto Memes Kampala
·
--
When you fail to buy the dip
for learning 🙏🏻

Z O Y A
·
--
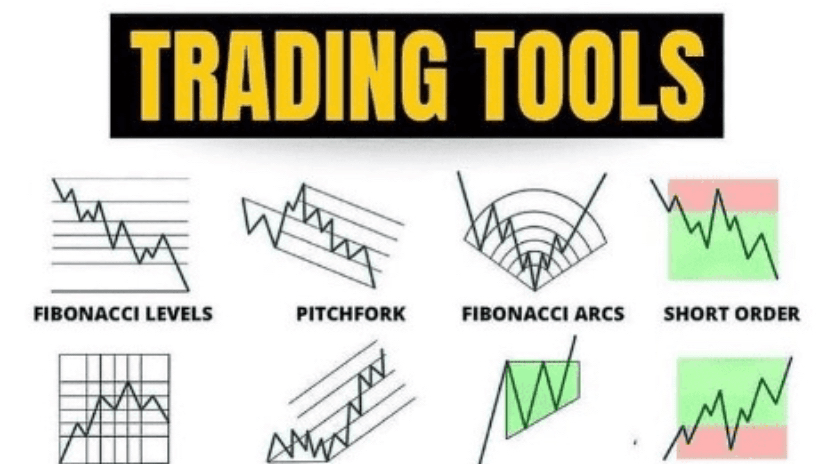
🚨 I Lost $80,000 Trading Like a Degenerate — Then…….
Made It All Back in 48 Hours Using These 16 Tools 🔥📈
They say losses are the best teachers…
Mine came wrapped in red candles and an $80,000 slap in the face. 💀
No stop-loss. No strategy. Just vibes, FOMO, and blind confidence.
I wasn’t trading — I was gambling.
But then came the shift.
I discovered 16 tools that flipped the entire game — and in just 2 days, I made back every single dollar I lost.
Here’s how I did it — and how you can avoid the same pain 👇
📌 1.
Fibonacci Levels
📏
No more chasing highs or bottoms. These price magnets helped me enter trades on smart pullbacks — not hope and prayers.
🪓 2.
Pitchfork (Axe)
I started drawing clean trend channels that gave my trades structure. No more guesswork — just clarity.
🌀 3.
Fibonacci Arcs
Curved retracement zones showed me early signs of reversals. Combine these with horizontal support = sniper entries. 🎯
📈📉 4.
Long/Short Strategy
Every trade had a plan: defined entry, stop-loss, and exit target. No entry? No trade.
🟩📐 5.
Gann Square + Gann Fan
Time + Price = Secret sauce. These tools helped me catch breakouts before the herd.
🔀 6.
Internal Fork (Inside Axe)
Scalping became deadly accurate. Caught mini trends inside big ranges with sniper precision.
🔺 7.
Triangles & Pennants
Pattern breakouts ONLY with volume confirmation. Game-changing for filtering fakeouts.
📊 8.
Trendlines
Basic? Maybe. But when combined with RSI and volume? Lethal.
🌊 9.
Elliott Waves
No more entering in the middle of nowhere. I learned to ride waves — and skip the noise.
📏 10.
Horizontal Zones
Support, resistance, and consolidation zones became launchpads or trapdoors — and I knew which was which.
🟪 11.
Flags & Pennants
Strong trend? Tight consolidation? Perfect entry after a breakout with a tight SL. ✅
📦 12.
Volume Profile & Order Boxes
Where whales play — I play. I followed volume, not FOMO.
📋 My Trading Rulebook Changed:
No entry unless 3+ tools align
No emotions. No chasing. Only logic.
🧠 Final Thoughts:
I lost $80K because I traded like a gambler.
I earned it all back because I started trading like a strategist.
This isn’t luck — it’s discipline, tools, and cold-blooded confluence.
📉 Trade smart or bleed slow.
💬 If you’re still trading blind — STOP.
Use tools. Use strategy. Or keep donating to smarter traders.
Want help learning these tools?
Drop a 🔥 in the comments & I’ll share a beginner-friendly breakdown!
They say losses are the best teachers…
Mine came wrapped in red candles and an $80,000 slap in the face. 💀
No stop-loss. No strategy. Just vibes, FOMO, and blind confidence.
I wasn’t trading — I was gambling.
But then came the shift.
I discovered 16 tools that flipped the entire game — and in just 2 days, I made back every single dollar I lost.
Here’s how I did it — and how you can avoid the same pain 👇
📌 1.
Fibonacci Levels
📏
No more chasing highs or bottoms. These price magnets helped me enter trades on smart pullbacks — not hope and prayers.
🪓 2.
Pitchfork (Axe)
I started drawing clean trend channels that gave my trades structure. No more guesswork — just clarity.
🌀 3.
Fibonacci Arcs
Curved retracement zones showed me early signs of reversals. Combine these with horizontal support = sniper entries. 🎯
📈📉 4.
Long/Short Strategy
Every trade had a plan: defined entry, stop-loss, and exit target. No entry? No trade.
🟩📐 5.
Gann Square + Gann Fan
Time + Price = Secret sauce. These tools helped me catch breakouts before the herd.
🔀 6.
Internal Fork (Inside Axe)
Scalping became deadly accurate. Caught mini trends inside big ranges with sniper precision.
🔺 7.
Triangles & Pennants
Pattern breakouts ONLY with volume confirmation. Game-changing for filtering fakeouts.
📊 8.
Trendlines
Basic? Maybe. But when combined with RSI and volume? Lethal.
🌊 9.
Elliott Waves
No more entering in the middle of nowhere. I learned to ride waves — and skip the noise.
📏 10.
Horizontal Zones
Support, resistance, and consolidation zones became launchpads or trapdoors — and I knew which was which.
🟪 11.
Flags & Pennants
Strong trend? Tight consolidation? Perfect entry after a breakout with a tight SL. ✅
📦 12.
Volume Profile & Order Boxes
Where whales play — I play. I followed volume, not FOMO.
📋 My Trading Rulebook Changed:
No entry unless 3+ tools align
No emotions. No chasing. Only logic.
🧠 Final Thoughts:
I lost $80K because I traded like a gambler.
I earned it all back because I started trading like a strategist.
This isn’t luck — it’s discipline, tools, and cold-blooded confluence.
📉 Trade smart or bleed slow.
💬 If you’re still trading blind — STOP.
Use tools. Use strategy. Or keep donating to smarter traders.
Want help learning these tools?
Drop a 🔥 in the comments & I’ll share a beginner-friendly breakdown!
okay

朵新模
·
--
👀 Trader Madman
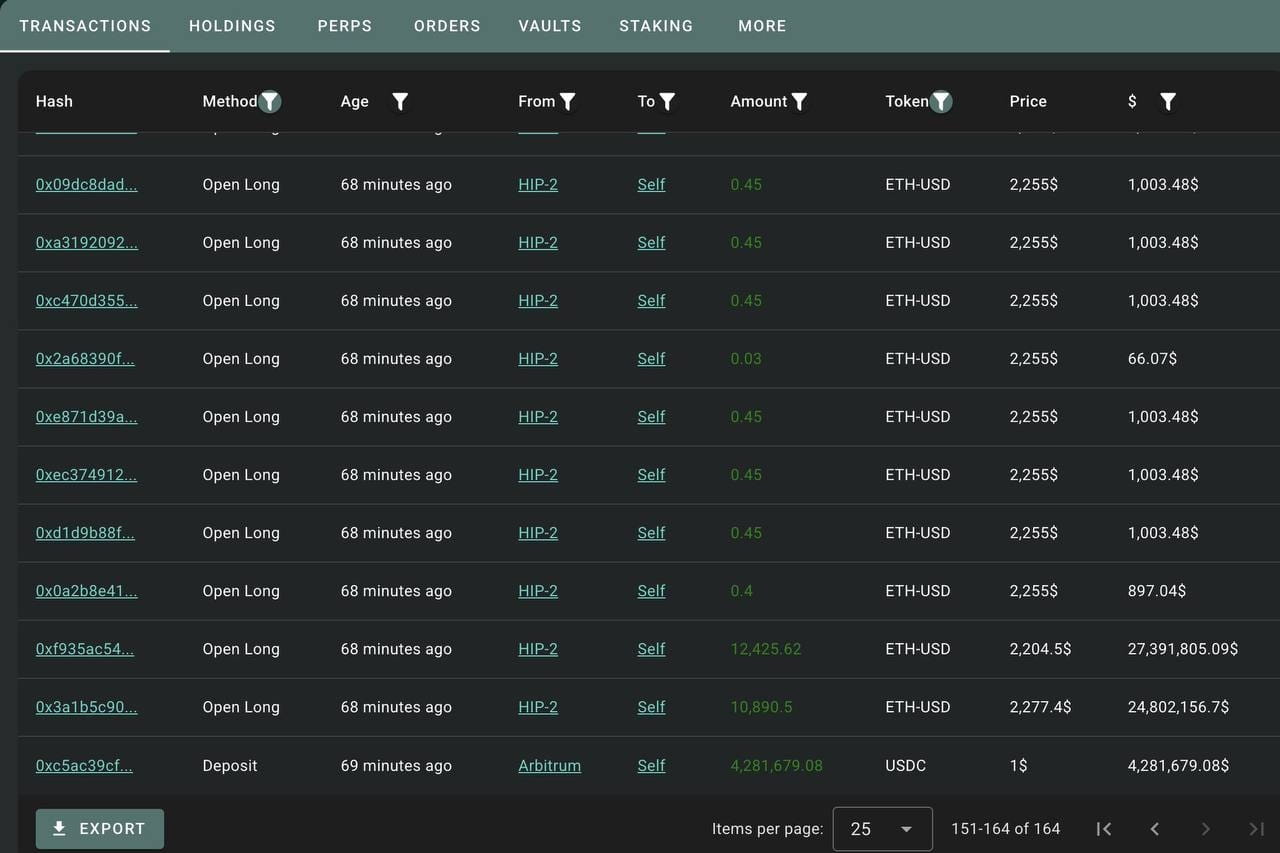
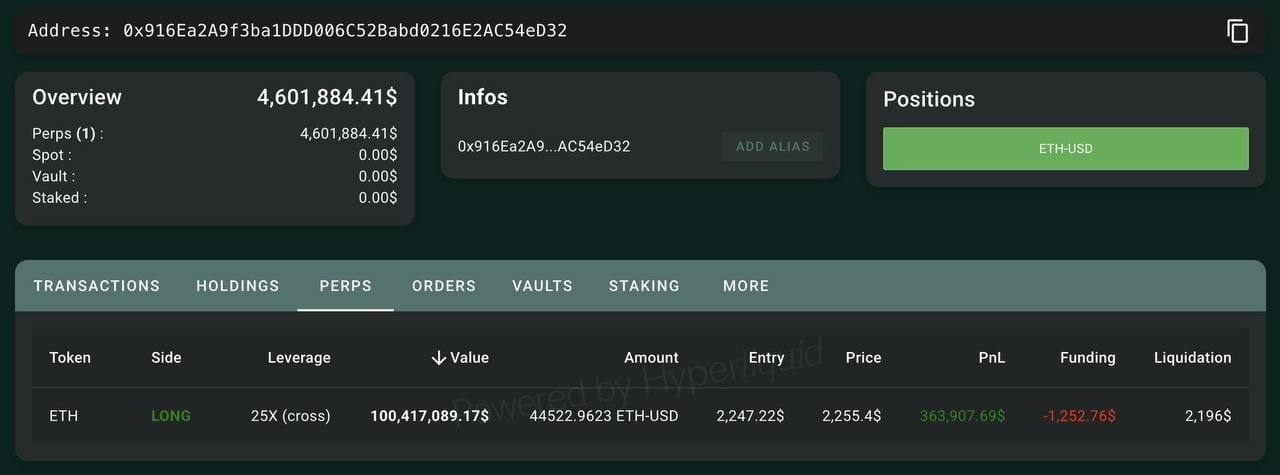
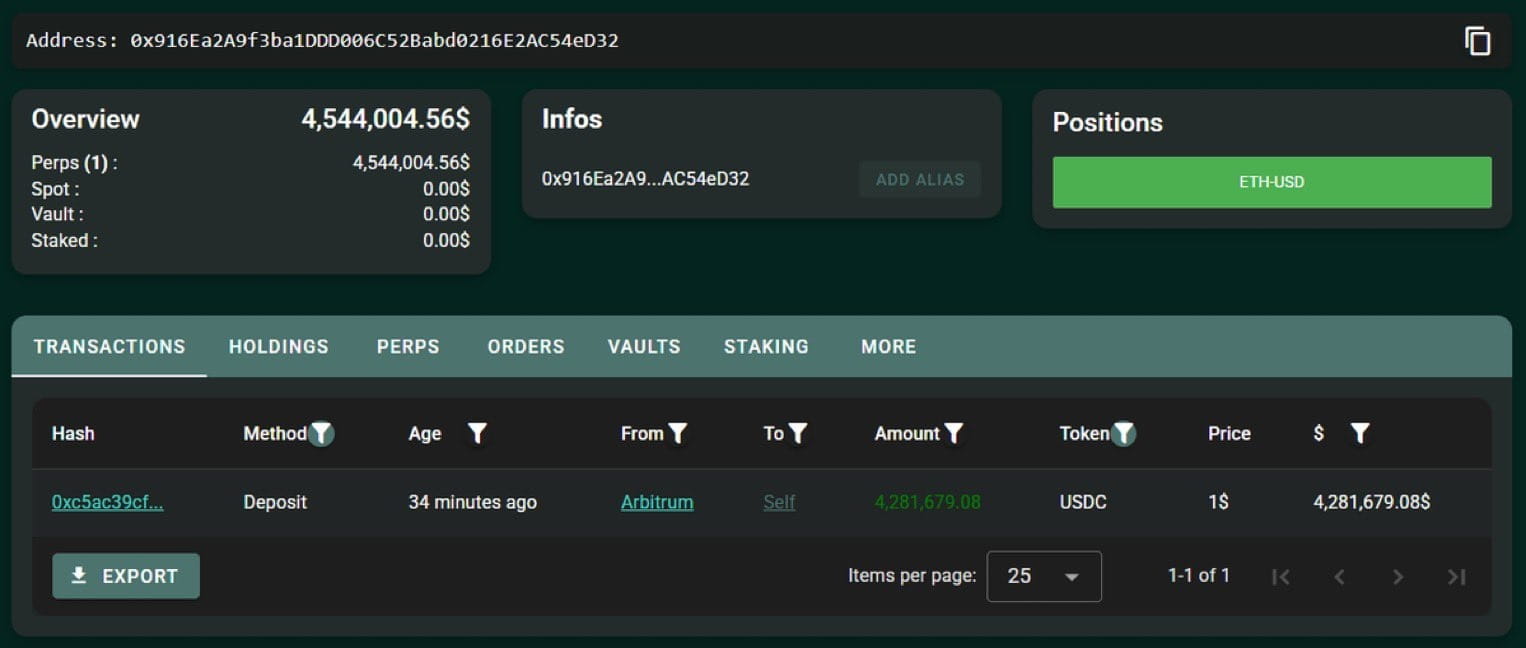
A trader with address 0x916E deposited 4.28 million USDC into the Hyperliquid platform and opened a long position on Ethereum with 25x leverage an hour ago.
🤑 The position volume reached 44,523 ETH (worth $100.4 million ), and the liquidation price is $2,196 .
🤑 A drop of just $60 in ETH could wipe out $4 million. Frankly, this already looks like gambling addiction.
#BinanceAlphaAlert #IsraelIranConflict #ScalpingStrategy #Whale.Alert #whalemovement
$BTC $ETH $BNB
A trader with address 0x916E deposited 4.28 million USDC into the Hyperliquid platform and opened a long position on Ethereum with 25x leverage an hour ago.
🤑 The position volume reached 44,523 ETH (worth $100.4 million ), and the liquidation price is $2,196 .
🤑 A drop of just $60 in ETH could wipe out $4 million. Frankly, this already looks like gambling addiction.
#BinanceAlphaAlert #IsraelIranConflict #ScalpingStrategy #Whale.Alert #whalemovement
$BTC $ETH $BNB
okay

Dayle Gargani BhzH1
·
--
🚨 BREAKING:
🐳 A whale just opened a massive $101M long position on $ETH using 25x leverage.
Looks like he knows something we don’t…
#ETHWhale #LeverageTrading #CryptoMoves #Ethereum
🐳 A whale just opened a massive $101M long position on $ETH using 25x leverage.
Looks like he knows something we don’t…
#ETHWhale #LeverageTrading #CryptoMoves #Ethereum
goddamnit
Quoted content has been removed
then why this crypto market getting down? is it to manipulate the price so many people could buy in a cheap price for investment ?
Quoted content has been removed
agreed

Hua BNB
·
--
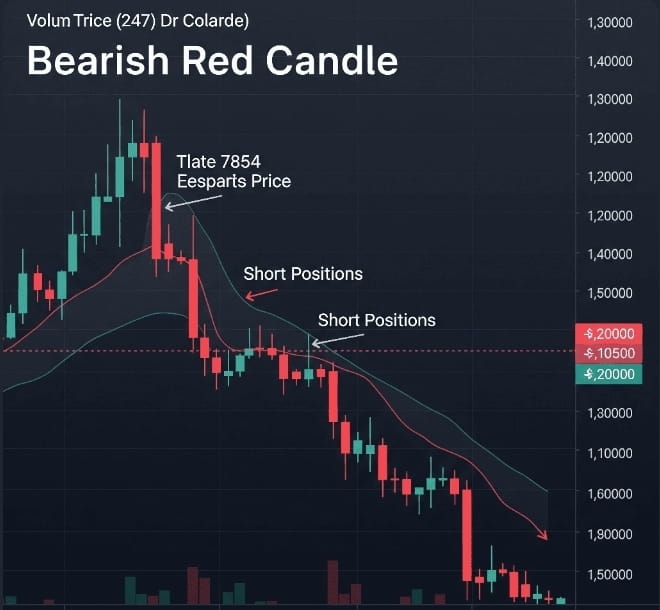
Bearish🚨🚨🚨 Why Short Entry is Safer in Crypto Trading 🚨🚨🚨
Want to play smart in the crypto market? Here are 20🔥 solid reasons why taking a short position with a big red bearish candle 🕯️🔻 can give you the edge:
🔴 ALWAYS rely on the Big Red Bearish Candle!
1️⃣ Clearer trend identification 📉
2️⃣ Defined resistance levels 🚫
3️⃣ Potential for quicker profits 💰💨
4️⃣ Exploiting market corrections 🔄
5️⃣ Reduced entry point ambiguity ❓➡️✅
6️⃣ Lower risk of unexpected pumps 🚀❌
7️⃣ Stronger stop-loss placement 🛑🧠
8️⃣ Confirmation of downward momentum ⬇️📊
9️⃣ More predictable price action 🔍📈
🔟 Capitalizing on fear & panic selling 😱🔥
1️⃣1️⃣ Opportunity in overbought markets 📈⚠️
1️⃣2️⃣ Less vulnerable to fake breakouts 🎭❌
1️⃣3️⃣ High probability of retesting lows 🔁🔻
1️⃣4️⃣ Easier to identify exhaustion 😩
1️⃣5️⃣ Great for swing trading strategies 🪃💼
1️⃣6️⃣ Profit from capitulation events 💥💸
1️⃣7️⃣ Clearer invalidation points ❌🧾
1️⃣8️⃣ Lower risk of chasing tops ⛔🔝
1️⃣9️⃣ Greater control over exposure 🎛️🧠
2️⃣0️⃣ Exploiting leveraged short positions ⚡📉💣
#TrumpTariffs 🇺🇸📉 #MarketPullback 🔄📉
#TrumpMediaBitcoinTreasury 📰₿💼
#BinanceAlphaAlert 🚨📲
$BTC
$ETH
$XRP
Want to play smart in the crypto market? Here are 20🔥 solid reasons why taking a short position with a big red bearish candle 🕯️🔻 can give you the edge:
🔴 ALWAYS rely on the Big Red Bearish Candle!
1️⃣ Clearer trend identification 📉
2️⃣ Defined resistance levels 🚫
3️⃣ Potential for quicker profits 💰💨
4️⃣ Exploiting market corrections 🔄
5️⃣ Reduced entry point ambiguity ❓➡️✅
6️⃣ Lower risk of unexpected pumps 🚀❌
7️⃣ Stronger stop-loss placement 🛑🧠
8️⃣ Confirmation of downward momentum ⬇️📊
9️⃣ More predictable price action 🔍📈
🔟 Capitalizing on fear & panic selling 😱🔥
1️⃣1️⃣ Opportunity in overbought markets 📈⚠️
1️⃣2️⃣ Less vulnerable to fake breakouts 🎭❌
1️⃣3️⃣ High probability of retesting lows 🔁🔻
1️⃣4️⃣ Easier to identify exhaustion 😩
1️⃣5️⃣ Great for swing trading strategies 🪃💼
1️⃣6️⃣ Profit from capitulation events 💥💸
1️⃣7️⃣ Clearer invalidation points ❌🧾
1️⃣8️⃣ Lower risk of chasing tops ⛔🔝
1️⃣9️⃣ Greater control over exposure 🎛️🧠
2️⃣0️⃣ Exploiting leveraged short positions ⚡📉💣
#TrumpTariffs 🇺🇸📉 #MarketPullback 🔄📉
#TrumpMediaBitcoinTreasury 📰₿💼
#BinanceAlphaAlert 🚨📲
$BTC
$ETH
$XRP
#ShareYourTrades $BNB it is still going up, but not for long, i will sell more BNB after it touched the next resistance
I really admire how binance go to this point, I wouldn’t say that I’m a veteran on this, but at least I’ve been here for 4.3 yrs as my profile shows. All emotions and regrets I’ve been through until this point where we will witness the new feature of crypto-world that has teamed up with Mastercard and will make his own card!! #MastercardStablecoinCards LET’S GO!!!!!
Can’t wait to hold it in my hands, still don’t know when and how actually but, i hope there will be a physical cards for this which could be used everywhere, or maybe they will just add an option to all banks all over the world to let the client get it just like that? 🤔
We’ll see
I still have no idea where these bonus points i’ll get going to or what can i use this for, but i just like doing task I can do. Feels like in a game!
Can’t wait to hold it in my hands, still don’t know when and how actually but, i hope there will be a physical cards for this which could be used everywhere, or maybe they will just add an option to all banks all over the world to let the client get it just like that? 🤔
We’ll see
I still have no idea where these bonus points i’ll get going to or what can i use this for, but i just like doing task I can do. Feels like in a game!


Binance Square Official
·
--
#MastercardStablecoinCards
Mastercard has teamed up with MoonPay to launch global stablecoin cards, enabling crypto payments at over 150 million merchants worldwide. Crypto wallets will soon be able to issue virtual Mastercards, allowing users to spend stablecoins like USDC anywhere Mastercard is accepted. This move builds on Mastercard’s push to streamline digital asset transactions, expanding its crypto footprint amid growing competition with Visa.
💬 Would you use stablecoins for everyday payments? Are we finally near real-world crypto adoption—or still too early?
#EthereumSecurityInitiative
The Ethereum Foundation has announced a three-phase initiative to strengthen ecosystem security and support broader onchain adoption. Dubbed the "Trillion Dollar Security Initiative," the goal is to build “civilization-scale infrastructure”—robust enough to store trillions of dollars from individuals to institutions.
💬 What do you think Ethereum still needs to improve before mass adoption truly feels safe?
Create a post using #MastercardStablecoinCards , #EthereumSecurityInitiative , or the cashtags $USDC / $ETH , or share your trader’s profile to earn Binance Points. Alternatively, share your trades and earn 5 points!
(Tap the “+” on the App homepage and click on Task Center)
Activity period: 2025-05-16 06:00 (UTC) to 2025-05-17 06:00 (UTC)
Point rewards are first-come, first-served, so be sure to claim your points daily!
Mastercard has teamed up with MoonPay to launch global stablecoin cards, enabling crypto payments at over 150 million merchants worldwide. Crypto wallets will soon be able to issue virtual Mastercards, allowing users to spend stablecoins like USDC anywhere Mastercard is accepted. This move builds on Mastercard’s push to streamline digital asset transactions, expanding its crypto footprint amid growing competition with Visa.
💬 Would you use stablecoins for everyday payments? Are we finally near real-world crypto adoption—or still too early?
#EthereumSecurityInitiative
The Ethereum Foundation has announced a three-phase initiative to strengthen ecosystem security and support broader onchain adoption. Dubbed the "Trillion Dollar Security Initiative," the goal is to build “civilization-scale infrastructure”—robust enough to store trillions of dollars from individuals to institutions.
💬 What do you think Ethereum still needs to improve before mass adoption truly feels safe?
Create a post using #MastercardStablecoinCards , #EthereumSecurityInitiative , or the cashtags $USDC / $ETH , or share your trader’s profile to earn Binance Points. Alternatively, share your trades and earn 5 points!
(Tap the “+” on the App homepage and click on Task Center)
Activity period: 2025-05-16 06:00 (UTC) to 2025-05-17 06:00 (UTC)
Point rewards are first-come, first-served, so be sure to claim your points daily!

hmm

Islam_Ambassada
·
--
IS BITCOIN IS ABOUT TO CRASH?:FULL ANALYSIS
Hello everyone, today is May 12th, 2025.
As requested, I’m providing an updated analysis on $BTC along with a broader market overview.
Although I’ve shared a general analysis previously, this update will place extra emphasis on key points while introducing new confluences based on the latest data.
Please note that this breakdown is a bit detailed, so I encourage you to read it thoroughly. I may not respond to questions that have already been addressed within the article.
MONTHLY VIEW
Previously, I shared my belief that before the market dips below the current low, it’s more likely to break the current high at $109.9k.
I’ve already explained what I mean by the “current low”—on the higher time frame, that level is around $74.3k.
As I mentioned in my previous article, the current level I’m referring to is the one marked with a blue arrow.
In essence, my view is that the market will likely break the current high on the monthly time frame before any move below that low.
This perspective is important because it shapes how you interpret the market. Having a solid general outlook is essential, it helps you clearly identify the overall trend and avoid getting caught up in short-term noise.
Weekly view
What do you see on my screen?
This is the Bitcoin weekly time frame, and as shown, the market is in an uptrend.
Note:
The first step in any analysis is to identify the overall trend, as I mentioned at the beginning. The trend shapes every decision you make—it determines how you interpret price action on the lower time frames.
Currently, Bitcoin is moving upward on both the monthly and weekly charts.
This confirms that the general market direction is bullish—simply put, the market is trending upward.
Now let’s start breaking things down to explore opportunities on the lower time frames.
We’ll ask key questions like:
• If there’s manipulation on the lower time frames, can we still find chances to buy low?
• Should we sell now or take profit and wait for a re-entry?
Everyone’s goal is to make a profit—and to maximize it, you must develop the habit of buying low and selling high. That’s why many traders are uncertain whether to exit now or wait for a deeper dip or another pump.
Let’s dive deeper into the market structure and clarify this.
$BTC
The current weekly candle closed as a strong bullish candle, clearly indicated on the chart by the blue arrow.
This type of close shows that buyers are currently in control of the market. Given my overall bullish outlook—and the likelihood that we’ll break the current high—I believe it’s safer to continue holding Bitcoin rather than risk missing out on a potential breakout from this zone.
Unless we get a clear, valid reason to confirm a reversal, in this case we can stay patient and wait for a healthy pullback on the lower time frames before considering buy-back strategy.
At the moment, there’s no strong reason to sell, especially with the positive sentiment in the market and the current bullish structure.
Note:
This is a general market outlook, derived from the weekly and monthly time frames.
If we are to see any signs of reversal, confirmation will most likely come from the daily or 4-hour charts.
Keep reading as we zoom into the market for more detailed insights.
One key reason this structure remains bullish is because it does not show the characteristics of a valid triple top pattern.
Here’s why:
📝 There’s no strong bearish rejection at the third peak.
📝 The most recent candle, highlighted with the blue arrow, closed strong and bullish—not with a rejection wick or bearish engulfing pattern.
📝 Price has not broken below the neckline (around $91k), which is a critical condition for confirming a triple top reversal.
These points collectively suggest that the market is still favoring the bullish trend rather than signaling a reversal.
DAILY VIEW
Pay close attention to the blue zone marked on my screen.
As long as the weekly trend remains bullish, our overall bias stays bullish.
However, a reversal could be confirmed if the market starts showing signs of rejection within the $106k–$109k zone.
At the moment, I see no valid reason to sell.
I previously bought at $98k, took my first profit at $104k, and I’m now holding the remaining position in Bitcoin without reinvesting the portion I took out.
I’ve also chosen not to take profits at $106k—I’ll simply leave the rest of the position untouched.
I’m not topping up my position right now because I want to stay ready to buy back lower if we get a healthy pullback.
I’ll only consider adding more to my position after we get a clear breakout confirmation above the current resistance zone.
CONFIRMATION
If we get a strong bullish candle closing above the zone on the daily or 4-hour chart, that would serve as a clear confirmation for a fresh entry. At that point, I’ll be looking to top up my Bitcoin position and ride the next wave upward.
For now, the remaining percentage of my position is still in the market—and it’s more than enough to stay in profit comfortably.
A breakout above $110.5k—especially confirmed on the daily or weekly timeframe—will be my key signal.
As for the 4-hour timeframe, it requires more technical confirmation, so I’ll be actively monitoring it and available to guide on that when the time comes.
Personally, I plan to use limit orders just above the breakout high, as I usually do, to secure a quick and efficient entry when the move is confirmed.
Someone asked: “If the market dips, where should we expect to buy from?”
As I mentioned earlier, if we get confirmation of a dip, I’ll release a detailed article highlighting the specific buy zones and how to approach them.
For now, I still maintain my bullish outlook, with the belief that the market is likely to break through this current zone.
However, I’m being cautious by not committing all my funds until we get a confirmed breakout above $110.5k.
Also, the current zone appears to act as a potential supply level, which is why I’m respecting it and managing my risk carefully—even though I expect it to be broken.
This is the kind of market condition where many traders get confused. That’s why I’ve taken the time to provide clear reasoning and explain how I’m navigating it, all to help benefit each of you.
Conclusion:
I remain bullish based on the weekly close and expect a breakout.
However, I’ve strategically managed my entries to reduce risk until that breakout is confirmed.
If the market shows clear signs of reversal within the $106k–$109k zone, I’ll share an update accordingly.
Every question has been answered — so please take the time to read and understand the full post.❤️📈
💥💥If you found this helpful, like, comment, and share so others can benefit as well.
And for those who often ask for more insights, kindly check my bio for updates.
As requested, I’m providing an updated analysis on $BTC along with a broader market overview.
Although I’ve shared a general analysis previously, this update will place extra emphasis on key points while introducing new confluences based on the latest data.
Please note that this breakdown is a bit detailed, so I encourage you to read it thoroughly. I may not respond to questions that have already been addressed within the article.
MONTHLY VIEW
Previously, I shared my belief that before the market dips below the current low, it’s more likely to break the current high at $109.9k.
I’ve already explained what I mean by the “current low”—on the higher time frame, that level is around $74.3k.
As I mentioned in my previous article, the current level I’m referring to is the one marked with a blue arrow.
In essence, my view is that the market will likely break the current high on the monthly time frame before any move below that low.
This perspective is important because it shapes how you interpret the market. Having a solid general outlook is essential, it helps you clearly identify the overall trend and avoid getting caught up in short-term noise.
Weekly view
What do you see on my screen?
This is the Bitcoin weekly time frame, and as shown, the market is in an uptrend.
Note:
The first step in any analysis is to identify the overall trend, as I mentioned at the beginning. The trend shapes every decision you make—it determines how you interpret price action on the lower time frames.
Currently, Bitcoin is moving upward on both the monthly and weekly charts.
This confirms that the general market direction is bullish—simply put, the market is trending upward.
Now let’s start breaking things down to explore opportunities on the lower time frames.
We’ll ask key questions like:
• If there’s manipulation on the lower time frames, can we still find chances to buy low?
• Should we sell now or take profit and wait for a re-entry?
Everyone’s goal is to make a profit—and to maximize it, you must develop the habit of buying low and selling high. That’s why many traders are uncertain whether to exit now or wait for a deeper dip or another pump.
Let’s dive deeper into the market structure and clarify this.
$BTC
The current weekly candle closed as a strong bullish candle, clearly indicated on the chart by the blue arrow.
This type of close shows that buyers are currently in control of the market. Given my overall bullish outlook—and the likelihood that we’ll break the current high—I believe it’s safer to continue holding Bitcoin rather than risk missing out on a potential breakout from this zone.
Unless we get a clear, valid reason to confirm a reversal, in this case we can stay patient and wait for a healthy pullback on the lower time frames before considering buy-back strategy.
At the moment, there’s no strong reason to sell, especially with the positive sentiment in the market and the current bullish structure.
Note:
This is a general market outlook, derived from the weekly and monthly time frames.
If we are to see any signs of reversal, confirmation will most likely come from the daily or 4-hour charts.
Keep reading as we zoom into the market for more detailed insights.
One key reason this structure remains bullish is because it does not show the characteristics of a valid triple top pattern.
Here’s why:
📝 There’s no strong bearish rejection at the third peak.
📝 The most recent candle, highlighted with the blue arrow, closed strong and bullish—not with a rejection wick or bearish engulfing pattern.
📝 Price has not broken below the neckline (around $91k), which is a critical condition for confirming a triple top reversal.
These points collectively suggest that the market is still favoring the bullish trend rather than signaling a reversal.
DAILY VIEW
Pay close attention to the blue zone marked on my screen.
As long as the weekly trend remains bullish, our overall bias stays bullish.
However, a reversal could be confirmed if the market starts showing signs of rejection within the $106k–$109k zone.
At the moment, I see no valid reason to sell.
I previously bought at $98k, took my first profit at $104k, and I’m now holding the remaining position in Bitcoin without reinvesting the portion I took out.
I’ve also chosen not to take profits at $106k—I’ll simply leave the rest of the position untouched.
I’m not topping up my position right now because I want to stay ready to buy back lower if we get a healthy pullback.
I’ll only consider adding more to my position after we get a clear breakout confirmation above the current resistance zone.
CONFIRMATION
If we get a strong bullish candle closing above the zone on the daily or 4-hour chart, that would serve as a clear confirmation for a fresh entry. At that point, I’ll be looking to top up my Bitcoin position and ride the next wave upward.
For now, the remaining percentage of my position is still in the market—and it’s more than enough to stay in profit comfortably.
A breakout above $110.5k—especially confirmed on the daily or weekly timeframe—will be my key signal.
As for the 4-hour timeframe, it requires more technical confirmation, so I’ll be actively monitoring it and available to guide on that when the time comes.
Personally, I plan to use limit orders just above the breakout high, as I usually do, to secure a quick and efficient entry when the move is confirmed.
Someone asked: “If the market dips, where should we expect to buy from?”
As I mentioned earlier, if we get confirmation of a dip, I’ll release a detailed article highlighting the specific buy zones and how to approach them.
For now, I still maintain my bullish outlook, with the belief that the market is likely to break through this current zone.
However, I’m being cautious by not committing all my funds until we get a confirmed breakout above $110.5k.
Also, the current zone appears to act as a potential supply level, which is why I’m respecting it and managing my risk carefully—even though I expect it to be broken.
This is the kind of market condition where many traders get confused. That’s why I’ve taken the time to provide clear reasoning and explain how I’m navigating it, all to help benefit each of you.
Conclusion:
I remain bullish based on the weekly close and expect a breakout.
However, I’ve strategically managed my entries to reduce risk until that breakout is confirmed.
If the market shows clear signs of reversal within the $106k–$109k zone, I’ll share an update accordingly.
Every question has been answered — so please take the time to read and understand the full post.❤️📈
💥💥If you found this helpful, like, comment, and share so others can benefit as well.
And for those who often ask for more insights, kindly check my bio for updates.

wow

LightningHunter
·
--
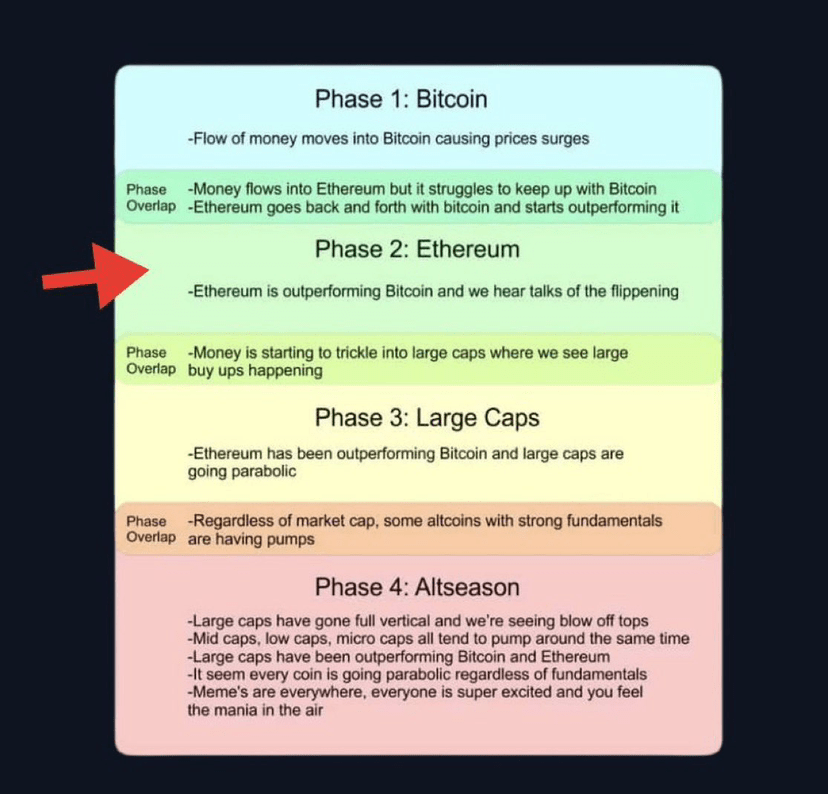
Bullish🚨Phase 2 is starting.
I hope you've been accumulating.
The next 3-6 months could change your life!
🚀So obvs this bull run is happening, 2021 and now 4 years after in 2025 and first BTC pump and now ETH pumps 20-30% in like 24-48 hours and we are in phase 2 and polkadot has pumped 30% in 3 days. If you want to become rich buy $SOL $ETH $DOT $XRP $ADA good alts
I hope you've been accumulating.
The next 3-6 months could change your life!
🚀So obvs this bull run is happening, 2021 and now 4 years after in 2025 and first BTC pump and now ETH pumps 20-30% in like 24-48 hours and we are in phase 2 and polkadot has pumped 30% in 3 days. If you want to become rich buy $SOL $ETH $DOT $XRP $ADA good alts
i’m the one at the bottom

hirad mokhtari
·
--
100% true
Log in to explore more content