
Usman_trading_co
5 Posts

Usman_trading_co
Report
Block User
0 Following
0 Followers
0 Liked
Posts
·
--
Bearish
PEPE/USDT Market Update: Testing Key Levels! 🐸📉
Looking at the current 15m chart, PEPE is showing some interesting volatility. Here is a quick breakdown of the current market condition:
Current Price: $0.00000403 (Down ~6.06% in the last 24h)
24h Range: Low of $0.0000369 📉 | High of $0.0000431 📈
Volume: Strong trading activity with 16.97T PEPE ($66.70M USDT) traded.
Bollinger Bands (BOLL): The price is bouncing back toward the middle band ($0.0000401) after touching a low of $0.0000369, showing signs of a potential short-term recovery or consolidation.
What's your next move?
Are we about to see a bullish rebound from here, or is a deeper dip coming? Drop your thoughts and trading strategies in the comments below! 👇
#pepe #CryptoTrading #BİNANCESQUARE #memecoin s #TechnicalAnalysis_Tickeron
{spot}(PEPEUSDT)
PEPE/USDT Market Update: Testing Key Levels! 🐸📉
Looking at the current 15m chart, PEPE is showing some interesting volatility. Here is a quick breakdown of the current market condition:
Current Price: $0.00000403 (Down ~6.06% in the last 24h)
24h Range: Low of $0.0000369 📉 | High of $0.0000431 📈
Volume: Strong trading activity with 16.97T PEPE ($66.70M USDT) traded.
Bollinger Bands (BOLL): The price is bouncing back toward the middle band ($0.0000401) after touching a low of $0.0000369, showing signs of a potential short-term recovery or consolidation.
What's your next move?
Are we about to see a bullish rebound from here, or is a deeper dip coming? Drop your thoughts and trading strategies in the comments below! 👇
#pepe #CryptoTrading #BİNANCESQUARE #memecoin s #TechnicalAnalysis_Tickeron
Looking at the current 15m chart, PEPE is showing some interesting volatility. Here is a quick breakdown of the current market condition:
Current Price: $0.00000403 (Down ~6.06% in the last 24h)
24h Range: Low of $0.0000369 📉 | High of $0.0000431 📈
Volume: Strong trading activity with 16.97T PEPE ($66.70M USDT) traded.
Bollinger Bands (BOLL): The price is bouncing back toward the middle band ($0.0000401) after touching a low of $0.0000369, showing signs of a potential short-term recovery or consolidation.
What's your next move?
Are we about to see a bullish rebound from here, or is a deeper dip coming? Drop your thoughts and trading strategies in the comments below! 👇
#pepe #CryptoTrading #BİNANCESQUARE #memecoin s #TechnicalAnalysis_Tickeron
113
Article
Read it before it's too late{spot}(USDEBUSDT)
USDEB/USDT Analysis: Is This the Right Time to Buy?
If you are tracking tokenized stocks on Binance, you might have noticed StablecoinX (USDEB) taking a significant hit recently. Let’s break down the current market structure and whether it’s a smart entry point right now.
📊 Current Market Overview
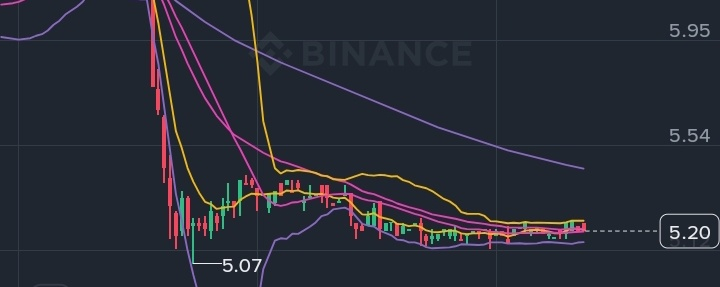
Price Action: USDEB has dropped sharply from its 24-hour high of $6.38 down to $5.07, currently consolidating around $5.20 (-16.93%).
Wider Trend: Looking at the bigger picture, the token is down -20.97% over the last 7 days and -55.82% over the past 30 days, keeping a strong bearish momentum intact.
Technical Setup: On the 15-minute chart, price action has slowed down with Bollinger Bands tightening, indicating a quiet phase before the next major move.
⚠️ Why Buying Right Now is Risky
Upcoming Earnings (Monday, Nov 16): StablecoinX Inc. is scheduled to release its Q3 financial results very soon. Earnings reports often bring extreme volatility—strong numbers could trigger a sharp rebound, while weak data might push the price below the critical $5.00 support level.
Low Weekend Volume: With today being Saturday and traditional US stock markets closed, trading volume is quite thin, making price movements less predictable.
Falling Knife Risk: In trading, catching a falling asset without a clear reversal confirmation can lead to further drawdowns.
💡 Smart Strategy to Approach This:
Wait for Confirmation: It is generally safer to wait for the market to digest the upcoming Q3 earnings report before taking a large position.
Dollar-Cost Averaging (DCA): If you are bullish on the asset and want to enter at these levels, consider deploying only a small portion of your capital (e.g., 20%-30%) now, keeping cash ready in case it dips further.
Risk Management: Always use a strict stop-loss (e.g., just below the $5.00 psychological level) if you are opening a short-term trade.
Disclaimer: This post is for informational purposes only and does not constitute financial advice. Always do your own research before trading tokenized stocks.
Read it before it's too late
USDEB/USDT Analysis: Is This the Right Time to Buy?
If you are tracking tokenized stocks on Binance, you might have noticed StablecoinX (USDEB) taking a significant hit recently. Let’s break down the current market structure and whether it’s a smart entry point right now.
📊 Current Market Overview
Price Action: USDEB has dropped sharply from its 24-hour high of $6.38 down to $5.07, currently consolidating around $5.20 (-16.93%).
Wider Trend: Looking at the bigger picture, the token is down -20.97% over the last 7 days and -55.82% over the past 30 days, keeping a strong bearish momentum intact.
Technical Setup: On the 15-minute chart, price action has slowed down with Bollinger Bands tightening, indicating a quiet phase before the next major move.
⚠️ Why Buying Right Now is Risky
Upcoming Earnings (Monday, Nov 16): StablecoinX Inc. is scheduled to release its Q3 financial results very soon. Earnings reports often bring extreme volatility—strong numbers could trigger a sharp rebound, while weak data might push the price below the critical $5.00 support level.
Low Weekend Volume: With today being Saturday and traditional US stock markets closed, trading volume is quite thin, making price movements less predictable.
Falling Knife Risk: In trading, catching a falling asset without a clear reversal confirmation can lead to further drawdowns.
💡 Smart Strategy to Approach This:
Wait for Confirmation: It is generally safer to wait for the market to digest the upcoming Q3 earnings report before taking a large position.
Dollar-Cost Averaging (DCA): If you are bullish on the asset and want to enter at these levels, consider deploying only a small portion of your capital (e.g., 20%-30%) now, keeping cash ready in case it dips further.
Risk Management: Always use a strict stop-loss (e.g., just below the $5.00 psychological level) if you are opening a short-term trade.
Disclaimer: This post is for informational purposes only and does not constitute financial advice. Always do your own research before trading tokenized stocks.
If you are tracking tokenized stocks on Binance, you might have noticed StablecoinX (USDEB) taking a significant hit recently. Let’s break down the current market structure and whether it’s a smart entry point right now.
📊 Current Market Overview
Price Action: USDEB has dropped sharply from its 24-hour high of $6.38 down to $5.07, currently consolidating around $5.20 (-16.93%).
Wider Trend: Looking at the bigger picture, the token is down -20.97% over the last 7 days and -55.82% over the past 30 days, keeping a strong bearish momentum intact.
Technical Setup: On the 15-minute chart, price action has slowed down with Bollinger Bands tightening, indicating a quiet phase before the next major move.
⚠️ Why Buying Right Now is Risky
Upcoming Earnings (Monday, Nov 16): StablecoinX Inc. is scheduled to release its Q3 financial results very soon. Earnings reports often bring extreme volatility—strong numbers could trigger a sharp rebound, while weak data might push the price below the critical $5.00 support level.
Low Weekend Volume: With today being Saturday and traditional US stock markets closed, trading volume is quite thin, making price movements less predictable.
Falling Knife Risk: In trading, catching a falling asset without a clear reversal confirmation can lead to further drawdowns.
💡 Smart Strategy to Approach This:
Wait for Confirmation: It is generally safer to wait for the market to digest the upcoming Q3 earnings report before taking a large position.
Dollar-Cost Averaging (DCA): If you are bullish on the asset and want to enter at these levels, consider deploying only a small portion of your capital (e.g., 20%-30%) now, keeping cash ready in case it dips further.
Risk Management: Always use a strict stop-loss (e.g., just below the $5.00 psychological level) if you are opening a short-term trade.
Disclaimer: This post is for informational purposes only and does not constitute financial advice. Always do your own research before trading tokenized stocks.
80
{spot}(BTCUSDT)
😉Bitcoin (BTC/USDT) Market Overview
Current Price & Drop: Bitcoin is trading around $69,129 to $69,149, facing strong downward pressure with a daily drop of approximately -3.65% to -4.01%.
Trend & Timeframes: Over the past 7 days, BTC has dropped by about -9.14%, reflecting ongoing volatility and uncertainty in the market.
Order Book Activity: The order book shows heavy shifts between buying (bids) and selling (asks) pressure, signaling high market tension as traders battle near the $69k support level.
#BTC
😉Bitcoin (BTC/USDT) Market Overview
Current Price & Drop: Bitcoin is trading around $69,129 to $69,149, facing strong downward pressure with a daily drop of approximately -3.65% to -4.01%.
Trend & Timeframes: Over the past 7 days, BTC has dropped by about -9.14%, reflecting ongoing volatility and uncertainty in the market.
Order Book Activity: The order book shows heavy shifts between buying (bids) and selling (asks) pressure, signaling high market tension as traders battle near the $69k support level.
#BTC
Current Price & Drop: Bitcoin is trading around $69,129 to $69,149, facing strong downward pressure with a daily drop of approximately -3.65% to -4.01%.
Trend & Timeframes: Over the past 7 days, BTC has dropped by about -9.14%, reflecting ongoing volatility and uncertainty in the market.
Order Book Activity: The order book shows heavy shifts between buying (bids) and selling (asks) pressure, signaling high market tension as traders battle near the $69k support level.
#BTC
109
Log in to explore more content
Join global crypto users on Binance Square
⚡️ Get latest and useful information about crypto.
💬 Trusted by the world’s largest crypto exchange.
👍 Discover real insights from verified creators.
Email / Phone number
Trending Topics
CryptoSelloffTriggersMultipleWhaleLiquidations
133,152 views
1,479 Discussing
Crypto Liquidations Top $2B in 24 Hours as 329,000 Traders Are Wiped Out
Binance News
·35 Likes
·42.9k views
USSpotXRPETFsSeeLargestWeeklyOutflowIn8Months
127,410 views
1,411 Discussing
WillFOMCMinutesReinforceRateHikeExpectations?
33,427 views
624 Discussing