

欧鹏
4.7k Posts

欧鹏
Report
Block User
趋势交易|公众号:欧鹏说|邀请码77VIP|
Frequent Trader
2.7 Years
9 Following
2.6K+ Followers
4.6K+ Liked
Posts
All
Quotes
Videos
Live
·
--
Verified
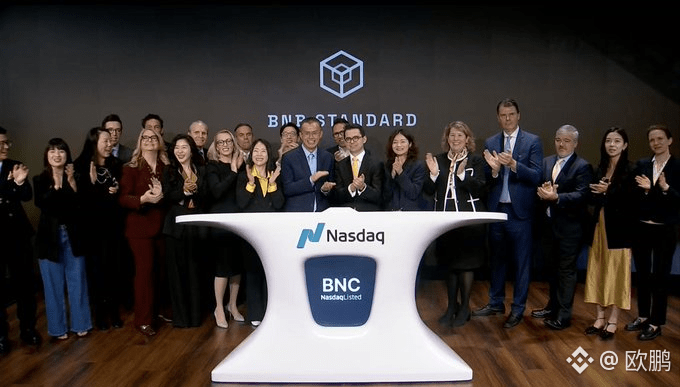
CZ appears at the Nasdaq bell-ringing livestream for the BNB treasury company, unable to hide his excitement 🎉
The world’s largest corporate BNB reserve holder, BNB Standard Corporation (Nasdaq ticker: BNC), rang the opening bell today at the Nasdaq building in Times Square, New York, to celebrate the company’s rebrand and the appointment of its new CEO, Alex Odagiu.
The company was formerly known as CEA Industries and officially changed its name on September 29. Its core business is managing a corporate BNB treasury, and it plans to operate validator nodes on BNB Chain.
The company’s future is now deeply tied to Binance. If you missed the early $BNB , don’t miss $BNC again 🥂
{future}(BNCUSDT)
{spot}(BNCBUSDT)
CZ appears at the Nasdaq bell-ringing livestream for the BNB treasury company, unable to hide his excitement 🎉
The world’s largest corporate BNB reserve holder, BNB Standard Corporation (Nasdaq ticker: BNC), rang the opening bell today at the Nasdaq building in Times Square, New York, to celebrate the company’s rebrand and the appointment of its new CEO, Alex Odagiu.
The company was formerly known as CEA Industries and officially changed its name on September 29. Its core business is managing a corporate BNB treasury, and it plans to operate validator nodes on BNB Chain.
The company’s future is now deeply tied to Binance. If you missed the early $BNB , don’t miss $BNC again 🥂
The world’s largest corporate BNB reserve holder, BNB Standard Corporation (Nasdaq ticker: BNC), rang the opening bell today at the Nasdaq building in Times Square, New York, to celebrate the company’s rebrand and the appointment of its new CEO, Alex Odagiu.
The company was formerly known as CEA Industries and officially changed its name on September 29. Its core business is managing a corporate BNB treasury, and it plans to operate validator nodes on BNB Chain.
The company’s future is now deeply tied to Binance. If you missed the early $BNB , don’t miss $BNC again 🥂

1
95
·
--
Verified
#sk海力士据报拟派特别股息 SK Hynix plans to return about 80% of the proceeds from the sale of its stake in Japan’s Kioxia to shareholders in the form of a special dividend, totaling about 16 trillion won (about $12 billion).
But don’t think this is a positive and rush to bottom-fish Hynix (Korea $SKHYNIX , U.S. stock $SKHY ). As I said in my previous post, this week’s #股票财报季 Federal Reserve rate decision and earnings from major tech companies will also determine the direction of the stock market. Please wait patiently for key signals or follow my messages.
{future}(SKHYUSDT)
{future}(SKHYNIXUSDT)
#sk海力士据报拟派特别股息 SK Hynix plans to return about 80% of the proceeds from the sale of its stake in Japan’s Kioxia to shareholders in the form of a special dividend, totaling about 16 trillion won (about $12 billion).
But don’t think this is a positive and rush to bottom-fish Hynix (Korea $SKHYNIX , U.S. stock $SKHY ). As I said in my previous post, this week’s #股票财报季 Federal Reserve rate decision and earnings from major tech companies will also determine the direction of the stock market. Please wait patiently for key signals or follow my messages.
But don’t think this is a positive and rush to bottom-fish Hynix (Korea $SKHYNIX , U.S. stock $SKHY ). As I said in my previous post, this week’s #股票财报季 Federal Reserve rate decision and earnings from major tech companies will also determine the direction of the stock market. Please wait patiently for key signals or follow my messages.
欧鹏
·
--
#股票财报季 This week's Fed rate decision and big tech earnings are in focus.
Here are the key events and assets to watch this week:
Monday: Earnings: $VZ
Tuesday: Earnings: $BA, $KO, $V
Wednesday: Fed rate decision (FOMC)
Wednesday: Earnings: $GOOGL , $MSFT
Thursday: Q3 GDP and core PCE
Thursday: Earnings: $AMZN , $MA, $LLY
Friday: Earnings: $XOM, $CVX, $ABBV
Here are the key events and assets to watch this week:
Monday: Earnings: $VZ
Tuesday: Earnings: $BA, $KO, $V
Wednesday: Fed rate decision (FOMC)
Wednesday: Earnings: $GOOGL , $MSFT
Thursday: Q3 GDP and core PCE
Thursday: Earnings: $AMZN , $MA, $LLY
Friday: Earnings: $XOM, $CVX, $ABBV
1
2.2k
·
--
Verified
#股票财报季 This week's Fed rate decision and big tech earnings are in focus.
Here are the key events and assets to watch this week:
Monday: Earnings: $VZ
Tuesday: Earnings: $BA, $KO, $V
Wednesday: Fed rate decision (FOMC)
Wednesday: Earnings: $GOOGL , $MSFT
Thursday: Q3 GDP and core PCE
Thursday: Earnings: $AMZN , $MA, $LLY
Friday: Earnings: $XOM, $CVX, $ABBV
#股票财报季 This week's Fed rate decision and big tech earnings are in focus.
Here are the key events and assets to watch this week:
Monday: Earnings: $VZ
Tuesday: Earnings: $BA, $KO, $V
Wednesday: Fed rate decision (FOMC)
Wednesday: Earnings: $GOOGL , $MSFT
Thursday: Q3 GDP and core PCE
Thursday: Earnings: $AMZN , $MA, $LLY
Friday: Earnings: $XOM, $CVX, $ABBV
Here are the key events and assets to watch this week:
Monday: Earnings: $VZ
Tuesday: Earnings: $BA, $KO, $V
Wednesday: Fed rate decision (FOMC)
Wednesday: Earnings: $GOOGL , $MSFT
Thursday: Q3 GDP and core PCE
Thursday: Earnings: $AMZN , $MA, $LLY
Friday: Earnings: $XOM, $CVX, $ABBV
2
1
3
10k
·
--
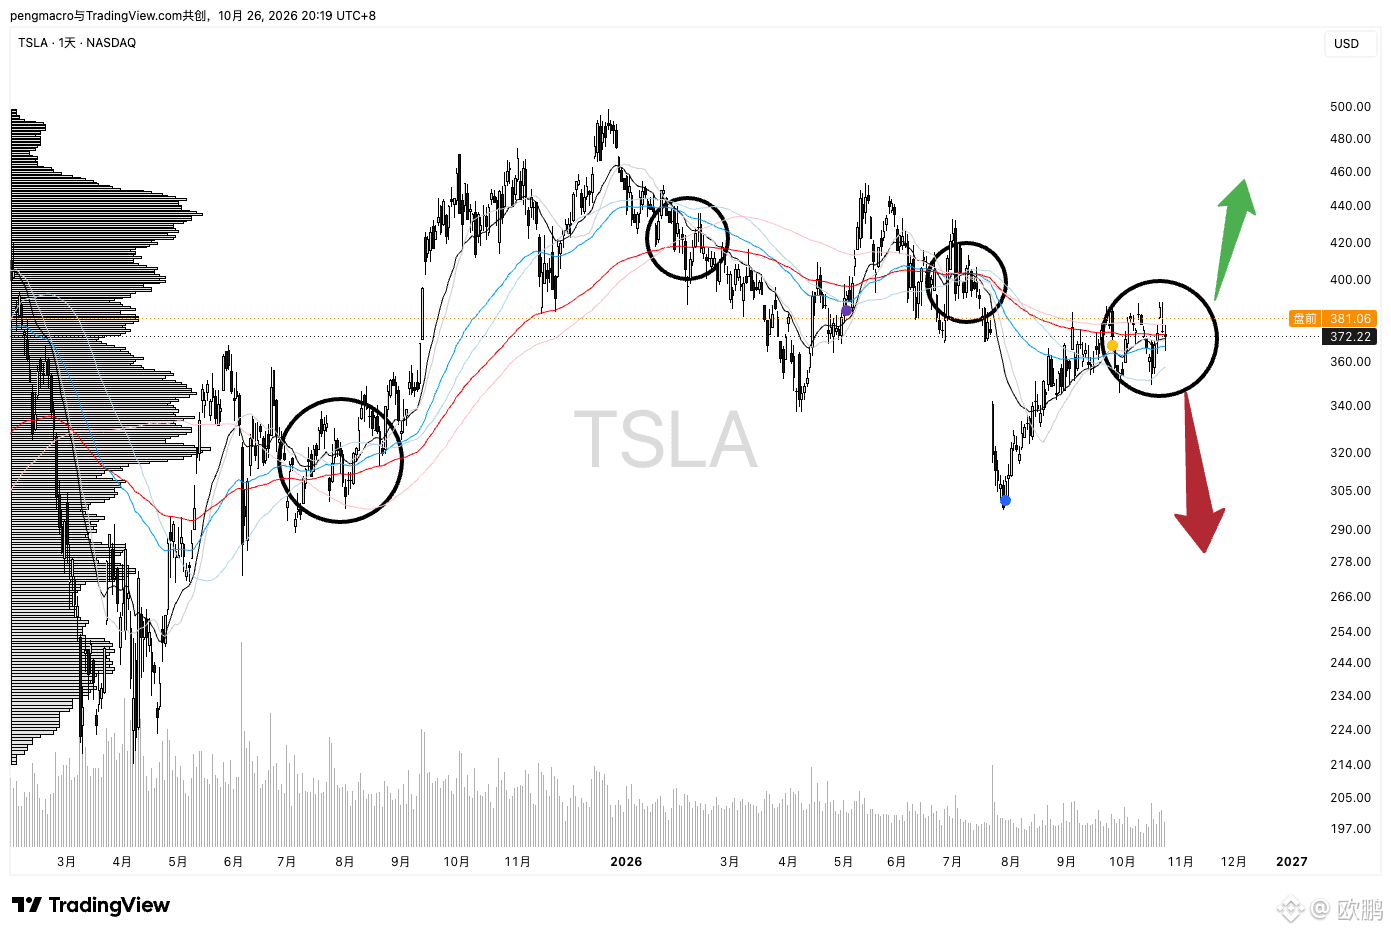
Barclays just upgraded $TSLA to Overweight, with a $450 price target 🚀
The reason: “Robotaxi miles have reached a sharp inflection point”
Tesla has now logged nearly 2 million miles of unsupervised driving, an increase of about 8x last quarter. Meanwhile, FSD adoption among newly delivered vehicles in North America has exceeded 75%.
The charts show Tesla’s moving averages converging once again. If positive news breaks this week, Tesla could return to its long-term uptrend; if the news is negative, the bears could take control and the decline could continue, as it did the previous two times.
{future}(TSLAUSDT)
Barclays just upgraded $TSLA to Overweight, with a $450 price target 🚀
The reason: “Robotaxi miles have reached a sharp inflection point”
Tesla has now logged nearly 2 million miles of unsupervised driving, an increase of about 8x last quarter. Meanwhile, FSD adoption among newly delivered vehicles in North America has exceeded 75%.
The charts show Tesla’s moving averages converging once again. If positive news breaks this week, Tesla could return to its long-term uptrend; if the news is negative, the bears could take control and the decline could continue, as it did the previous two times.
The reason: “Robotaxi miles have reached a sharp inflection point”
Tesla has now logged nearly 2 million miles of unsupervised driving, an increase of about 8x last quarter. Meanwhile, FSD adoption among newly delivered vehicles in North America has exceeded 75%.
The charts show Tesla’s moving averages converging once again. If positive news breaks this week, Tesla could return to its long-term uptrend; if the news is negative, the bears could take control and the decline could continue, as it did the previous two times.
1
288
·
--
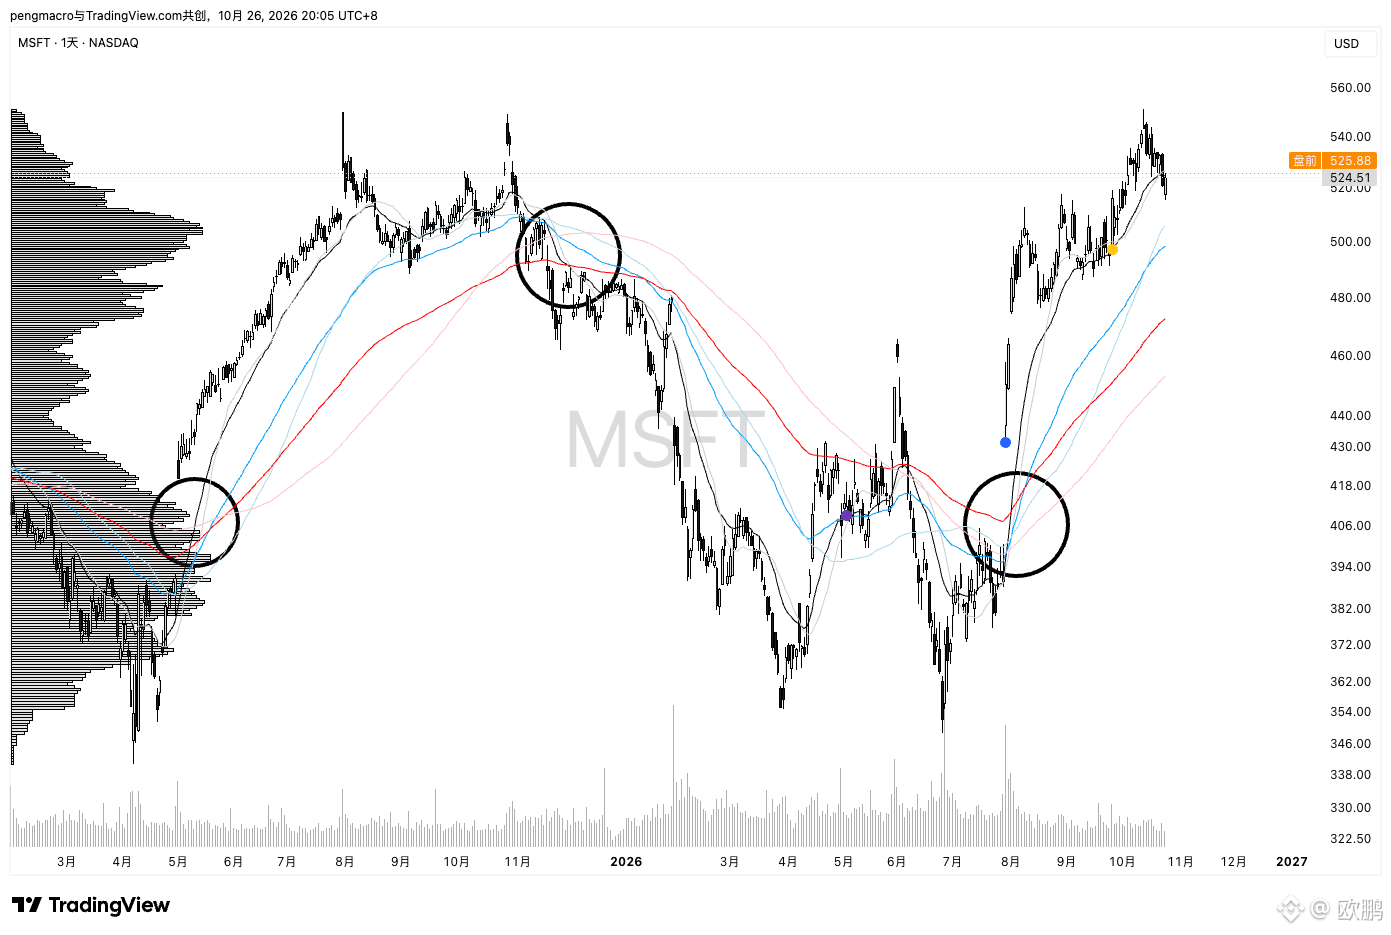
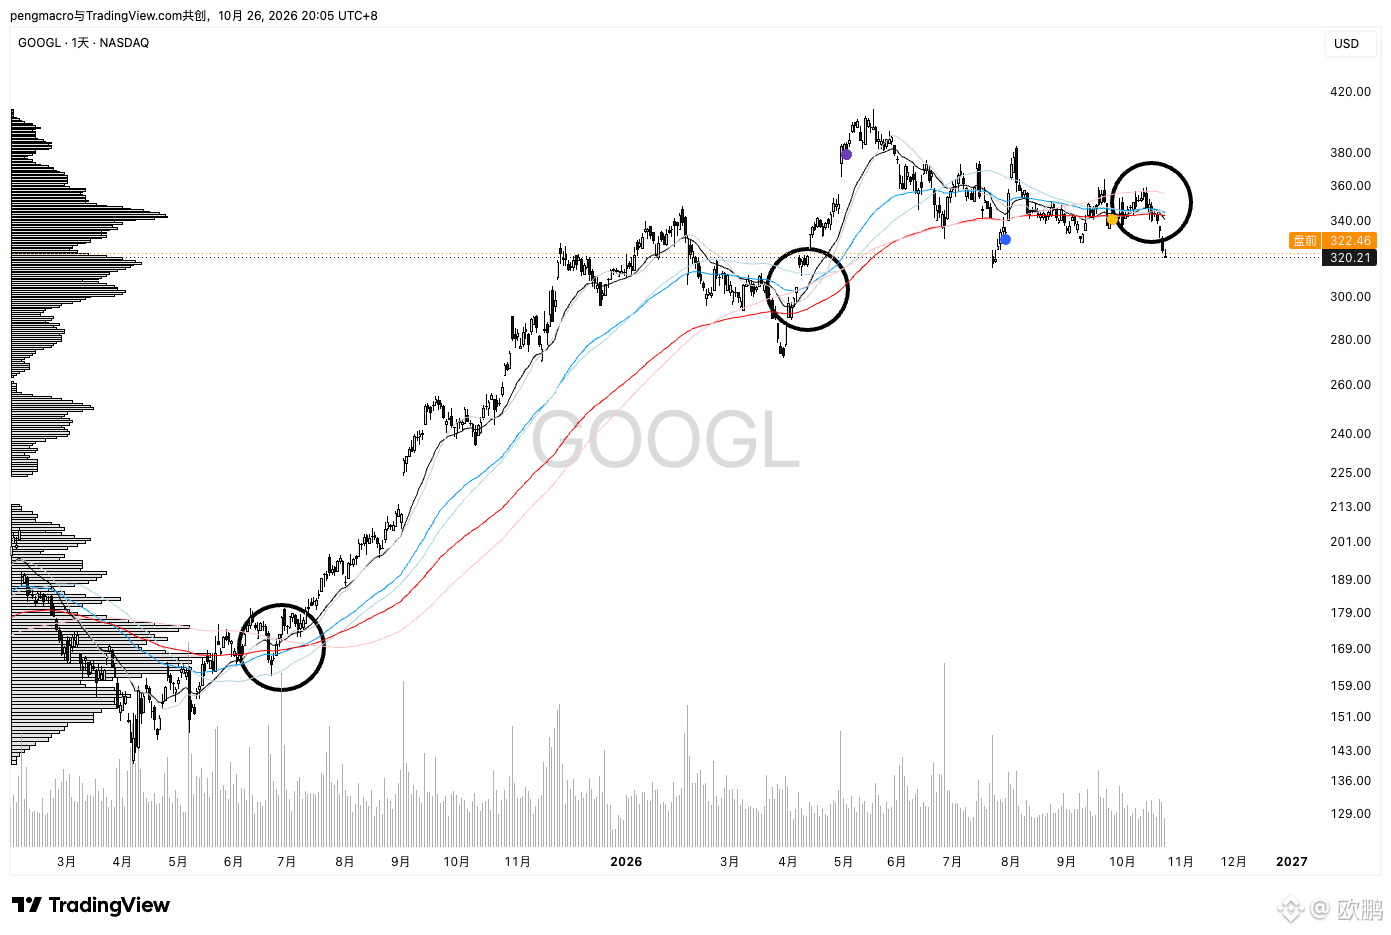
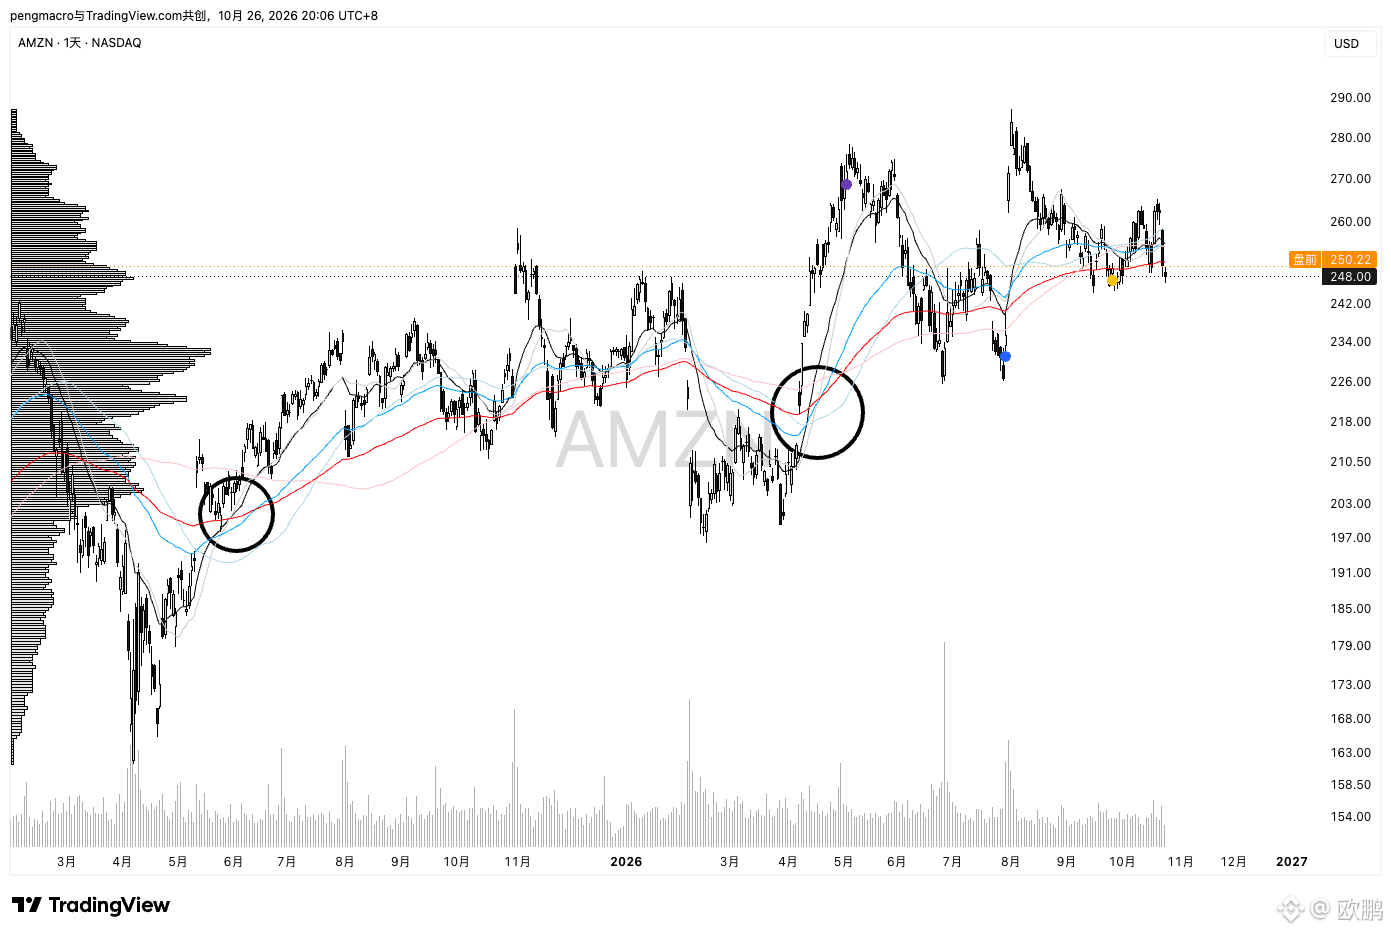
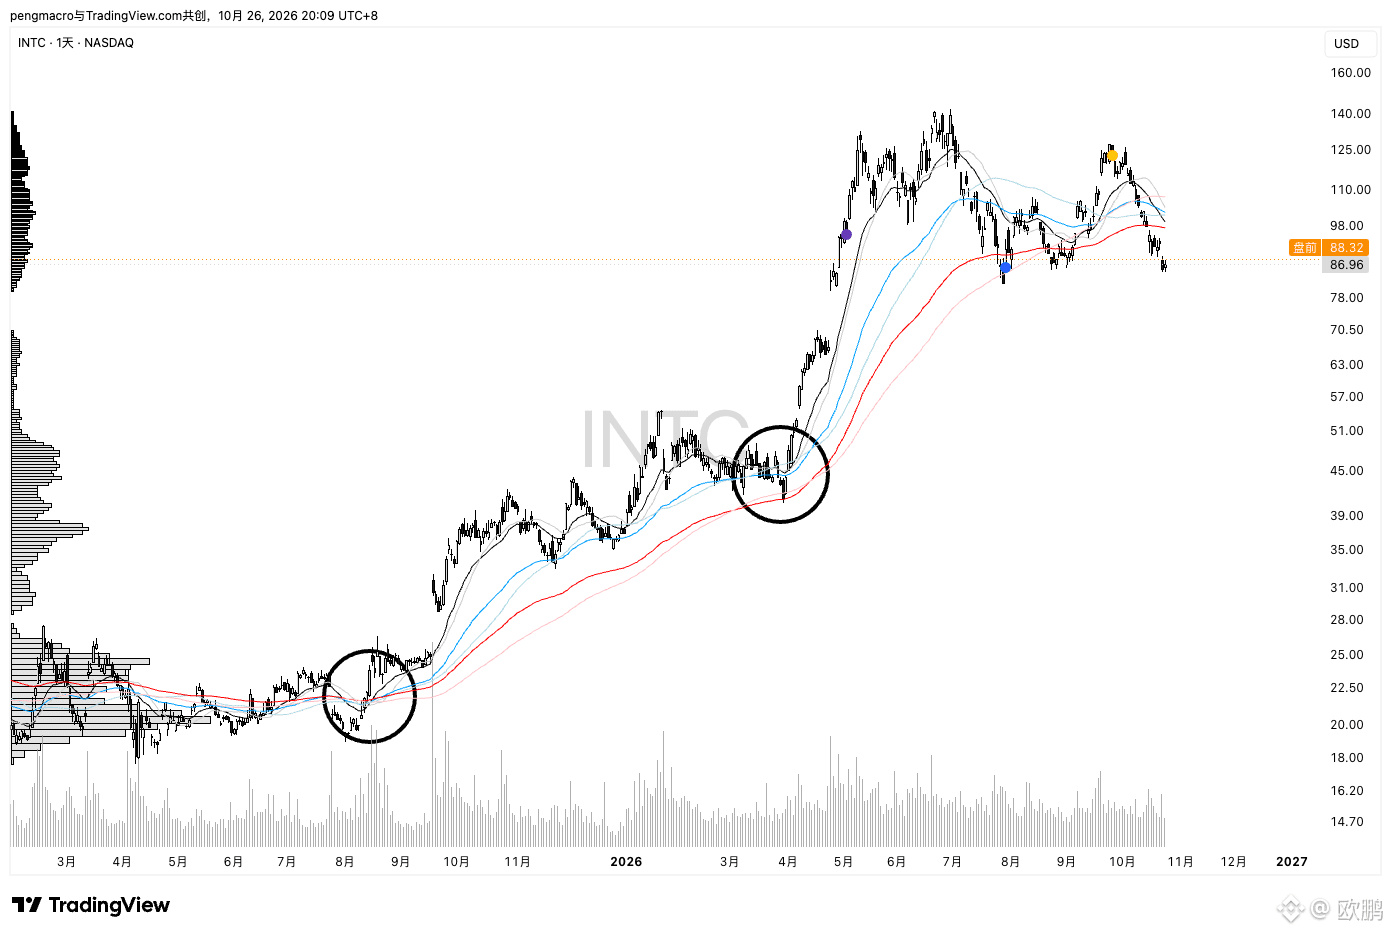
One week, two major tests.
The Fed will decide on interest rates on Wednesday.
Microsoft $MSFT , Alphabet $GOOGL , and Amazon $AMZN will report earnings.
Which will have a bigger impact on the markets? 👀
One week, two major tests.
The Fed will decide on interest rates on Wednesday.
Microsoft $MSFT , Alphabet $GOOGL , and Amazon $AMZN will report earnings.
Which will have a bigger impact on the markets? 👀
The Fed will decide on interest rates on Wednesday.
Microsoft $MSFT , Alphabet $GOOGL , and Amazon $AMZN will report earnings.
Which will have a bigger impact on the markets? 👀
1
243
·
--
Verified
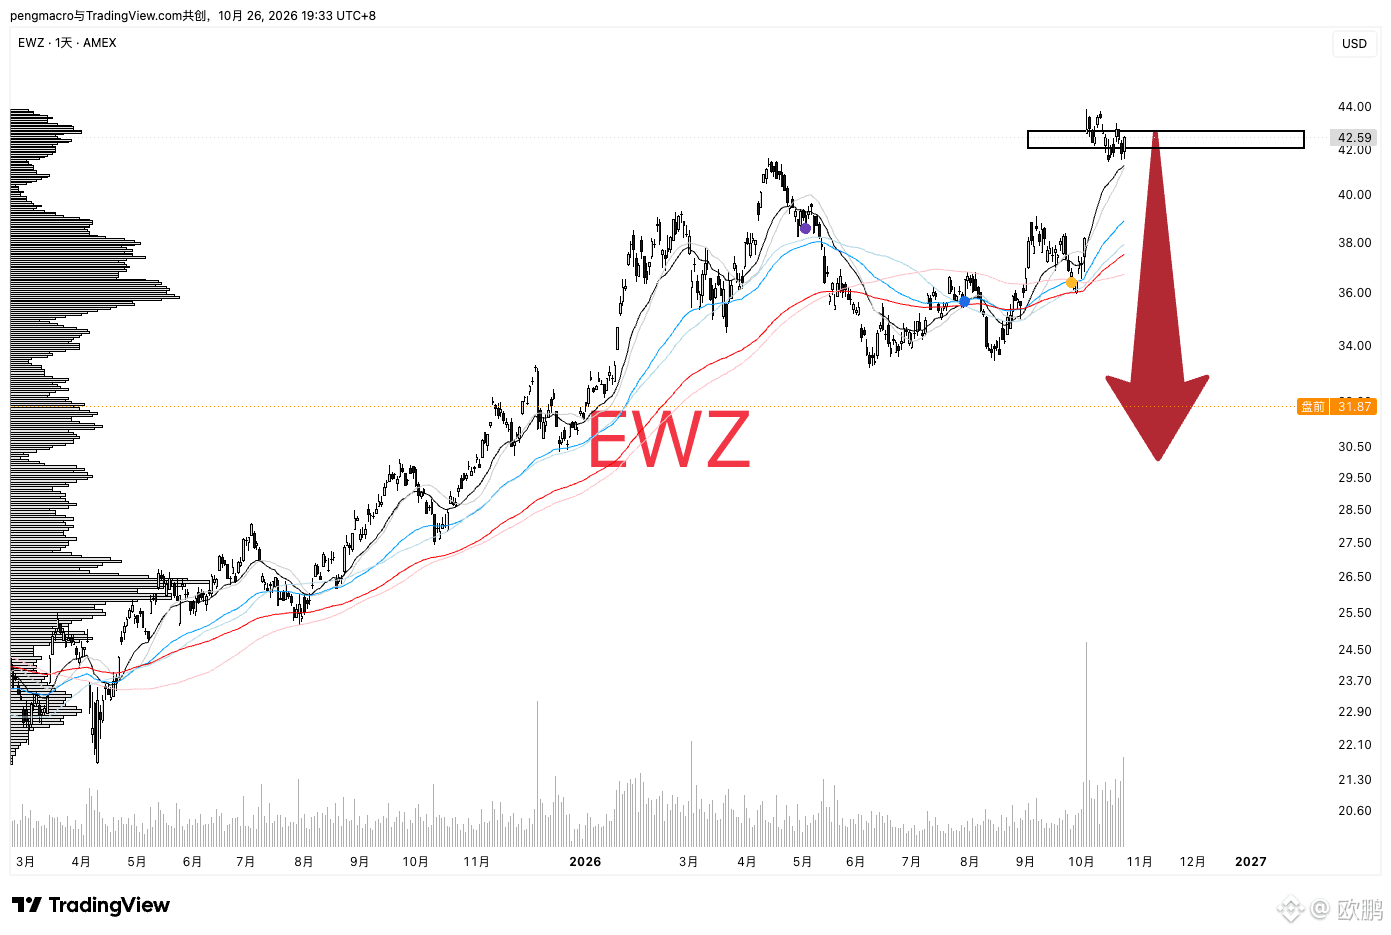
Has the Brazilian stock market crashed?❓$EWZ Last week's closing price was $42.59, but in premarket trading today, the price plunged to $31.8‼️Would you dare to buy the dip?
EWZ is a Brazil-focused ETF from BlackRock's iShares, officially named the iShares MSCI Brazil ETF. Listed on the NYSE Arca, it's the most widely used vehicle globally for trading the Brazilian stock market.
It tracks the MSCI Brazil 25/50 Index, covering large- and mid-cap Brazilian stocks and approximately 85% of the country's total market capitalization. Its holdings are heavily concentrated in three cyclical sectors: financials, energy, and materials. Key holdings include leading Brazilian companies such as Itaú Unibanco, Vale, and Petrobras.
Key details: Launched in July 2000, with an expense ratio of 0.59%, it is currently the largest and most liquid single-country Brazil equity ETF.
{future}(EWZUSDT)
Has the Brazilian stock market crashed?❓$EWZ Last week's closing price was $42.59, but in premarket trading today, the price plunged to $31.8‼️Would you dare to buy the dip?
EWZ is a Brazil-focused ETF from BlackRock's iShares, officially named the iShares MSCI Brazil ETF. Listed on the NYSE Arca, it's the most widely used vehicle globally for trading the Brazilian stock market.
It tracks the MSCI Brazil 25/50 Index, covering large- and mid-cap Brazilian stocks and approximately 85% of the country's total market capitalization. Its holdings are heavily concentrated in three cyclical sectors: financials, energy, and materials. Key holdings include leading Brazilian companies such as Itaú Unibanco, Vale, and Petrobras.
Key details: Launched in July 2000, with an expense ratio of 0.59%, it is currently the largest and most liquid single-country Brazil equity ETF.
EWZ is a Brazil-focused ETF from BlackRock's iShares, officially named the iShares MSCI Brazil ETF. Listed on the NYSE Arca, it's the most widely used vehicle globally for trading the Brazilian stock market.
It tracks the MSCI Brazil 25/50 Index, covering large- and mid-cap Brazilian stocks and approximately 85% of the country's total market capitalization. Its holdings are heavily concentrated in three cyclical sectors: financials, energy, and materials. Key holdings include leading Brazilian companies such as Itaú Unibanco, Vale, and Petrobras.
Key details: Launched in July 2000, with an expense ratio of 0.59%, it is currently the largest and most liquid single-country Brazil equity ETF.
2
578
·
--
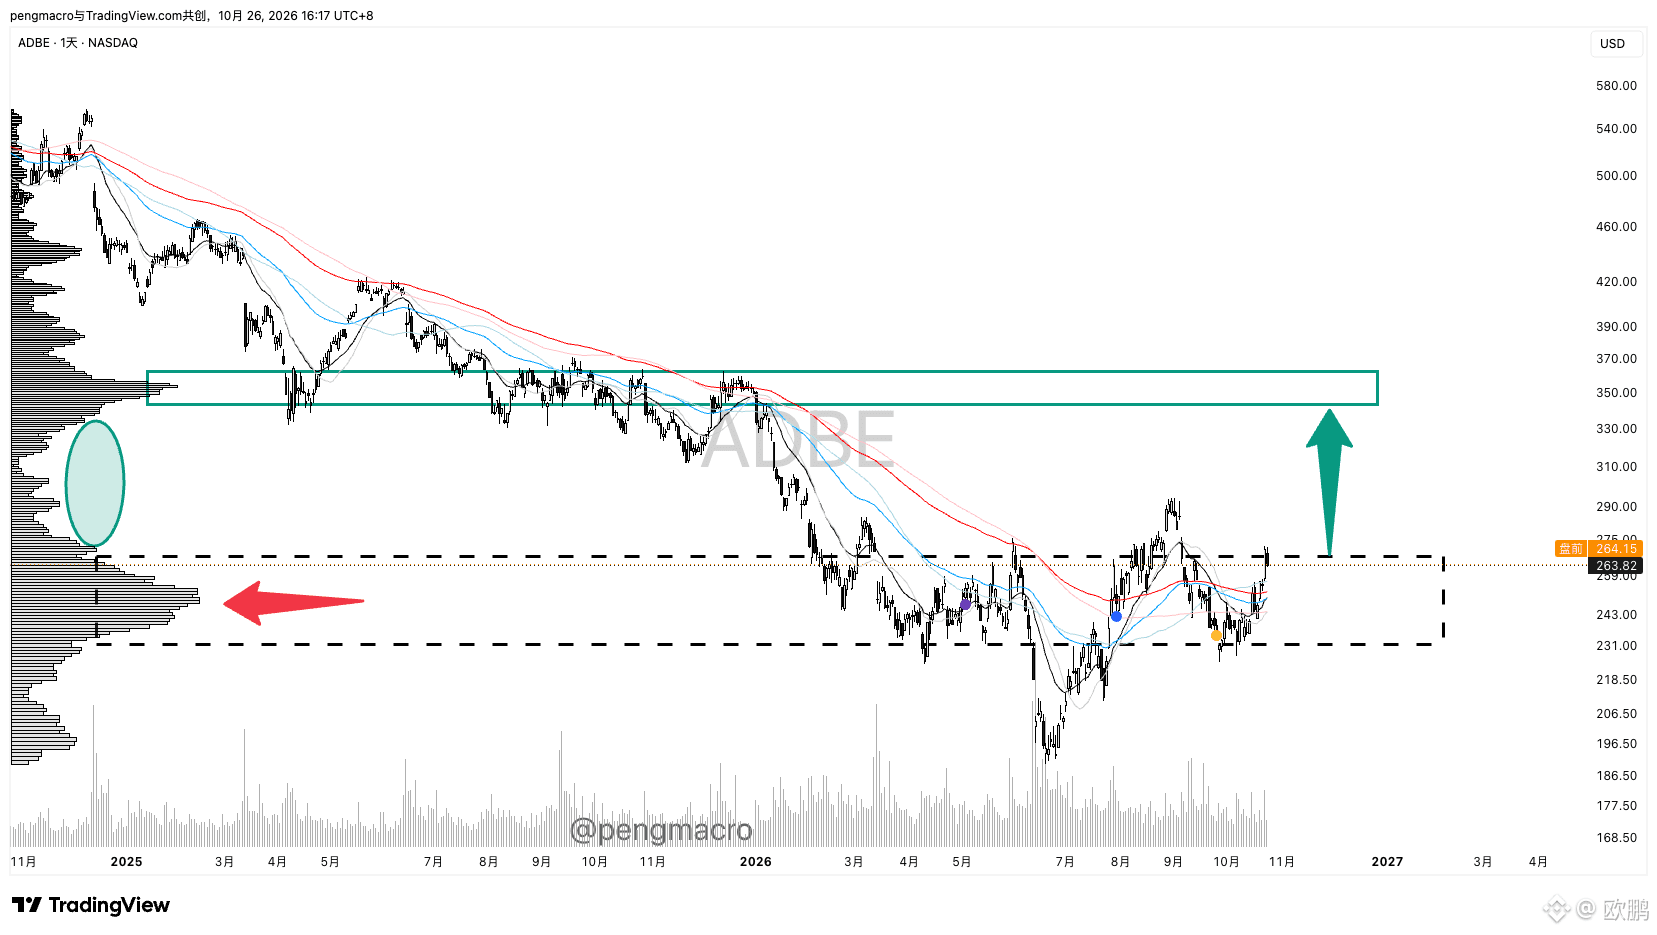
$ADBE has quietly rebounded 60% from its low of 168 and is now at the upper edge of the 232–268 trading range.
Six moving averages are tightly intertwined around 250–270—a setup for a potential move.
If positive news triggers a high-volume breakout above 275, the 270–340 range above is a volume vacuum with thin liquidity, and the price could be pulled directly toward the dense trading area at 345–370.
{future}(ADBEUSDT)
$ADBE has quietly rebounded 60% from its low of 168 and is now at the upper edge of the 232–268 trading range.
Six moving averages are tightly intertwined around 250–270—a setup for a potential move.
If positive news triggers a high-volume breakout above 275, the 270–340 range above is a volume vacuum with thin liquidity, and the price could be pulled directly toward the dense trading area at 345–370.
Six moving averages are tightly intertwined around 250–270—a setup for a potential move.
If positive news triggers a high-volume breakout above 275, the 270–340 range above is a volume vacuum with thin liquidity, and the price could be pulled directly toward the dense trading area at 345–370.
1
63
·
--
Bullish
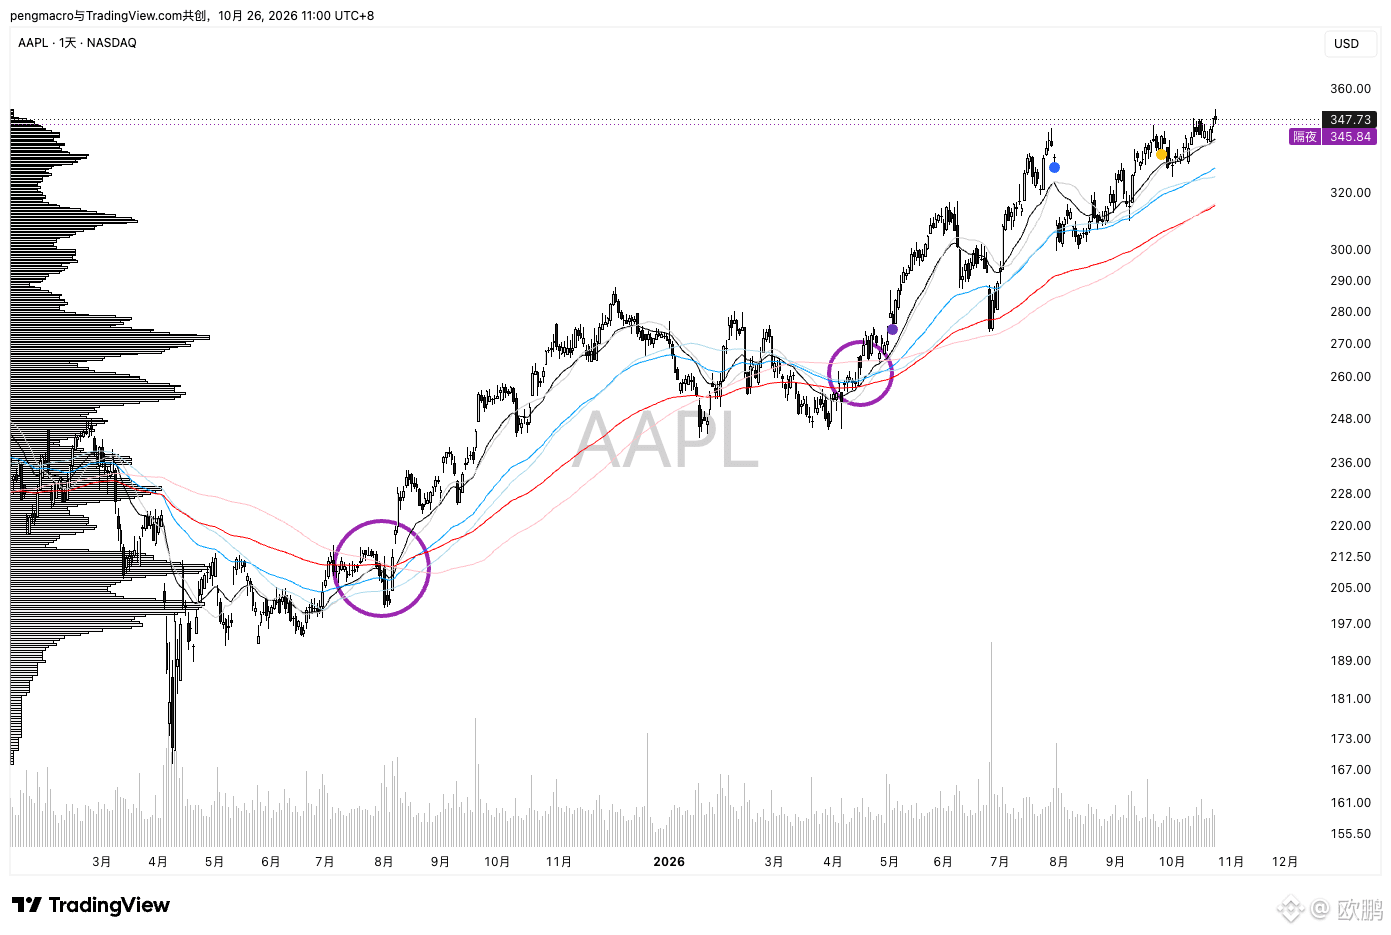
Apple $AAPL will launch its first touchscreen Mac on Wednesday, pushing the boundaries once again?
According to Bloomberg’s Mark Gurman, it’s a new high-end MacBook Pro💻
- OLED touchscreen, a first for the Mac
- Dynamic Island, similar to the iPhone
- 14-inch and 16-inch sizes
- Priced well above the current $2,499 MacBook Pro
{future}(AAPLUSDT)
Apple $AAPL will launch its first touchscreen Mac on Wednesday, pushing the boundaries once again?
According to Bloomberg’s Mark Gurman, it’s a new high-end MacBook Pro💻
- OLED touchscreen, a first for the Mac
- Dynamic Island, similar to the iPhone
- 14-inch and 16-inch sizes
- Priced well above the current $2,499 MacBook Pro
According to Bloomberg’s Mark Gurman, it’s a new high-end MacBook Pro💻
- OLED touchscreen, a first for the Mac
- Dynamic Island, similar to the iPhone
- 14-inch and 16-inch sizes
- Priced well above the current $2,499 MacBook Pro
203
·
--
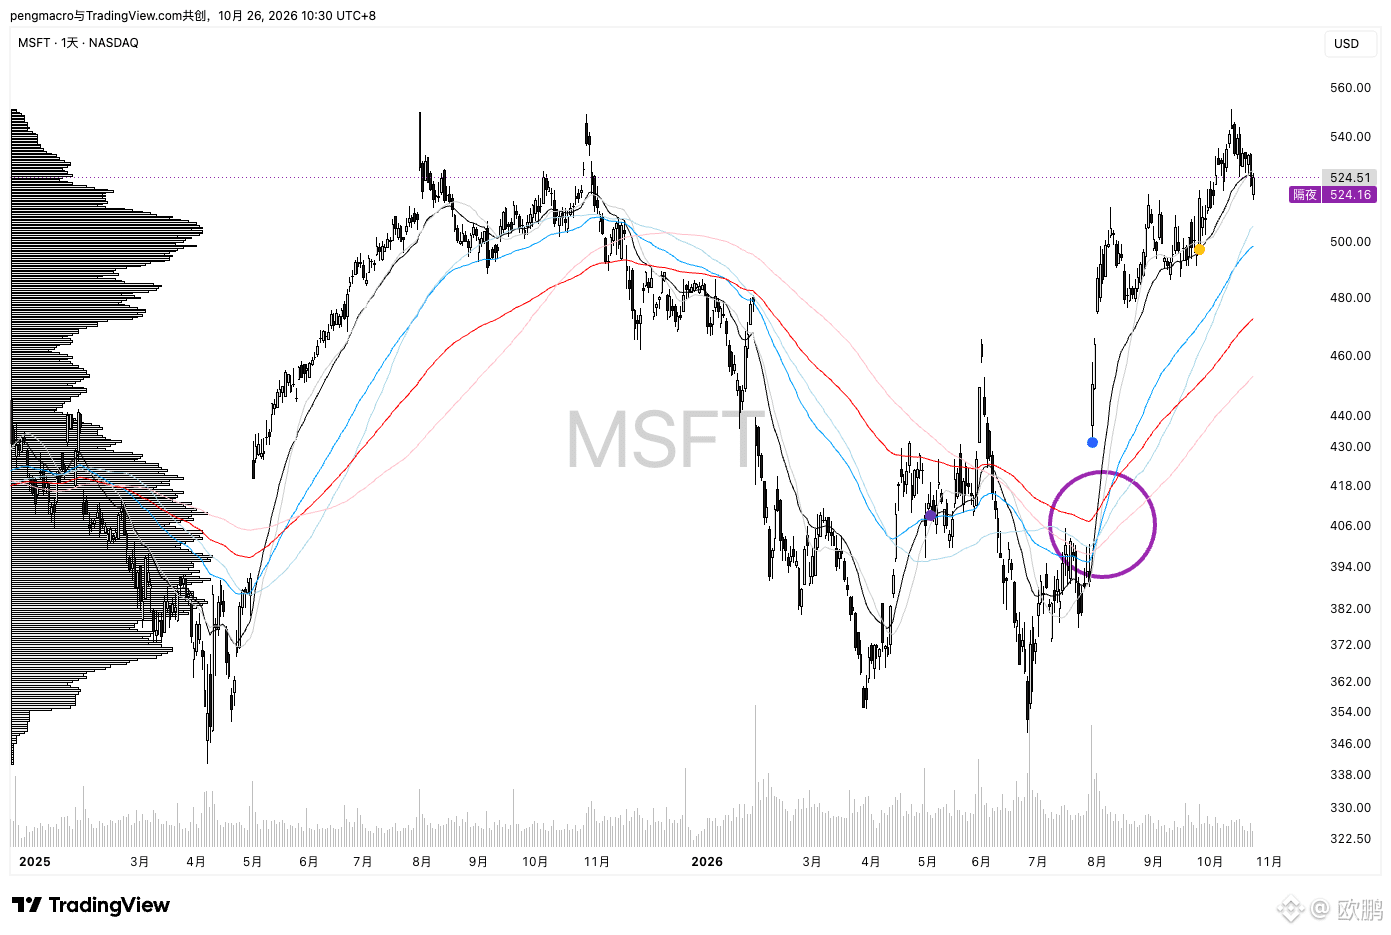
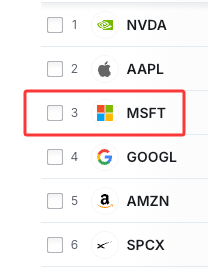
Microsoft's market cap once again surpasses Google's $MSFT $GOOGL
Microsoft becomes the world's third-largest stock again
Microsoft's market cap once again surpasses Google's $MSFT $GOOGL
Microsoft becomes the world's third-largest stock again
Microsoft becomes the world's third-largest stock again
250
·
--
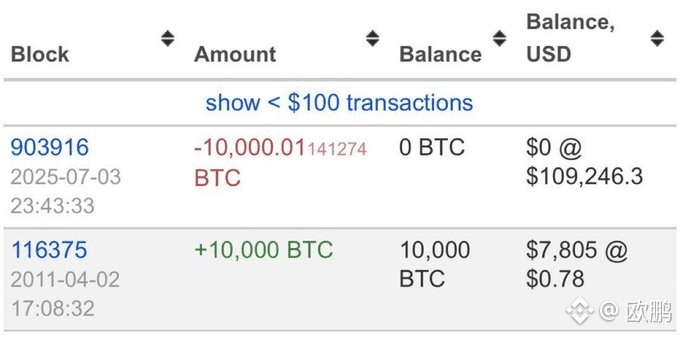
Someone bought 10,000 bitcoins in 2011 for just $7,805, when BTC was trading at $0.78.
He weathered multiple market crashes and held on to his bitcoins for nearly 14 years without selling a single one.
Then, in 2025, he sold all his bitcoins for more than $1 billion, earning a 128,205-fold return on his investment.
Someone bought 10,000 bitcoins in 2011 for just $7,805, when BTC was trading at $0.78.
He weathered multiple market crashes and held on to his bitcoins for nearly 14 years without selling a single one.
Then, in 2025, he sold all his bitcoins for more than $1 billion, earning a 128,205-fold return on his investment.
He weathered multiple market crashes and held on to his bitcoins for nearly 14 years without selling a single one.
Then, in 2025, he sold all his bitcoins for more than $1 billion, earning a 128,205-fold return on his investment.
277
·
--
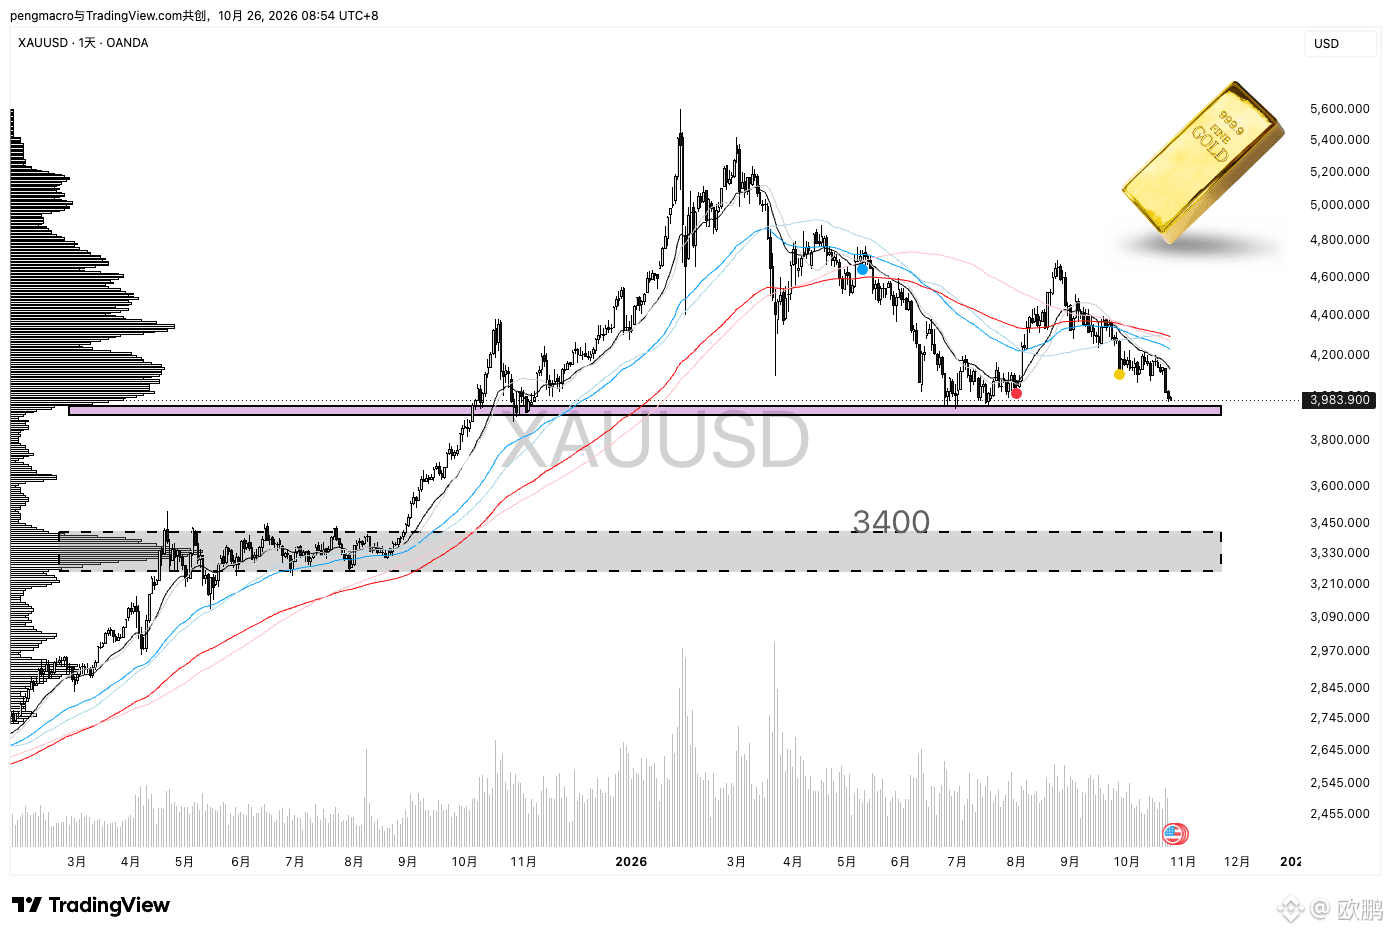
Gold has broken below $4,000 on the daily chart and is now testing the previous support platform around $3,950, marked in purple. Short-term moving averages have turned downward and formed a bearish alignment, with the overall trend remaining weak.
This support is the key line of defense right now. If it breaks decisively, the area below is a low-liquidity gap with limited buying support, and prices could quickly move toward the dense support zone around $3,400.$XAU
{future}(XAUUSDT)
Gold has broken below $4,000 on the daily chart and is now testing the previous support platform around $3,950, marked in purple. Short-term moving averages have turned downward and formed a bearish alignment, with the overall trend remaining weak.
This support is the key line of defense right now. If it breaks decisively, the area below is a low-liquidity gap with limited buying support, and prices could quickly move toward the dense support zone around $3,400.$XAU
This support is the key line of defense right now. If it breaks decisively, the area below is a low-liquidity gap with limited buying support, and prices could quickly move toward the dense support zone around $3,400.$XAU
513
·
--
The crypto bear market is over, and the market has officially moved out of its bottoming range.
We are now in the retest-and-confirmation phase following the bear market bottom and the first breakout.
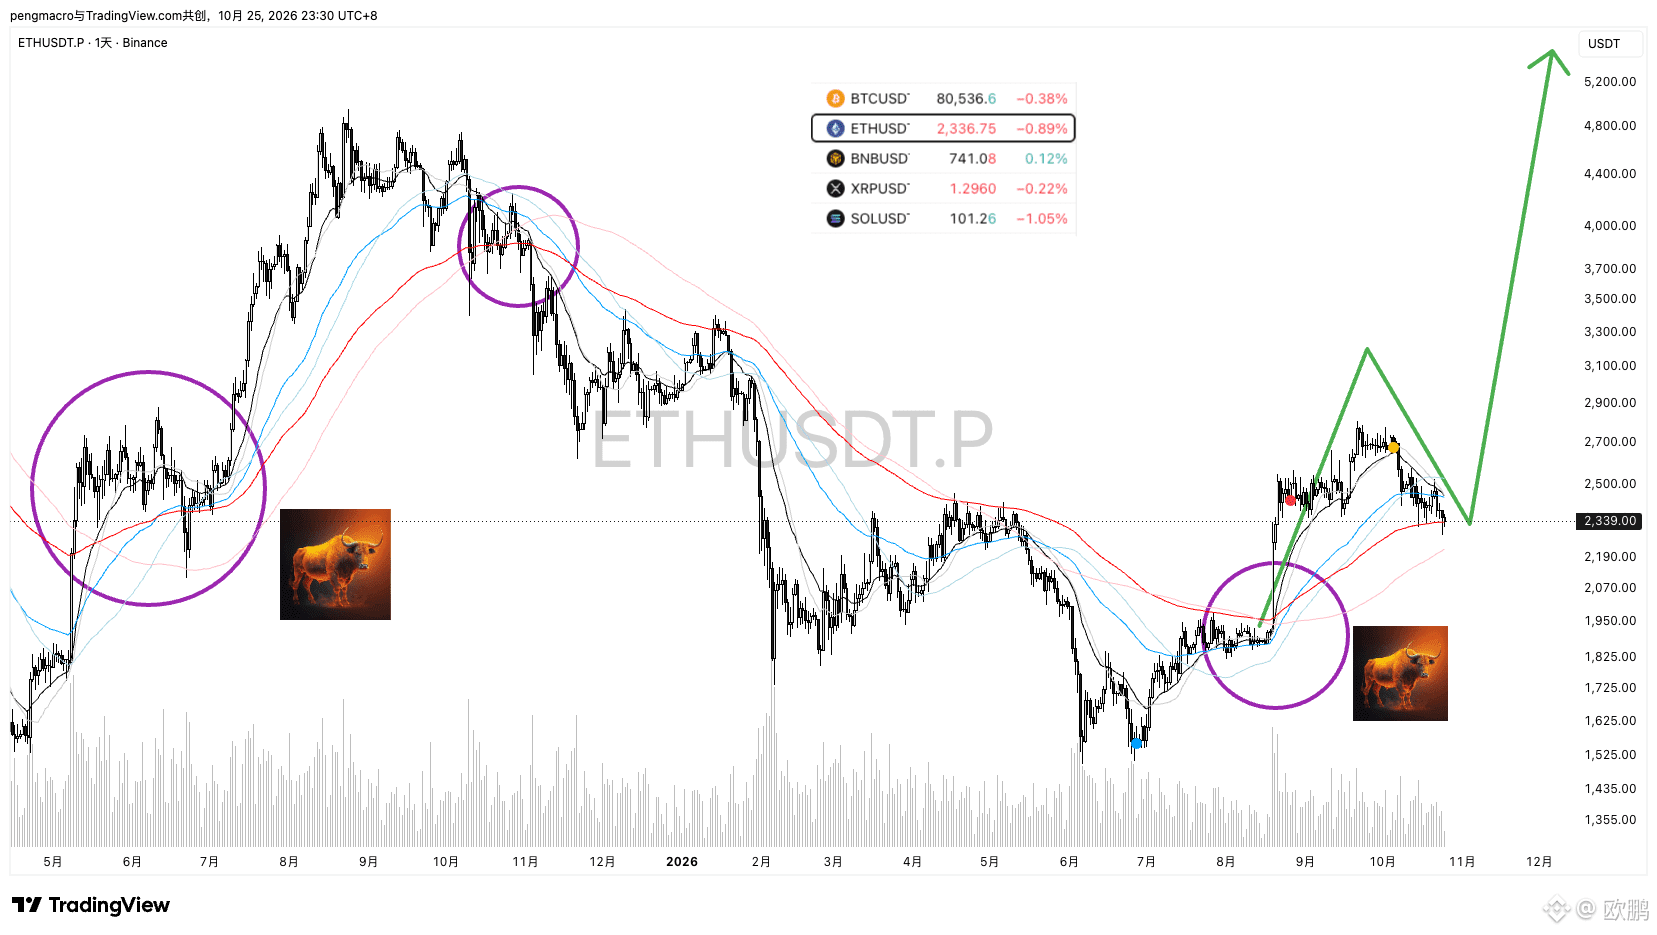
ETH’s daily chart fully confirms this structure: the price rose from its lows, and after the moving averages finished tightly converging, they gradually fanned out in a bullish formation, clearly signaling a trend reversal.
A review of historical patterns makes it clear: every bull market begins with the moving averages converging tightly, then fanning out bullishly, before opening the way for a long-term uptrend. A bear market begins when the moving averages fan out bearishly after converging, officially setting a downtrend in motion.
The current retest is still underway. As long as the core trend structure remains intact after the retest is complete, the market will most likely first enter a period of slow, choppy gains. Once the moving averages fan out further in the middle and later stages, alongside a recovery in market sentiment and sustained growth in trading volume, the main rally will accelerate.
Bitcoin is now $BTC 80620 dollars; Ethereum is $ETH 2341 dollars; BNB is 741 dollars; XRP is 1.296 dollars; SOL is 101 dollars. The long-term outlook remains bullish 🚀.
October 25, 2026 23:29
{future}(ETHUSDT)
{future}(BTCUSDT)
The crypto bear market is over, and the market has officially moved out of its bottoming range.
We are now in the retest-and-confirmation phase following the bear market bottom and the first breakout.
ETH’s daily chart fully confirms this structure: the price rose from its lows, and after the moving averages finished tightly converging, they gradually fanned out in a bullish formation, clearly signaling a trend reversal.
A review of historical patterns makes it clear: every bull market begins with the moving averages converging tightly, then fanning out bullishly, before opening the way for a long-term uptrend. A bear market begins when the moving averages fan out bearishly after converging, officially setting a downtrend in motion.
The current retest is still underway. As long as the core trend structure remains intact after the retest is complete, the market will most likely first enter a period of slow, choppy gains. Once the moving averages fan out further in the middle and later stages, alongside a recovery in market sentiment and sustained growth in trading volume, the main rally will accelerate.
Bitcoin is now $BTC 80620 dollars; Ethereum is $ETH 2341 dollars; BNB is 741 dollars; XRP is 1.296 dollars; SOL is 101 dollars. The long-term outlook remains bullish 🚀.
October 25, 2026 23:29
We are now in the retest-and-confirmation phase following the bear market bottom and the first breakout.
ETH’s daily chart fully confirms this structure: the price rose from its lows, and after the moving averages finished tightly converging, they gradually fanned out in a bullish formation, clearly signaling a trend reversal.
A review of historical patterns makes it clear: every bull market begins with the moving averages converging tightly, then fanning out bullishly, before opening the way for a long-term uptrend. A bear market begins when the moving averages fan out bearishly after converging, officially setting a downtrend in motion.
The current retest is still underway. As long as the core trend structure remains intact after the retest is complete, the market will most likely first enter a period of slow, choppy gains. Once the moving averages fan out further in the middle and later stages, alongside a recovery in market sentiment and sustained growth in trading volume, the main rally will accelerate.
Bitcoin is now $BTC 80620 dollars; Ethereum is $ETH 2341 dollars; BNB is 741 dollars; XRP is 1.296 dollars; SOL is 101 dollars. The long-term outlook remains bullish 🚀.
October 25, 2026 23:29
482
·
--
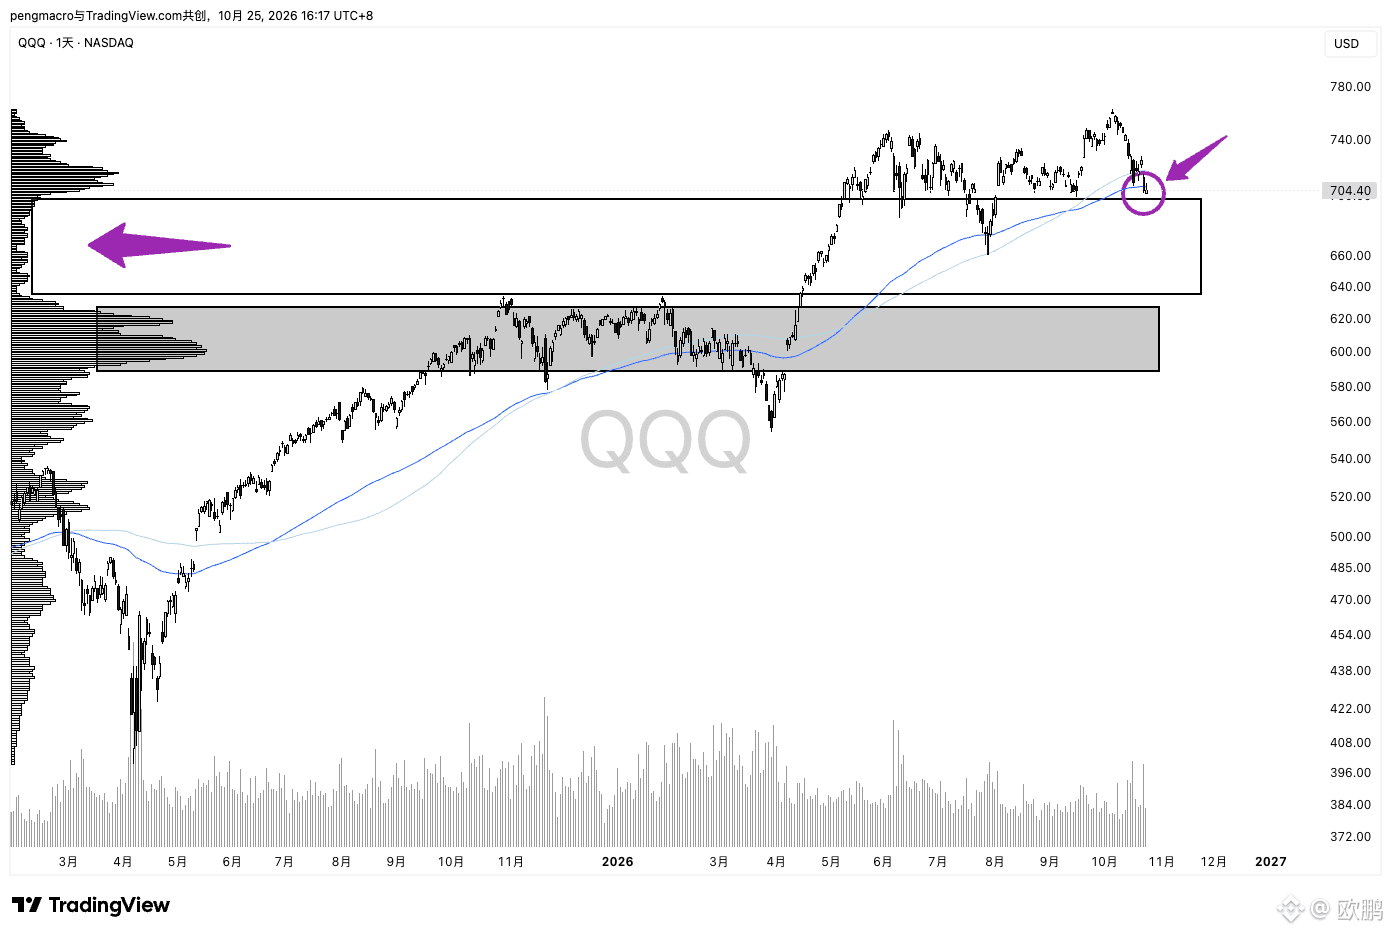
$QQQ A little risky ⚠️ On the daily chart, the price is currently finding temporary support at the EMA120. A series of major events is coming up next week. If the positive news is priced in, the price could stabilize and rebound here, as it did before. But if the negative news is worse than expected, the risk could escalate quickly.
Below the current price is a broad area with sparse trading activity and almost no buying support. If the current support level is decisively broken, the price could quickly fall to the next high-volume area near $630, implying potential downside of nearly 10%.
Keep a close eye on this support line, and manage risk immediately if it breaks.
{future}(QQQUSDT)
{spot}(QQQBUSDT)
$QQQ A little risky ⚠️ On the daily chart, the price is currently finding temporary support at the EMA120. A series of major events is coming up next week. If the positive news is priced in, the price could stabilize and rebound here, as it did before. But if the negative news is worse than expected, the risk could escalate quickly.
Below the current price is a broad area with sparse trading activity and almost no buying support. If the current support level is decisively broken, the price could quickly fall to the next high-volume area near $630, implying potential downside of nearly 10%.
Keep a close eye on this support line, and manage risk immediately if it breaks.
Below the current price is a broad area with sparse trading activity and almost no buying support. If the current support level is decisively broken, the price could quickly fall to the next high-volume area near $630, implying potential downside of nearly 10%.
Keep a close eye on this support line, and manage risk immediately if it breaks.
1
395
·
--
Bullish
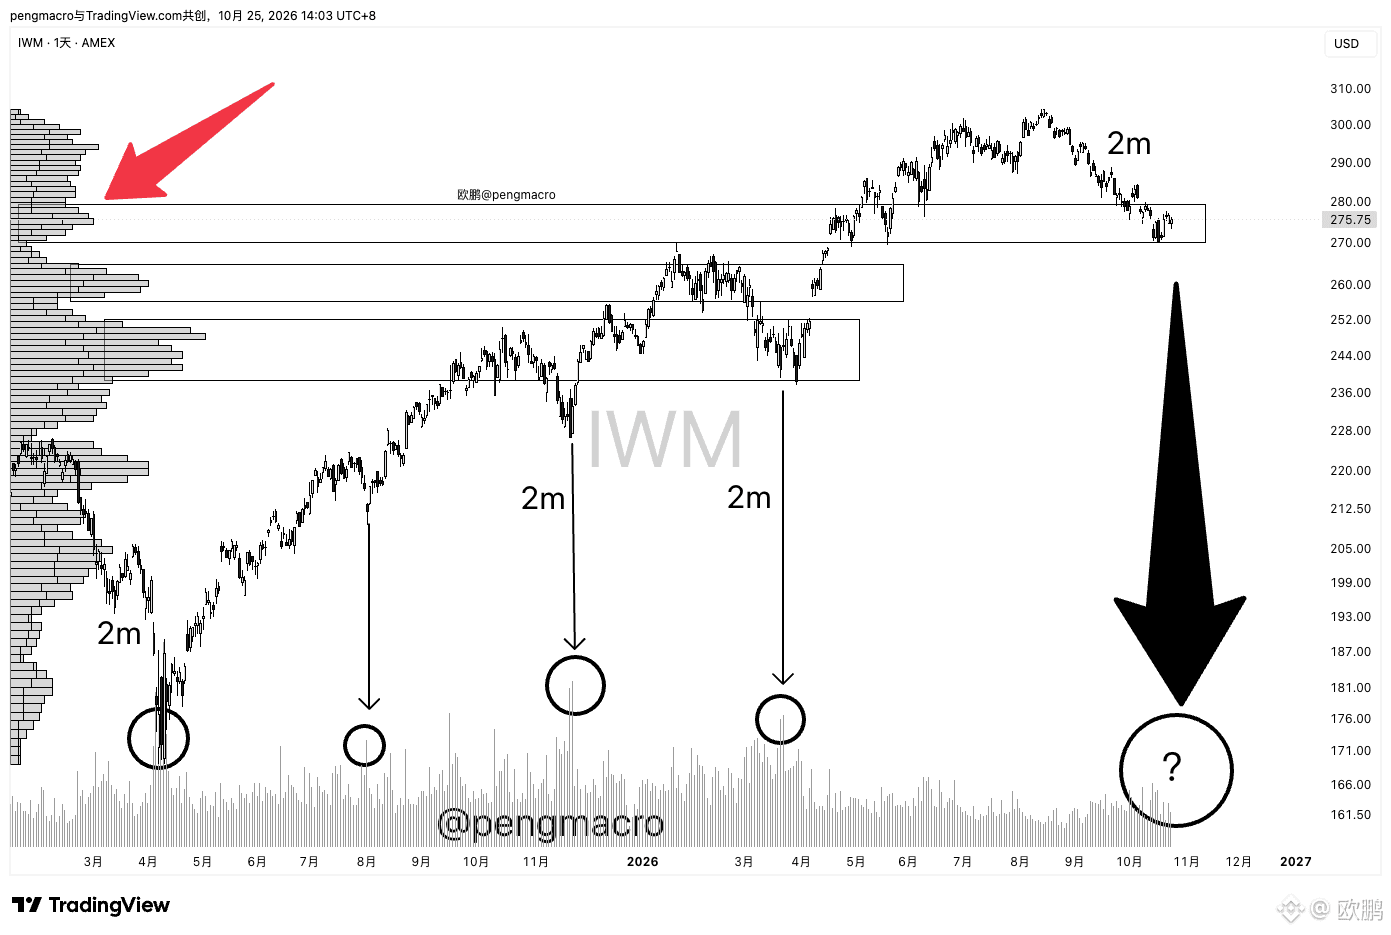
Looking at the daily chart for $IWM , we can see a few fairly clear patterns:
🟢 The previous major declines almost always formed a bottom and rebounded after roughly two months of consecutive losses. This time, from mid-August to mid-October, the timeframe is also close to two months.
Could it be nearing another rebound? Don’t rush to conclusions—there’s more to consider.
🔵 The previous times IWM staged a genuine rebound from a bottom, they were almost always accompanied by a clear surge in trading volume. So far, we haven’t seen a similar signal.
🟡 The price has now pulled back from its high and found support near the lower edge of the first major high-volume price zone. If it can hold here and rebound next week, that would be encouraging. But if it decisively breaks below this level, it may continue lower to seek support in the next two high-volume price zones.
🔴 Starting next week, we also enter a period packed with earnings reports, a Federal Reserve meeting, and the midterm elections, so short-term volatility is likely to increase significantly.
In this environment, my personal view is bullish over the long term, but for the short term, I’d wait and see before acting. I’d consider the next move only once genuinely positive news emerges or a bottoming signal—such as a surge in volume—is confirmed.
{future}(IWMUSDT)
Looking at the daily chart for $IWM , we can see a few fairly clear patterns:
🟢 The previous major declines almost always formed a bottom and rebounded after roughly two months of consecutive losses. This time, from mid-August to mid-October, the timeframe is also close to two months.
Could it be nearing another rebound? Don’t rush to conclusions—there’s more to consider.
🔵 The previous times IWM staged a genuine rebound from a bottom, they were almost always accompanied by a clear surge in trading volume. So far, we haven’t seen a similar signal.
🟡 The price has now pulled back from its high and found support near the lower edge of the first major high-volume price zone. If it can hold here and rebound next week, that would be encouraging. But if it decisively breaks below this level, it may continue lower to seek support in the next two high-volume price zones.
🔴 Starting next week, we also enter a period packed with earnings reports, a Federal Reserve meeting, and the midterm elections, so short-term volatility is likely to increase significantly.
In this environment, my personal view is bullish over the long term, but for the short term, I’d wait and see before acting. I’d consider the next move only once genuinely positive news emerges or a bottoming signal—such as a surge in volume—is confirmed.
🟢 The previous major declines almost always formed a bottom and rebounded after roughly two months of consecutive losses. This time, from mid-August to mid-October, the timeframe is also close to two months.
Could it be nearing another rebound? Don’t rush to conclusions—there’s more to consider.
🔵 The previous times IWM staged a genuine rebound from a bottom, they were almost always accompanied by a clear surge in trading volume. So far, we haven’t seen a similar signal.
🟡 The price has now pulled back from its high and found support near the lower edge of the first major high-volume price zone. If it can hold here and rebound next week, that would be encouraging. But if it decisively breaks below this level, it may continue lower to seek support in the next two high-volume price zones.
🔴 Starting next week, we also enter a period packed with earnings reports, a Federal Reserve meeting, and the midterm elections, so short-term volatility is likely to increase significantly.
In this environment, my personal view is bullish over the long term, but for the short term, I’d wait and see before acting. I’d consider the next move only once genuinely positive news emerges or a bottoming signal—such as a surge in volume—is confirmed.
1
149
·
--
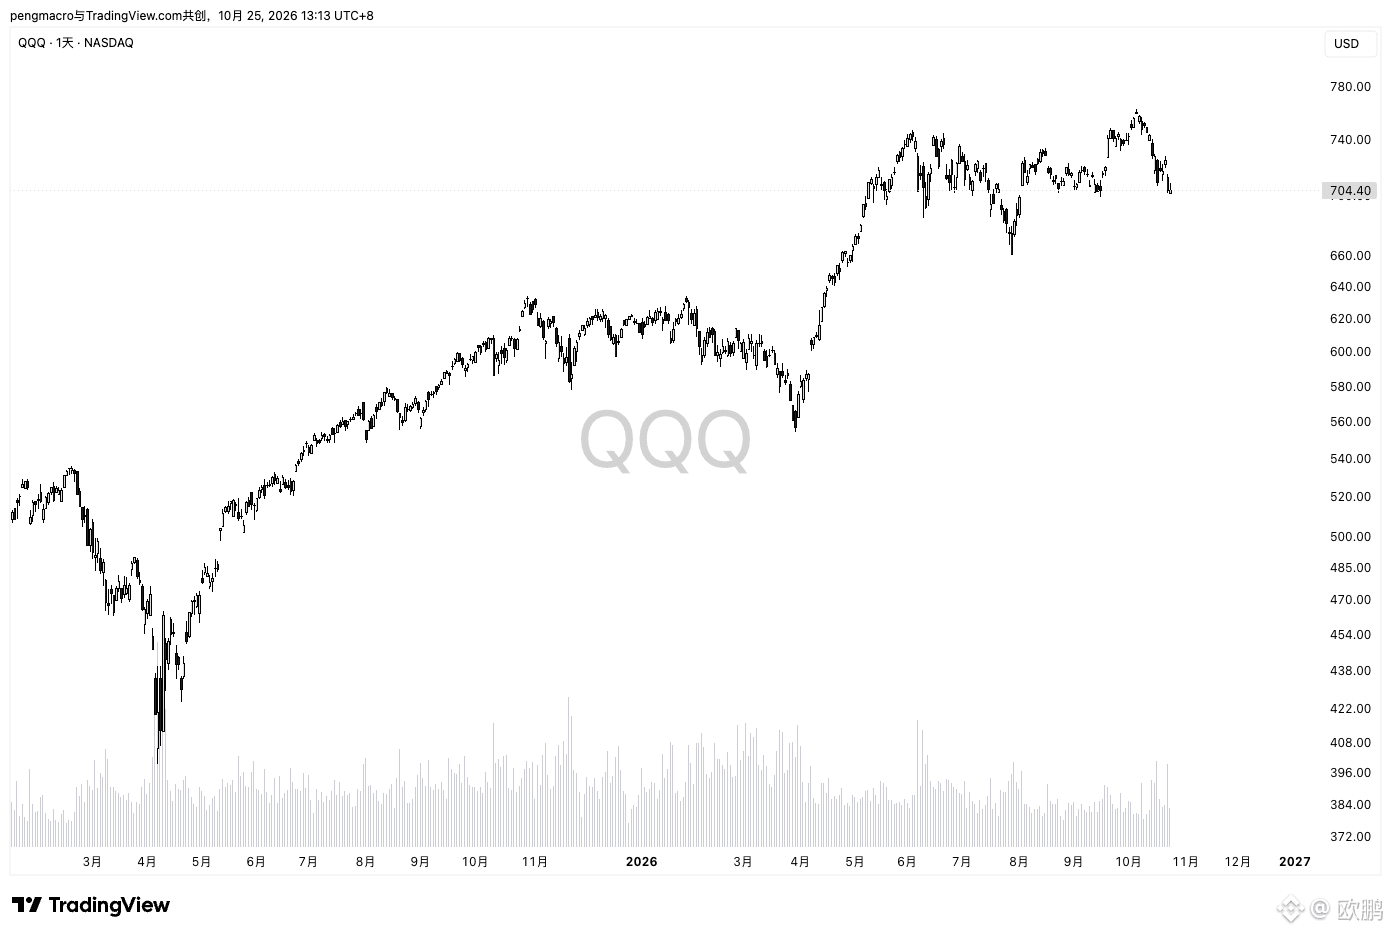
QQQ’s returns over the past 5 years (total return, including dividends). After reading this, you’ll understand why you should choose an asset with a long-term upward trend:
2021: +27.4%
2022: -32.6%
2023: +54.9%
2024: +25.6%
2025: +20.8%
2026 year to date (as of around October 23): +15.1%
For $QQQ and $SPY , as long as you’re patient, every dip is an opportunity.
{future}(QQQUSDT)
{spot}(QQQBUSDT)
{future}(SPYUSDT)
QQQ’s returns over the past 5 years (total return, including dividends). After reading this, you’ll understand why you should choose an asset with a long-term upward trend:
2021: +27.4%
2022: -32.6%
2023: +54.9%
2024: +25.6%
2025: +20.8%
2026 year to date (as of around October 23): +15.1%
For $QQQ and $SPY , as long as you’re patient, every dip is an opportunity.
2021: +27.4%
2022: -32.6%
2023: +54.9%
2024: +25.6%
2025: +20.8%
2026 year to date (as of around October 23): +15.1%
For $QQQ and $SPY , as long as you’re patient, every dip is an opportunity.
1
487
·
--
Thursday 02:00, the Federal Reserve’s FOMC announces its interest rate decision;
Thursday 02:30, Fed Chair Warsh holds a monetary policy press conference;
Thursday 20:30, the U.S. advance estimate of third-quarter annualized real GDP, the U.S. annual core PCE price index for September, the U.S. annual PCE price index for September, U.S. initial jobless claims for the week ending October 24, and U.S. personal spending for September;
Thursday 21:15, the European Central Bank announces its interest rate decision;
Thursday 21:45, ECB President Lagarde holds a press conference;
Friday, the Bank of Japan announces its interest rate decision;
Friday 14:30, Bank of Japan Governor Kazuo Ueda holds a press conference.
Next week will be the busiest week of the current U.S. earnings season, with about one-third of S&P 500 companies set to report results.
After the U.S. market closes next Wednesday, Microsoft $MSFT and Alphabet will be the first to report, followed by Amazon $AMZN after the close on Thursday.
Thursday 02:00, the Federal Reserve’s FOMC announces its interest rate decision;
Thursday 02:30, Fed Chair Warsh holds a monetary policy press conference;
Thursday 20:30, the U.S. advance estimate of third-quarter annualized real GDP, the U.S. annual core PCE price index for September, the U.S. annual PCE price index for September, U.S. initial jobless claims for the week ending October 24, and U.S. personal spending for September;
Thursday 21:15, the European Central Bank announces its interest rate decision;
Thursday 21:45, ECB President Lagarde holds a press conference;
Friday, the Bank of Japan announces its interest rate decision;
Friday 14:30, Bank of Japan Governor Kazuo Ueda holds a press conference.
Next week will be the busiest week of the current U.S. earnings season, with about one-third of S&P 500 companies set to report results.
After the U.S. market closes next Wednesday, Microsoft $MSFT and Alphabet will be the first to report, followed by Amazon $AMZN after the close on Thursday.
Thursday 02:30, Fed Chair Warsh holds a monetary policy press conference;
Thursday 20:30, the U.S. advance estimate of third-quarter annualized real GDP, the U.S. annual core PCE price index for September, the U.S. annual PCE price index for September, U.S. initial jobless claims for the week ending October 24, and U.S. personal spending for September;
Thursday 21:15, the European Central Bank announces its interest rate decision;
Thursday 21:45, ECB President Lagarde holds a press conference;
Friday, the Bank of Japan announces its interest rate decision;
Friday 14:30, Bank of Japan Governor Kazuo Ueda holds a press conference.
Next week will be the busiest week of the current U.S. earnings season, with about one-third of S&P 500 companies set to report results.
After the U.S. market closes next Wednesday, Microsoft $MSFT and Alphabet will be the first to report, followed by Amazon $AMZN after the close on Thursday.
欧鹏
·
--
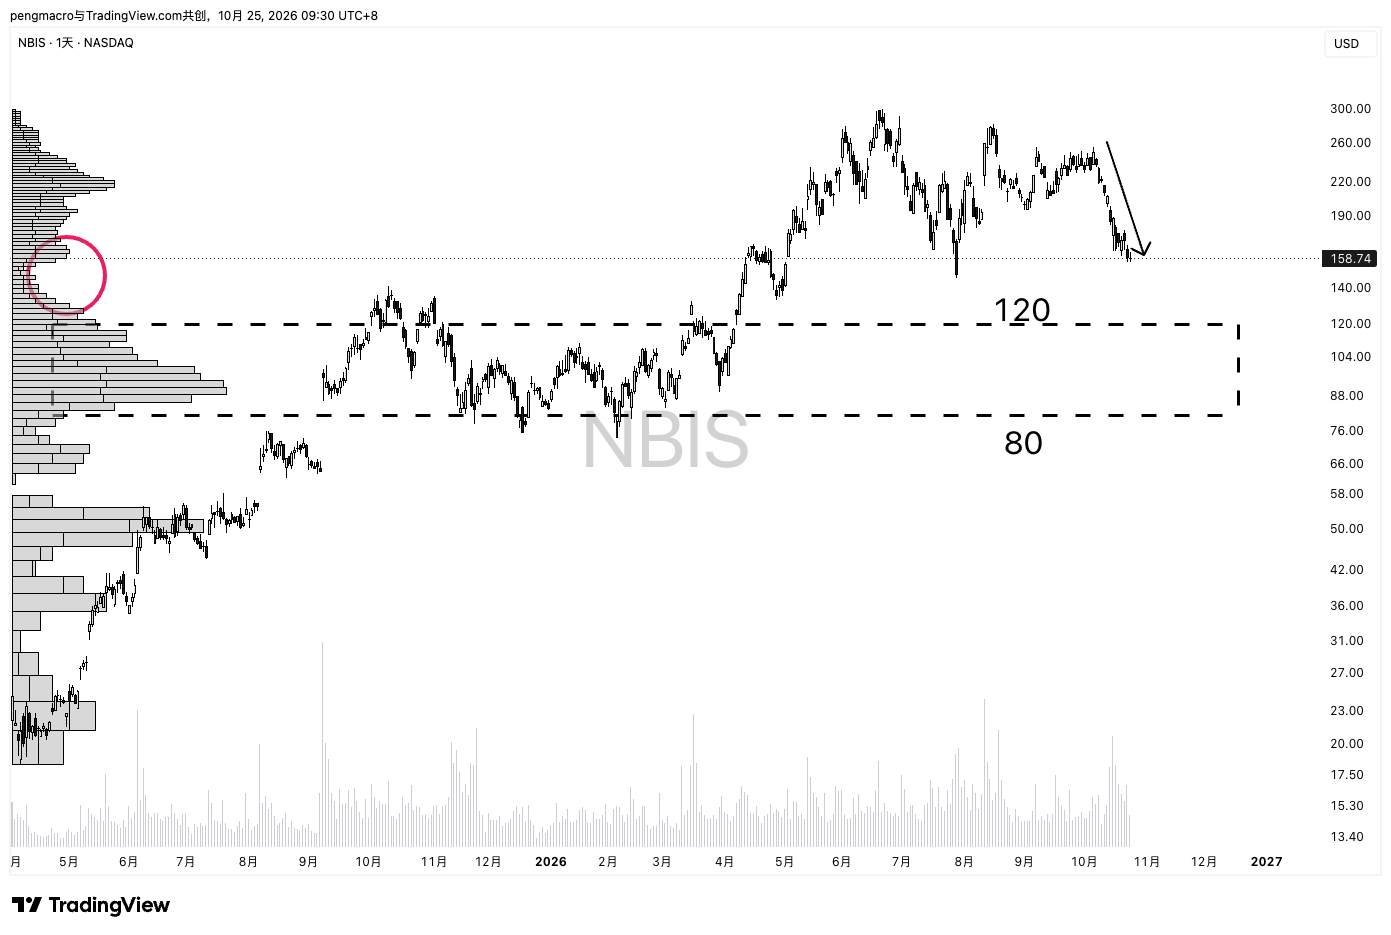
$NBIS has fallen for several consecutive sessions to around $158, showing clear signs of short-term oversold conditions. The daily trading-volume profile shows relatively little support below the current price, so if it continues to decline, the drop could accelerate.
If there is no positive catalyst next week and the price fails to rebound convincingly, it may retest the next high-volume area (around $120–$80) for support. A larger concentration of trading volume has accumulated in that zone, which could theoretically provide some buying support.
With a packed earnings calendar and a Federal Reserve decision next week, volatility is likely to remain high. In the short term, the key level to watch is around $158: can the price find a floor there? If it continues to fall below that level, there could be further downside.
What do you think?
If there is no positive catalyst next week and the price fails to rebound convincingly, it may retest the next high-volume area (around $120–$80) for support. A larger concentration of trading volume has accumulated in that zone, which could theoretically provide some buying support.
With a packed earnings calendar and a Federal Reserve decision next week, volatility is likely to remain high. In the short term, the key level to watch is around $158: can the price find a floor there? If it continues to fall below that level, there could be further downside.
What do you think?
1
143
·
--
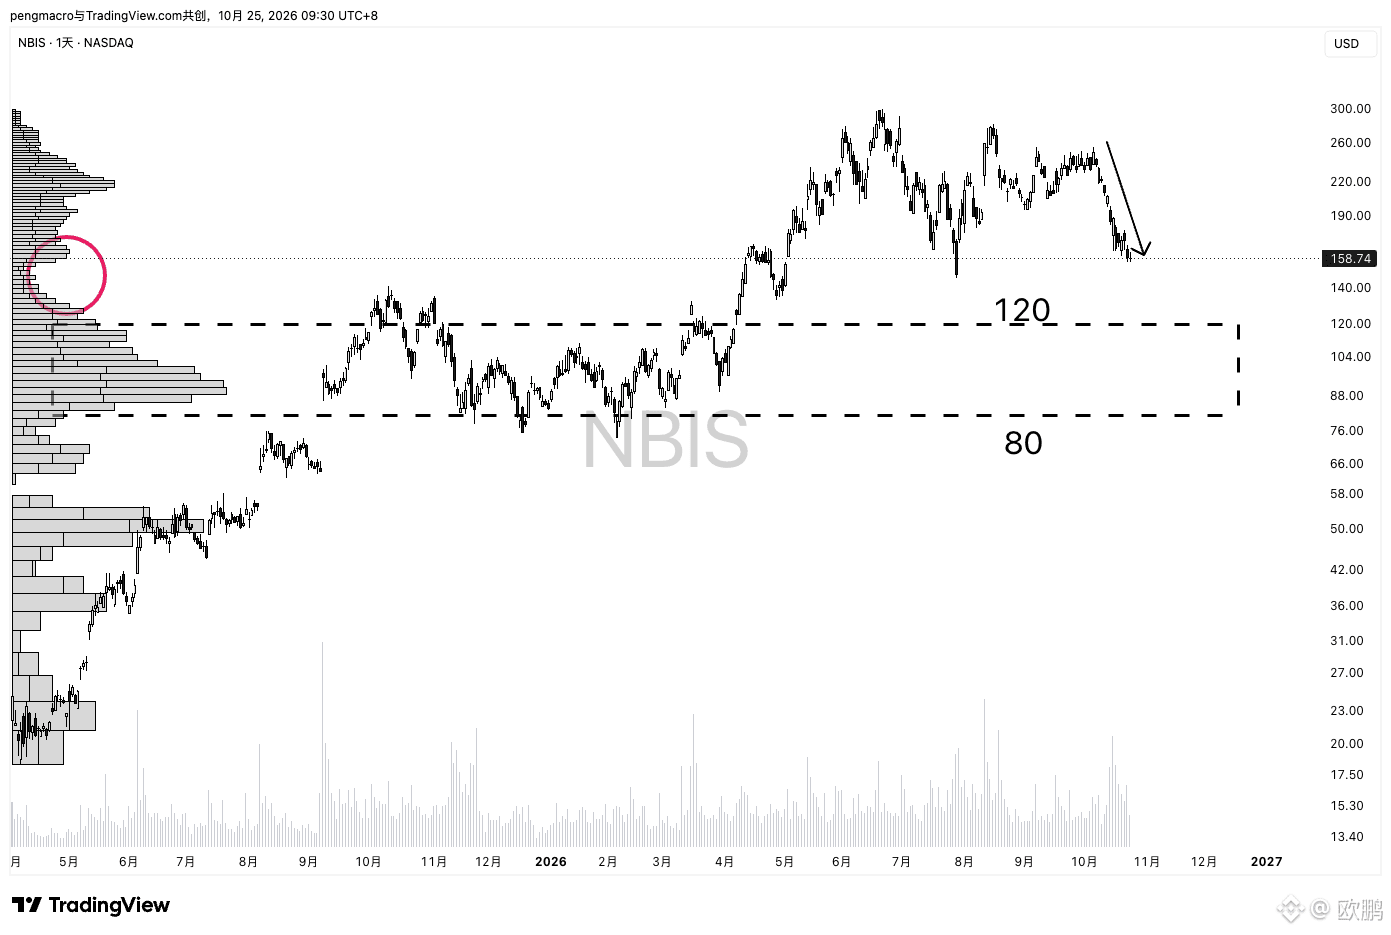
$NBIS has fallen for several consecutive sessions to around $158, showing clear signs of short-term oversold conditions. The daily trading-volume profile shows relatively little support below the current price, so if it continues to decline, the drop could accelerate.
If there is no positive catalyst next week and the price fails to rebound convincingly, it may retest the next high-volume area (around $120–$80) for support. A larger concentration of trading volume has accumulated in that zone, which could theoretically provide some buying support.
With a packed earnings calendar and a Federal Reserve decision next week, volatility is likely to remain high. In the short term, the key level to watch is around $158: can the price find a floor there? If it continues to fall below that level, there could be further downside.
What do you think?
$NBIS has fallen for several consecutive sessions to around $158, showing clear signs of short-term oversold conditions. The daily trading-volume profile shows relatively little support below the current price, so if it continues to decline, the drop could accelerate.
If there is no positive catalyst next week and the price fails to rebound convincingly, it may retest the next high-volume area (around $120–$80) for support. A larger concentration of trading volume has accumulated in that zone, which could theoretically provide some buying support.
With a packed earnings calendar and a Federal Reserve decision next week, volatility is likely to remain high. In the short term, the key level to watch is around $158: can the price find a floor there? If it continues to fall below that level, there could be further downside.
What do you think?
If there is no positive catalyst next week and the price fails to rebound convincingly, it may retest the next high-volume area (around $120–$80) for support. A larger concentration of trading volume has accumulated in that zone, which could theoretically provide some buying support.
With a packed earnings calendar and a Federal Reserve decision next week, volatility is likely to remain high. In the short term, the key level to watch is around $158: can the price find a floor there? If it continues to fall below that level, there could be further downside.
What do you think?
1
1
489
·
--
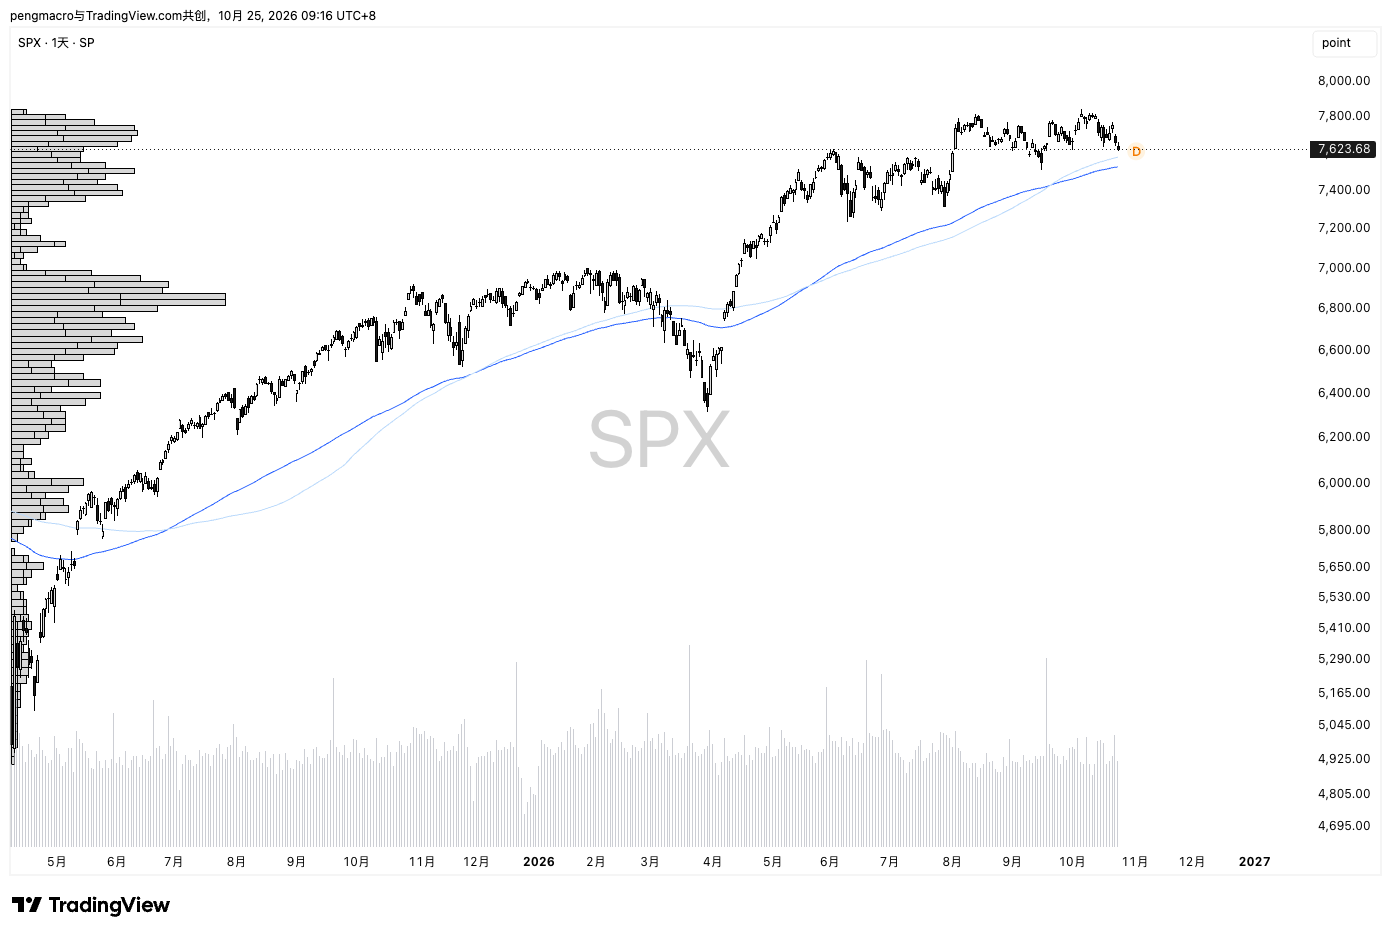
Over the past 31 years, the S&P 500 $SPY has had only three significant pullbacks in November:
November 2000 (about -8%): At the height of the dot-com bubble bursting. After peaking in March, the Nasdaq continued to plunge, and tech companies frequently issued profit warnings (such as Gateway and Altera). Signs of an economic slowdown were clear, and political uncertainty over the disputed Florida vote count in the 2000 U.S. presidential election (Bush vs. Gore) made market sentiment extremely pessimistic.
November 2007 (about -4.4%): The early stages of the subprime crisis. The housing market collapsed and credit markets froze. Financial institutions such as Citi and Merrill Lynch took massive write-downs on subprime mortgage-related losses, sending financial stocks sharply lower. Oil prices neared $100, and markets began to worry about a recession. The Federal Reserve had cut interest rates, but its cautious signals triggered further selling.
November 2008 (about -7.5%): The worst phase of the financial crisis. After Lehman Brothers went bankrupt in September, markets continued to free-fall, having already plunged more than 16% in October. In November, the Big Three automakers (GM, Ford, and Chrysler) failed to secure a bailout, Citigroup ran into trouble, and retail sales and employment data were dismal. Fears of a deep recession intensified, and the S&P 500 hit a multi-year low.
There are five trading days left until November 2026. Historically, November has been very favorable for the bulls. Let’s hope it’s the same this time. GM☀️
{future}(SPYUSDT)
{spot}(SPYBUSDT)
Over the past 31 years, the S&P 500 $SPY has had only three significant pullbacks in November:
November 2000 (about -8%): At the height of the dot-com bubble bursting. After peaking in March, the Nasdaq continued to plunge, and tech companies frequently issued profit warnings (such as Gateway and Altera). Signs of an economic slowdown were clear, and political uncertainty over the disputed Florida vote count in the 2000 U.S. presidential election (Bush vs. Gore) made market sentiment extremely pessimistic.
November 2007 (about -4.4%): The early stages of the subprime crisis. The housing market collapsed and credit markets froze. Financial institutions such as Citi and Merrill Lynch took massive write-downs on subprime mortgage-related losses, sending financial stocks sharply lower. Oil prices neared $100, and markets began to worry about a recession. The Federal Reserve had cut interest rates, but its cautious signals triggered further selling.
November 2008 (about -7.5%): The worst phase of the financial crisis. After Lehman Brothers went bankrupt in September, markets continued to free-fall, having already plunged more than 16% in October. In November, the Big Three automakers (GM, Ford, and Chrysler) failed to secure a bailout, Citigroup ran into trouble, and retail sales and employment data were dismal. Fears of a deep recession intensified, and the S&P 500 hit a multi-year low.
There are five trading days left until November 2026. Historically, November has been very favorable for the bulls. Let’s hope it’s the same this time. GM☀️
November 2000 (about -8%): At the height of the dot-com bubble bursting. After peaking in March, the Nasdaq continued to plunge, and tech companies frequently issued profit warnings (such as Gateway and Altera). Signs of an economic slowdown were clear, and political uncertainty over the disputed Florida vote count in the 2000 U.S. presidential election (Bush vs. Gore) made market sentiment extremely pessimistic.
November 2007 (about -4.4%): The early stages of the subprime crisis. The housing market collapsed and credit markets froze. Financial institutions such as Citi and Merrill Lynch took massive write-downs on subprime mortgage-related losses, sending financial stocks sharply lower. Oil prices neared $100, and markets began to worry about a recession. The Federal Reserve had cut interest rates, but its cautious signals triggered further selling.
November 2008 (about -7.5%): The worst phase of the financial crisis. After Lehman Brothers went bankrupt in September, markets continued to free-fall, having already plunged more than 16% in October. In November, the Big Three automakers (GM, Ford, and Chrysler) failed to secure a bailout, Citigroup ran into trouble, and retail sales and employment data were dismal. Fears of a deep recession intensified, and the S&P 500 hit a multi-year low.
There are five trading days left until November 2026. Historically, November has been very favorable for the bulls. Let’s hope it’s the same this time. GM☀️
2
510
·
--
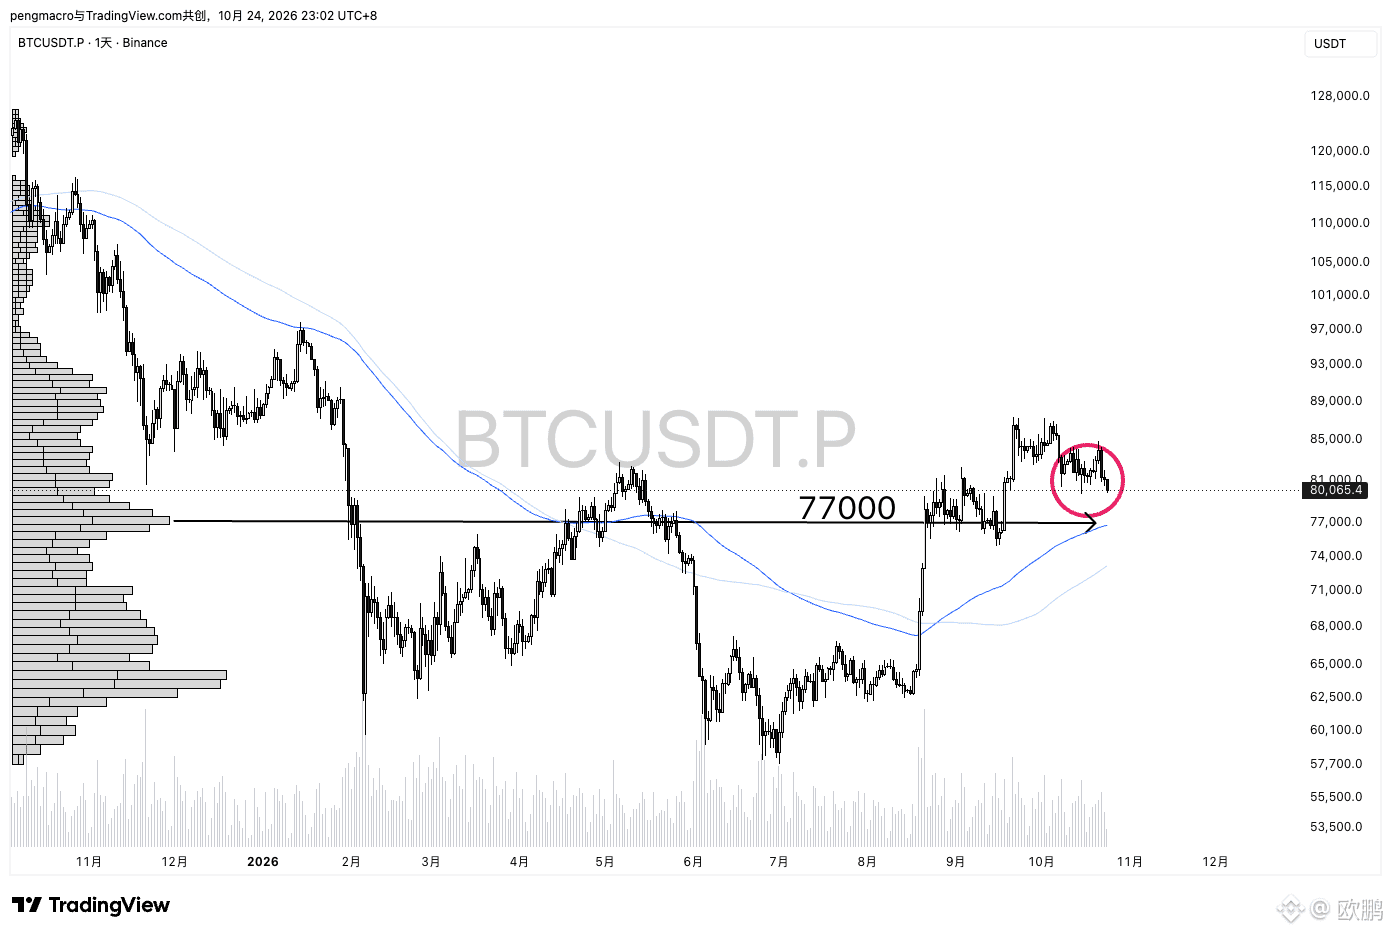
$BTC Bitcoin has fallen to $80,000 three times.
Can it hold this time? The nearest support below is $77,000.
Amen~
{future}(BTCUSDT)
$BTC Bitcoin has fallen to $80,000 three times.
Can it hold this time? The nearest support below is $77,000.
Amen~
Can it hold this time? The nearest support below is $77,000.
Amen~
1
130
·
--
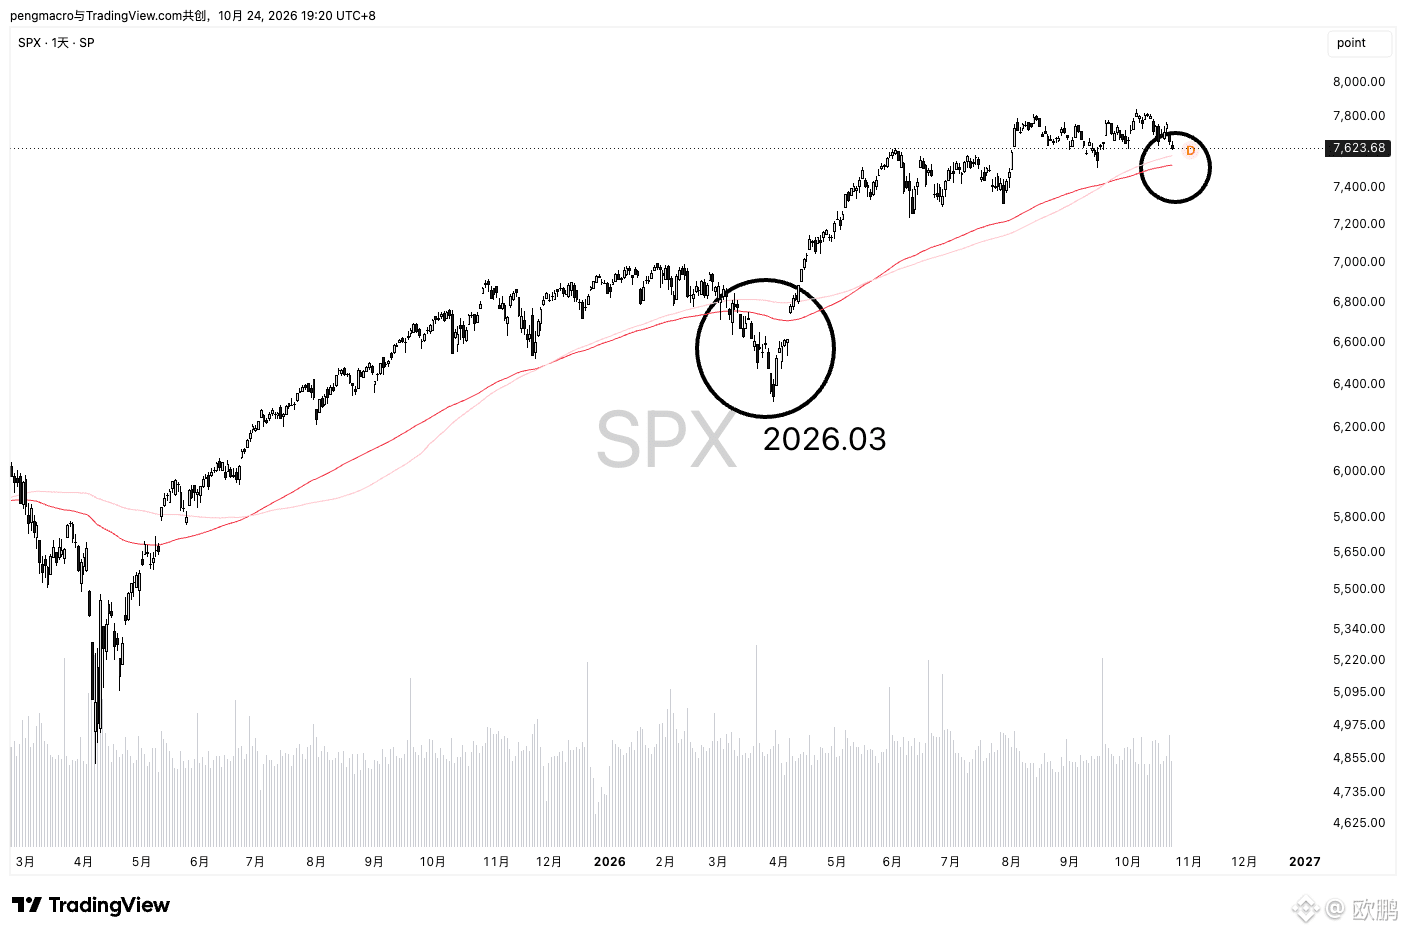
S&P 500 $SPYB has once again returned to the EMA/MA 120 moving average
Can it hold this time??
The last time it fell below was in March
For long-term holders, every dip is an opportunity to add to their position
This time is no exception
{spot}(SPYBUSDT)
{future}(SPYUSDT)
S&P 500 $SPYB has once again returned to the EMA/MA 120 moving average
Can it hold this time??
The last time it fell below was in March
For long-term holders, every dip is an opportunity to add to their position
This time is no exception
Can it hold this time??
The last time it fell below was in March
For long-term holders, every dip is an opportunity to add to their position
This time is no exception
110
Log in to explore more content
Join global crypto users on Binance Square
⚡️ Get latest and useful information about crypto.
💬 Trusted by the world’s largest crypto exchange.
👍 Discover real insights from verified creators.
Email / Phone number