
Serhii Crypto Insights
243 Posts

Serhii Crypto Insights
Report
Block User
High-Frequency Trader
5.9 Years
30 Following
72 Followers
117 Liked
Posts
All
Quotes
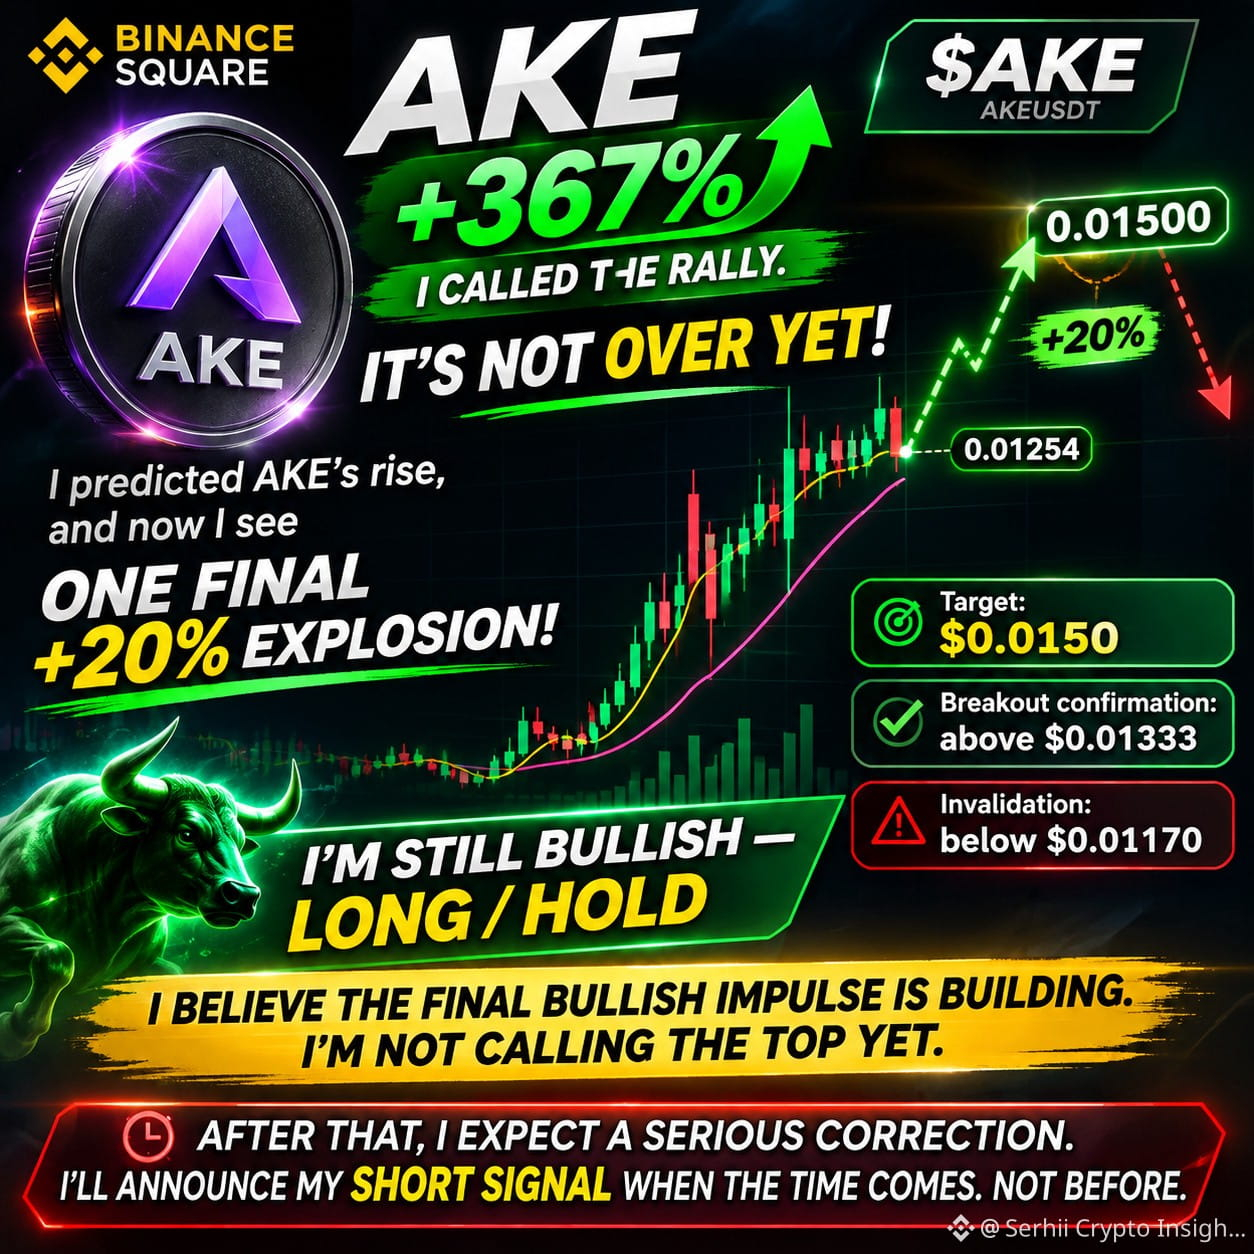
🚨 $AKE +367% — I CALLED THE RALLY. NOW WATCH WHAT HAPPENS NEXT.
I predicted the rise. And I believe the biggest trap is still ahead.
🔥 MY NEXT CALL: +20% BEFORE THE DROP.
🟢 LONG / HOLD — I'm still bullish.
🎯 Final upside target: $0.0150
⚡ Breakout confirmation: $0.01333
🛑 Invalidation: $0.01170
I see one last bullish impulse building before a potentially brutal correction.
I'm not calling the SHORT yet.
When the reversal confirms, I'll share my next signal.
First the final push. Then we hunt the reversal.
$AKE #AKEUADT #akedo
🚨 $AKE +367% — I CALLED THE RALLY. NOW WATCH WHAT HAPPENS NEXT.
I predicted the rise. And I believe the biggest trap is still ahead.
🔥 MY NEXT CALL: +20% BEFORE THE DROP.
🟢 LONG / HOLD — I'm still bullish.
🎯 Final upside target: $0.0150
⚡ Breakout confirmation: $0.01333
🛑 Invalidation: $0.01170
I see one last bullish impulse building before a potentially brutal correction.
I'm not calling the SHORT yet.
When the reversal confirms, I'll share my next signal.
First the final push. Then we hunt the reversal.
$AKE #AKEUADT #akedo
I predicted the rise. And I believe the biggest trap is still ahead.
🔥 MY NEXT CALL: +20% BEFORE THE DROP.
🟢 LONG / HOLD — I'm still bullish.
🎯 Final upside target: $0.0150
⚡ Breakout confirmation: $0.01333
🛑 Invalidation: $0.01170
I see one last bullish impulse building before a potentially brutal correction.
I'm not calling the SHORT yet.
When the reversal confirms, I'll share my next signal.
First the final push. Then we hunt the reversal.
$AKE #AKEUADT #akedo
2
2.9k
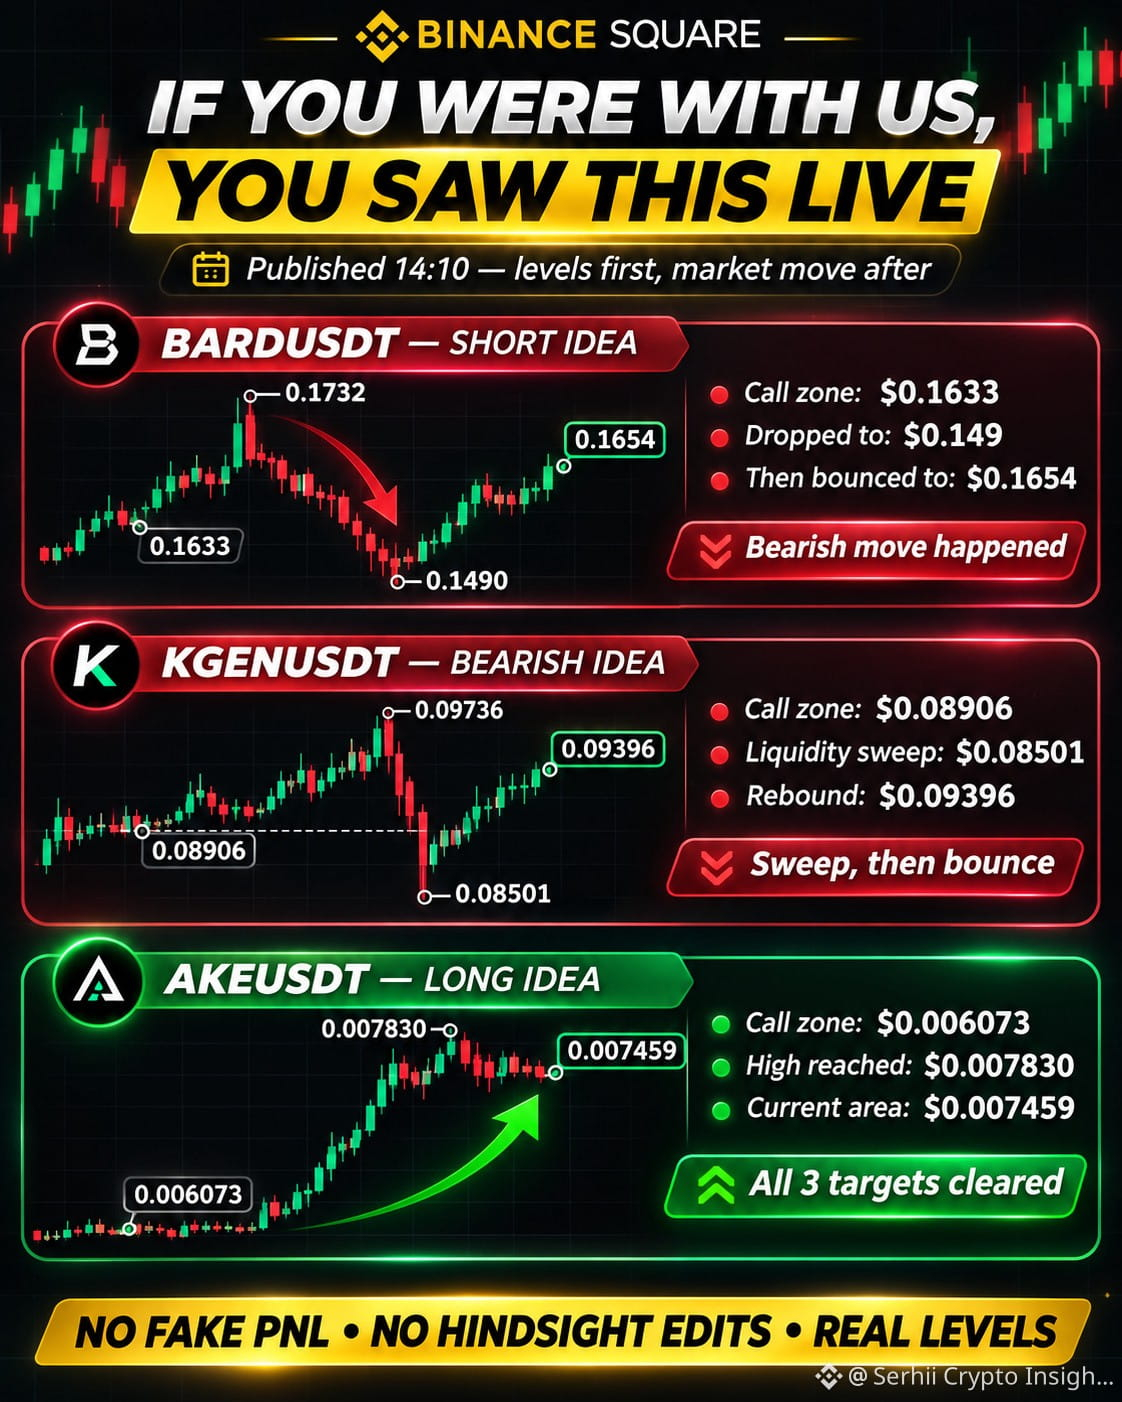
🚨 IF YOU WERE WATCHING OUR CALLS TODAY, YOU SAW THE MARKET MOVE.
Three coins. Three major price reactions. Our levels were published before the moves.
🔻 $BARD — SHORT thesis. Price dropped to $0.149 before bouncing.
🔻 $KGEN — BEARISH setup. Price swept $0.08501, then reversed sharply. No confirmed short entry.
🚀 $AKE — LONG thesis. Price surged to $0.00783, beyond ALL THREE projected targets.
No fake PnL. No hindsight edits. No guaranteed wins.
We publish the direction, targets and invalidation BEFORE the market makes its move.
The difference is accountability. The next move still needs confirmation.
#BARD #KGEN #AKE
🚨 IF YOU WERE WATCHING OUR CALLS TODAY, YOU SAW THE MARKET MOVE.
Three coins. Three major price reactions. Our levels were published before the moves.
🔻 $BARD — SHORT thesis. Price dropped to $0.149 before bouncing.
🔻 $KGEN — BEARISH setup. Price swept $0.08501, then reversed sharply. No confirmed short entry.
🚀 $AKE — LONG thesis. Price surged to $0.00783, beyond ALL THREE projected targets.
No fake PnL. No hindsight edits. No guaranteed wins.
We publish the direction, targets and invalidation BEFORE the market makes its move.
The difference is accountability. The next move still needs confirmation.
#BARD #KGEN #AKE
Three coins. Three major price reactions. Our levels were published before the moves.
🔻 $BARD — SHORT thesis. Price dropped to $0.149 before bouncing.
🔻 $KGEN — BEARISH setup. Price swept $0.08501, then reversed sharply. No confirmed short entry.
🚀 $AKE — LONG thesis. Price surged to $0.00783, beyond ALL THREE projected targets.
No fake PnL. No hindsight edits. No guaranteed wins.
We publish the direction, targets and invalidation BEFORE the market makes its move.
The difference is accountability. The next move still needs confirmation.
#BARD #KGEN #AKE
1
574
🔥 3 PREDICTIONS. 3 WINS. WHAT A DAY!
I shared my predictions before these moves happened. Now the numbers speak for themselves!
🚀 $BARD — +34.6%
I spotted the upside potential around $0.1024. BARD later surged to $0.1378!
💎 $PLAY — +7%
I expected further upside from $0.00846. The price climbed to $0.00905!
📉 $INIT — −13%
I warned about weakness around $0.1269. The price later dropped to $0.1103!
Three predictions. Three moves in the expected direction!
I'm a history teacher by education, and history has taught me one important lesson: recognize patterns before everyone else starts talking about them.
🔥 These three coins were profitable for me today. What about you? Which coins made you money?
November 12, 2026. Past performance does not guarantee future results. Not financial advice.
🔥 3 PREDICTIONS. 3 WINS. WHAT A DAY!
I shared my predictions before these moves happened. Now the numbers speak for themselves!
🚀 $BARD — +34.6%
I spotted the upside potential around $0.1024. BARD later surged to $0.1378!
💎 $PLAY — +7%
I expected further upside from $0.00846. The price climbed to $0.00905!
📉 $INIT — −13%
I warned about weakness around $0.1269. The price later dropped to $0.1103!
Three predictions. Three moves in the expected direction!
I'm a history teacher by education, and history has taught me one important lesson: recognize patterns before everyone else starts talking about them.
🔥 These three coins were profitable for me today. What about you? Which coins made you money?
November 12, 2026. Past performance does not guarantee future results. Not financial advice.
I shared my predictions before these moves happened. Now the numbers speak for themselves!
🚀 $BARD — +34.6%
I spotted the upside potential around $0.1024. BARD later surged to $0.1378!
💎 $PLAY — +7%
I expected further upside from $0.00846. The price climbed to $0.00905!
📉 $INIT — −13%
I warned about weakness around $0.1269. The price later dropped to $0.1103!
Three predictions. Three moves in the expected direction!
I'm a history teacher by education, and history has taught me one important lesson: recognize patterns before everyone else starts talking about them.
🔥 These three coins were profitable for me today. What about you? Which coins made you money?
November 12, 2026. Past performance does not guarantee future results. Not financial advice.
1
903
🚀 $BARD Is Just Getting Started?
BARD is up +19.77%, trading at $0.1024 after an explosive breakout from around $0.09.
Trading volume surged, and the price remains above its key moving averages on the 1-minute chart.
My prediction: BARD still has momentum. If buyers defend $0.1008 and break $0.1102, another upward move could follow.
A drop below $0.1000 would weaken this outlook.
$ERA and $MAGMA also showed strong momentum earlier today, but BARD is the one I'm watching now.
I'll return to this prediction with the actual result.
Market snapshot: November 12, 17:42 CET.
Not financial advice. Personal market analysis only.
🚀 $BARD Is Just Getting Started?
BARD is up +19.77%, trading at $0.1024 after an explosive breakout from around $0.09.
Trading volume surged, and the price remains above its key moving averages on the 1-minute chart.
My prediction: BARD still has momentum. If buyers defend $0.1008 and break $0.1102, another upward move could follow.
A drop below $0.1000 would weaken this outlook.
$ERA and $MAGMA also showed strong momentum earlier today, but BARD is the one I'm watching now.
I'll return to this prediction with the actual result.
Market snapshot: November 12, 17:42 CET.
Not financial advice. Personal market analysis only.
BARD is up +19.77%, trading at $0.1024 after an explosive breakout from around $0.09.
Trading volume surged, and the price remains above its key moving averages on the 1-minute chart.
My prediction: BARD still has momentum. If buyers defend $0.1008 and break $0.1102, another upward move could follow.
A drop below $0.1000 would weaken this outlook.
$ERA and $MAGMA also showed strong momentum earlier today, but BARD is the one I'm watching now.
I'll return to this prediction with the actual result.
Market snapshot: November 12, 17:42 CET.
Not financial advice. Personal market analysis only.
240
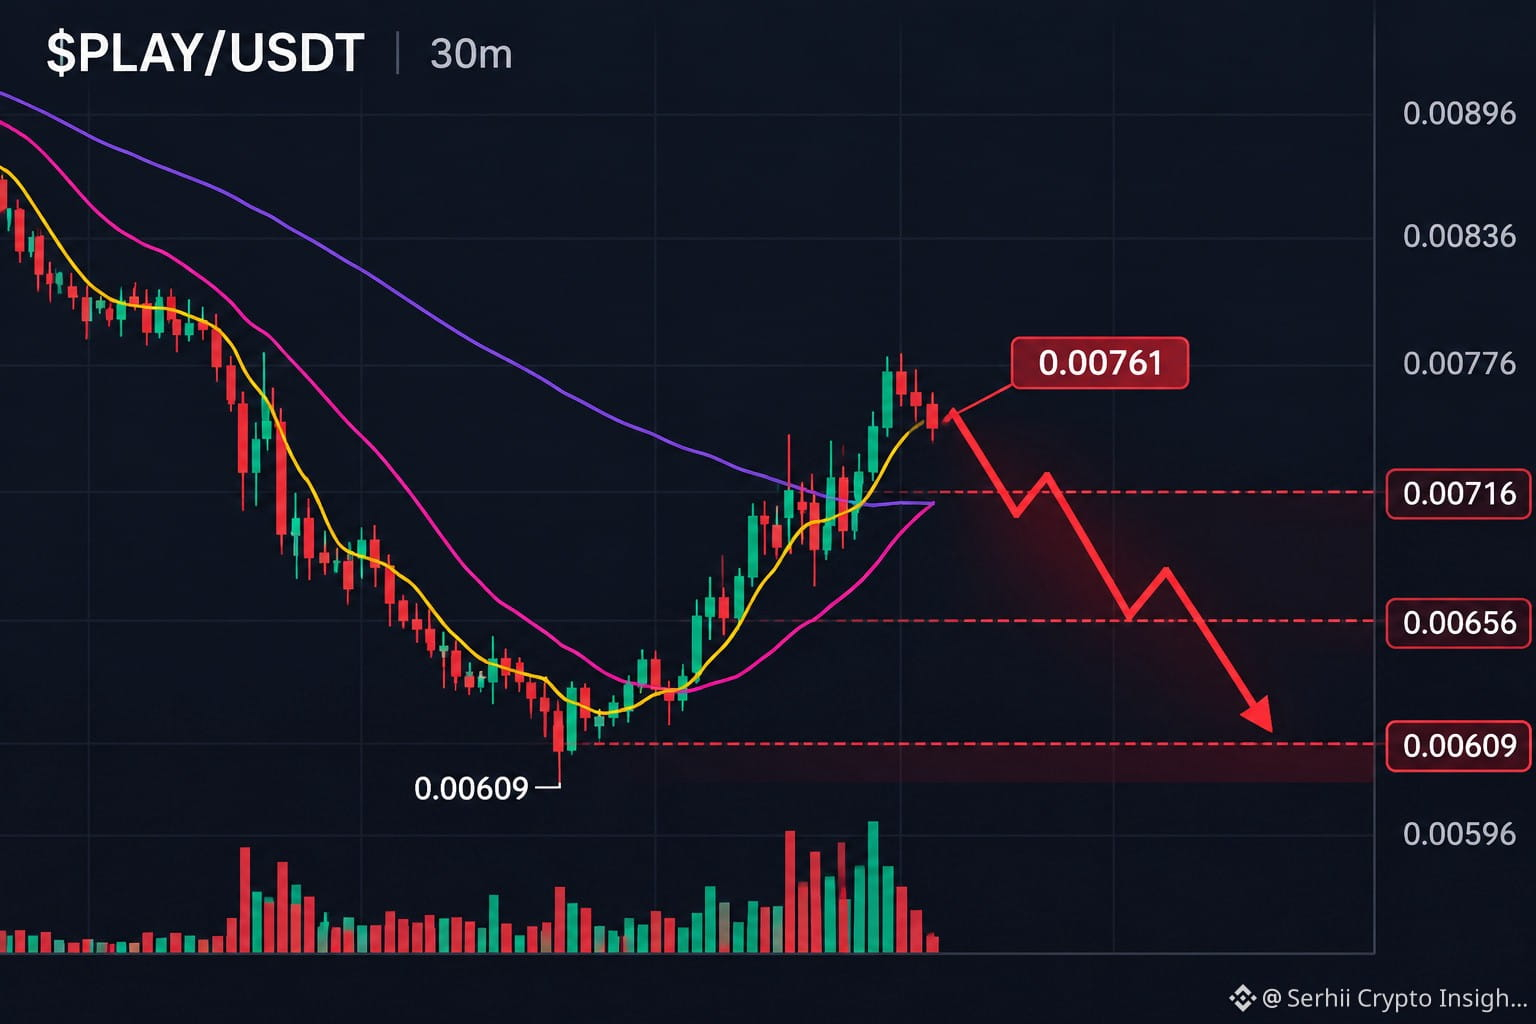
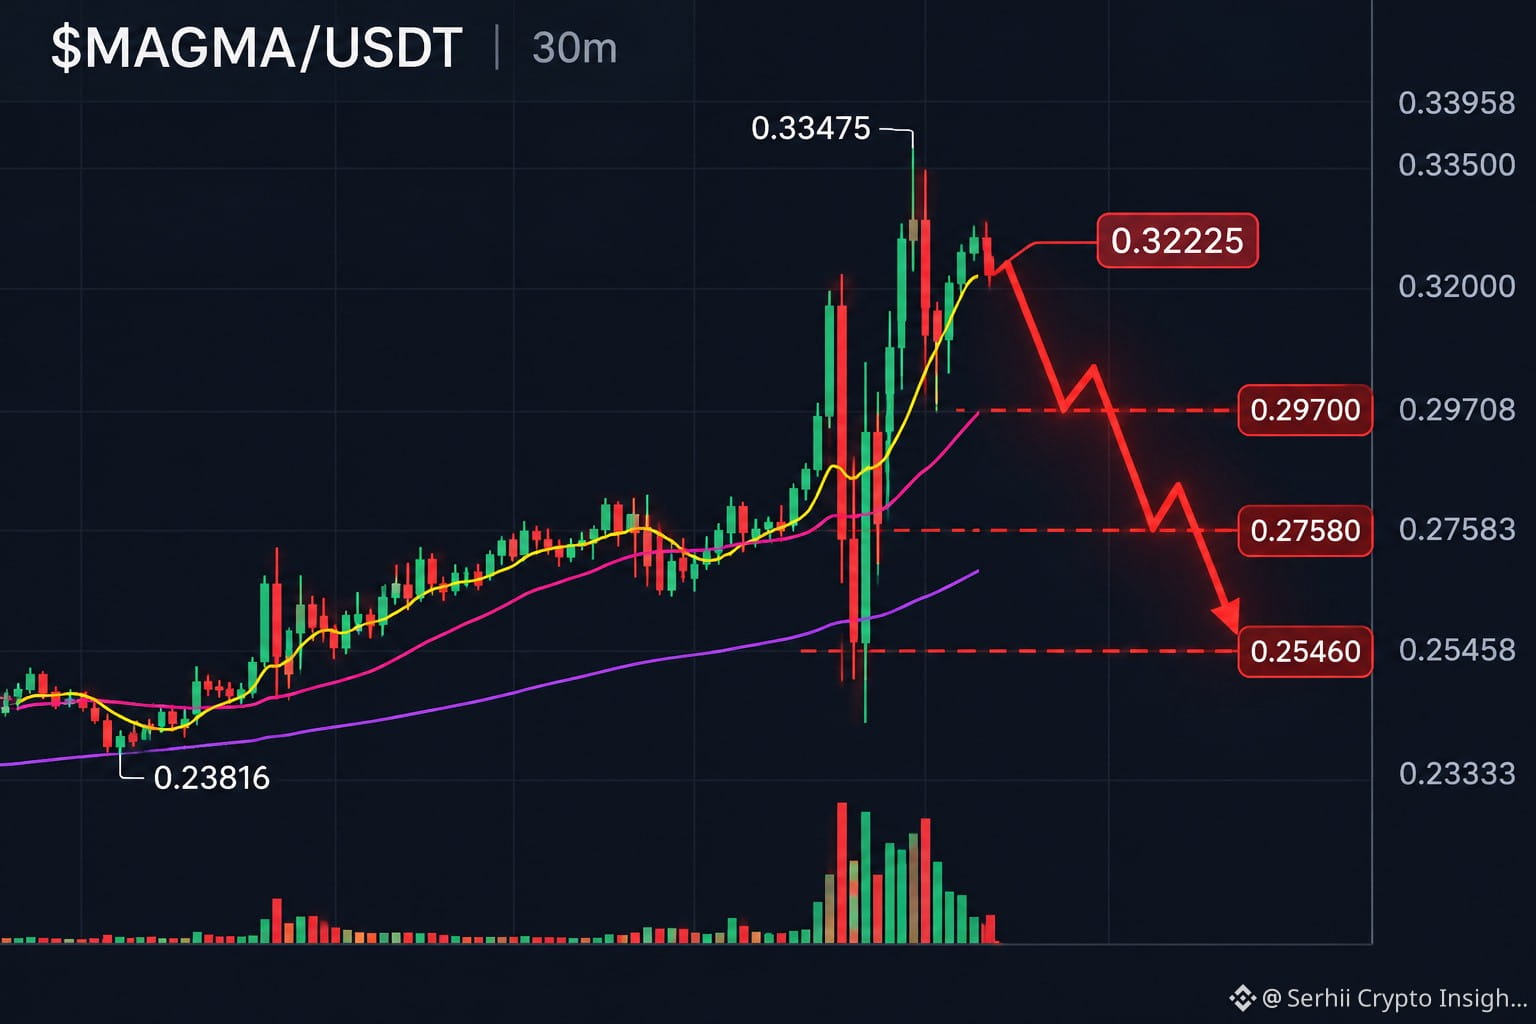
🔴 $ERA — Is a Sharp Correction Coming?
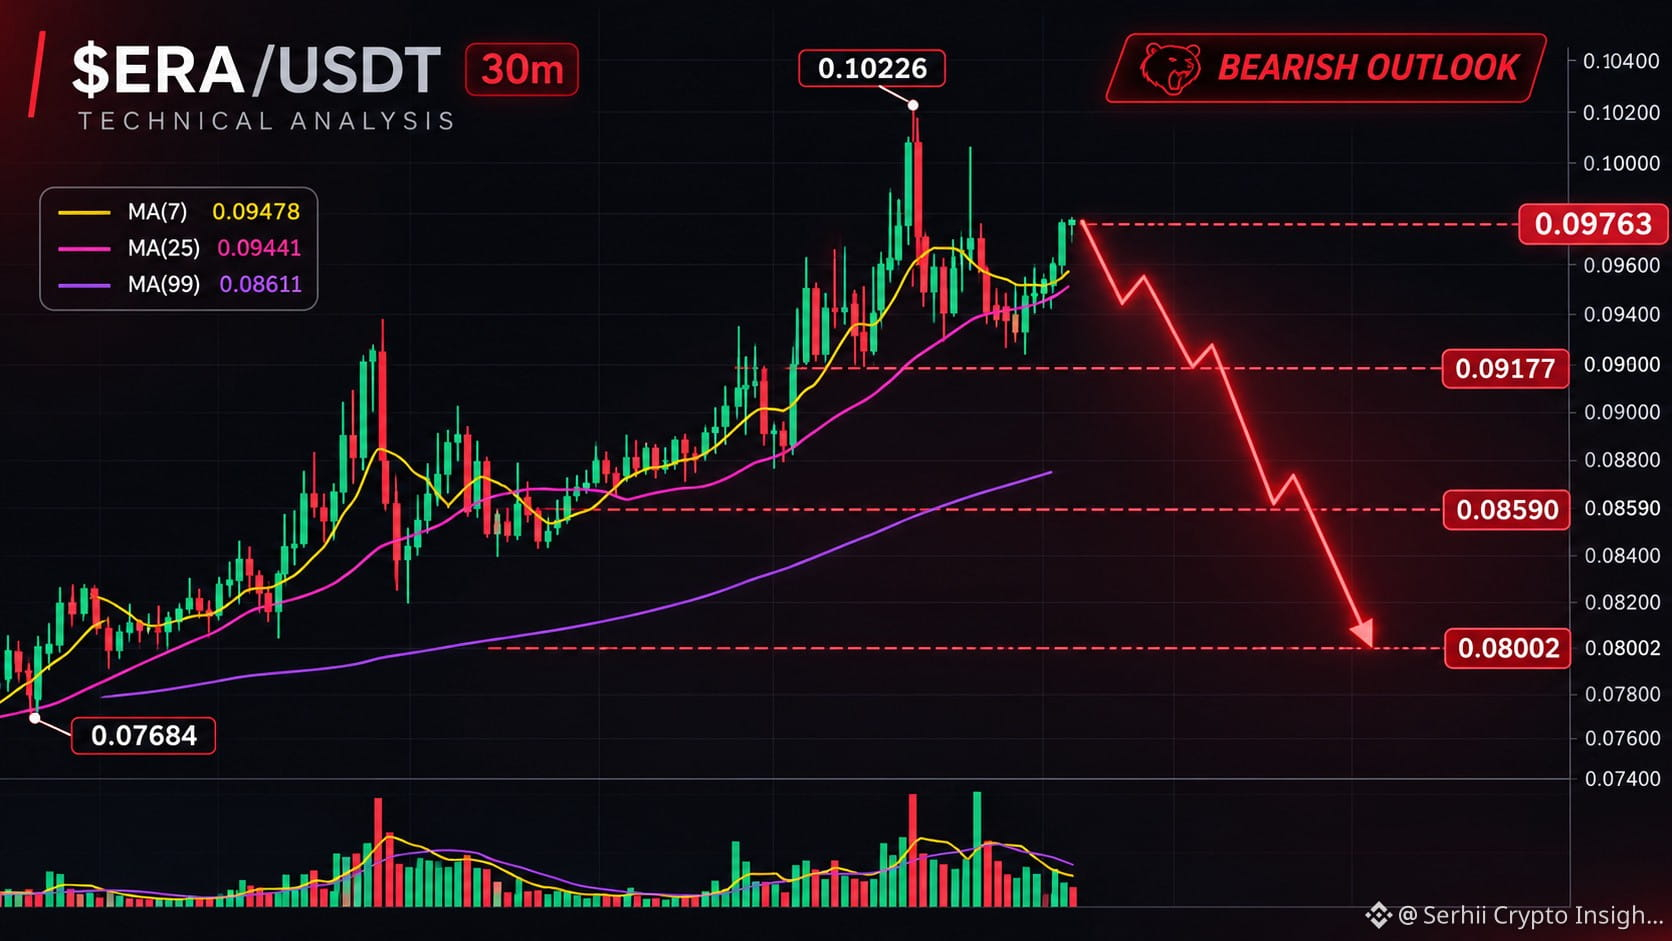
ERA surged +17.61%, reaching $0.10226 before pulling back to $0.09763.
The rally has been impressive, but I'm watching for signs of exhaustion.
📉 My bearish scenario:
- Below $0.0944 → selling pressure could increase.
- First target: $0.0918
- Second target: $0.0859
- Extended target: $0.0800
A breakout above $0.10226 would weaken my bearish outlook.
Meanwhile, $MAGMA (+21.70%) and $PLAY (+14.09%) are also showing strong momentum.
My view: ERA is my candidate for a correction, but I want confirmation before calling a reversal. A strong rally alone isn't a sell signal.
💬 Do you expect ERA to break higher or reverse first?
Market snapshot: November 12, 2026, 17:07 CET. The chart illustrates a hypothetical bearish scenario, not a confirmed price path.
Not financial advice. This is my personal market outlook, not a recommendation to trade.
🔴 $ERA — Is a Sharp Correction Coming?
ERA surged +17.61%, reaching $0.10226 before pulling back to $0.09763.
The rally has been impressive, but I'm watching for signs of exhaustion.
📉 My bearish scenario:
- Below $0.0944 → selling pressure could increase.
- First target: $0.0918
- Second target: $0.0859
- Extended target: $0.0800
A breakout above $0.10226 would weaken my bearish outlook.
Meanwhile, $MAGMA (+21.70%) and $PLAY (+14.09%) are also showing strong momentum.
My view: ERA is my candidate for a correction, but I want confirmation before calling a reversal. A strong rally alone isn't a sell signal.
💬 Do you expect ERA to break higher or reverse first?
Market snapshot: November 12, 2026, 17:07 CET. The chart illustrates a hypothetical bearish scenario, not a confirmed price path.
Not financial advice. This is my personal market outlook, not a recommendation to trade.
ERA surged +17.61%, reaching $0.10226 before pulling back to $0.09763.
The rally has been impressive, but I'm watching for signs of exhaustion.
📉 My bearish scenario:
- Below $0.0944 → selling pressure could increase.
- First target: $0.0918
- Second target: $0.0859
- Extended target: $0.0800
A breakout above $0.10226 would weaken my bearish outlook.
Meanwhile, $MAGMA (+21.70%) and $PLAY (+14.09%) are also showing strong momentum.
My view: ERA is my candidate for a correction, but I want confirmation before calling a reversal. A strong rally alone isn't a sell signal.
💬 Do you expect ERA to break higher or reverse first?
Market snapshot: November 12, 2026, 17:07 CET. The chart illustrates a hypothetical bearish scenario, not a confirmed price path.
Not financial advice. This is my personal market outlook, not a recommendation to trade.
484
🚨 My Call: $BTW Could Be the First to Rebound
Three tokens, all showing deeply negative funding — but one stands out.
$BTW: Down 8.8%, yet already rebounded roughly 4.7% from $0.9618 to $1.007. Funding: −0.3565% per 4h.
$PRL: Funding −0.3836% per 4h. Price remains weak near $0.0721.
$INIT: Down 20.1%. Funding −0.0384% per hour. No convincing recovery yet.
My prediction
I'm backing BTW as the strongest short-term rebound candidate.
If $1.00 holds and price breaks $1.012, I expect a move toward $1.02.
A break below $0.99 would weaken my outlook. A new low below $0.9618 would invalidate this rebound setup.
Negative funding and the recovery from recent lows support my thesis — but they don't guarantee a squeeze.
My bet is on BTW recovering first.
Would you take the same side?
Market snapshot: Nov 12, 2026, 15:31 CET.
Not financial advice. This is my personal market outlook, not a recommendation to open a position.
🚨 My Call: $BTW Could Be the First to Rebound
Three tokens, all showing deeply negative funding — but one stands out.
$BTW : Down 8.8%, yet already rebounded roughly 4.7% from $0.9618 to $1.007. Funding: −0.3565% per 4h.
$PRL: Funding −0.3836% per 4h. Price remains weak near $0.0721.
$INIT: Down 20.1%. Funding −0.0384% per hour. No convincing recovery yet.
My prediction
I'm backing BTW as the strongest short-term rebound candidate.
If $1.00 holds and price breaks $1.012, I expect a move toward $1.02.
A break below $0.99 would weaken my outlook. A new low below $0.9618 would invalidate this rebound setup.
Negative funding and the recovery from recent lows support my thesis — but they don't guarantee a squeeze.
My bet is on BTW recovering first.
Would you take the same side?
Market snapshot: Nov 12, 2026, 15:31 CET.
Not financial advice. This is my personal market outlook, not a recommendation to open a position.
Three tokens, all showing deeply negative funding — but one stands out.
$BTW : Down 8.8%, yet already rebounded roughly 4.7% from $0.9618 to $1.007. Funding: −0.3565% per 4h.
$PRL: Funding −0.3836% per 4h. Price remains weak near $0.0721.
$INIT: Down 20.1%. Funding −0.0384% per hour. No convincing recovery yet.
My prediction
I'm backing BTW as the strongest short-term rebound candidate.
If $1.00 holds and price breaks $1.012, I expect a move toward $1.02.
A break below $0.99 would weaken my outlook. A new low below $0.9618 would invalidate this rebound setup.
Negative funding and the recovery from recent lows support my thesis — but they don't guarantee a squeeze.
My bet is on BTW recovering first.
Would you take the same side?
Market snapshot: Nov 12, 2026, 15:31 CET.
Not financial advice. This is my personal market outlook, not a recommendation to open a position.
960
Article
The most important $PIEVERSE chart this week might not be its price chart.
Three days ago, PIEVERSEThe most important $PIEVERSE chart this week might not be its price chart.
Three days ago, PIEVERSE reached $2.22. By November 12, it was trading around $1.60 — roughly 27% below that peak.
A dramatic reversal. But there's another story unfolding.
On November 14, PIEVERSE faces a scheduled token unlock.
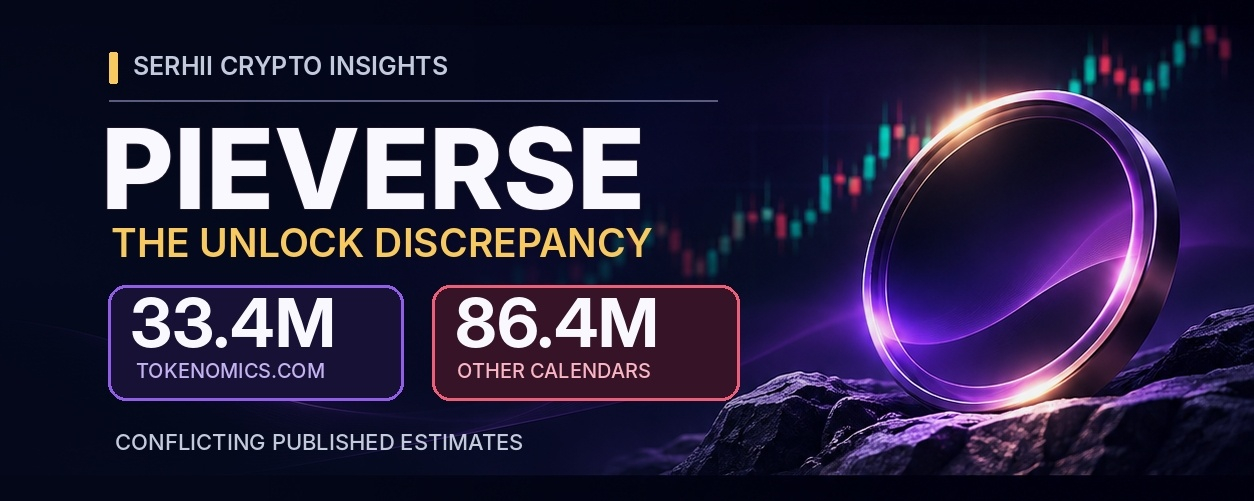
Tokenomics.com estimates 33.4 million tokens. Other published calendars cite approximately 86.4 million.
That's a considerable difference.
I went back to the project's own whitepaper. It allocates 20% of supply to the team and advisers, and another 15% to investors. Yet the unlock timetable is presented as an image rather than a detailed written schedule.
The published estimates still need reconciling. They may be counting different categories of releases.
And that distinction matters.
An unlock doesn't mean someone has sold. It means tokens may become available to move. Whether they reach exchanges — and whether buyers can absorb the supply — is another question entirely.
A price chart tells us what traders have done. A vesting schedule should help us understand what holders may be able to do next.
I'll revisit this after November 14 and compare the published estimates with whatever on-chain evidence can actually be verified.
One question worth debating:
Would you trade around a token unlock if the major calendars couldn't agree on its size?
Sources: Pieverse whitepaper, Tokenomics.com, CoinGlass. November 12, 2026.
#Tokenomics #CryptoResearch
The most important $PIEVERSE chart this week might not be its price chart. Three days ago, PIEVERSE
The most important $PIEVERSE chart this week might not be its price chart.
Three days ago, PIEVERSE reached $2.22. By November 12, it was trading around $1.60 — roughly 27% below that peak.
A dramatic reversal. But there's another story unfolding.
On November 14, PIEVERSE faces a scheduled token unlock.
Tokenomics.com estimates 33.4 million tokens. Other published calendars cite approximately 86.4 million.
That's a considerable difference.
I went back to the project's own whitepaper. It allocates 20% of supply to the team and advisers, and another 15% to investors. Yet the unlock timetable is presented as an image rather than a detailed written schedule.
The published estimates still need reconciling. They may be counting different categories of releases.
And that distinction matters.
An unlock doesn't mean someone has sold. It means tokens may become available to move. Whether they reach exchanges — and whether buyers can absorb the supply — is another question entirely.
A price chart tells us what traders have done. A vesting schedule should help us understand what holders may be able to do next.
I'll revisit this after November 14 and compare the published estimates with whatever on-chain evidence can actually be verified.
One question worth debating:
Would you trade around a token unlock if the major calendars couldn't agree on its size?
Sources: Pieverse whitepaper, Tokenomics.com, CoinGlass. November 12, 2026.
#Tokenomics #CryptoResearch
Three days ago, PIEVERSE reached $2.22. By November 12, it was trading around $1.60 — roughly 27% below that peak.
A dramatic reversal. But there's another story unfolding.
On November 14, PIEVERSE faces a scheduled token unlock.
Tokenomics.com estimates 33.4 million tokens. Other published calendars cite approximately 86.4 million.
That's a considerable difference.
I went back to the project's own whitepaper. It allocates 20% of supply to the team and advisers, and another 15% to investors. Yet the unlock timetable is presented as an image rather than a detailed written schedule.
The published estimates still need reconciling. They may be counting different categories of releases.
And that distinction matters.
An unlock doesn't mean someone has sold. It means tokens may become available to move. Whether they reach exchanges — and whether buyers can absorb the supply — is another question entirely.
A price chart tells us what traders have done. A vesting schedule should help us understand what holders may be able to do next.
I'll revisit this after November 14 and compare the published estimates with whatever on-chain evidence can actually be verified.
One question worth debating:
Would you trade around a token unlock if the major calendars couldn't agree on its size?
Sources: Pieverse whitepaper, Tokenomics.com, CoinGlass. November 12, 2026.
#Tokenomics #CryptoResearch
246
Today’s crypto market delivered another reminder: emotions can be expensive.
🚀 $AGT surged over 140%.
📈 $ARIA showed explosive momentum, followed by a sharp pullback and an attempt to stabilize at higher levels.
But the real story isn't the percentage gains.
When a token jumps 100–200%, everyone sees an opportunity to make quick money.
But here's the question nobody wants to ask: Who is selling while everyone else is buying?
A massive green candle doesn't automatically mean a sustainable bull run.
I'm watching three things:
🔹 Does trading volume remain strong after the initial breakout?
🔹 Can the price hold its new support levels?
🔹 Are buyers returning naturally, or is the move driven purely by hype?
The reaction AFTER the pump often tells us more than the pump itself.
The market rewards patience more often than FOMO.
💬 What's your take?
Are these explosive moves the beginning of a new altcoin wave, or just another round of short-term speculation?
👇 Bullish or bearish? Let's hear your reasoning.
$AGT $ARIA #Crypto #Altcoins #CryptoTrading
Today’s crypto market delivered another reminder: emotions can be expensive.
🚀 $AGT surged over 140%.
📈 $ARIA showed explosive momentum, followed by a sharp pullback and an attempt to stabilize at higher levels.
But the real story isn't the percentage gains.
When a token jumps 100–200%, everyone sees an opportunity to make quick money.
But here's the question nobody wants to ask: Who is selling while everyone else is buying?
A massive green candle doesn't automatically mean a sustainable bull run.
I'm watching three things:
🔹 Does trading volume remain strong after the initial breakout?
🔹 Can the price hold its new support levels?
🔹 Are buyers returning naturally, or is the move driven purely by hype?
The reaction AFTER the pump often tells us more than the pump itself.
The market rewards patience more often than FOMO.
💬 What's your take?
Are these explosive moves the beginning of a new altcoin wave, or just another round of short-term speculation?
👇 Bullish or bearish? Let's hear your reasoning.
$AGT $ARIA #Crypto #Altcoins #CryptoTrading
🚀 $AGT surged over 140%.
📈 $ARIA showed explosive momentum, followed by a sharp pullback and an attempt to stabilize at higher levels.
But the real story isn't the percentage gains.
When a token jumps 100–200%, everyone sees an opportunity to make quick money.
But here's the question nobody wants to ask: Who is selling while everyone else is buying?
A massive green candle doesn't automatically mean a sustainable bull run.
I'm watching three things:
🔹 Does trading volume remain strong after the initial breakout?
🔹 Can the price hold its new support levels?
🔹 Are buyers returning naturally, or is the move driven purely by hype?
The reaction AFTER the pump often tells us more than the pump itself.
The market rewards patience more often than FOMO.
💬 What's your take?
Are these explosive moves the beginning of a new altcoin wave, or just another round of short-term speculation?
👇 Bullish or bearish? Let's hear your reasoning.
$AGT $ARIA #Crypto #Altcoins #CryptoTrading
648
$INIT Here are the key levels on the coin’s chart—not a guaranteed forecast:
INIT price From current price Meaning
$0.2299 +7.3% First resistance
$0.2321 +8.3% 99-period moving average (MA(99))
$0.2563 +19.6% Next possible resistance
$0.2036 −5.0% Nearest support
$0.1832 −14.5% Retest of the bottom, which I consider the most likely
$INIT Here are the key levels on the coin’s chart—not a guaranteed forecast:
INIT price From current price Meaning
$0.2299 +7.3% First resistance
$0.2321 +8.3% 99-period moving average (MA(99))
$0.2563 +19.6% Next possible resistance
$0.2036 −5.0% Nearest support
$0.1832 −14.5% Retest of the bottom, which I consider the most likely
INIT price From current price Meaning
$0.2299 +7.3% First resistance
$0.2321 +8.3% 99-period moving average (MA(99))
$0.2563 +19.6% Next possible resistance
$0.2036 −5.0% Nearest support
$0.1832 −14.5% Retest of the bottom, which I consider the most likely
200
$INIT The downpour is approaching, the downpour is approaching )
$INIT The downpour is approaching, the downpour is approaching )
41
$INIT Let's brag about our amazing achievements this year)))
$INIT Let's brag about our amazing achievements this year)))
142
$JCT With 6 years of experience trading cryptocurrency, I see this coin completely tanking. It’s unlikely to reach its previous high again; it’s more likely to fall back to its starting point of 0.002 or even lower, wiping out another zero.
$JCT With 6 years of experience trading cryptocurrency, I see this coin completely tanking. It’s unlikely to reach its previous high again; it’s more likely to fall back to its starting point of 0.002 or even lower, wiping out another zero.
538
Log in to explore more content
Join global crypto users on Binance Square
⚡️ Get latest and useful information about crypto.
💬 Trusted by the world’s largest crypto exchange.
👍 Discover real insights from verified creators.
Email / Phone number