

Future Pulse
26.7k Posts

Future Pulse
 Square Verified+
Report
Block User
Hi, I'm passionate about crypto, technology, and innovation. I enjoy exploring ideas, sharing insights, and staying ahead of what's next.
Open Trade
High-Frequency Trader
2.7 Years
4.1K+ Following
34.3K+ Followers
54.1K+ Liked
Posts
Portfolio
All
Quotes
Live
·
--
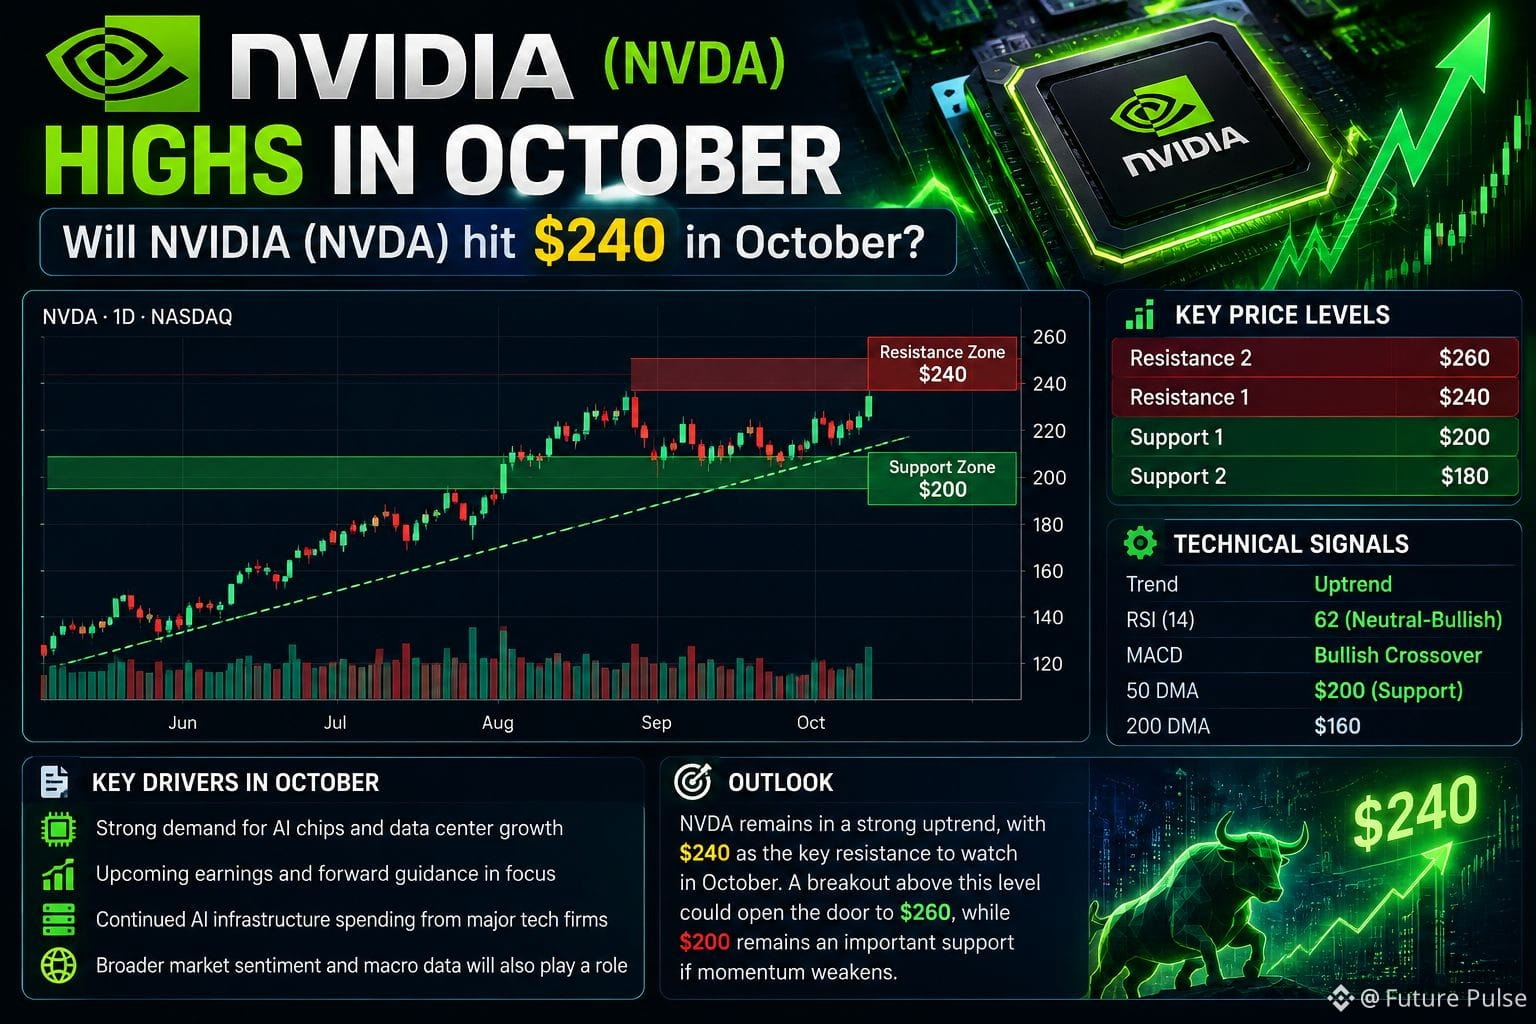
Will NVIDIA (NVDA) hit $240 in October?
NVIDIA is already pressing against that level. NVDA closed around $236.40 on Oct. 5, after reaching an intraday high near $237.85, putting $240 only about 1% higher.
The setup is increasingly bullish: NVDA has pushed into record territory, while Morgan Stanley recently reaffirmed an Overweight rating with a $300 target. Strong AI-related demand and positive signals from NVIDIA supplier Foxconn are also supporting momentum.
Technically, $237–$240 is the immediate breakout zone. A clean move above $240 could signal another leg higher, while rejection around this area could trigger a short-term consolidation.
My take: $240 looks like a realistic October test, but holding above it is the more important question.
$MU
{future}(MUUSDT)
$NVDAB
{spot}(NVDABUSDT)
$NVDA
{future}(NVDAUSDT)
Will NVIDIA (NVDA) hit $240 in October?
NVIDIA is already pressing against that level. NVDA closed around $236.40 on Oct. 5, after reaching an intraday high near $237.85, putting $240 only about 1% higher.
The setup is increasingly bullish: NVDA has pushed into record territory, while Morgan Stanley recently reaffirmed an Overweight rating with a $300 target. Strong AI-related demand and positive signals from NVIDIA supplier Foxconn are also supporting momentum.
Technically, $237–$240 is the immediate breakout zone. A clean move above $240 could signal another leg higher, while rejection around this area could trigger a short-term consolidation.
My take: $240 looks like a realistic October test, but holding above it is the more important question.
$MU
$NVDAB
$NVDA
NVIDIA is already pressing against that level. NVDA closed around $236.40 on Oct. 5, after reaching an intraday high near $237.85, putting $240 only about 1% higher.
The setup is increasingly bullish: NVDA has pushed into record territory, while Morgan Stanley recently reaffirmed an Overweight rating with a $300 target. Strong AI-related demand and positive signals from NVIDIA supplier Foxconn are also supporting momentum.
Technically, $237–$240 is the immediate breakout zone. A clean move above $240 could signal another leg higher, while rejection around this area could trigger a short-term consolidation.
My take: $240 looks like a realistic October test, but holding above it is the more important question.
$MU
$NVDAB
$NVDA
🚀 Yes, easily
📈 Yes, but after a pullback
⚖️ Stays below $240
🔻 Reverses lower
16 hr(s) left
419
·
--
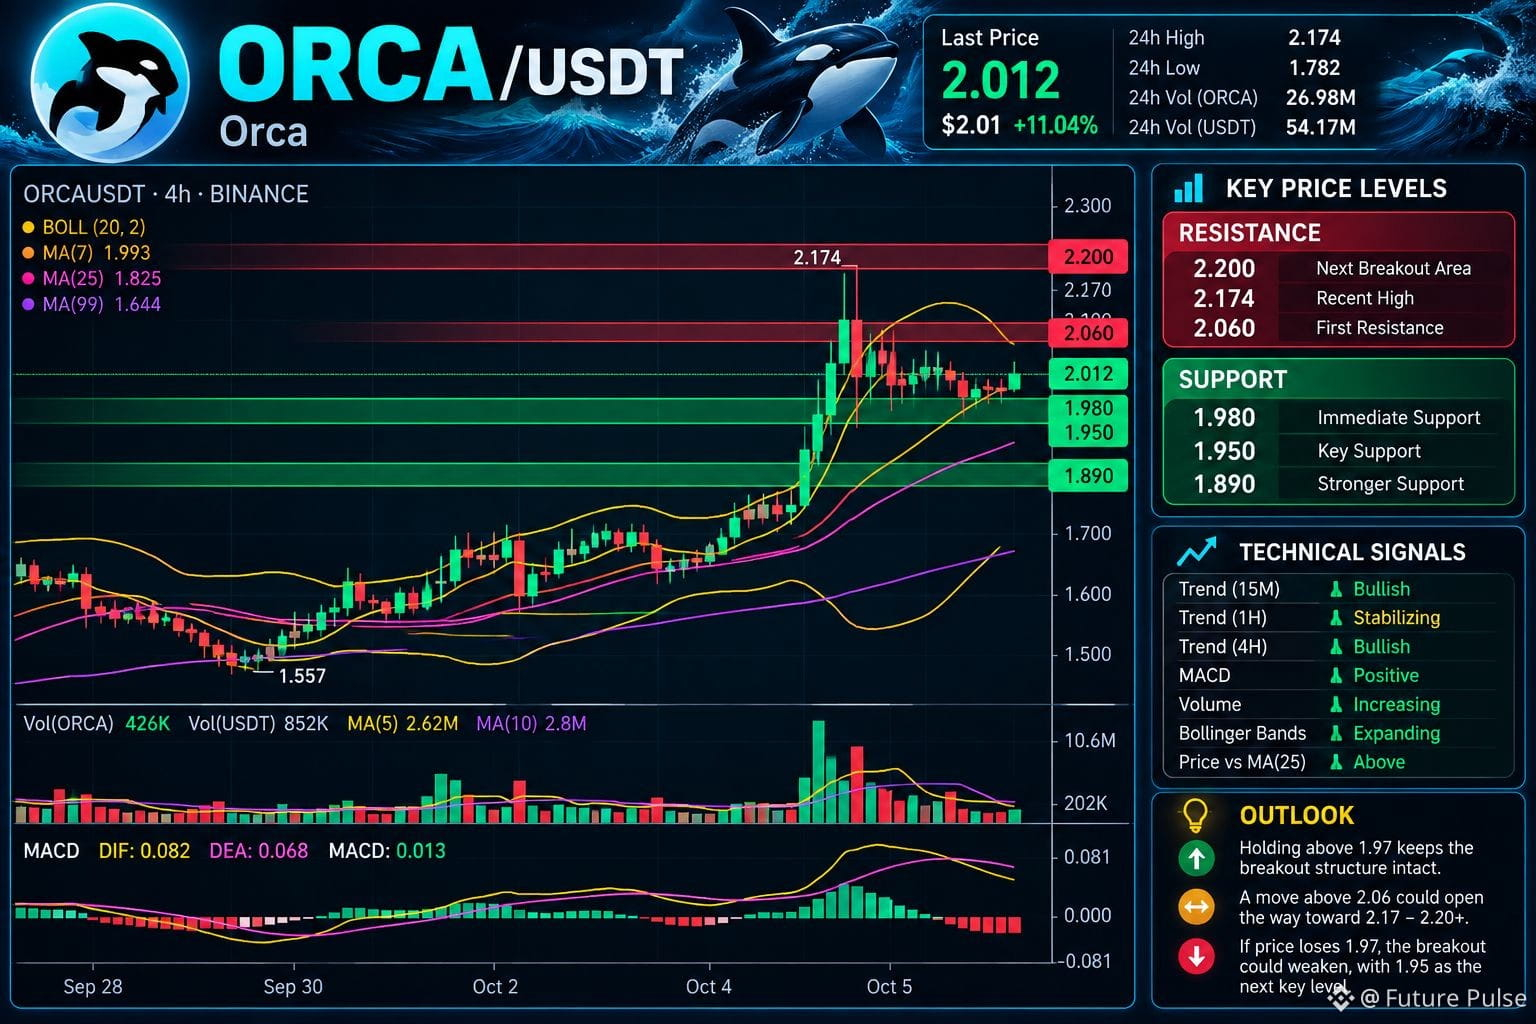
ORCA has pushed sharply from the $1.95 area toward $2.17, but the latest candles show a different phase: after the initial expansion, price is now consolidating around $2.00.
The important part is whether this consolidation becomes a launchpad or a rejection zone.
Are you ready for short?
🟢 Support
$1.98–$1.97 — immediate support$1.95 — key structural level$1.89 — deeper support
🔴 Resistance
$2.06 — first upside hurdle$2.17 — recent high$2.20+ — next breakout area
The 15M chart is showing renewed buying volume, while the 1H structure is trying to stabilize around the moving-average cluster.
For me, the key level is $1.97. Holding above it keeps the recent breakout structure alive; losing it would make the move considerably less convincing.
ORCA is no longer in the breakout phase—the next battle is about holding the breakout.
$ORCA
{future}(ORCAUSDT)
$SNDK
{future}(SNDKUSDT)
$BR
{future}(BRUSDT)
ORCA has pushed sharply from the $1.95 area toward $2.17, but the latest candles show a different phase: after the initial expansion, price is now consolidating around $2.00.
The important part is whether this consolidation becomes a launchpad or a rejection zone.
Are you ready for short?
🟢 Support
$1.98–$1.97 — immediate support$1.95 — key structural level$1.89 — deeper support
🔴 Resistance
$2.06 — first upside hurdle$2.17 — recent high$2.20+ — next breakout area
The 15M chart is showing renewed buying volume, while the 1H structure is trying to stabilize around the moving-average cluster.
For me, the key level is $1.97. Holding above it keeps the recent breakout structure alive; losing it would make the move considerably less convincing.
ORCA is no longer in the breakout phase—the next battle is about holding the breakout.
$ORCA
$SNDK
$BR
The important part is whether this consolidation becomes a launchpad or a rejection zone.
Are you ready for short?
🟢 Support
$1.98–$1.97 — immediate support$1.95 — key structural level$1.89 — deeper support
🔴 Resistance
$2.06 — first upside hurdle$2.17 — recent high$2.20+ — next breakout area
The 15M chart is showing renewed buying volume, while the 1H structure is trying to stabilize around the moving-average cluster.
For me, the key level is $1.97. Holding above it keeps the recent breakout structure alive; losing it would make the move considerably less convincing.
ORCA is no longer in the breakout phase—the next battle is about holding the breakout.
$ORCA
$SNDK
$BR
911
·
--
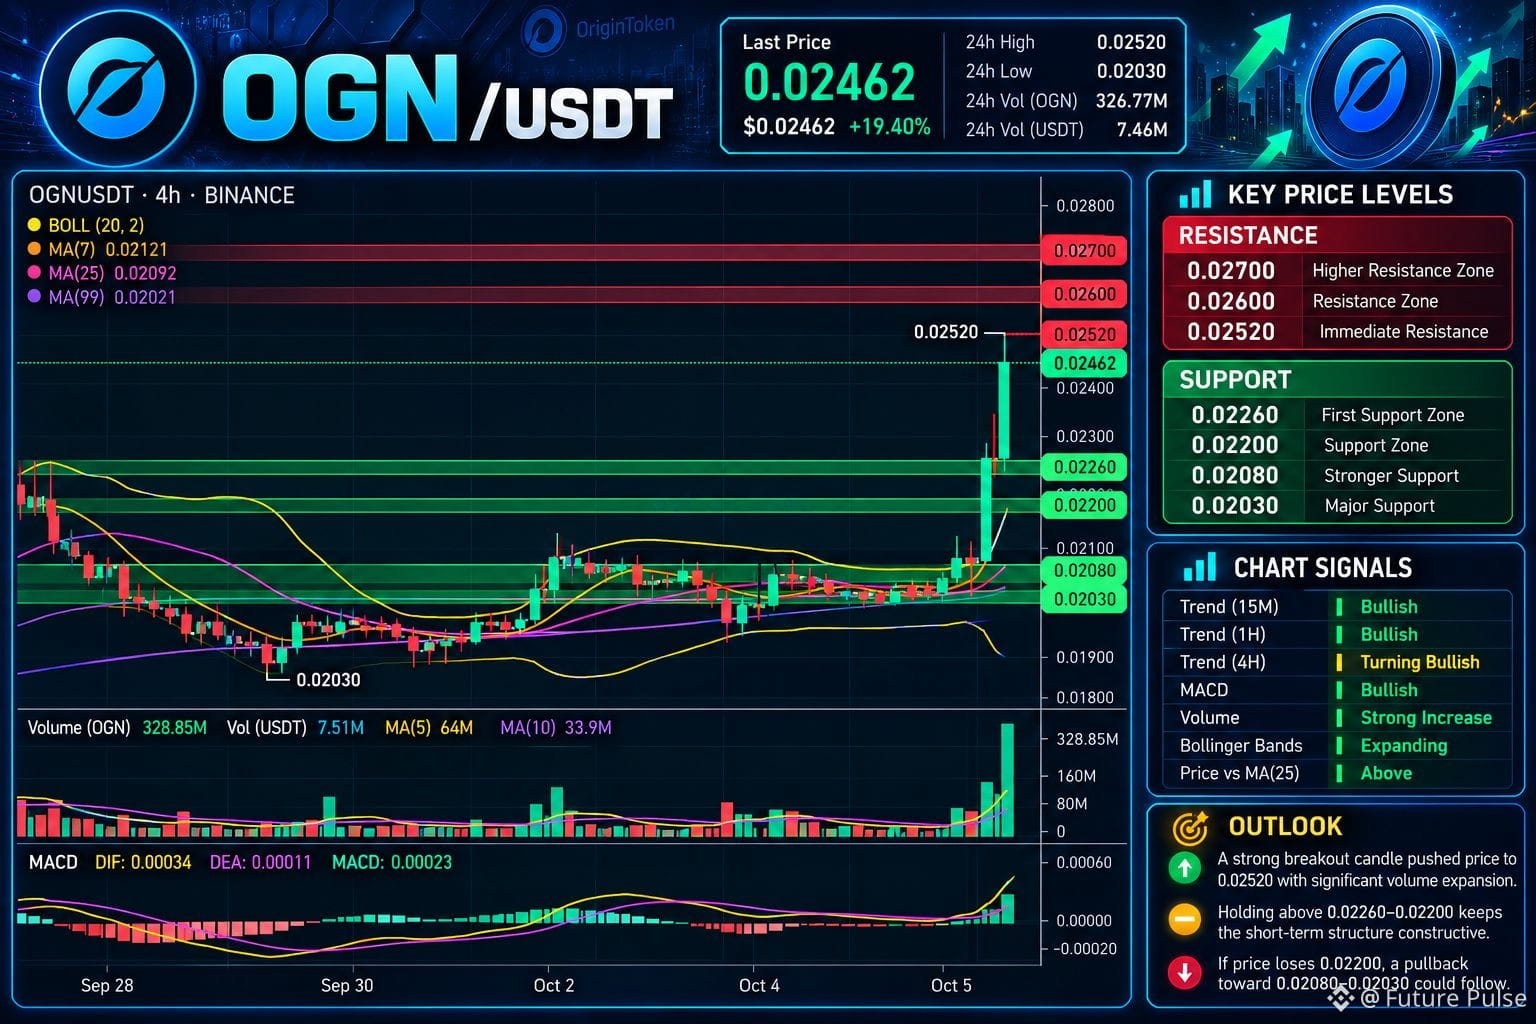
OGN has just made a decisive move out of its long consolidation zone. Price jumped toward $0.02520, accompanied by a major expansion in volume and a clear positive shift in MACD momentum.
What stands out to me is that the breakout didn't happen in isolation—the volume expansion gives the move more significance than a simple price spike.
🟢 Support
$0.02260–$0.02200 — first zone to watch$0.02080–$0.02030 — stronger support
🔴 Resistance
$0.02520 — immediate barrier$0.02600$0.02700 — higher resistance zone
The interesting question now isn't simply “how high can OGN go?” It's whether buyers can defend the breakout area after such a sharp expansion.
A hold above $0.02200–$0.02260 would keep the current structure constructive, while a move back below it could signal that the breakout needs more time to develop.
OGN has awakened—but confirmation matters more than excitement.
$OGN
{future}(OGNUSDT)
$MU
{future}(MUUSDT)
$SPCXB
{spot}(SPCXBUSDT)
OGN has just made a decisive move out of its long consolidation zone. Price jumped toward $0.02520, accompanied by a major expansion in volume and a clear positive shift in MACD momentum.
What stands out to me is that the breakout didn't happen in isolation—the volume expansion gives the move more significance than a simple price spike.
🟢 Support
$0.02260–$0.02200 — first zone to watch$0.02080–$0.02030 — stronger support
🔴 Resistance
$0.02520 — immediate barrier$0.02600$0.02700 — higher resistance zone
The interesting question now isn't simply “how high can OGN go?” It's whether buyers can defend the breakout area after such a sharp expansion.
A hold above $0.02200–$0.02260 would keep the current structure constructive, while a move back below it could signal that the breakout needs more time to develop.
OGN has awakened—but confirmation matters more than excitement.
$OGN
$MU
$SPCXB
What stands out to me is that the breakout didn't happen in isolation—the volume expansion gives the move more significance than a simple price spike.
🟢 Support
$0.02260–$0.02200 — first zone to watch$0.02080–$0.02030 — stronger support
🔴 Resistance
$0.02520 — immediate barrier$0.02600$0.02700 — higher resistance zone
The interesting question now isn't simply “how high can OGN go?” It's whether buyers can defend the breakout area after such a sharp expansion.
A hold above $0.02200–$0.02260 would keep the current structure constructive, while a move back below it could signal that the breakout needs more time to develop.
OGN has awakened—but confirmation matters more than excitement.
$OGN
$MU
$SPCXB
1
615
·
--
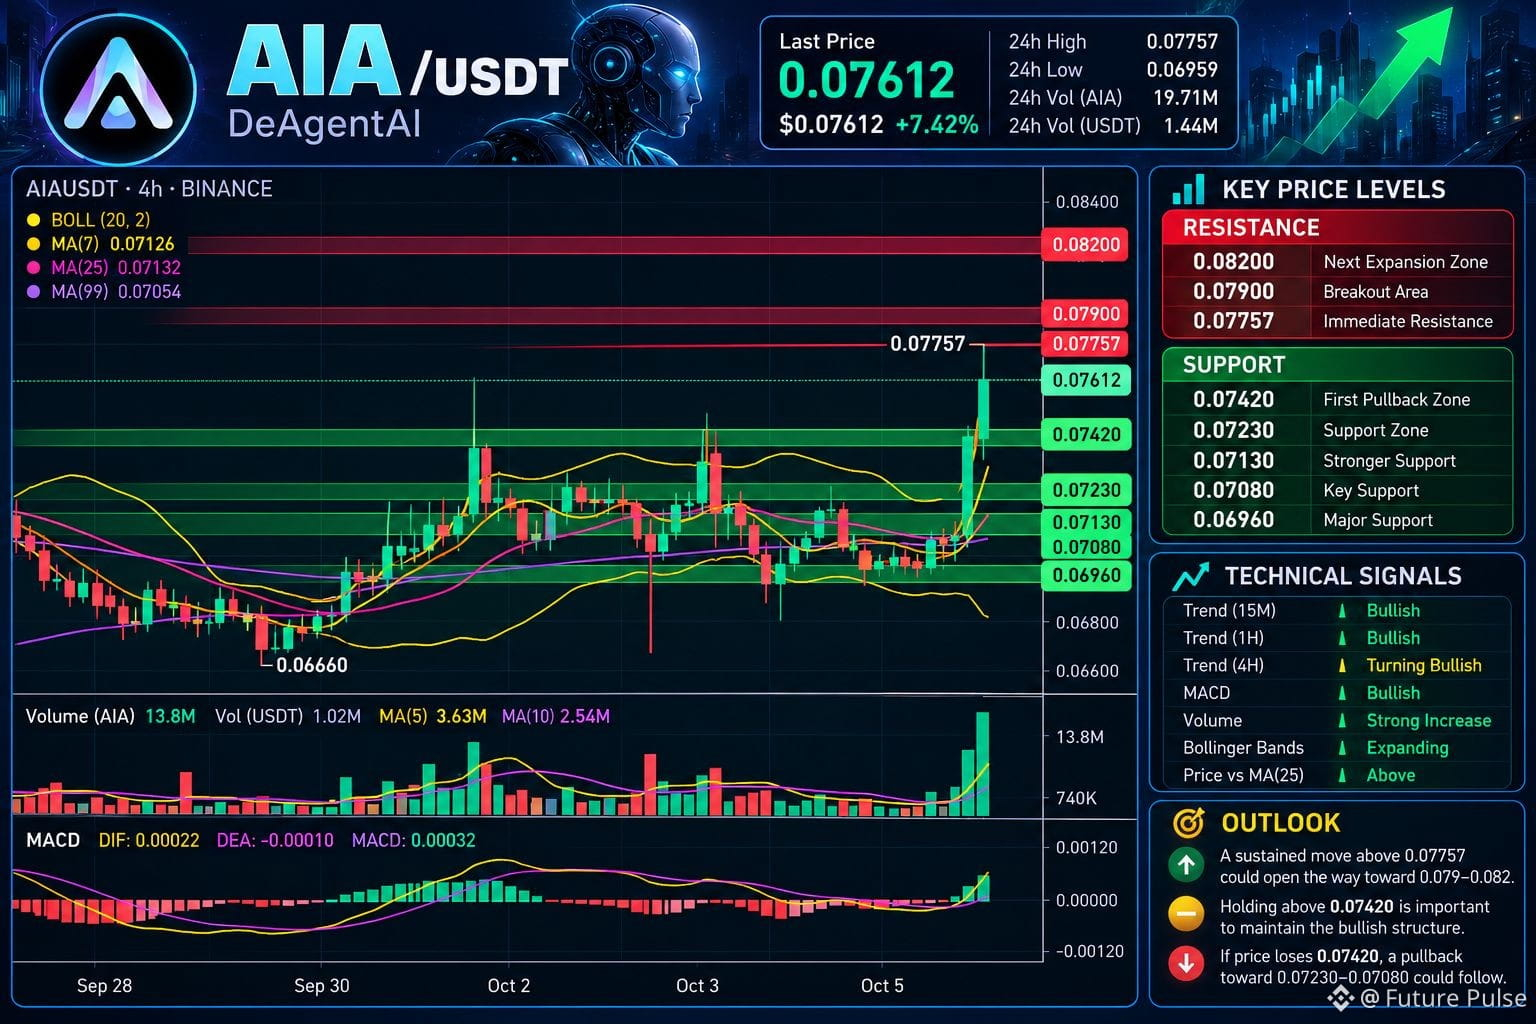
AIA has shifted from a tight 0.069–0.071 range into a sharp upside expansion. Price is now around 0.076, with the 15M and 1H charts showing strong volume expansion and positive MACD.
The move is clearly momentum-driven, but price is already pressing the recent 0.07757 high. That makes the next reaction more important than simply chasing the breakout.
🟢 Support
0.07420–0.07230 — first pullback zone
0.07130–0.07080 — stronger structural support
0.06960 — major base
🔴 Resistance
0.07757 — immediate high
0.07800–0.07900 — breakout area
0.08200+ — next expansion zone if momentum persists
A clean break and hold above 0.07757 could keep the momentum structure intact. If price falls back below 0.07420, I would watch whether buyers defend the lower support cluster.
The interesting part: volume expanded exactly as price broke out of the range. Now the market has to prove that this is a genuine continuation rather than a short-lived momentum spike.
$AIA
{future}(AIAUSDT)
$DOS
{future}(DOSUSDT)
$PONS
{future}(PONSUSDT)
#AIA
#DOS
#pons
AIA has shifted from a tight 0.069–0.071 range into a sharp upside expansion. Price is now around 0.076, with the 15M and 1H charts showing strong volume expansion and positive MACD.
The move is clearly momentum-driven, but price is already pressing the recent 0.07757 high. That makes the next reaction more important than simply chasing the breakout.
🟢 Support
0.07420–0.07230 — first pullback zone
0.07130–0.07080 — stronger structural support
0.06960 — major base
🔴 Resistance
0.07757 — immediate high
0.07800–0.07900 — breakout area
0.08200+ — next expansion zone if momentum persists
A clean break and hold above 0.07757 could keep the momentum structure intact. If price falls back below 0.07420, I would watch whether buyers defend the lower support cluster.
The interesting part: volume expanded exactly as price broke out of the range. Now the market has to prove that this is a genuine continuation rather than a short-lived momentum spike.
$AIA
$DOS
$PONS
#AIA
#DOS
#pons
The move is clearly momentum-driven, but price is already pressing the recent 0.07757 high. That makes the next reaction more important than simply chasing the breakout.
🟢 Support
0.07420–0.07230 — first pullback zone
0.07130–0.07080 — stronger structural support
0.06960 — major base
🔴 Resistance
0.07757 — immediate high
0.07800–0.07900 — breakout area
0.08200+ — next expansion zone if momentum persists
A clean break and hold above 0.07757 could keep the momentum structure intact. If price falls back below 0.07420, I would watch whether buyers defend the lower support cluster.
The interesting part: volume expanded exactly as price broke out of the range. Now the market has to prove that this is a genuine continuation rather than a short-lived momentum spike.
$AIA
$DOS
$PONS
#AIA
#DOS
#pons
847
·
--
You wanna go long or short? Comment below
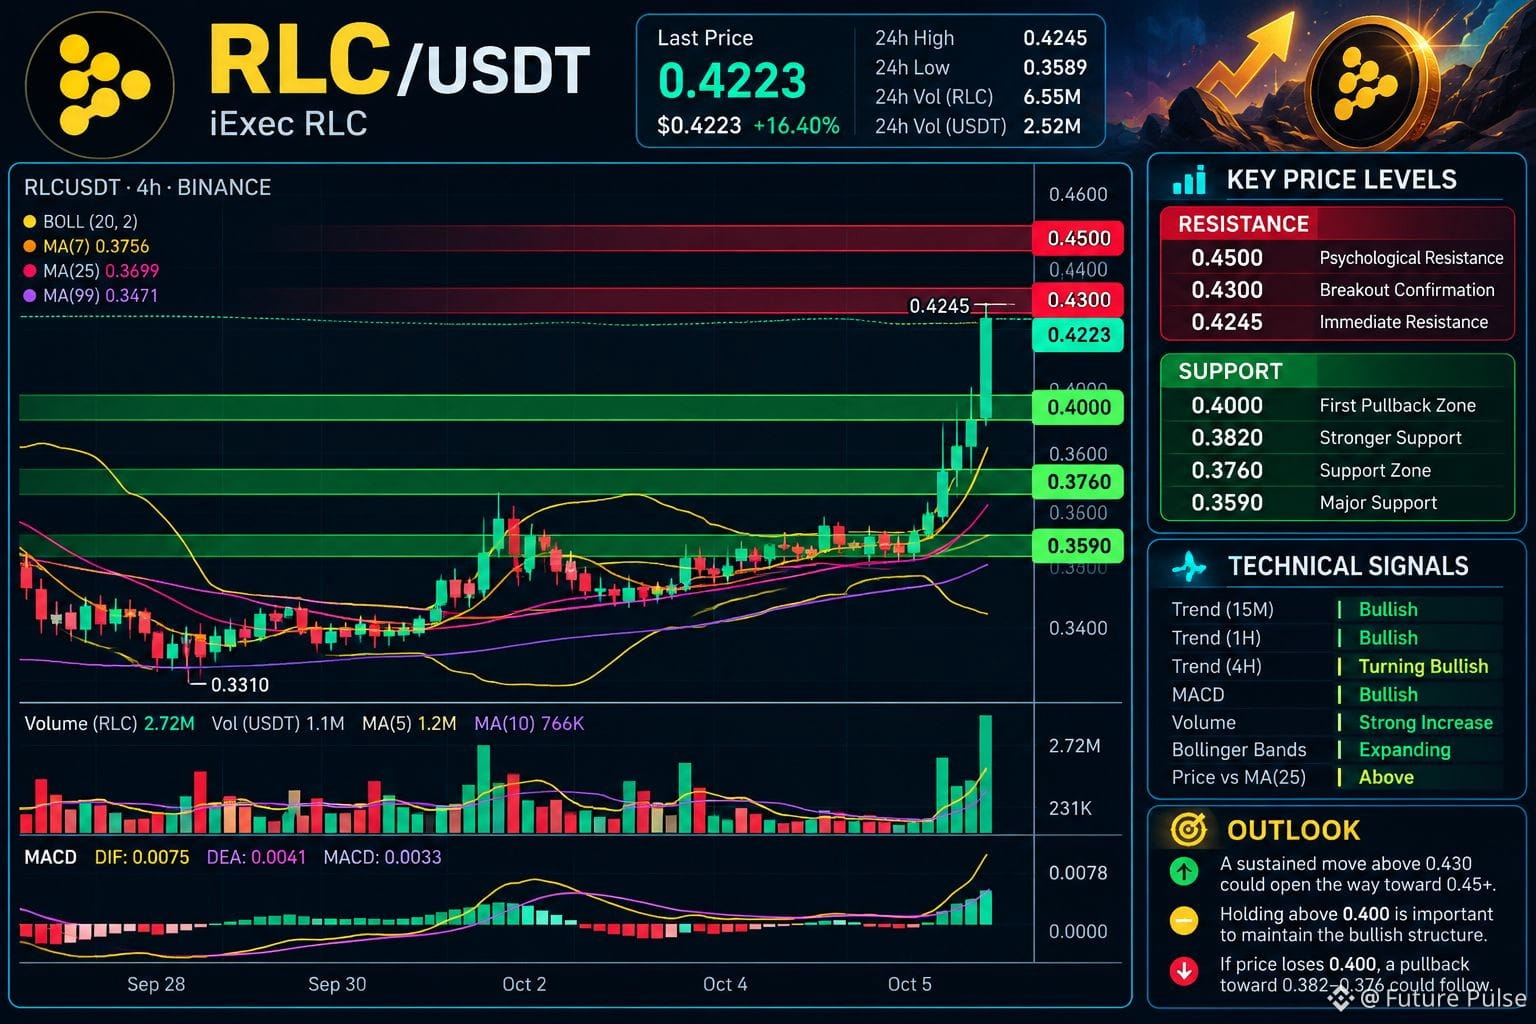
RLC is showing a strong breakout across the 15M, 1H and 4H charts. Price has pushed from the 0.36 area to above 0.42, while volume expanded sharply and MACD turned strongly positive.
The move is impressive, but the current price is also sitting close to the recent high, so chasing the candle carries more risk than waiting for the structure to prove itself.
🟢 Support
0.400–0.396 — first pullback zone
0.382–0.376 — stronger support
0.359 — major structural support
🔴 Resistance
0.4245 — immediate high
0.427–0.430 — breakout confirmation area
0.45+ — potential psychological extension zone
A clean hold above 0.400 would keep the breakout structure constructive. If RLC loses that level with rising selling volume, I would watch 0.382–0.376 for the next reaction.
The key observation: volume is confirming the move, but the next test is whether buyers can turn this sudden expansion into a sustainable trend rather than a one-candle spike.
$NVDAB
{spot}(NVDABUSDT)
$AAPLB
{spot}(AAPLBUSDT)
$RLC
{future}(RLCUSDT)
You wanna go long or short? Comment below
RLC is showing a strong breakout across the 15M, 1H and 4H charts. Price has pushed from the 0.36 area to above 0.42, while volume expanded sharply and MACD turned strongly positive.
The move is impressive, but the current price is also sitting close to the recent high, so chasing the candle carries more risk than waiting for the structure to prove itself.
🟢 Support
0.400–0.396 — first pullback zone
0.382–0.376 — stronger support
0.359 — major structural support
🔴 Resistance
0.4245 — immediate high
0.427–0.430 — breakout confirmation area
0.45+ — potential psychological extension zone
A clean hold above 0.400 would keep the breakout structure constructive. If RLC loses that level with rising selling volume, I would watch 0.382–0.376 for the next reaction.
The key observation: volume is confirming the move, but the next test is whether buyers can turn this sudden expansion into a sustainable trend rather than a one-candle spike.
$NVDAB
$AAPLB
$RLC
RLC is showing a strong breakout across the 15M, 1H and 4H charts. Price has pushed from the 0.36 area to above 0.42, while volume expanded sharply and MACD turned strongly positive.
The move is impressive, but the current price is also sitting close to the recent high, so chasing the candle carries more risk than waiting for the structure to prove itself.
🟢 Support
0.400–0.396 — first pullback zone
0.382–0.376 — stronger support
0.359 — major structural support
🔴 Resistance
0.4245 — immediate high
0.427–0.430 — breakout confirmation area
0.45+ — potential psychological extension zone
A clean hold above 0.400 would keep the breakout structure constructive. If RLC loses that level with rising selling volume, I would watch 0.382–0.376 for the next reaction.
The key observation: volume is confirming the move, but the next test is whether buyers can turn this sudden expansion into a sustainable trend rather than a one-candle spike.
$NVDAB
$AAPLB
$RLC
266
·
--
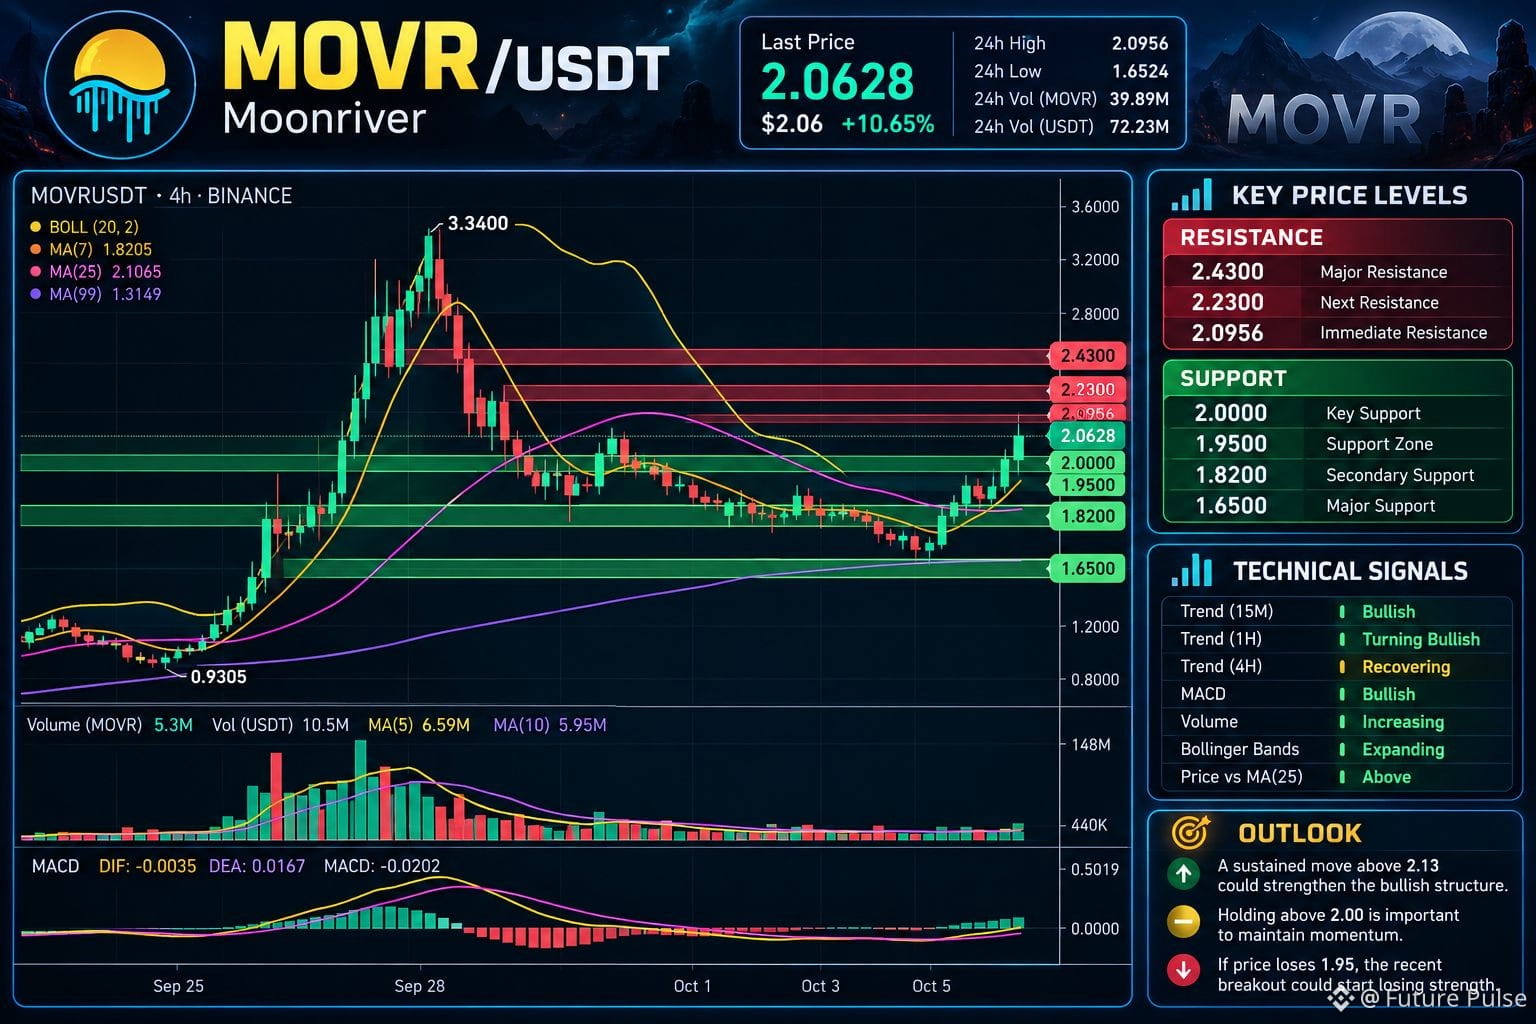
MOVR has shifted sharply from the 1.65 area, with buyers pushing price back above the 2.00 psychological level. The 15M chart shows strong upside momentum, rising volume and positive MACD, while the 1H structure is also turning higher.
The important question now is whether this move can hold above 2.00 rather than simply become another rejection.
🟢 Support
2.00–1.95 — first zone to defend
1.83–1.82 — secondary support
1.70–1.65 — major structural support
🔴 Resistance
2.095–2.13 — immediate hurdle
2.23 — next major resistance
2.43 — higher-timeframe MA resistance
A sustained move above 2.13 would strengthen the bullish structure. If price loses 1.95, however, the recent breakout could start losing momentum.
For me, 2.00 is the key line to watch now.
$MOVR
{future}(MOVRUSDT)
$GTC
{future}(GTCUSDT)
$FET
{future}(FETUSDT)
MOVR has shifted sharply from the 1.65 area, with buyers pushing price back above the 2.00 psychological level. The 15M chart shows strong upside momentum, rising volume and positive MACD, while the 1H structure is also turning higher.
The important question now is whether this move can hold above 2.00 rather than simply become another rejection.
🟢 Support
2.00–1.95 — first zone to defend
1.83–1.82 — secondary support
1.70–1.65 — major structural support
🔴 Resistance
2.095–2.13 — immediate hurdle
2.23 — next major resistance
2.43 — higher-timeframe MA resistance
A sustained move above 2.13 would strengthen the bullish structure. If price loses 1.95, however, the recent breakout could start losing momentum.
For me, 2.00 is the key line to watch now.
$MOVR
$GTC
$FET
The important question now is whether this move can hold above 2.00 rather than simply become another rejection.
🟢 Support
2.00–1.95 — first zone to defend
1.83–1.82 — secondary support
1.70–1.65 — major structural support
🔴 Resistance
2.095–2.13 — immediate hurdle
2.23 — next major resistance
2.43 — higher-timeframe MA resistance
A sustained move above 2.13 would strengthen the bullish structure. If price loses 1.95, however, the recent breakout could start losing momentum.
For me, 2.00 is the key line to watch now.
$MOVR
$GTC
$FET
730
·
--
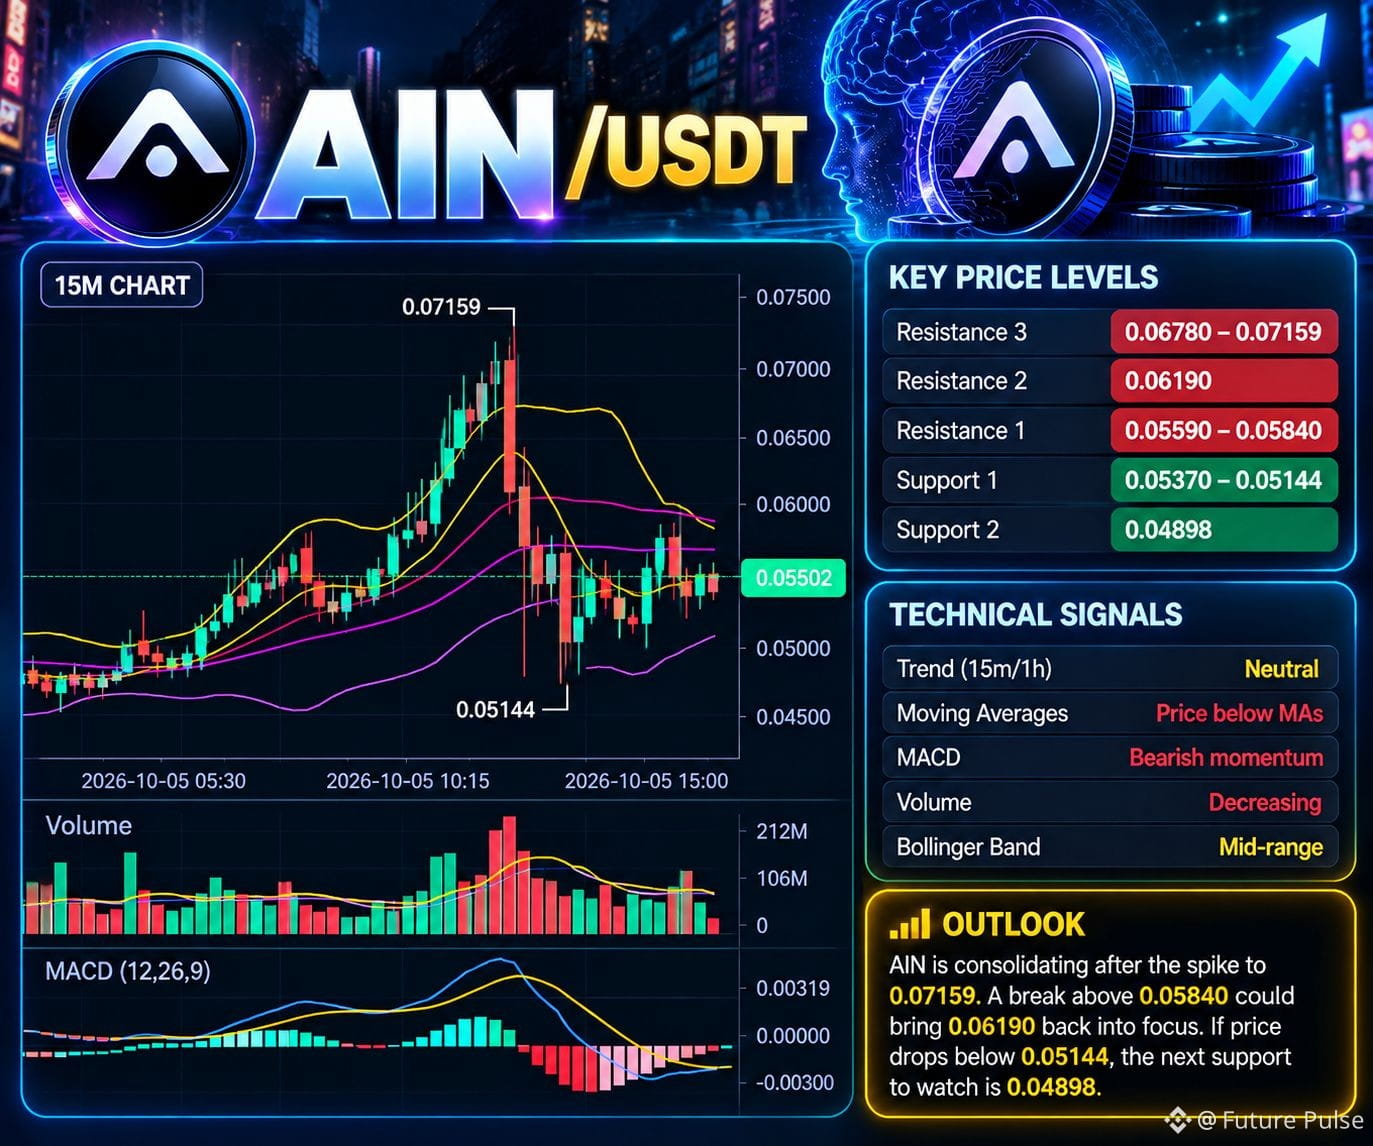
AIN has made a sharp expansion from the 0.023 area, but the charts show a clear shift from explosive momentum to consolidation. After the spike toward 0.07159, price is now holding around 0.055, while the 15M and 1H charts show buyers struggling to regain the short-term moving-average cluster.
🟢 Support 0.05370–0.05144
0.04898 — deeper support
🔴 Resistance 0.05590–0.05840
0.06190 — breakout zone
0.06780–0.07159 — major supply area
I would wait for confirmation rather than chase. A reclaim of 0.05840 with improving momentum could bring 0.06190 back into focus. Conversely, losing 0.05144 would weaken the structure and expose the lower support near 0.04898.
The interesting part here is not the size of the earlier pump—it’s whether AIN can build a new base above the post-breakout range.
$GTC
{future}(GTCUSDT)
$BR
{future}(BRUSDT)
$AIN
{future}(AINUSDT)
AIN has made a sharp expansion from the 0.023 area, but the charts show a clear shift from explosive momentum to consolidation. After the spike toward 0.07159, price is now holding around 0.055, while the 15M and 1H charts show buyers struggling to regain the short-term moving-average cluster.
🟢 Support 0.05370–0.05144
0.04898 — deeper support
🔴 Resistance 0.05590–0.05840
0.06190 — breakout zone
0.06780–0.07159 — major supply area
I would wait for confirmation rather than chase. A reclaim of 0.05840 with improving momentum could bring 0.06190 back into focus. Conversely, losing 0.05144 would weaken the structure and expose the lower support near 0.04898.
The interesting part here is not the size of the earlier pump—it’s whether AIN can build a new base above the post-breakout range.
$GTC
$BR
$AIN
🟢 Support 0.05370–0.05144
0.04898 — deeper support
🔴 Resistance 0.05590–0.05840
0.06190 — breakout zone
0.06780–0.07159 — major supply area
I would wait for confirmation rather than chase. A reclaim of 0.05840 with improving momentum could bring 0.06190 back into focus. Conversely, losing 0.05144 would weaken the structure and expose the lower support near 0.04898.
The interesting part here is not the size of the earlier pump—it’s whether AIN can build a new base above the post-breakout range.
$GTC
$BR
$AIN
1
1.2k
·
--
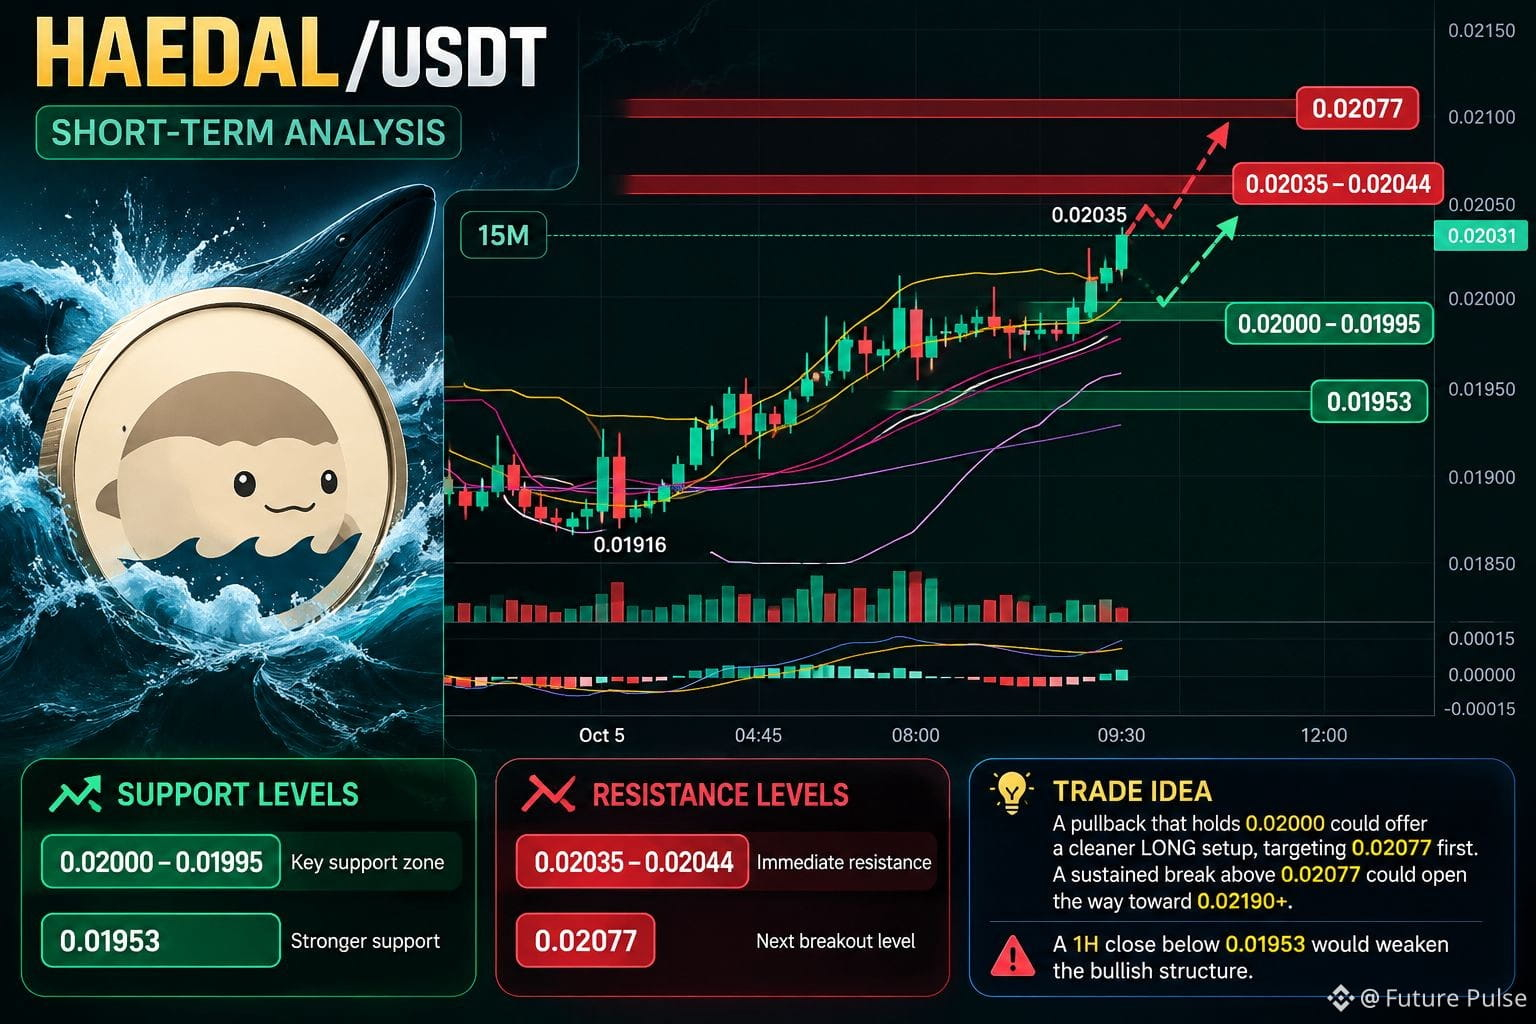
HAEDAL has shifted into a short-term bullish structure across the 15M and 1H charts, with price holding above the key moving averages. The important detail is that the current move is approaching the 0.02035–0.02044 area, where the 15M/1H upper Bollinger Bands suggest resistance.
🟢 Support 0.02000–0.01995
0.01953 — stronger support
🔴 Resistance 0.02035–0.02044
0.02077 — next breakout level
I would avoid chasing the current candle. A pullback that holds 0.02000 could offer a cleaner LONG setup, targeting 0.02077 first. A sustained break above 0.02077 could open the way toward 0.02190+.
$HAEDAL
{future}(HAEDALUSDT)
$PONS
{future}(PONSUSDT)
$TMX
{alpha}(560x3c2f61f2e27c865981d2e7aaf6b2cdf823030039)
HAEDAL has shifted into a short-term bullish structure across the 15M and 1H charts, with price holding above the key moving averages. The important detail is that the current move is approaching the 0.02035–0.02044 area, where the 15M/1H upper Bollinger Bands suggest resistance.
🟢 Support 0.02000–0.01995
0.01953 — stronger support
🔴 Resistance 0.02035–0.02044
0.02077 — next breakout level
I would avoid chasing the current candle. A pullback that holds 0.02000 could offer a cleaner LONG setup, targeting 0.02077 first. A sustained break above 0.02077 could open the way toward 0.02190+.
$HAEDAL
$PONS
$TMX
🟢 Support 0.02000–0.01995
0.01953 — stronger support
🔴 Resistance 0.02035–0.02044
0.02077 — next breakout level
I would avoid chasing the current candle. A pullback that holds 0.02000 could offer a cleaner LONG setup, targeting 0.02077 first. A sustained break above 0.02077 could open the way toward 0.02190+.
$HAEDAL
$PONS
$TMX
2
1.1k
·
--
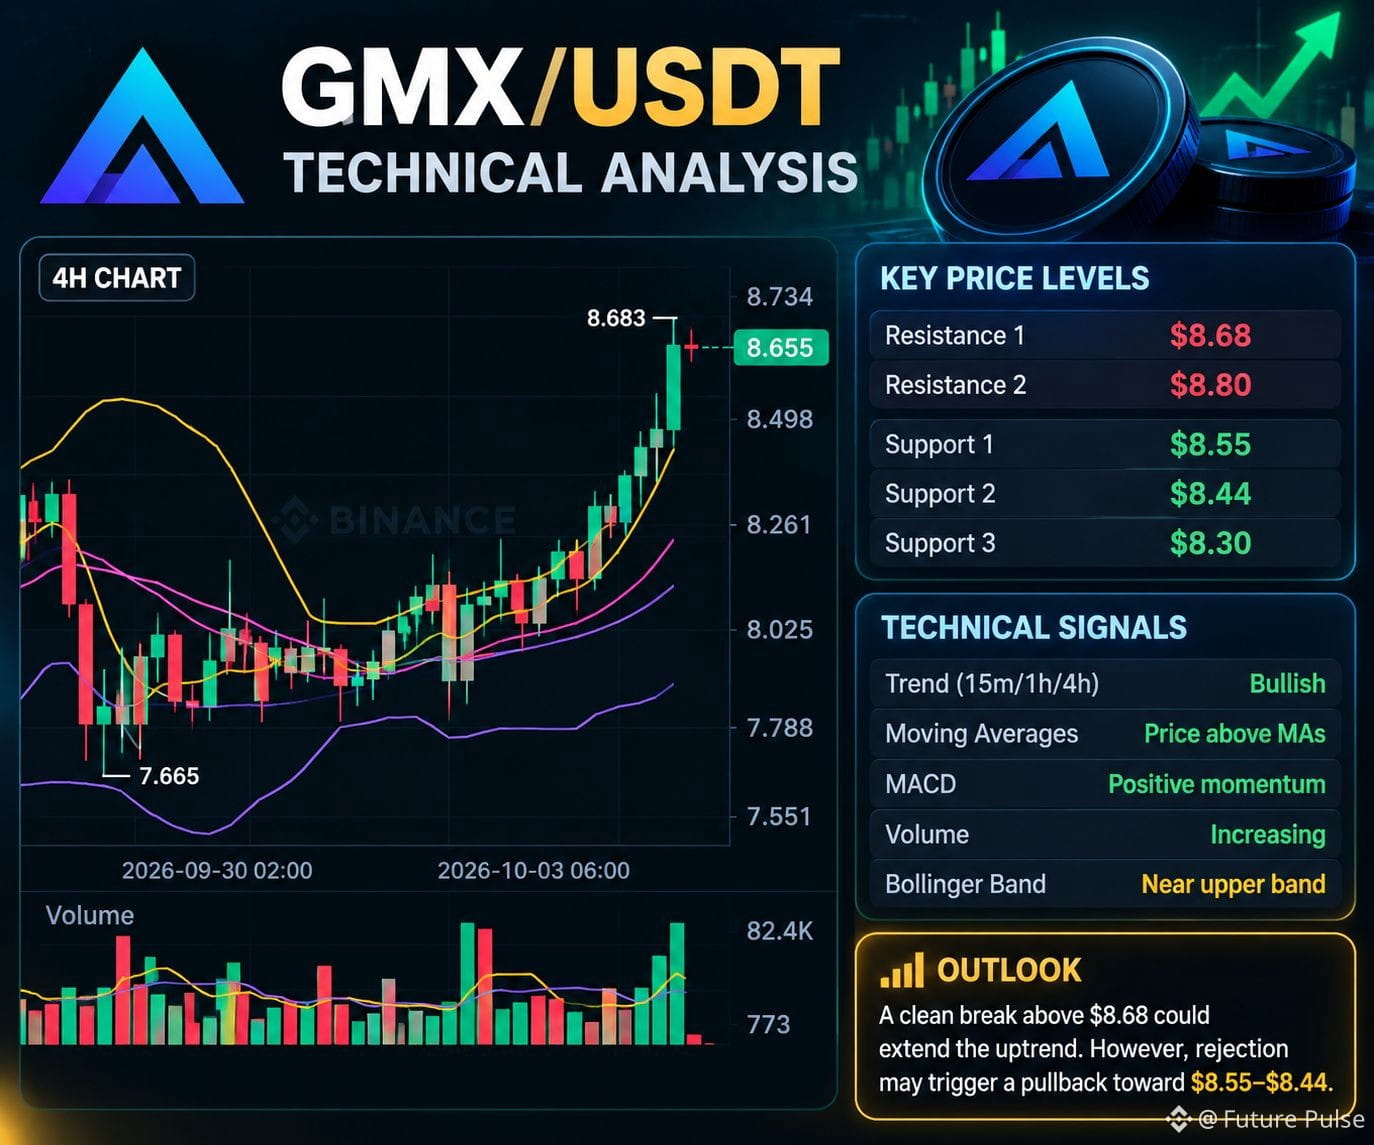
GMX remains bullish across 15m, 1h and 4h. Price holds above key MAs, while MACD and volume support momentum. Resistance sits near $8.68. A breakout could extend the move, but rejection may pull price toward $8.55–$8.44.
$GMX
{future}(GMXUSDT)
$SUI
{future}(SUIUSDT)
$BEAMX
{future}(BEAMXUSDT)
GMX remains bullish across 15m, 1h and 4h. Price holds above key MAs, while MACD and volume support momentum. Resistance sits near $8.68. A breakout could extend the move, but rejection may pull price toward $8.55–$8.44.
$GMX
$SUI
$BEAMX
$GMX
$SUI
$BEAMX
345
·
--
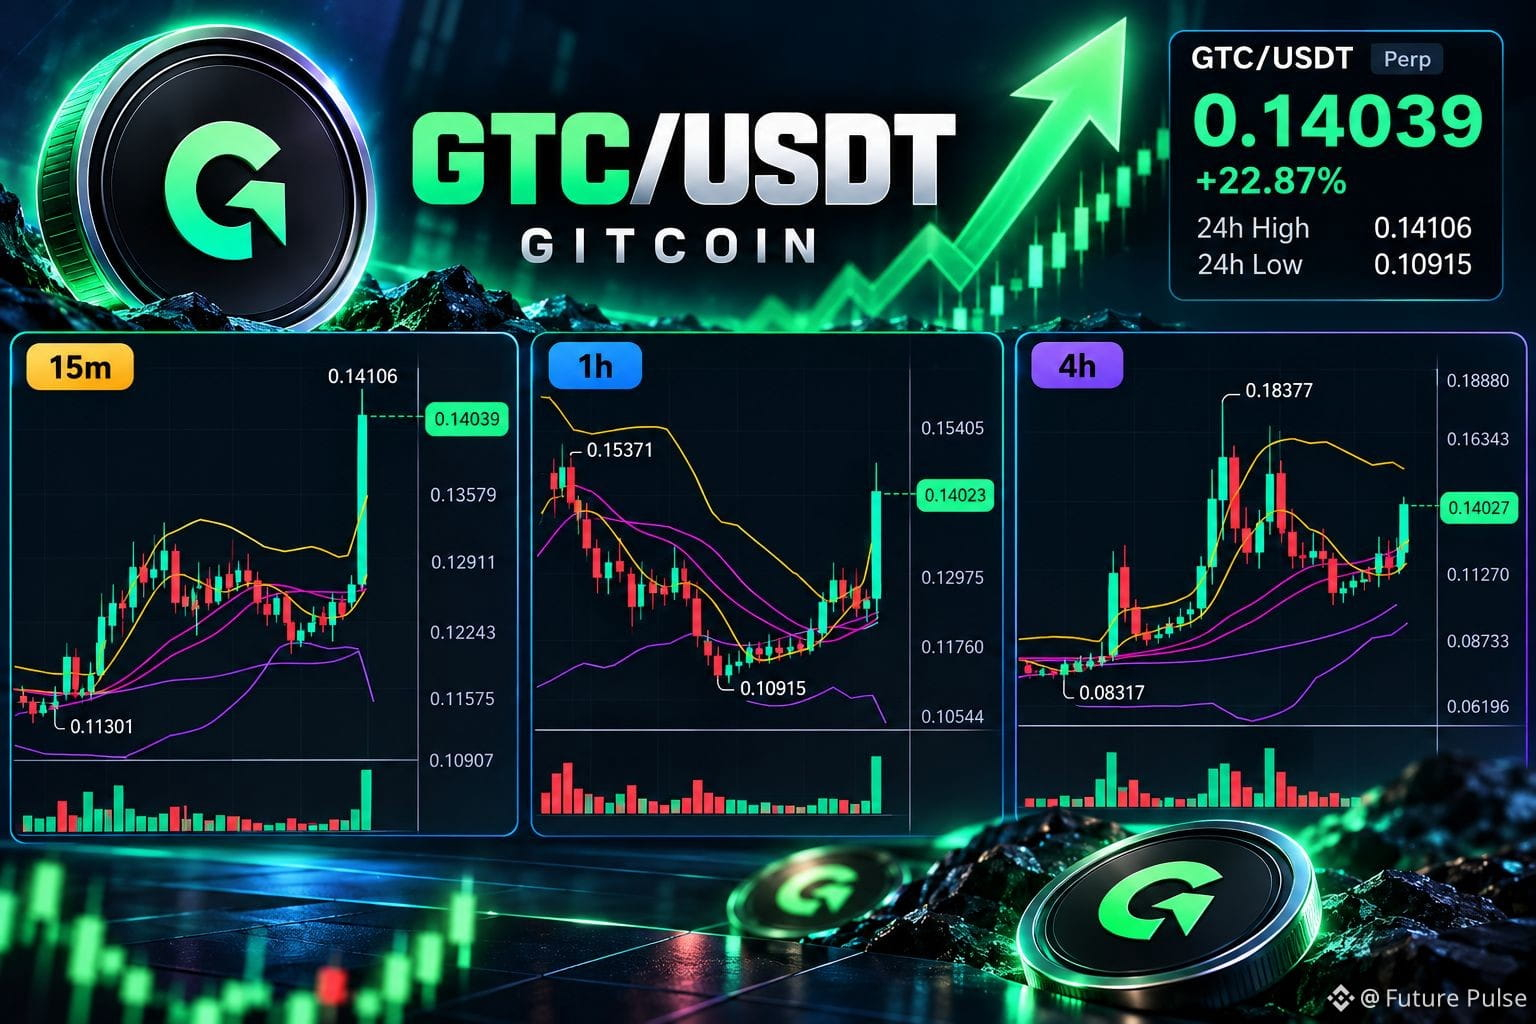
GTC is showing bullish momentum after breaking above its consolidation. On the 15m chart, price surged to $0.14106 with a volume spike, while the 1H chart confirms a breakout above the $0.129–$0.132 area.
The 1H MACD has turned positive, and price is above the 7/25/99 MAs, supporting the bullish structure. On 4H, $0.151–$0.152 is the next key resistance near the upper Bollinger Band.
A hold above $0.135 could keep buyers in control. If momentum fades, $0.129–$0.132 is the first support, followed by $0.120.
Volatility is elevated, so confirmation matters more than chasing the spike.
$TMX
{alpha}(560x3c2f61f2e27c865981d2e7aaf6b2cdf823030039)
$PONS
{future}(PONSUSDT)
$GTC
{future}(GTCUSDT)
GTC is showing bullish momentum after breaking above its consolidation. On the 15m chart, price surged to $0.14106 with a volume spike, while the 1H chart confirms a breakout above the $0.129–$0.132 area.
The 1H MACD has turned positive, and price is above the 7/25/99 MAs, supporting the bullish structure. On 4H, $0.151–$0.152 is the next key resistance near the upper Bollinger Band.
A hold above $0.135 could keep buyers in control. If momentum fades, $0.129–$0.132 is the first support, followed by $0.120.
Volatility is elevated, so confirmation matters more than chasing the spike.
$TMX
$PONS
$GTC
The 1H MACD has turned positive, and price is above the 7/25/99 MAs, supporting the bullish structure. On 4H, $0.151–$0.152 is the next key resistance near the upper Bollinger Band.
A hold above $0.135 could keep buyers in control. If momentum fades, $0.129–$0.132 is the first support, followed by $0.120.
Volatility is elevated, so confirmation matters more than chasing the spike.
$TMX
$PONS
$GTC
2
1.8k
·
--
Michael Saylor Hints at Another Major Bitcoin Purchase 🟠
Michael Saylor has sparked fresh speculation about another Bitcoin purchase after sharing a new accumulation chart on October 4. Strategy's last confirmed holdings stood at 847,666 BTC, reinforcing its position as one of the largest corporate Bitcoin holders.
The latest post has drawn attention, but no new purchase has been officially confirmed yet. The key question is whether Strategy is preparing to expand its holdings again or simply highlighting its long-term accumulation strategy.
Another confirmed purchase would further underline the company's continued commitment to Bitcoin as a core treasury asset.
$BTC
{future}(BTCUSDT)
$DOGE
{future}(DOGEUSDT)
$MUBARAK
{future}(MUBARAKUSDT)
Michael Saylor Hints at Another Major Bitcoin Purchase 🟠
Michael Saylor has sparked fresh speculation about another Bitcoin purchase after sharing a new accumulation chart on October 4. Strategy's last confirmed holdings stood at 847,666 BTC, reinforcing its position as one of the largest corporate Bitcoin holders.
The latest post has drawn attention, but no new purchase has been officially confirmed yet. The key question is whether Strategy is preparing to expand its holdings again or simply highlighting its long-term accumulation strategy.
Another confirmed purchase would further underline the company's continued commitment to Bitcoin as a core treasury asset.
$BTC
$DOGE
$MUBARAK
Michael Saylor has sparked fresh speculation about another Bitcoin purchase after sharing a new accumulation chart on October 4. Strategy's last confirmed holdings stood at 847,666 BTC, reinforcing its position as one of the largest corporate Bitcoin holders.
The latest post has drawn attention, but no new purchase has been officially confirmed yet. The key question is whether Strategy is preparing to expand its holdings again or simply highlighting its long-term accumulation strategy.
Another confirmed purchase would further underline the company's continued commitment to Bitcoin as a core treasury asset.
$BTC
$DOGE
$MUBARAK

211
·
--
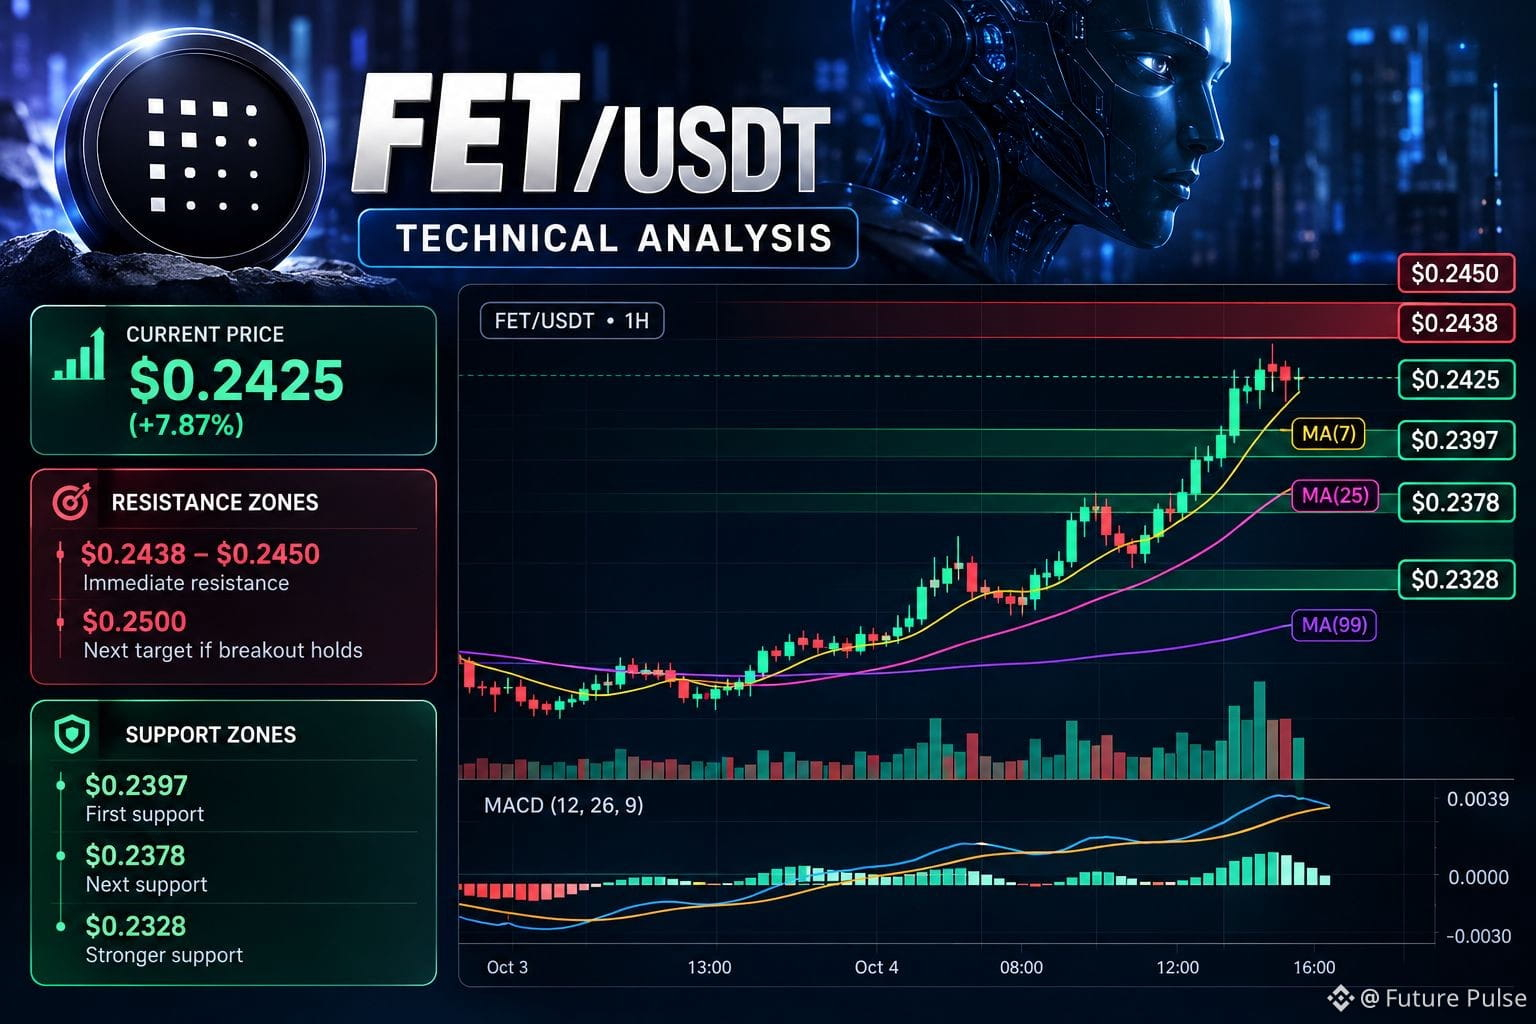
FET is showing strong bullish momentum across the 15M, 1H and 4H charts, trading around $0.2425 after a sharp volume-backed breakout. On the 1H timeframe, price is above MA(7), MA(25) and MA(99), while MACD remains positive, confirming buyers are in control.
The immediate resistance is $0.2438–$0.2450. A clean breakout above this zone could open the way toward $0.2500. On the downside, $0.2397 is the first support, followed by $0.2378 and $0.2328.
The key signal now is whether FET can hold above $0.2397 after the breakout. A rejection near $0.2440 could trigger a short-term pullback before another attempt higher.
$MOVR
{future}(MOVRUSDT)
$BR
{future}(BRUSDT)
$FET
{future}(FETUSDT)
FET is showing strong bullish momentum across the 15M, 1H and 4H charts, trading around $0.2425 after a sharp volume-backed breakout. On the 1H timeframe, price is above MA(7), MA(25) and MA(99), while MACD remains positive, confirming buyers are in control.
The immediate resistance is $0.2438–$0.2450. A clean breakout above this zone could open the way toward $0.2500. On the downside, $0.2397 is the first support, followed by $0.2378 and $0.2328.
The key signal now is whether FET can hold above $0.2397 after the breakout. A rejection near $0.2440 could trigger a short-term pullback before another attempt higher.
$MOVR
$BR
$FET
The immediate resistance is $0.2438–$0.2450. A clean breakout above this zone could open the way toward $0.2500. On the downside, $0.2397 is the first support, followed by $0.2378 and $0.2328.
The key signal now is whether FET can hold above $0.2397 after the breakout. A rejection near $0.2440 could trigger a short-term pullback before another attempt higher.
$MOVR
$BR
$FET
822
·
--
BNB Price Prediction: Can the 37th Burn Fuel an October Rally? 🚀
BNB enters October with positive momentum, trading near $788 after gaining roughly 11% in September. Attention is now shifting to the 37th quarterly token burn and the critical $800–$807 resistance zone.
The upcoming burn could reinforce BNB's scarcity narrative by reducing its circulating supply. However, a sustained rally will likely depend on buying pressure and broader market sentiment rather than the burn alone.
A decisive breakout above $807 could strengthen bullish momentum and open the door to further upside. On the other hand, rejection at this resistance may trigger consolidation and renewed selling pressure.
October's key question is whether reduced supply expectations can align with strong demand to push BNB beyond resistance.
$BEAMX
{future}(BEAMXUSDT)
$STRK
{future}(STRKUSDT)
$BNB
{future}(BNBUSDT)
What is the most likely BNB scenario for October?
BNB Price Prediction: Can the 37th Burn Fuel an October Rally? 🚀
BNB enters October with positive momentum, trading near $788 after gaining roughly 11% in September. Attention is now shifting to the 37th quarterly token burn and the critical $800–$807 resistance zone.
The upcoming burn could reinforce BNB's scarcity narrative by reducing its circulating supply. However, a sustained rally will likely depend on buying pressure and broader market sentiment rather than the burn alone.
A decisive breakout above $807 could strengthen bullish momentum and open the door to further upside. On the other hand, rejection at this resistance may trigger consolidation and renewed selling pressure.
October's key question is whether reduced supply expectations can align with strong demand to push BNB beyond resistance.
$BEAMX
$STRK
$BNB
What is the most likely BNB scenario for October?
BNB enters October with positive momentum, trading near $788 after gaining roughly 11% in September. Attention is now shifting to the 37th quarterly token burn and the critical $800–$807 resistance zone.
The upcoming burn could reinforce BNB's scarcity narrative by reducing its circulating supply. However, a sustained rally will likely depend on buying pressure and broader market sentiment rather than the burn alone.
A decisive breakout above $807 could strengthen bullish momentum and open the door to further upside. On the other hand, rejection at this resistance may trigger consolidation and renewed selling pressure.
October's key question is whether reduced supply expectations can align with strong demand to push BNB beyond resistance.
$BEAMX
$STRK
$BNB
What is the most likely BNB scenario for October?

🔥 Burn fuels a breakout
50%
📈 Buyers push BNB higher
0%
↔️ BNB consolidates below $807
25%
📉 Rejection triggers pullback
25%
4 votes • Voting closed
1
461
·
--
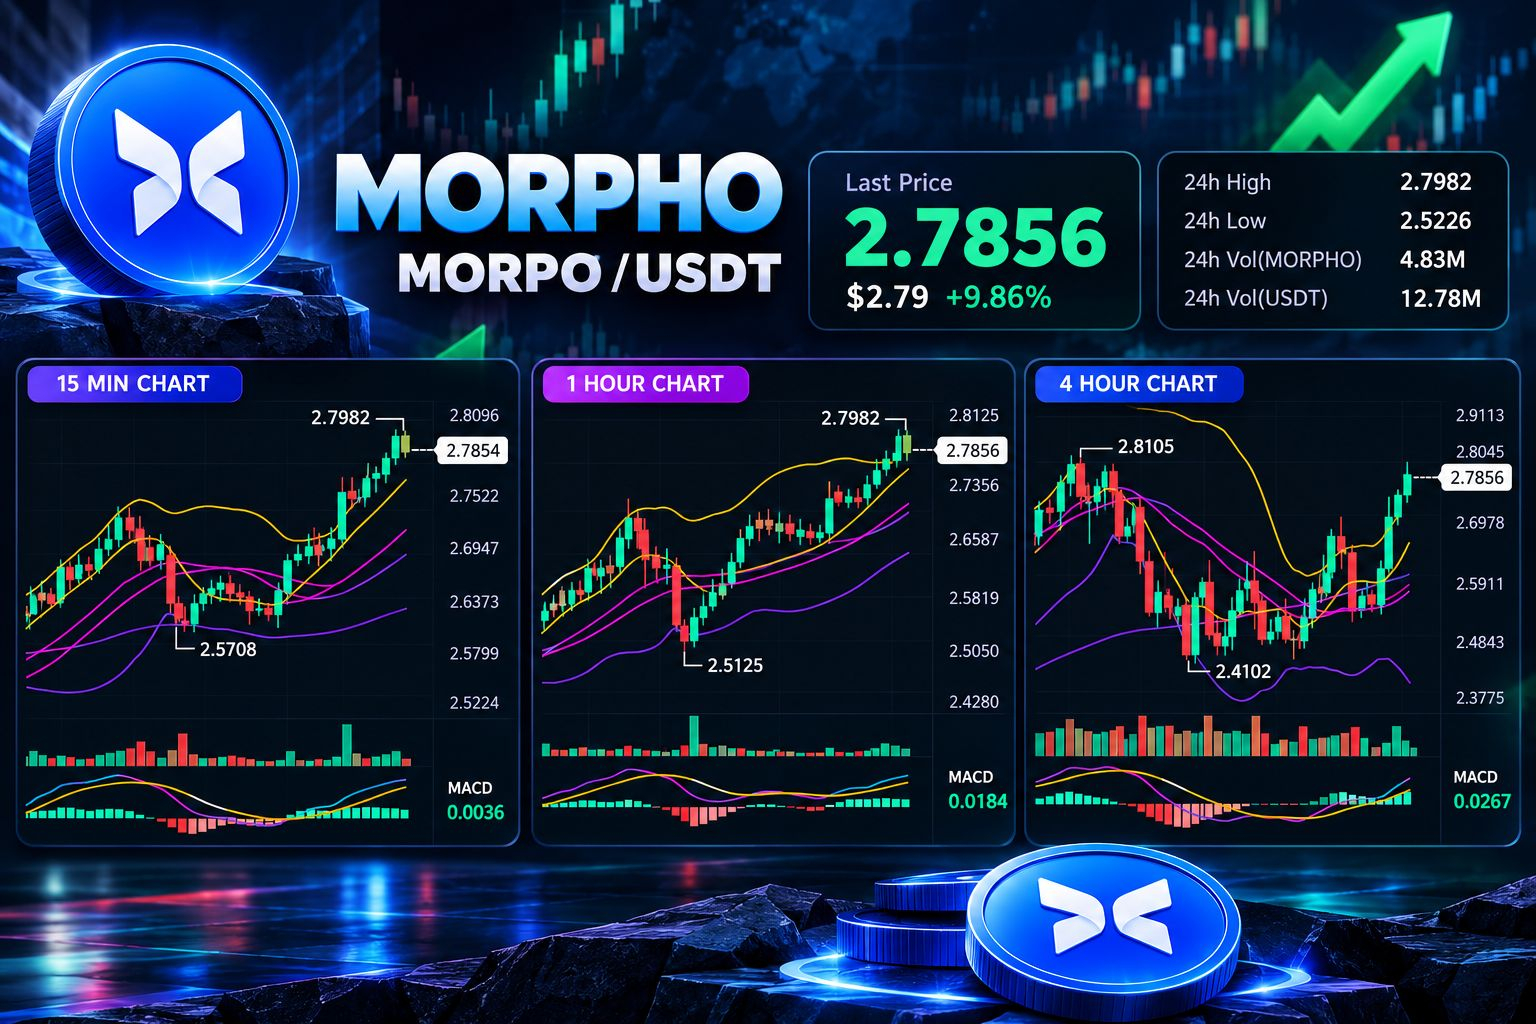
MORPHO is showing strong bullish momentum across the 15m, 1H and 4H charts. Price is around $2.785, trading above the key moving averages, while MACD remains positive across all three timeframes.
On the 1H, price is pressing the $2.7982 resistance, with the upper Bollinger Band near $2.7778, suggesting the move is already extended. A clean breakout above $2.80 could open room toward $2.85–$2.90.
Key supports: $2.73, then $2.63–$2.61. On the 4H, holding above $2.65–$2.60 keeps the bullish structure intact.
Momentum is strong, but chasing near resistance carries higher pullback risk.
$WLD
{future}(WLDUSDT)
$ZEC
{future}(ZECUSDT)
$MORPHO
{future}(MORPHOUSDT)
MORPHO is showing strong bullish momentum across the 15m, 1H and 4H charts. Price is around $2.785, trading above the key moving averages, while MACD remains positive across all three timeframes.
On the 1H, price is pressing the $2.7982 resistance, with the upper Bollinger Band near $2.7778, suggesting the move is already extended. A clean breakout above $2.80 could open room toward $2.85–$2.90.
Key supports: $2.73, then $2.63–$2.61. On the 4H, holding above $2.65–$2.60 keeps the bullish structure intact.
Momentum is strong, but chasing near resistance carries higher pullback risk.
$WLD
$ZEC
$MORPHO
On the 1H, price is pressing the $2.7982 resistance, with the upper Bollinger Band near $2.7778, suggesting the move is already extended. A clean breakout above $2.80 could open room toward $2.85–$2.90.
Key supports: $2.73, then $2.63–$2.61. On the 4H, holding above $2.65–$2.60 keeps the bullish structure intact.
Momentum is strong, but chasing near resistance carries higher pullback risk.
$WLD
$ZEC
$MORPHO
1
686
·
--
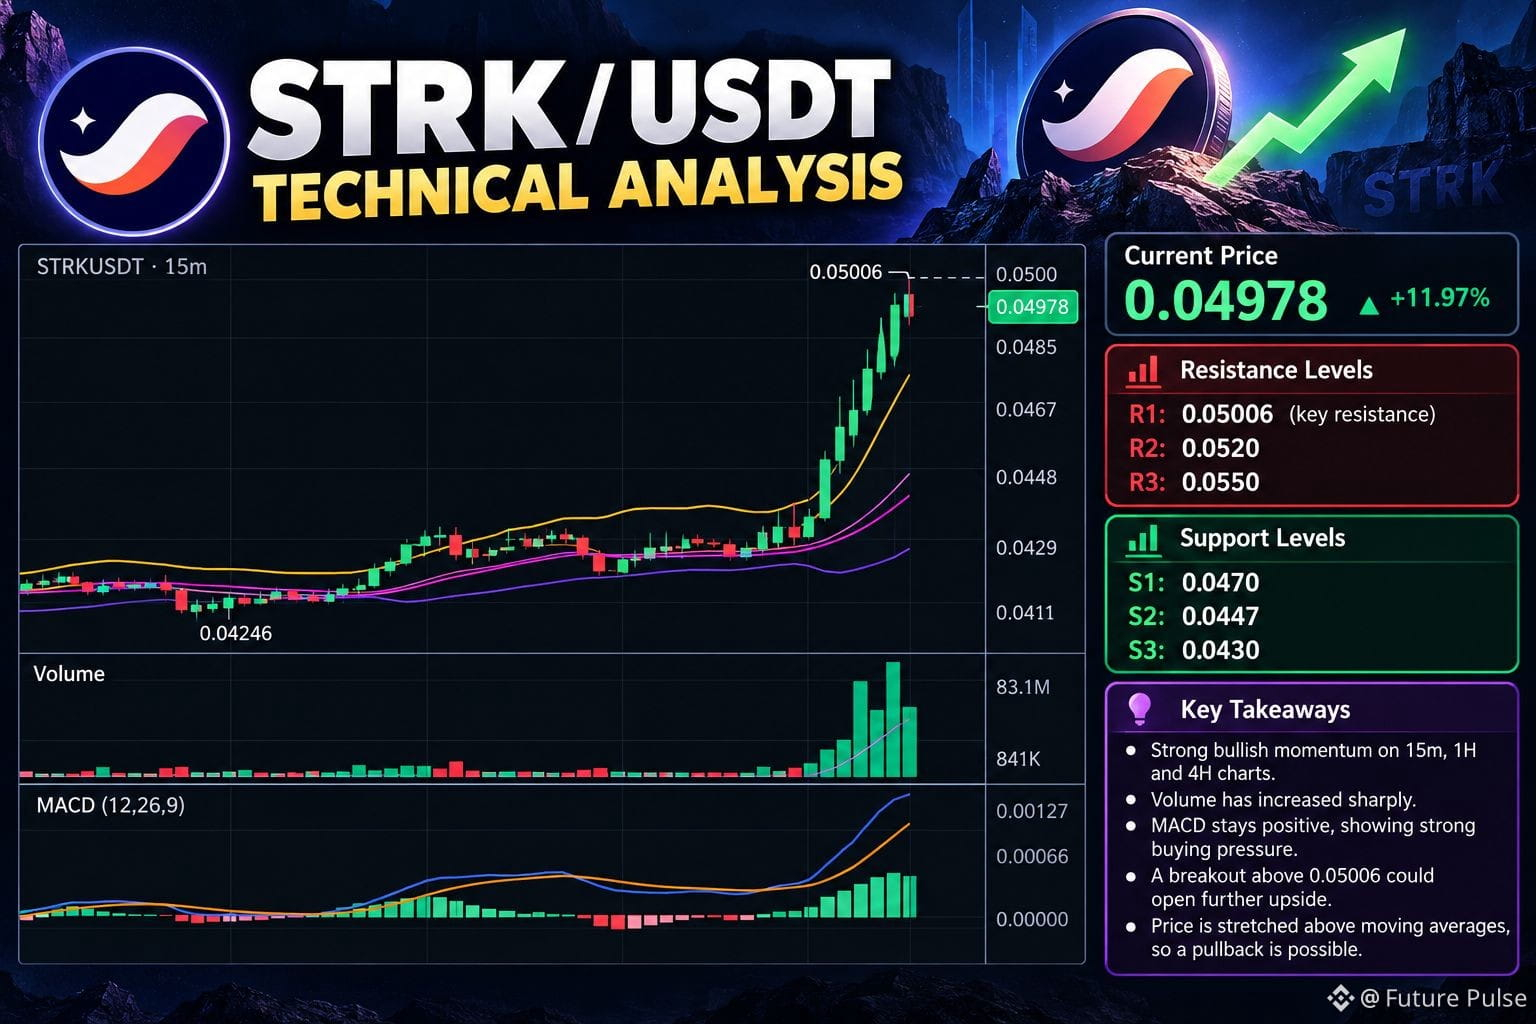
STRK is showing strong bullish momentum across the 15m, 1H and 4H charts. Price has surged to around $0.0498, approaching the recent $0.05006 resistance. Volume has expanded sharply, while MACD remains positive, confirming strong buying pressure.
A clean breakout above $0.05006 could open room for further upside. However, price is stretched well above the moving averages and upper Bollinger Band, so a pullback is also possible. Key support zones sit around $0.0470–$0.0447, with deeper support near $0.0430.
The next reaction around $0.0500 is technically important.
$CT
{future}(CTUSDT)
$MOVR
{future}(MOVRUSDT)
$STRK
{future}(STRKUSDT)
STRK is showing strong bullish momentum across the 15m, 1H and 4H charts. Price has surged to around $0.0498, approaching the recent $0.05006 resistance. Volume has expanded sharply, while MACD remains positive, confirming strong buying pressure.
A clean breakout above $0.05006 could open room for further upside. However, price is stretched well above the moving averages and upper Bollinger Band, so a pullback is also possible. Key support zones sit around $0.0470–$0.0447, with deeper support near $0.0430.
The next reaction around $0.0500 is technically important.
$CT
$MOVR
$STRK
A clean breakout above $0.05006 could open room for further upside. However, price is stretched well above the moving averages and upper Bollinger Band, so a pullback is also possible. Key support zones sit around $0.0470–$0.0447, with deeper support near $0.0430.
The next reaction around $0.0500 is technically important.
$CT
$MOVR
$STRK
1.3k
·
--
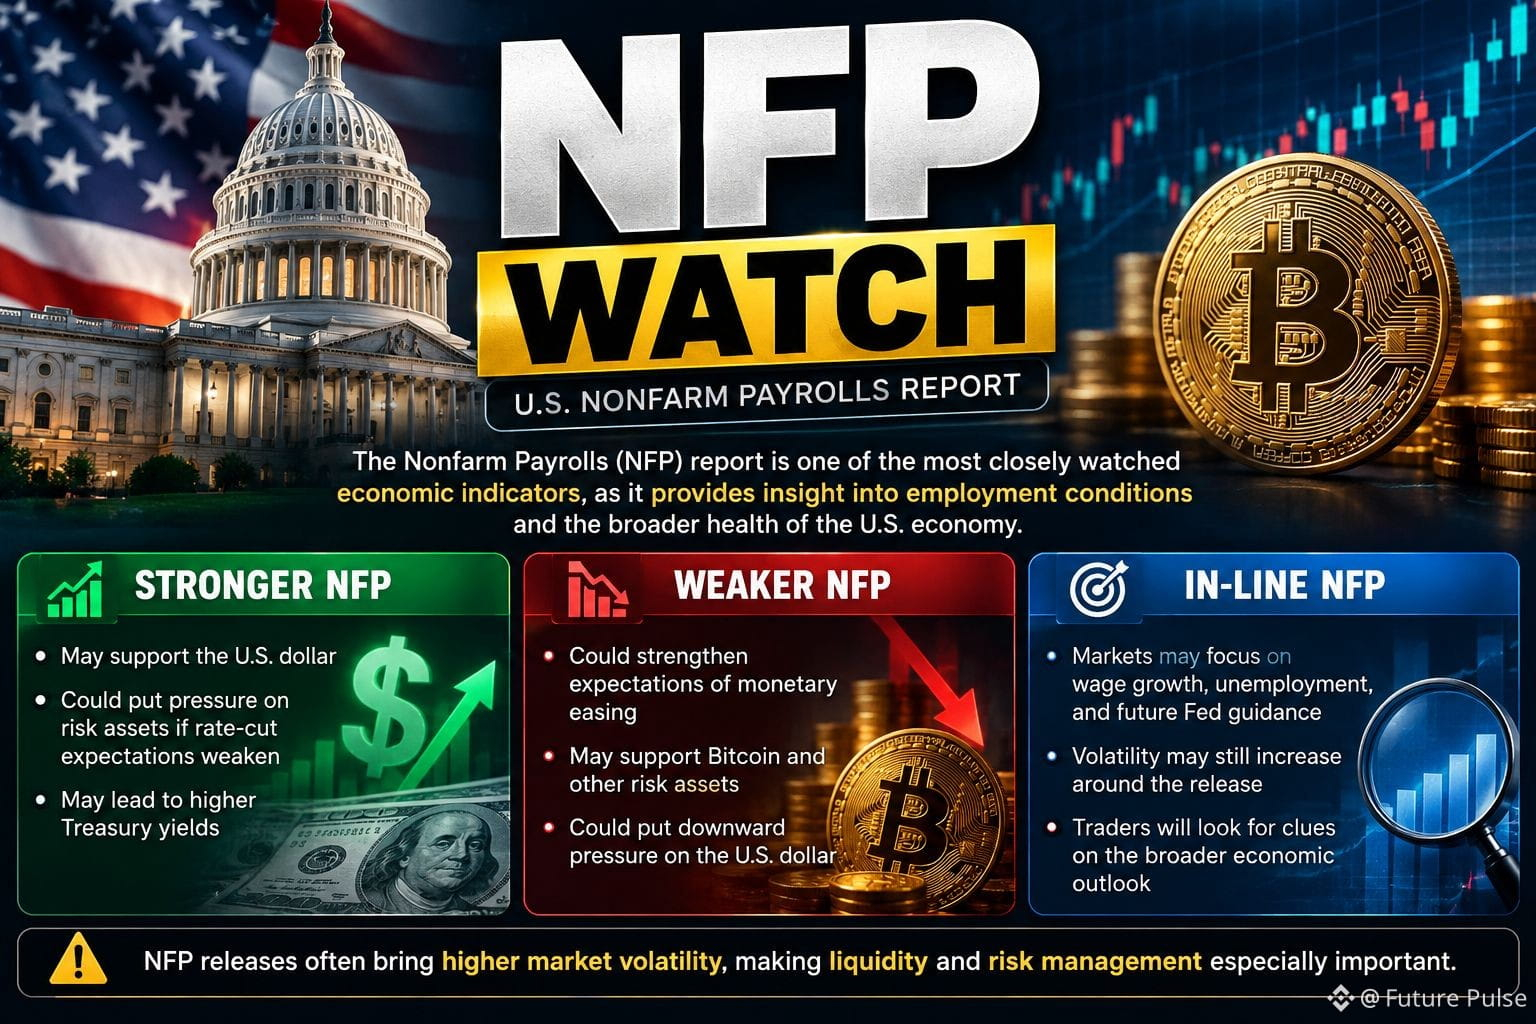
📊 NFP WATCH: A Key Test for the Crypto Market
The US Nonfarm Payrolls (NFP) report is one of the most closely watched economic indicators, as it provides insight into employment conditions and the broader health of the US economy.
For crypto traders, the upcoming NFP data could influence expectations around Federal Reserve policy, Treasury yields, and the US dollar.
🔹 Stronger NFP: May support the dollar and put pressure on risk assets if rate-cut expectations weaken.
🔹 Weaker NFP: Could strengthen expectations of monetary easing, potentially supporting Bitcoin and other risk assets.
🔹 In-line NFP: Markets may shift their focus to wage growth, unemployment, and future Fed guidance.
Volatility may increase around the release, making liquidity and risk management especially important.
$MU
{future}(MUUSDT)
$MUB
{spot}(MUBUSDT)
$GOOGL.US
{stock_us}(GOOGL.US)
#NFPWatch
#MU
#mub
📊 NFP WATCH: A Key Test for the Crypto Market
The US Nonfarm Payrolls (NFP) report is one of the most closely watched economic indicators, as it provides insight into employment conditions and the broader health of the US economy.
For crypto traders, the upcoming NFP data could influence expectations around Federal Reserve policy, Treasury yields, and the US dollar.
🔹 Stronger NFP: May support the dollar and put pressure on risk assets if rate-cut expectations weaken.
🔹 Weaker NFP: Could strengthen expectations of monetary easing, potentially supporting Bitcoin and other risk assets.
🔹 In-line NFP: Markets may shift their focus to wage growth, unemployment, and future Fed guidance.
Volatility may increase around the release, making liquidity and risk management especially important.
$MU
$MUB
$GOOGL.US
#NFPWatch
#MU
#mub
The US Nonfarm Payrolls (NFP) report is one of the most closely watched economic indicators, as it provides insight into employment conditions and the broader health of the US economy.
For crypto traders, the upcoming NFP data could influence expectations around Federal Reserve policy, Treasury yields, and the US dollar.
🔹 Stronger NFP: May support the dollar and put pressure on risk assets if rate-cut expectations weaken.
🔹 Weaker NFP: Could strengthen expectations of monetary easing, potentially supporting Bitcoin and other risk assets.
🔹 In-line NFP: Markets may shift their focus to wage growth, unemployment, and future Fed guidance.
Volatility may increase around the release, making liquidity and risk management especially important.
$MU
$MUB
$GOOGL.US
#NFPWatch
#MU
#mub
208
·
--
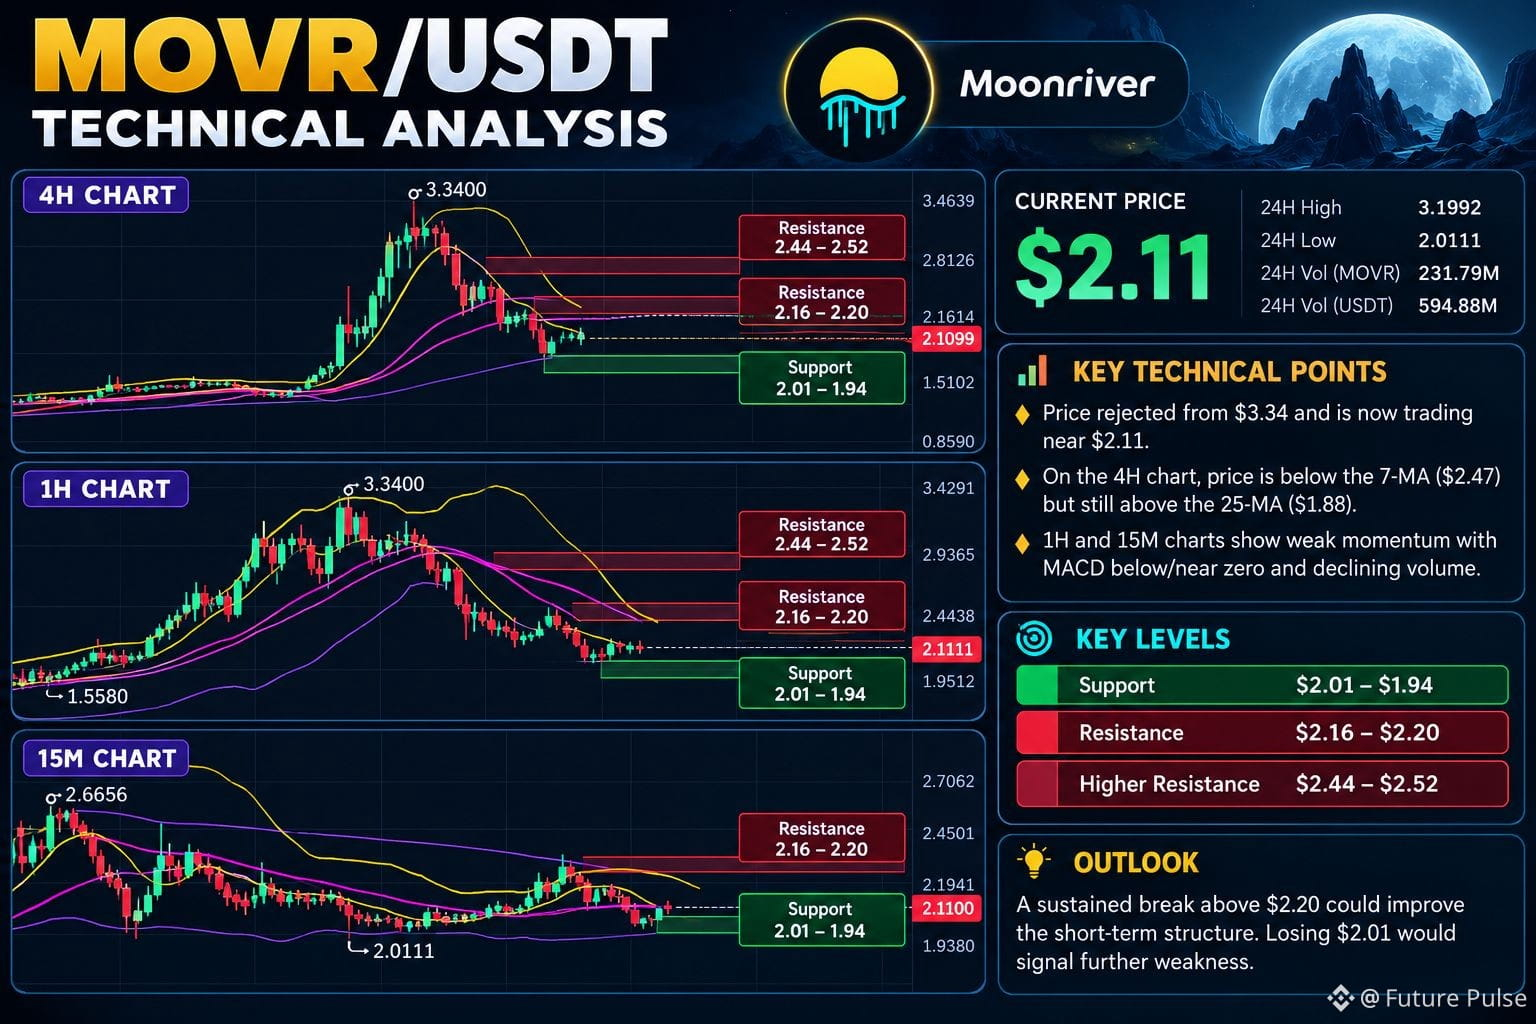
MOVR is trading near $2.11 after a sharp rejection from the $3.34 area. On the 4H chart, price has fallen below the 7-MA ($2.47) but remains above the 25-MA ($1.88), showing that the broader recovery structure is not fully broken yet. The 1H and 15M charts show weak momentum, with MACD below/near the zero line and declining volume.
🔹 Support: $2.01–$1.94
🔹 Resistance: $2.16–$2.20
🔹 Higher resistance: $2.44–$2.52
A sustained break above $2.20 could improve short-term structure, while losing $2.01 would signal further weakness.
$2Z
{future}(2ZUSDT)
$ARK
{future}(ARKUSDT)
$MOVR
{future}(MOVRUSDT)
#moonriver
#WLD
MOVR is trading near $2.11 after a sharp rejection from the $3.34 area. On the 4H chart, price has fallen below the 7-MA ($2.47) but remains above the 25-MA ($1.88), showing that the broader recovery structure is not fully broken yet. The 1H and 15M charts show weak momentum, with MACD below/near the zero line and declining volume.
🔹 Support: $2.01–$1.94
🔹 Resistance: $2.16–$2.20
🔹 Higher resistance: $2.44–$2.52
A sustained break above $2.20 could improve short-term structure, while losing $2.01 would signal further weakness.
$2Z
$ARK
$MOVR
#moonriver
#WLD
🔹 Support: $2.01–$1.94
🔹 Resistance: $2.16–$2.20
🔹 Higher resistance: $2.44–$2.52
A sustained break above $2.20 could improve short-term structure, while losing $2.01 would signal further weakness.
$2Z
$ARK
$MOVR
#moonriver
#WLD
358
·
--
Why Is Bitcoin Price Going Up Today? 🚀
Bitcoin climbed roughly 3% on October 2, briefly breaking above $87,000 as macroeconomic expectations and market positioning fueled the rally.
Weak U.S. jobs data strengthened expectations of a Federal Reserve pause in October, easing concerns about tighter monetary conditions. Meanwhile, a wave of short liquidations added momentum as bearish traders were forced to close their positions, creating additional buying pressure.
However, the sustainability of this rally depends on whether buyers can maintain momentum beyond the initial short squeeze. Traders are now watching Fed signals, market liquidity and Bitcoin's ability to hold its recent gains.
The key question is whether this move reflects sustained demand or mainly a temporary derivatives-driven rally.
$WLD
{future}(WLDUSDT)
$SUPER
{future}(SUPERUSDT)
$BTC
{future}(BTCUSDT)
Why Is Bitcoin Price Going Up Today? 🚀
Bitcoin climbed roughly 3% on October 2, briefly breaking above $87,000 as macroeconomic expectations and market positioning fueled the rally.
Weak U.S. jobs data strengthened expectations of a Federal Reserve pause in October, easing concerns about tighter monetary conditions. Meanwhile, a wave of short liquidations added momentum as bearish traders were forced to close their positions, creating additional buying pressure.
However, the sustainability of this rally depends on whether buyers can maintain momentum beyond the initial short squeeze. Traders are now watching Fed signals, market liquidity and Bitcoin's ability to hold its recent gains.
The key question is whether this move reflects sustained demand or mainly a temporary derivatives-driven rally.
$WLD
$SUPER
$BTC
Bitcoin climbed roughly 3% on October 2, briefly breaking above $87,000 as macroeconomic expectations and market positioning fueled the rally.
Weak U.S. jobs data strengthened expectations of a Federal Reserve pause in October, easing concerns about tighter monetary conditions. Meanwhile, a wave of short liquidations added momentum as bearish traders were forced to close their positions, creating additional buying pressure.
However, the sustainability of this rally depends on whether buyers can maintain momentum beyond the initial short squeeze. Traders are now watching Fed signals, market liquidity and Bitcoin's ability to hold its recent gains.
The key question is whether this move reflects sustained demand or mainly a temporary derivatives-driven rally.
$WLD
$SUPER
$BTC

1
344
·
--
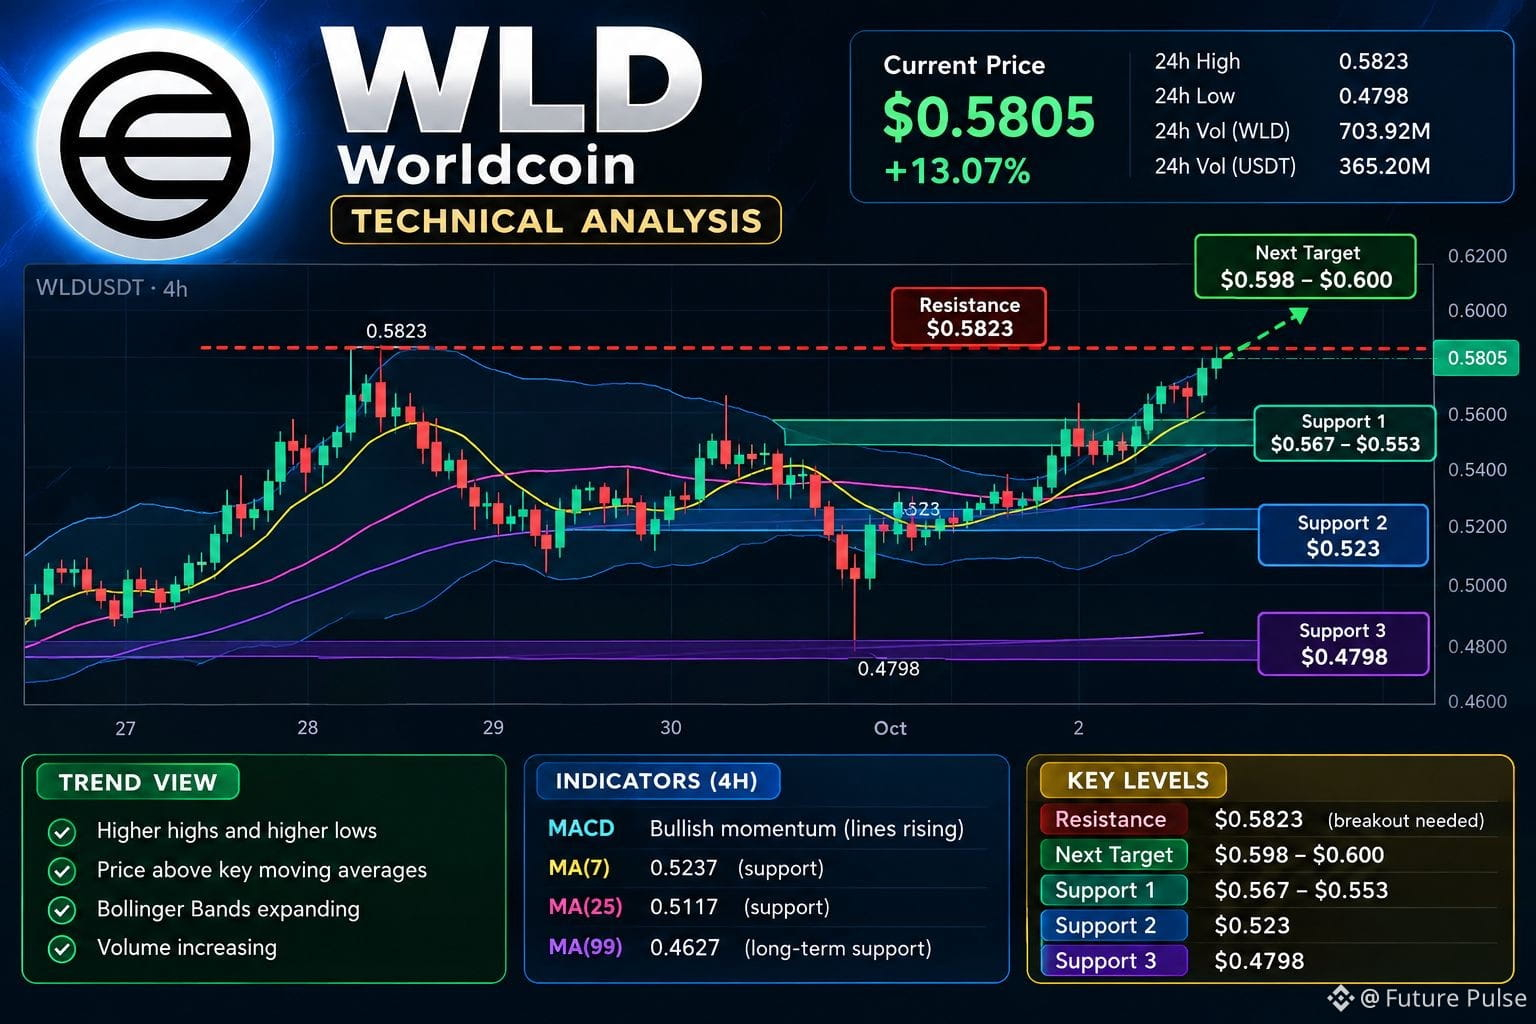
WLD is showing strong bullish momentum across the 15m, 1h and 4h charts, trading around $0.5805 after a sharp move higher. Price is pressing the $0.5823 local high, while rising volume and a positive MACD suggest buyers remain active.
A clean break and hold above $0.5823 could open the way toward $0.598–$0.600. On a pullback, $0.567–$0.553 becomes the key near-term support zone. A deeper retracement could bring $0.523 into focus.
The key question now: can WLD turn the $0.5823 resistance into support?
$APE
{future}(APEUSDT)
$NIGHT
{future}(NIGHTUSDT)
$WLD
{future}(WLDUSDT)
What do you think will be WLD’s next move?
WLD is showing strong bullish momentum across the 15m, 1h and 4h charts, trading around $0.5805 after a sharp move higher. Price is pressing the $0.5823 local high, while rising volume and a positive MACD suggest buyers remain active.
A clean break and hold above $0.5823 could open the way toward $0.598–$0.600. On a pullback, $0.567–$0.553 becomes the key near-term support zone. A deeper retracement could bring $0.523 into focus.
The key question now: can WLD turn the $0.5823 resistance into support?
$APE
$NIGHT
$WLD
What do you think will be WLD’s next move?
A clean break and hold above $0.5823 could open the way toward $0.598–$0.600. On a pullback, $0.567–$0.553 becomes the key near-term support zone. A deeper retracement could bring $0.523 into focus.
The key question now: can WLD turn the $0.5823 resistance into support?
$APE
$NIGHT
$WLD
What do you think will be WLD’s next move?
🚀 Breakout above $0.5823
81%
📈 Consolidate before rising
5%
🔻 Pullback toward $0.553
14%
🐻 Drop toward $0.523
0%
21 votes • Voting closed
1.7k
·
--
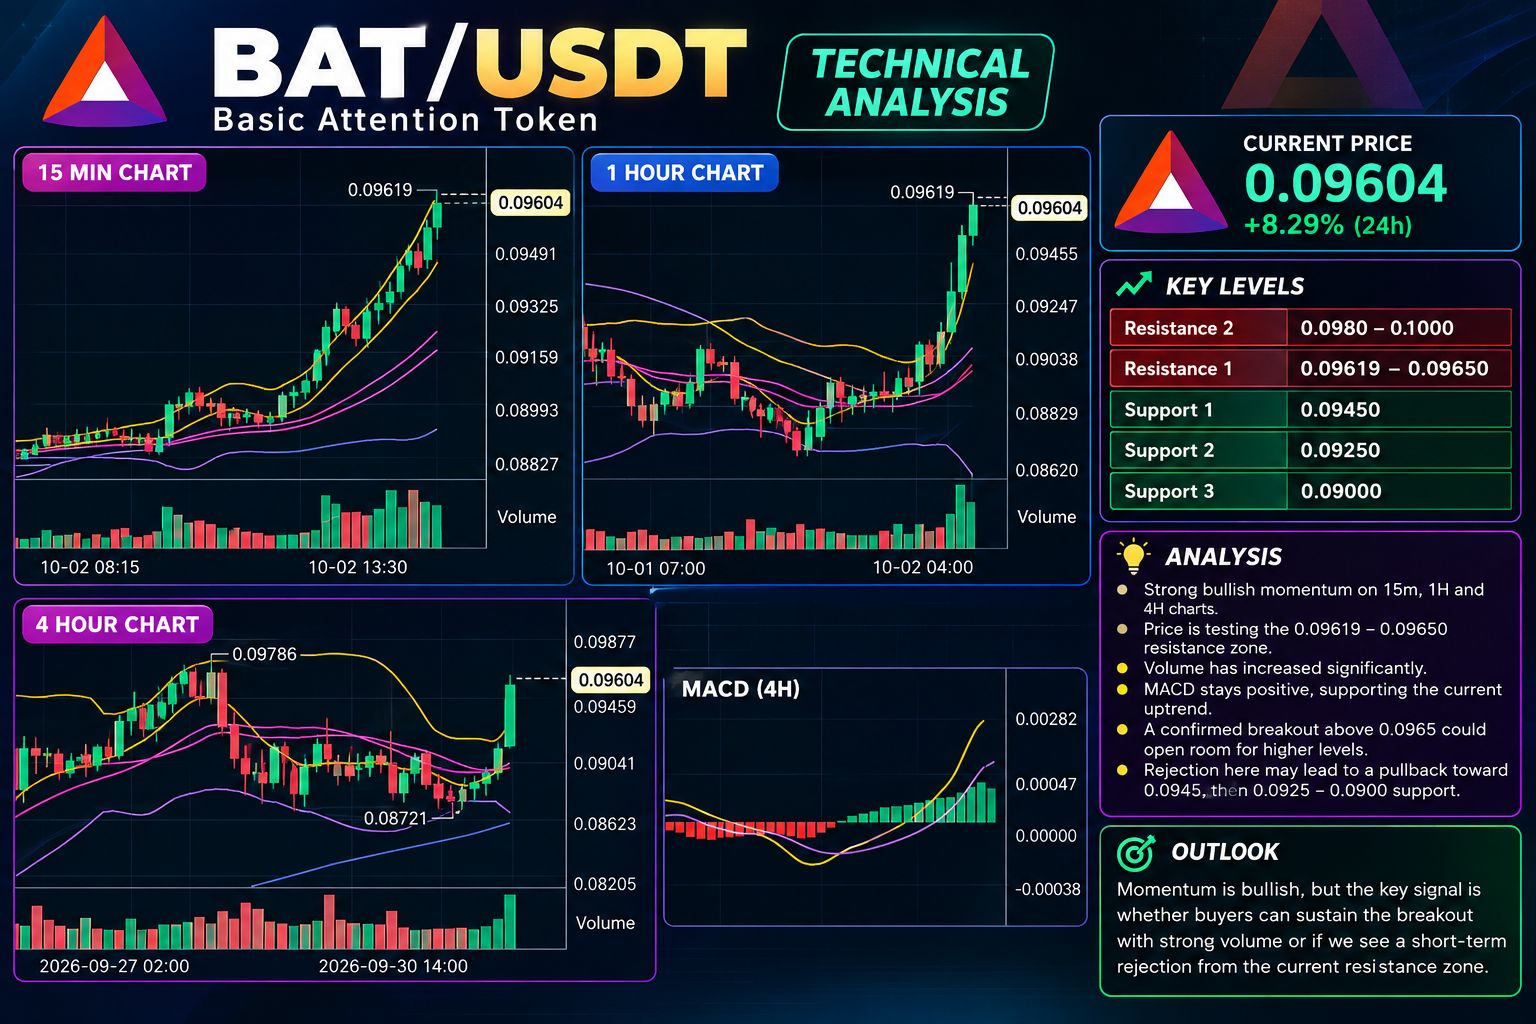
BAT is showing strong bullish momentum across the 15m, 1H and 4H charts. Price is around $0.09604, testing the $0.09619–$0.09650 resistance zone near the upper Bollinger Band. Volume has expanded sharply, while MACD remains positive, supporting the current momentum.
A confirmed move above $0.0965 could open the way toward higher levels. However, rejection here may trigger a pullback toward $0.0945, followed by $0.0925–$0.0900 support.
The key signal now is whether buyers can sustain the breakout with volume rather than just a quick spike.
$SAND
{future}(SANDUSDT)
$MANA
{future}(MANAUSDT)
$BAT
{future}(BATUSDT)
BAT is showing strong bullish momentum across the 15m, 1H and 4H charts. Price is around $0.09604, testing the $0.09619–$0.09650 resistance zone near the upper Bollinger Band. Volume has expanded sharply, while MACD remains positive, supporting the current momentum.
A confirmed move above $0.0965 could open the way toward higher levels. However, rejection here may trigger a pullback toward $0.0945, followed by $0.0925–$0.0900 support.
The key signal now is whether buyers can sustain the breakout with volume rather than just a quick spike.
$SAND
$MANA
$BAT
A confirmed move above $0.0965 could open the way toward higher levels. However, rejection here may trigger a pullback toward $0.0945, followed by $0.0925–$0.0900 support.
The key signal now is whether buyers can sustain the breakout with volume rather than just a quick spike.
$SAND
$MANA
$BAT
279
Log in to explore more content
Join global crypto users on Binance Square
⚡️ Get latest and useful information about crypto.
💬 Trusted by the world’s largest crypto exchange.
👍 Discover real insights from verified creators.
Email / Phone number
Trending Topics
ADAGains10%Above$0.27
15,131 views
180 Discussing
$ADA is making a strong move today jumping over 10 percent to around 027 and breaking into a new 90 day high
Trading volume has also surged above 1 billion showing strong market activity
The move comes as $ADA continues its recovery from the June lows while its recent technical structure has turned more bullish
The 027 to 028 zone is now the key area to watch A sustained breakout could open the door toward higher resistance levels
But after such a sharp daily move volatility could remain high
#ADAGains10%Above$0.27 #crypto #ADA #Cardano #crypto #Write2Earn
AbdullahAbid_7
·0 Likes
·379 views
ETHUp70%InQ3ButLiquidityFalls
164,631 views
1,069 Discussing
EthStakingExitQueueHits2026High
56,941 views
765 Discussing