

Digital-Cryptor
867 Posts

Digital-Cryptor
Report
Block User
Professional Trader. Having Proper Technical and Fundamental Analysis📈📉 📰... Mission to grow with my family #Digital-Cryptor💰
Open Trade
High-Frequency Trader
1.8 Years
2 Following
416 Followers
815 Liked
Posts
Portfolio
All
Quotes
Videos
·
--
Bullish
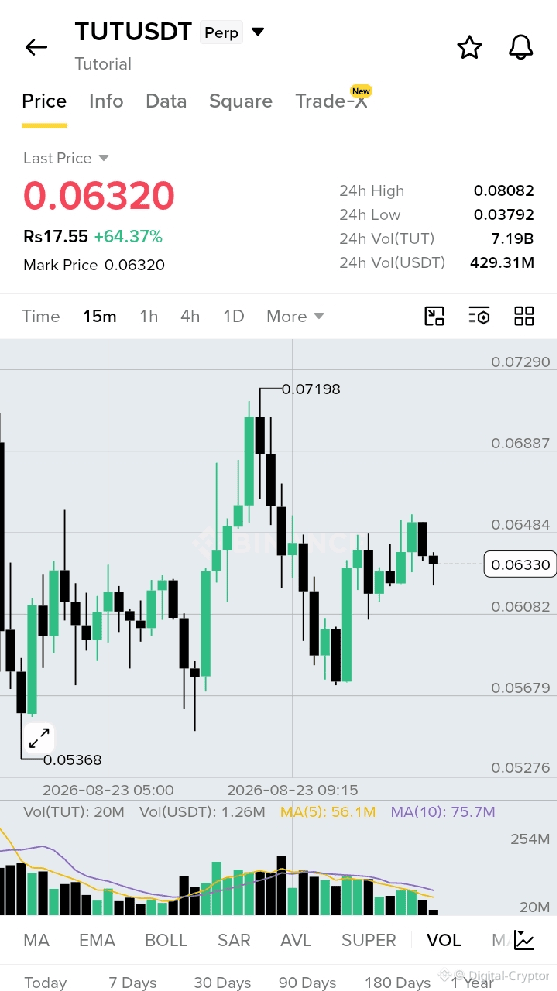
🚨 $TUT IS MOVING! 🚨
Tutorial ($TUT) is trading around $0.0638, up 65%+ in 24H 📈🔥
📊 24H Volume: $429M
💰 Market Cap: $53.9M
📈 RSI: 61
⚡ Strong volume + bullish momentum
Key level to watch: $0.064
Breakout could open the door toward $0.0788 👀
🚨 $TUT IS MOVING! 🚨
Tutorial ($TUT) is trading around $0.0638, up 65%+ in 24H 📈🔥
📊 24H Volume: $429M
💰 Market Cap: $53.9M
📈 RSI: 61
⚡ Strong volume + bullish momentum
Key level to watch: $0.064
Breakout could open the door toward $0.0788 👀
Tutorial ($TUT) is trading around $0.0638, up 65%+ in 24H 📈🔥
📊 24H Volume: $429M
💰 Market Cap: $53.9M
📈 RSI: 61
⚡ Strong volume + bullish momentum
Key level to watch: $0.064
Breakout could open the door toward $0.0788 👀
142
·
--
Bullish
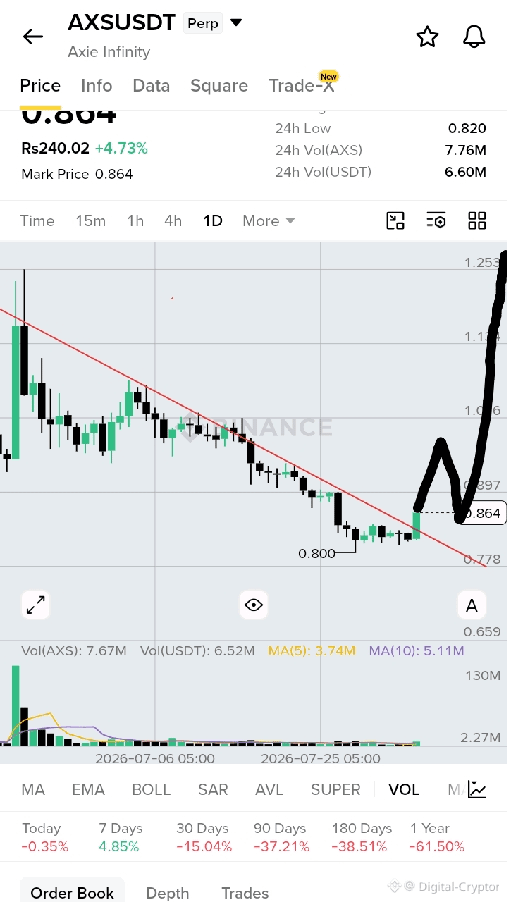
$AXS s is breaking the trend line resistance changing its character to bullish.
Long $AXS
Entry 0.866
TP1🎯 0.920
TP2🎯0.980
TP3🎯 1.01
SL🪀 0.790
$AXS s is breaking the trend line resistance changing its character to bullish.
Long $AXS
Entry 0.866
TP1🎯 0.920
TP2🎯0.980
TP3🎯 1.01
SL🪀 0.790
Long $AXS
Entry 0.866
TP1🎯 0.920
TP2🎯0.980
TP3🎯 1.01
SL🪀 0.790
225
Article
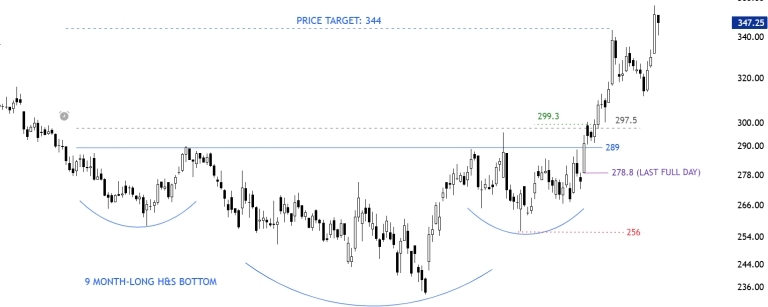
Using the Last Full Day Low to Evaluate Breakout QualityWhile the Last Full Day Low is an excellent stop-loss reference, it can also reveal valuable information about the strength of the breakout itself.
Not all successful breakouts behave the same way.
Some explode higher without hesitation.
Others pull back to test former resistance before continuing.
Some experience deep shakeouts before eventually reaching their objectives.
Others fail completely.
These differences can be organized into four objective breakout types.
Type 1 – Momentum Breakout
A Type 1 breakout occurs when price breaks out of a chart pattern and rallies directly toward its measured price objective without any meaningful pullback.
Characteristics include
Immediate expansion away from the breakout level
No meaningful re-test of the pattern boundary
No test of the Last Full Day Low
Strong institutional demand
Frequently exceeds the measured move objective
These are the strongest breakouts because buyers remain in control from the moment of the breakout.
Type 1 breakouts often occur in leading stocks during strong bull markets.
Type 2 – Standard Re-test Breakout
A Type 2 breakout occurs when price breaks out successfully but later returns to test the former resistance level.
During this pullback:
Price may touch or slightly penetrate the breakout boundary.
The Last Full Day Low remains intact.
The violation is judged on an intraday basis, not a closing basis.
Buyers quickly regain control.
The measured objective is eventually achieved.
This represents the classic “breakout and re-test” behavior frequently observed in healthy trends.
The former resistance successfully becomes new support.
Type 3 – Deep Re-test Breakout
A Type 3 breakout represents a much weaker but still successful breakout.
After the breakout:
Price retraces sharply.
The pullback violates the Last Full Day Low on an intraday basis.
However, price remains above the chart pattern negation level.
Buyers eventually regain control.
The measured price objective is ultimately reached.
From a risk management perspective, Brandt’s original stop based on the Last Full Day Low would likely have been triggered.
From a chart pattern perspective, however, the pattern itself remains valid because its structural support has not failed.
These breakouts often shake out weaker holders before resuming their advance.
Type 4 – Failed Breakout
A Type 4 breakout occurs when the breakout cannot be sustained.
Price:
Breaks out initially.
Pulls back aggressively.
Violates the Last Full Day Low.
Continues downward until reaching the chart pattern negation level.
Invalidates the original chart pattern.
Once the pattern negation level is broken, the original trading thesis no longer exists.
This represents a failed breakout and an unsuccessful chart pattern.
Summary for the 4 types of breakout:
Using the Last Full Day Low to Evaluate Breakout Quality
While the Last Full Day Low is an excellent stop-loss reference, it can also reveal valuable information about the strength of the breakout itself.
Not all successful breakouts behave the same way.
Some explode higher without hesitation.
Others pull back to test former resistance before continuing.
Some experience deep shakeouts before eventually reaching their objectives.
Others fail completely.
These differences can be organized into four objective breakout types.
Type 1 – Momentum Breakout
A Type 1 breakout occurs when price breaks out of a chart pattern and rallies directly toward its measured price objective without any meaningful pullback.
Characteristics include
Immediate expansion away from the breakout level
No meaningful re-test of the pattern boundary
No test of the Last Full Day Low
Strong institutional demand
Frequently exceeds the measured move objective
These are the strongest breakouts because buyers remain in control from the moment of the breakout.
Type 1 breakouts often occur in leading stocks during strong bull markets.
Type 2 – Standard Re-test Breakout
A Type 2 breakout occurs when price breaks out successfully but later returns to test the former resistance level.
During this pullback:
Price may touch or slightly penetrate the breakout boundary.
The Last Full Day Low remains intact.
The violation is judged on an intraday basis, not a closing basis.
Buyers quickly regain control.
The measured objective is eventually achieved.
This represents the classic “breakout and re-test” behavior frequently observed in healthy trends.
The former resistance successfully becomes new support.
Type 3 – Deep Re-test Breakout
A Type 3 breakout represents a much weaker but still successful breakout.
After the breakout:
Price retraces sharply.
The pullback violates the Last Full Day Low on an intraday basis.
However, price remains above the chart pattern negation level.
Buyers eventually regain control.
The measured price objective is ultimately reached.
From a risk management perspective, Brandt’s original stop based on the Last Full Day Low would likely have been triggered.
From a chart pattern perspective, however, the pattern itself remains valid because its structural support has not failed.
These breakouts often shake out weaker holders before resuming their advance.
Type 4 – Failed Breakout
A Type 4 breakout occurs when the breakout cannot be sustained.
Price:
Breaks out initially.
Pulls back aggressively.
Violates the Last Full Day Low.
Continues downward until reaching the chart pattern negation level.
Invalidates the original chart pattern.
Once the pattern negation level is broken, the original trading thesis no longer exists.
This represents a failed breakout and an unsuccessful chart pattern.
Summary for the 4 types of breakout:
Not all successful breakouts behave the same way.
Some explode higher without hesitation.
Others pull back to test former resistance before continuing.
Some experience deep shakeouts before eventually reaching their objectives.
Others fail completely.
These differences can be organized into four objective breakout types.
Type 1 – Momentum Breakout
A Type 1 breakout occurs when price breaks out of a chart pattern and rallies directly toward its measured price objective without any meaningful pullback.
Characteristics include
Immediate expansion away from the breakout level
No meaningful re-test of the pattern boundary
No test of the Last Full Day Low
Strong institutional demand
Frequently exceeds the measured move objective
These are the strongest breakouts because buyers remain in control from the moment of the breakout.
Type 1 breakouts often occur in leading stocks during strong bull markets.
Type 2 – Standard Re-test Breakout
A Type 2 breakout occurs when price breaks out successfully but later returns to test the former resistance level.
During this pullback:
Price may touch or slightly penetrate the breakout boundary.
The Last Full Day Low remains intact.
The violation is judged on an intraday basis, not a closing basis.
Buyers quickly regain control.
The measured objective is eventually achieved.
This represents the classic “breakout and re-test” behavior frequently observed in healthy trends.
The former resistance successfully becomes new support.
Type 3 – Deep Re-test Breakout
A Type 3 breakout represents a much weaker but still successful breakout.
After the breakout:
Price retraces sharply.
The pullback violates the Last Full Day Low on an intraday basis.
However, price remains above the chart pattern negation level.
Buyers eventually regain control.
The measured price objective is ultimately reached.
From a risk management perspective, Brandt’s original stop based on the Last Full Day Low would likely have been triggered.
From a chart pattern perspective, however, the pattern itself remains valid because its structural support has not failed.
These breakouts often shake out weaker holders before resuming their advance.
Type 4 – Failed Breakout
A Type 4 breakout occurs when the breakout cannot be sustained.
Price:
Breaks out initially.
Pulls back aggressively.
Violates the Last Full Day Low.
Continues downward until reaching the chart pattern negation level.
Invalidates the original chart pattern.
Once the pattern negation level is broken, the original trading thesis no longer exists.
This represents a failed breakout and an unsuccessful chart pattern.
Summary for the 4 types of breakout:
142
·
--
Bullish
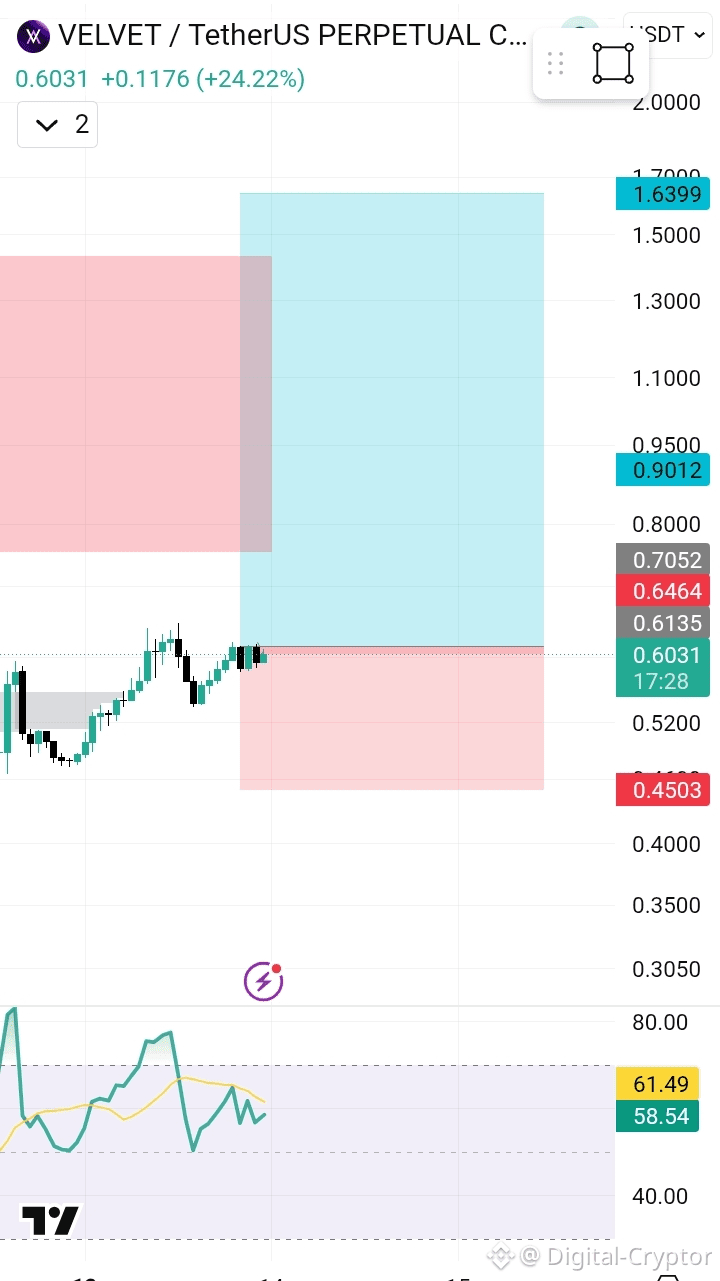
$VELVET is rising third time buyers are gaining momentum. wait for the 1H resistance breakout before execution.
Long $VELVET
{future}(VELVETUSDT)
Entry: 0.6025- 0.6545
TP1 0.7523
TP2 0.8656
TP3 0.9823
SL 0.4503
$VELVET is rising third time buyers are gaining momentum. wait for the 1H resistance breakout before execution.
Long $VELVET
Entry: 0.6025- 0.6545
TP1 0.7523
TP2 0.8656
TP3 0.9823
SL 0.4503
Long $VELVET
Entry: 0.6025- 0.6545
TP1 0.7523
TP2 0.8656
TP3 0.9823
SL 0.4503
154
Bitcoin holds near $63,800 as war-driven selloff hits everything but crypto
Gold, oil, stocks and bonds all moved sharply on the fourth round of U.S. strikes on Iran, but bitcoin is little-changed.
bitcoin held near $63,800 on Monday while gold, oil, equities and government bonds all slumped on U.S.'s fourth round of strikes on Iran in a week. The largest cryptocurrency was down 0.3% over 24 hours and up 2% on the week.
The traditional-market reaction that was on hold over yweekend arrived at once. Spot gold slid as much as 1.6% to near $4,050 an ounce. Brent crude jumped 4% to above $79 a barrel as conflicting claims over the Strait of Hormuz fueled worries about .
supply
Treasuries fell across curve, with the two-year yield climbing to its highest since February 2025, and MSCI's Asia Pacific equities gauge dropped 1.6%.
Central Command said U.S. forces struck Iran in response to an attack on a container ship. The status of the strait was left unclear, with the U.S. denying Iran's statement that waterway would close "until further notice." Roughly a fifth of the world's seaborne oil normally passes through Hormuz
Moves priced a single fear, that a wider war keeps oil elevated and forces Federal Reserve to hold rates higher for longer. Minutes of the Fed's June meeting show a few policymakers saw a case for raising rates before backing a hold. Gold fell because a higher-for-longer path lifts real yields and dulls appeal of metal that pays nothing, and bonds fell for same reason.
But bitcoin sat all of it out. Ether was little changed at about $1,800, up 2% on the week, and the rest of majors barely moved on the day, with Solana weakest at $76, down 5% over seven days. XRP held $1.09 and dogecoin sat near $0.07.
one crypto-relevant thread runs through Korean stocks. SK Hynix shares plunged 12% in Seoul after chipmaker's U.S.-listed shares surged 13% on their Friday debut, a reversal that helped drag the Kospi down 7%. That chip trade drove rally that lifted bitcoin on Friday, and its sharp reversal on Monday still left crypto flat, in either direction.
Bitcoin holds near $63,800 as war-driven selloff hits everything but crypto
Gold, oil, stocks and bonds all moved sharply on the fourth round of U.S. strikes on Iran, but bitcoin is little-changed.
bitcoin held near $63,800 on Monday while gold, oil, equities and government bonds all slumped on U.S.'s fourth round of strikes on Iran in a week. The largest cryptocurrency was down 0.3% over 24 hours and up 2% on the week.
The traditional-market reaction that was on hold over yweekend arrived at once. Spot gold slid as much as 1.6% to near $4,050 an ounce. Brent crude jumped 4% to above $79 a barrel as conflicting claims over the Strait of Hormuz fueled worries about .
supply
Treasuries fell across curve, with the two-year yield climbing to its highest since February 2025, and MSCI's Asia Pacific equities gauge dropped 1.6%.
Central Command said U.S. forces struck Iran in response to an attack on a container ship. The status of the strait was left unclear, with the U.S. denying Iran's statement that waterway would close "until further notice." Roughly a fifth of the world's seaborne oil normally passes through Hormuz
Moves priced a single fear, that a wider war keeps oil elevated and forces Federal Reserve to hold rates higher for longer. Minutes of the Fed's June meeting show a few policymakers saw a case for raising rates before backing a hold. Gold fell because a higher-for-longer path lifts real yields and dulls appeal of metal that pays nothing, and bonds fell for same reason.
But bitcoin sat all of it out. Ether was little changed at about $1,800, up 2% on the week, and the rest of majors barely moved on the day, with Solana weakest at $76, down 5% over seven days. XRP held $1.09 and dogecoin sat near $0.07.
one crypto-relevant thread runs through Korean stocks. SK Hynix shares plunged 12% in Seoul after chipmaker's U.S.-listed shares surged 13% on their Friday debut, a reversal that helped drag the Kospi down 7%. That chip trade drove rally that lifted bitcoin on Friday, and its sharp reversal on Monday still left crypto flat, in either direction.
Gold, oil, stocks and bonds all moved sharply on the fourth round of U.S. strikes on Iran, but bitcoin is little-changed.
bitcoin held near $63,800 on Monday while gold, oil, equities and government bonds all slumped on U.S.'s fourth round of strikes on Iran in a week. The largest cryptocurrency was down 0.3% over 24 hours and up 2% on the week.
The traditional-market reaction that was on hold over yweekend arrived at once. Spot gold slid as much as 1.6% to near $4,050 an ounce. Brent crude jumped 4% to above $79 a barrel as conflicting claims over the Strait of Hormuz fueled worries about .
supply
Treasuries fell across curve, with the two-year yield climbing to its highest since February 2025, and MSCI's Asia Pacific equities gauge dropped 1.6%.
Central Command said U.S. forces struck Iran in response to an attack on a container ship. The status of the strait was left unclear, with the U.S. denying Iran's statement that waterway would close "until further notice." Roughly a fifth of the world's seaborne oil normally passes through Hormuz
Moves priced a single fear, that a wider war keeps oil elevated and forces Federal Reserve to hold rates higher for longer. Minutes of the Fed's June meeting show a few policymakers saw a case for raising rates before backing a hold. Gold fell because a higher-for-longer path lifts real yields and dulls appeal of metal that pays nothing, and bonds fell for same reason.
But bitcoin sat all of it out. Ether was little changed at about $1,800, up 2% on the week, and the rest of majors barely moved on the day, with Solana weakest at $76, down 5% over seven days. XRP held $1.09 and dogecoin sat near $0.07.
one crypto-relevant thread runs through Korean stocks. SK Hynix shares plunged 12% in Seoul after chipmaker's U.S.-listed shares surged 13% on their Friday debut, a reversal that helped drag the Kospi down 7%. That chip trade drove rally that lifted bitcoin on Friday, and its sharp reversal on Monday still left crypto flat, in either direction.
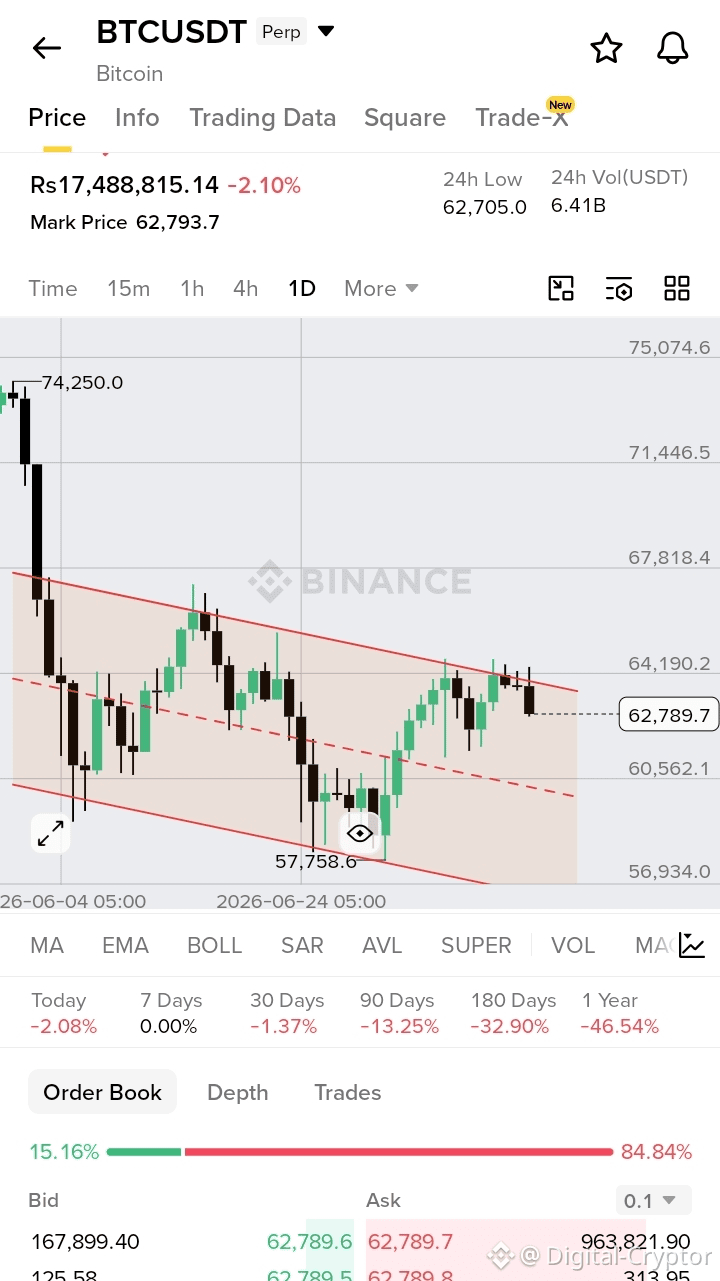

72
·
--
Bearish
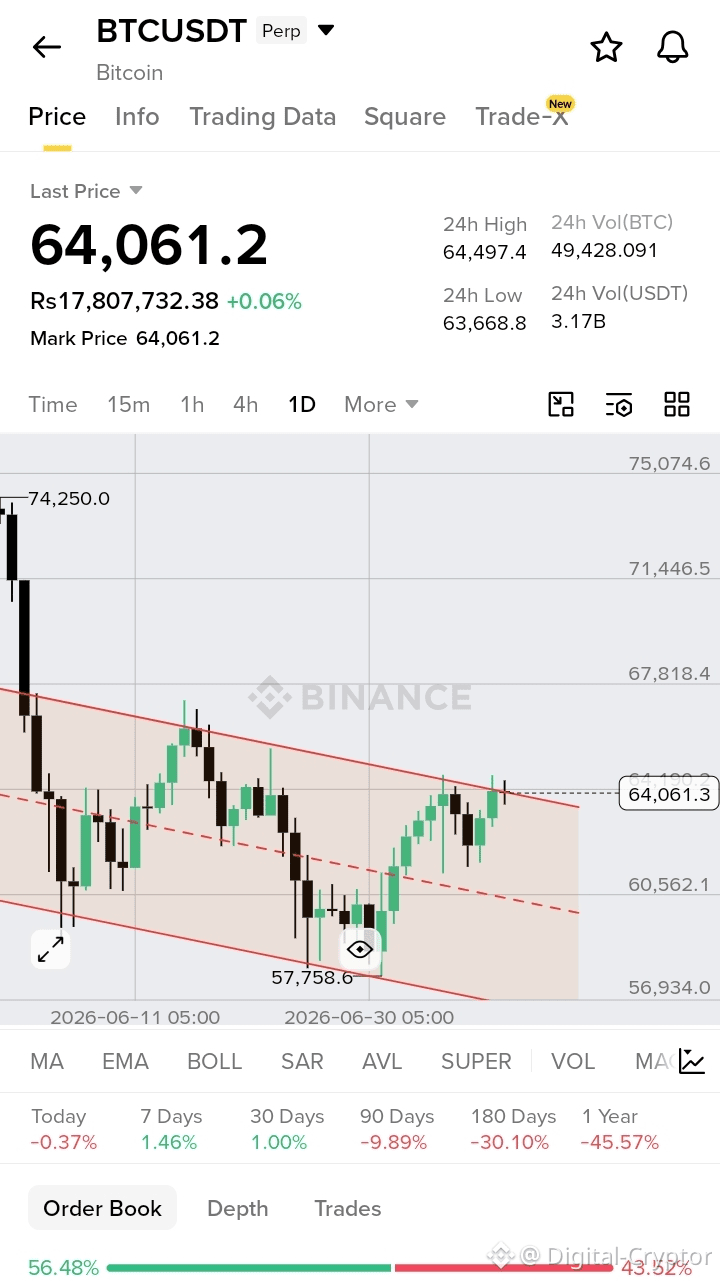
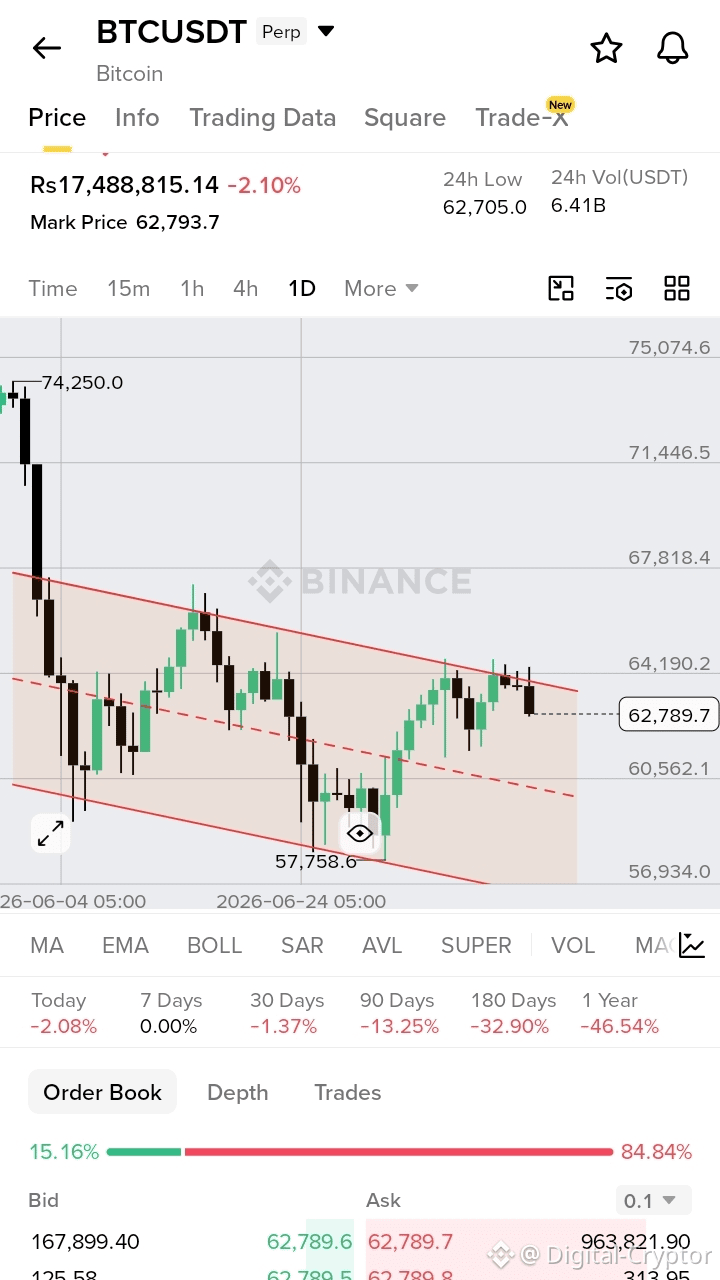
As said previously $BTC has rejected from the trend line resistance. it may seen that seller are so confident to push the price back to 56k-55k zone.
As said previously $BTC has rejected from the trend line resistance. it may seen that seller are so confident to push the price back to 56k-55k zone.
Digital-Cryptor
·
--
Bullish$BTC is reaching the rejection area. if it gives breakout with strong volume candle then it can easily reveal the the face of 66k-67k.
94
·
--
Bullish
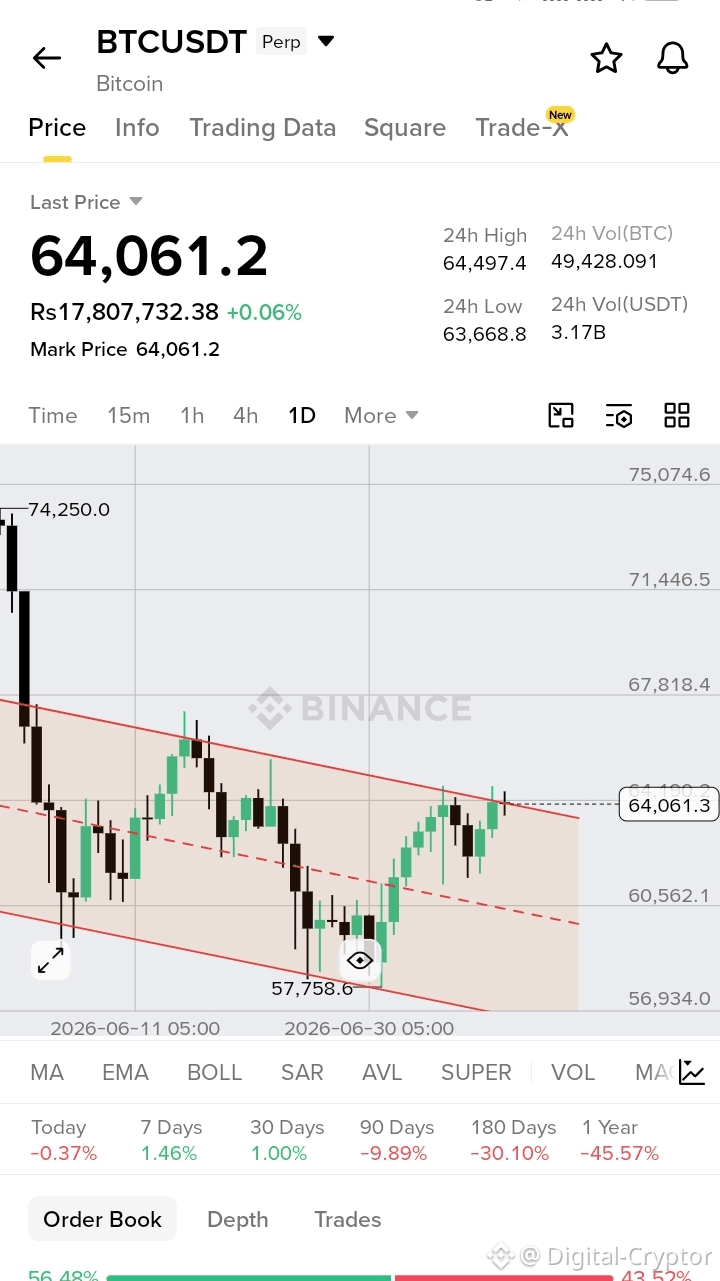
$BTC is reaching the rejection area. if it gives breakout with strong volume candle then it can easily reveal the the face of 66k-67k.
$BTC is reaching the rejection area. if it gives breakout with strong volume candle then it can easily reveal the the face of 66k-67k.
1
1
122
Log in to explore more content
Join global crypto users on Binance Square
⚡️ Get latest and useful information about crypto.
💬 Trusted by the world’s largest crypto exchange.
👍 Discover real insights from verified creators.
Email / Phone number
Trending Topics
ADAGains10%Above$0.27
789 views
41 Discussing
#ADAGains10%Above$0.27
$ADA IS FINALLY WAKING UP 👀
Cardano's $ADA just jumped 10% in 24 hours, pushing above $0.27 for the first time since May.
The move comes as attention builds around Cardano's RealFi ecosystem and the upcoming Dijkstra scalability upgrade.
After months of slow price action, $ADA is suddenly back on traders' radar.
#ADA #Cardano #crypto #altcoins
Albertc07
·0 Likes
·136 views
ETHUp70%InQ3ButLiquidityFalls
11,834 views
232 Discussing
EthStakingExitQueueHits2026High
4,638 views
255 Discussing