
Mozzy111
147 Posts

Mozzy111
Report
Block User
NFA / DYOR
Frequent Trader
1.1 Years
2 Following
35 Followers
122 Liked
Posts
·
--
Update: Back to Full Focus, Active Positions Review & Performance Stats
The past couple of days kept me busy away from the charts, but throughout this period, all open positions remained strictly safeguarded by our risk management system. With all protective stops and parameters established in advance, time away from the screen never compromises systematic execution.
Today, I am preparing two comprehensive updates:
1. Active Positions Deep Dive: A detailed review of every open setup — examining where we secured partial profits, where stops sit safely at Breakeven, and which assets are consolidating ahead of an impulse.
2. Consolidated Performance Statistics: A transparent overview of our closed and active trade setups, risk-to-reward ratios, and an unvarnished review of our numbers.
Discipline and clear execution rules work even when stepping away from the desk. Stay tuned, the breakdown and charts are dropping shortly! 🤝📊
Update: Back to Full Focus, Active Positions Review & Performance Stats
The past couple of days kept me busy away from the charts, but throughout this period, all open positions remained strictly safeguarded by our risk management system. With all protective stops and parameters established in advance, time away from the screen never compromises systematic execution.
Today, I am preparing two comprehensive updates:
1. Active Positions Deep Dive: A detailed review of every open setup — examining where we secured partial profits, where stops sit safely at Breakeven, and which assets are consolidating ahead of an impulse.
2. Consolidated Performance Statistics: A transparent overview of our closed and active trade setups, risk-to-reward ratios, and an unvarnished review of our numbers.
Discipline and clear execution rules work even when stepping away from the desk. Stay tuned, the breakdown and charts are dropping shortly! 🤝📊
The past couple of days kept me busy away from the charts, but throughout this period, all open positions remained strictly safeguarded by our risk management system. With all protective stops and parameters established in advance, time away from the screen never compromises systematic execution.
Today, I am preparing two comprehensive updates:
1. Active Positions Deep Dive: A detailed review of every open setup — examining where we secured partial profits, where stops sit safely at Breakeven, and which assets are consolidating ahead of an impulse.
2. Consolidated Performance Statistics: A transparent overview of our closed and active trade setups, risk-to-reward ratios, and an unvarnished review of our numbers.
Discipline and clear execution rules work even when stepping away from the desk. Stay tuned, the breakdown and charts are dropping shortly! 🤝📊
115
·
--
🟠 Market Update: $BTC / USDT Plan and Awaiting News
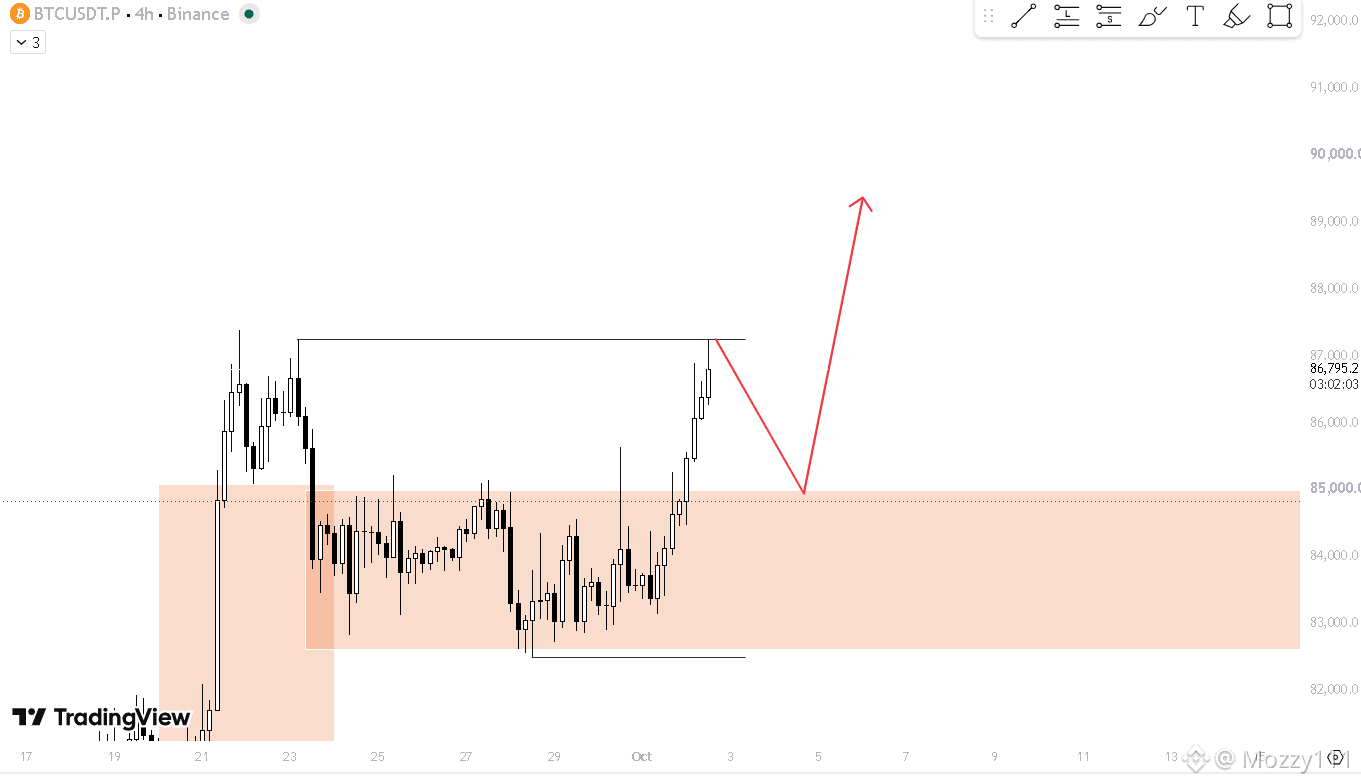
For Bitcoin, the structure is forming quite clearly, but locally the asset has approached a crucial boundary.
After testing the upper resistance level around $87,200, it is completely logical to anticipate a local market cool-down. The priority scenario is a corrective pullback into the ~$84,800 – $85,000 support zone to sweep liquidity and retest the previous accumulation, after which we anticipate a strong impulsive move upward to new highs.
📊 Key Chart Targets:
Current resistance zone: $87,200 – $87,300
Target zone for correction / reaction: $84,800 – $85,000
Potential for further impulse: $89,000+ after defending the support
Position Recommendations:
We have upcoming news releases, so volatility could spike sharply. Right now, the best course of action is patience. Until the news is out and we see a confirmed reaction at our key levels, I highly recommend avoiding opening any unnecessary or chaotic positions. Let the market form a clear entry point; do not try to guess the movement inside the range.
Keep a cool head, protect your margin, and act strictly according to the plan. 🤝🛡
{future}(BTCUSDT)
{spot}(BTCUSDT)
🟠 Market Update: $BTC / USDT Plan and Awaiting News
For Bitcoin, the structure is forming quite clearly, but locally the asset has approached a crucial boundary.
After testing the upper resistance level around $87,200, it is completely logical to anticipate a local market cool-down. The priority scenario is a corrective pullback into the ~$84,800 – $85,000 support zone to sweep liquidity and retest the previous accumulation, after which we anticipate a strong impulsive move upward to new highs.
📊 Key Chart Targets:
Current resistance zone: $87,200 – $87,300
Target zone for correction / reaction: $84,800 – $85,000
Potential for further impulse: $89,000+ after defending the support
Position Recommendations:
We have upcoming news releases, so volatility could spike sharply. Right now, the best course of action is patience. Until the news is out and we see a confirmed reaction at our key levels, I highly recommend avoiding opening any unnecessary or chaotic positions. Let the market form a clear entry point; do not try to guess the movement inside the range.
Keep a cool head, protect your margin, and act strictly according to the plan. 🤝🛡
For Bitcoin, the structure is forming quite clearly, but locally the asset has approached a crucial boundary.
After testing the upper resistance level around $87,200, it is completely logical to anticipate a local market cool-down. The priority scenario is a corrective pullback into the ~$84,800 – $85,000 support zone to sweep liquidity and retest the previous accumulation, after which we anticipate a strong impulsive move upward to new highs.
📊 Key Chart Targets:
Current resistance zone: $87,200 – $87,300
Target zone for correction / reaction: $84,800 – $85,000
Potential for further impulse: $89,000+ after defending the support
Position Recommendations:
We have upcoming news releases, so volatility could spike sharply. Right now, the best course of action is patience. Until the news is out and we see a confirmed reaction at our key levels, I highly recommend avoiding opening any unnecessary or chaotic positions. Let the market form a clear entry point; do not try to guess the movement inside the range.
Keep a cool head, protect your margin, and act strictly according to the plan. 🤝🛡
1
16
·
--
Bullish
New Setup: Going Long on $AAVE / USDT
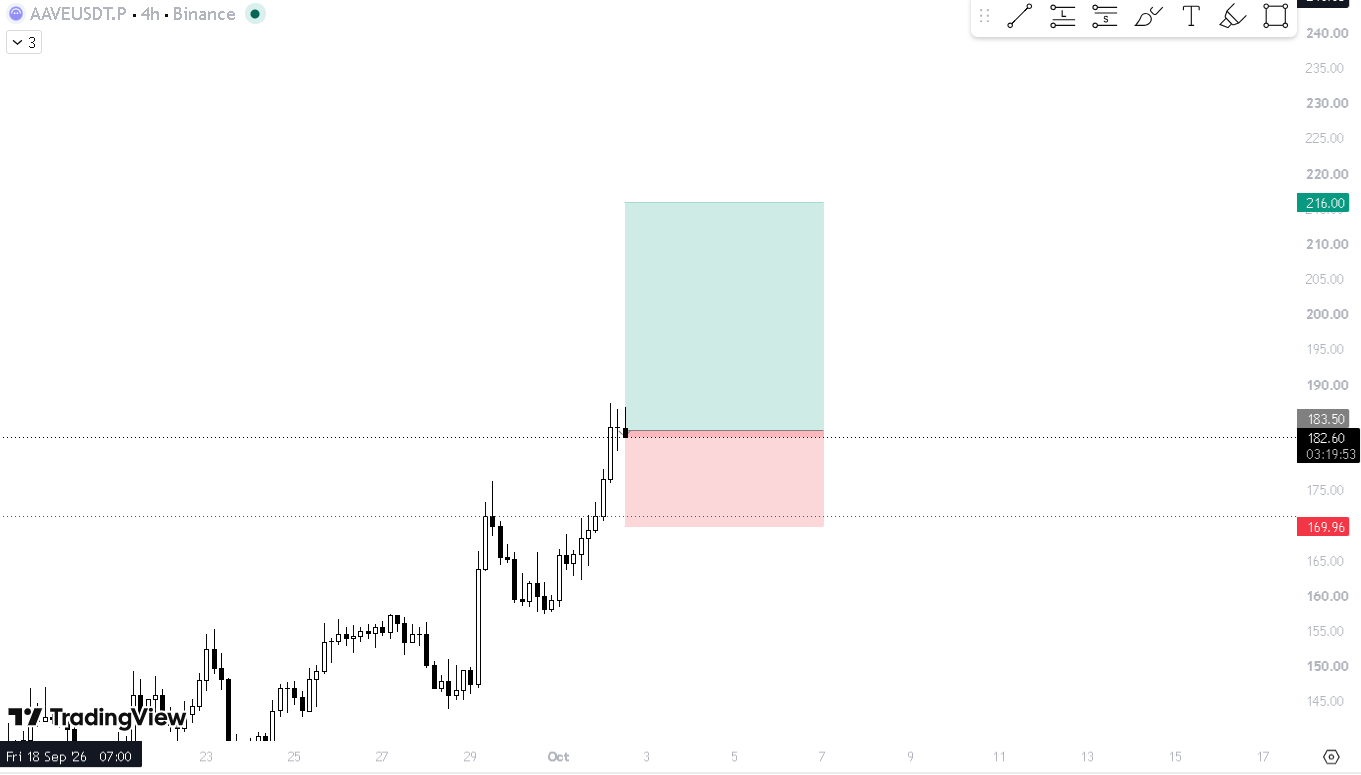
The chart is showing a strong bullish momentum and solid structure. The aggressive buying after the local correction indicates clear buyer interest. We are going long to catch the trend continuation with a logical position defense.
📊 Trade Parameters: 🔹 Entry: Long from current levels — ~183.52 – 184.28. 🔹 Stop-Loss (SL): 169.96 (safely hidden below the key structural low to avoid random wicks). 🔹 Take-Profit (TP): 216.08 (growth potential to the next resistance zone).
Trade Management Algorithm:
Our trading plan remains unchanged. As soon as the price delivers a solid impulse in our direction, we will definitely secure partial profits (30-35% of the volume) and immediately move the stop-loss to Breakeven. We make the position risk-free at the earliest opportunity.
⚠️ DYOR: All data is published strictly for educational purposes. Control your margin and adhere to systemic risk management.
$AAVE
{future}(AAVEUSDT)
{spot}(AAVEUSDT)
New Setup: Going Long on $AAVE / USDT
The chart is showing a strong bullish momentum and solid structure. The aggressive buying after the local correction indicates clear buyer interest. We are going long to catch the trend continuation with a logical position defense.
📊 Trade Parameters: 🔹 Entry: Long from current levels — ~183.52 – 184.28. 🔹 Stop-Loss (SL): 169.96 (safely hidden below the key structural low to avoid random wicks). 🔹 Take-Profit (TP): 216.08 (growth potential to the next resistance zone).
Trade Management Algorithm:
Our trading plan remains unchanged. As soon as the price delivers a solid impulse in our direction, we will definitely secure partial profits (30-35% of the volume) and immediately move the stop-loss to Breakeven. We make the position risk-free at the earliest opportunity.
⚠️ DYOR: All data is published strictly for educational purposes. Control your margin and adhere to systemic risk management.
$AAVE
The chart is showing a strong bullish momentum and solid structure. The aggressive buying after the local correction indicates clear buyer interest. We are going long to catch the trend continuation with a logical position defense.
📊 Trade Parameters: 🔹 Entry: Long from current levels — ~183.52 – 184.28. 🔹 Stop-Loss (SL): 169.96 (safely hidden below the key structural low to avoid random wicks). 🔹 Take-Profit (TP): 216.08 (growth potential to the next resistance zone).
Trade Management Algorithm:
Our trading plan remains unchanged. As soon as the price delivers a solid impulse in our direction, we will definitely secure partial profits (30-35% of the volume) and immediately move the stop-loss to Breakeven. We make the position risk-free at the earliest opportunity.
⚠️ DYOR: All data is published strictly for educational purposes. Control your margin and adhere to systemic risk management.
$AAVE
1
63
·
--
Local Update: Profit Secured on $MANA / USDT (+11.24% net move)
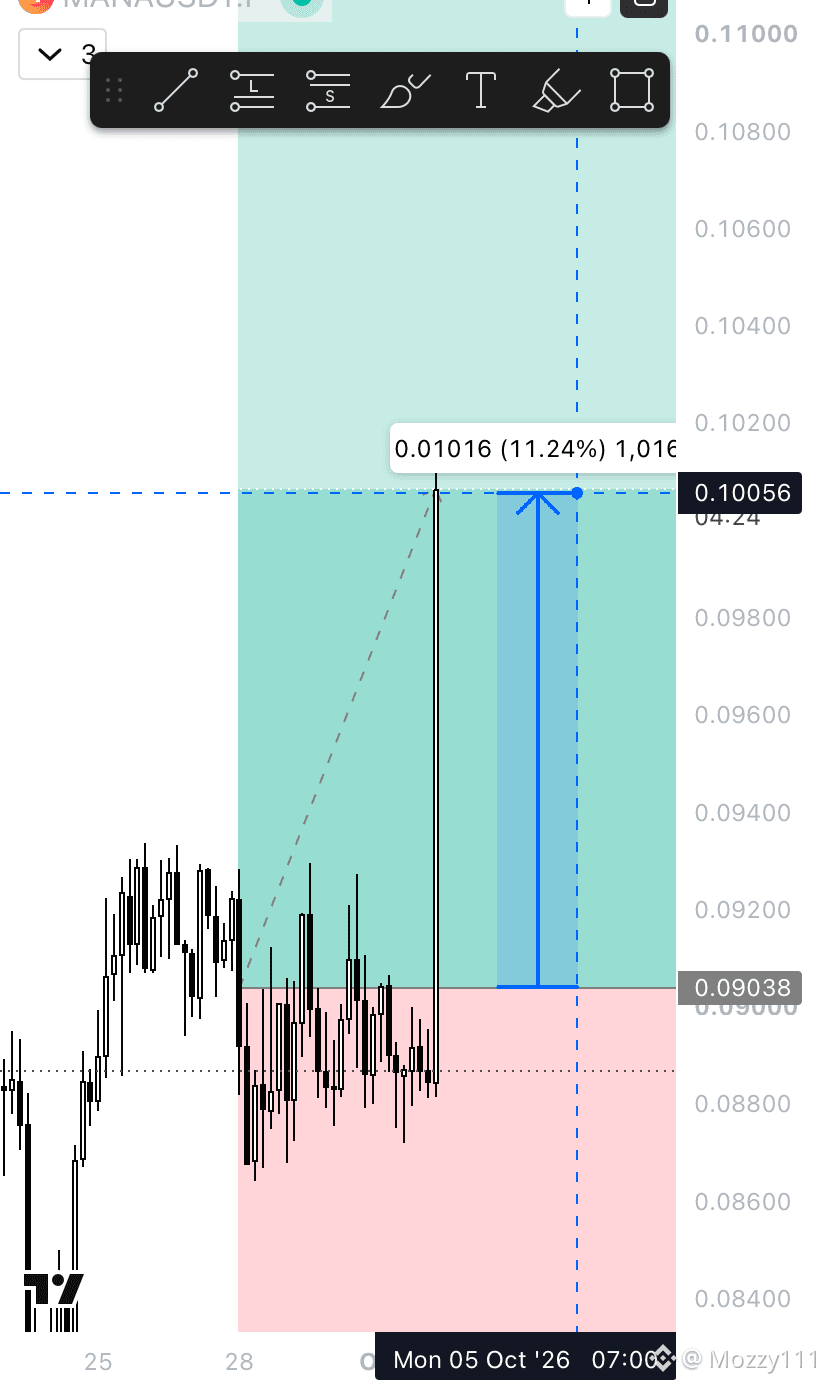
The asset delivered a fantastic impulse! As seen on the chart, we caught a sharp price spike reaching the ~0.10056 level, which represents over an 11% net move from our base entry point (0.09038). Executing the plan and de-risking into volatility.
Current Trade Execution:
Secured 35% of the volume on this impulse. Taking guaranteed profit off the table.
Stop-Loss moved to Breakeven: protection is now strictly set at our entry point.
Remaining 65% of the position is left running smoothly toward our next targets entirely risk-free.
Disciplined partial profit-taking and capital protection are the keys to consistency. 🤝📈
Local Update: Profit Secured on $MANA / USDT (+11.24% net move)
The asset delivered a fantastic impulse! As seen on the chart, we caught a sharp price spike reaching the ~0.10056 level, which represents over an 11% net move from our base entry point (0.09038). Executing the plan and de-risking into volatility.
Current Trade Execution:
Secured 35% of the volume on this impulse. Taking guaranteed profit off the table.
Stop-Loss moved to Breakeven: protection is now strictly set at our entry point.
Remaining 65% of the position is left running smoothly toward our next targets entirely risk-free.
Disciplined partial profit-taking and capital protection are the keys to consistency. 🤝📈
The asset delivered a fantastic impulse! As seen on the chart, we caught a sharp price spike reaching the ~0.10056 level, which represents over an 11% net move from our base entry point (0.09038). Executing the plan and de-risking into volatility.
Current Trade Execution:
Secured 35% of the volume on this impulse. Taking guaranteed profit off the table.
Stop-Loss moved to Breakeven: protection is now strictly set at our entry point.
Remaining 65% of the position is left running smoothly toward our next targets entirely risk-free.
Disciplined partial profit-taking and capital protection are the keys to consistency. 🤝📈
1
105
·
--
🟠 Local Update: $PUMP / USDT Closed at Breakeven (BU)
The market made a correction, and the remainder of our double-margin $PUMP position was stopped out at our average entry point.
Is this an issue? Not at all. As a reminder, we already successfully secured 35% of the volume at a +4.70% net move. The rest was riding completely risk-free. The trade is closed in solid profit, and the freed-up capital is immediately going back to work!
🟢 New Swing Setup: Going Long on $UNI / USDT
On the 4-hour timeframe (4H), $UNI has formed a solid structural base and is showing signs of accumulation following a correction. We have a clear zone of interest and an excellent Risk/Reward ratio, so we are opening a long position targeting the upside liquidity sweep.
📊 Trade Parameters:
🔹 Entry: Long from current levels — ~9.071 – 9.088.
🔹 Stop-Loss (SL): 8.304 (protection is logically placed below the local support zone and previous wicks).
🔹 Take-Profit (TP): 11.943 (macro target to test the upper boundary of the range).
Trade Management Algorithm:
Working by our standard playbook. As soon as the asset delivers the first strong impulse in our direction and we secure a comfortable net move percentage, we will immediately shift the stop-loss to Breakeven. We make the position risk-free at the earliest opportunity.
⚠️ DYOR: All data is published strictly for educational purposes. Control your margin and adhere to systemic risk management.
{future}(UNIUSDT)
🟠 Local Update: $PUMP / USDT Closed at Breakeven (BU)
The market made a correction, and the remainder of our double-margin $PUMP position was stopped out at our average entry point.
Is this an issue? Not at all. As a reminder, we already successfully secured 35% of the volume at a +4.70% net move. The rest was riding completely risk-free. The trade is closed in solid profit, and the freed-up capital is immediately going back to work!
🟢 New Swing Setup: Going Long on $UNI / USDT
On the 4-hour timeframe (4H), $UNI has formed a solid structural base and is showing signs of accumulation following a correction. We have a clear zone of interest and an excellent Risk/Reward ratio, so we are opening a long position targeting the upside liquidity sweep.
📊 Trade Parameters:
🔹 Entry: Long from current levels — ~9.071 – 9.088.
🔹 Stop-Loss (SL): 8.304 (protection is logically placed below the local support zone and previous wicks).
🔹 Take-Profit (TP): 11.943 (macro target to test the upper boundary of the range).
Trade Management Algorithm:
Working by our standard playbook. As soon as the asset delivers the first strong impulse in our direction and we secure a comfortable net move percentage, we will immediately shift the stop-loss to Breakeven. We make the position risk-free at the earliest opportunity.
⚠️ DYOR: All data is published strictly for educational purposes. Control your margin and adhere to systemic risk management.
The market made a correction, and the remainder of our double-margin $PUMP position was stopped out at our average entry point.
Is this an issue? Not at all. As a reminder, we already successfully secured 35% of the volume at a +4.70% net move. The rest was riding completely risk-free. The trade is closed in solid profit, and the freed-up capital is immediately going back to work!
🟢 New Swing Setup: Going Long on $UNI / USDT
On the 4-hour timeframe (4H), $UNI has formed a solid structural base and is showing signs of accumulation following a correction. We have a clear zone of interest and an excellent Risk/Reward ratio, so we are opening a long position targeting the upside liquidity sweep.
📊 Trade Parameters:
🔹 Entry: Long from current levels — ~9.071 – 9.088.
🔹 Stop-Loss (SL): 8.304 (protection is logically placed below the local support zone and previous wicks).
🔹 Take-Profit (TP): 11.943 (macro target to test the upper boundary of the range).
Trade Management Algorithm:
Working by our standard playbook. As soon as the asset delivers the first strong impulse in our direction and we secure a comfortable net move percentage, we will immediately shift the stop-loss to Breakeven. We make the position risk-free at the earliest opportunity.
⚠️ DYOR: All data is published strictly for educational purposes. Control your margin and adhere to systemic risk management.
1
90
·
--
Local Update: Trade Management on $PUMP / USDT
The asset has made a deeper correction into our zone of interest, so I am adjusting the initial trading plan and shifting to active position management. The market is giving us an opportunity to accumulate more volume at a better (discount) price.
Current Trade Execution:
Hard Stop-Loss removed: giving the asset more room to breathe and form its structure within this accumulation base.
Averaging down (DCA): Added to the long position from current market levels at 0.005516.
This action significantly improves our average entry price. I am continuing to hold the long position, expecting a reversal and a breakout from this zone toward our targets.
⚠️ DYOR: Averaging down and removing a hard stop is an aggressive approach that requires strict margin control. All data is published for educational purposes only—do not overexpose your portfolio!
{future}(PUMPUSDT)
Local Update: Trade Management on $PUMP / USDT
The asset has made a deeper correction into our zone of interest, so I am adjusting the initial trading plan and shifting to active position management. The market is giving us an opportunity to accumulate more volume at a better (discount) price.
Current Trade Execution:
Hard Stop-Loss removed: giving the asset more room to breathe and form its structure within this accumulation base.
Averaging down (DCA): Added to the long position from current market levels at 0.005516.
This action significantly improves our average entry price. I am continuing to hold the long position, expecting a reversal and a breakout from this zone toward our targets.
⚠️ DYOR: Averaging down and removing a hard stop is an aggressive approach that requires strict margin control. All data is published for educational purposes only—do not overexpose your portfolio!
The asset has made a deeper correction into our zone of interest, so I am adjusting the initial trading plan and shifting to active position management. The market is giving us an opportunity to accumulate more volume at a better (discount) price.
Current Trade Execution:
Hard Stop-Loss removed: giving the asset more room to breathe and form its structure within this accumulation base.
Averaging down (DCA): Added to the long position from current market levels at 0.005516.
This action significantly improves our average entry price. I am continuing to hold the long position, expecting a reversal and a breakout from this zone toward our targets.
⚠️ DYOR: Averaging down and removing a hard stop is an aggressive approach that requires strict margin control. All data is published for educational purposes only—do not overexpose your portfolio!
1
142
·
--
New Macro Setup: Going Long on $ENA / USDT
On the daily timeframe (1D), $ENA is showing a powerful breakout from a prolonged accumulation base, confirmed by a significant increase in volume. The structure is bullish, and the local correction provides a great entry point for the continuation of the mid-term trend with excellent Risk/Reward potential.
📊 Trade Parameters:
🔹 Entry: Long from current levels — ~0.2760 – 0.2773
🔹 Stop-Loss (SL): 0.22979 (placed below the local accumulation structure and support zone)
🔹 Take-Profit 1 (TP1): 0.31660 (sweeping the first structural liquidity pool)
🔹 Take-Profit 2 (TP2): 0.37420 (intermediate macro resistance level)
🔹 Take-Profit 3 (TP3): 0.44359 (final target to sweep the upside liquidity)
Trade Management Algorithm:
Upon reaching the first target (0.31660), we must secure 30–35% of the volume and move the stop-loss to Breakeven. At the 0.37420 level, we will offload another portion of the position, letting the remainder run risk-free to the final take-profit.
⚠️ DYOR: All data is published strictly for educational purposes. Control your margin and adhere to systemic risk management.
$ENA
{future}(ENAUSDT)
New Macro Setup: Going Long on $ENA / USDT
On the daily timeframe (1D), $ENA is showing a powerful breakout from a prolonged accumulation base, confirmed by a significant increase in volume. The structure is bullish, and the local correction provides a great entry point for the continuation of the mid-term trend with excellent Risk/Reward potential.
📊 Trade Parameters:
🔹 Entry: Long from current levels — ~0.2760 – 0.2773
🔹 Stop-Loss (SL): 0.22979 (placed below the local accumulation structure and support zone)
🔹 Take-Profit 1 (TP1): 0.31660 (sweeping the first structural liquidity pool)
🔹 Take-Profit 2 (TP2): 0.37420 (intermediate macro resistance level)
🔹 Take-Profit 3 (TP3): 0.44359 (final target to sweep the upside liquidity)
Trade Management Algorithm:
Upon reaching the first target (0.31660), we must secure 30–35% of the volume and move the stop-loss to Breakeven. At the 0.37420 level, we will offload another portion of the position, letting the remainder run risk-free to the final take-profit.
⚠️ DYOR: All data is published strictly for educational purposes. Control your margin and adhere to systemic risk management.
$ENA
On the daily timeframe (1D), $ENA is showing a powerful breakout from a prolonged accumulation base, confirmed by a significant increase in volume. The structure is bullish, and the local correction provides a great entry point for the continuation of the mid-term trend with excellent Risk/Reward potential.
📊 Trade Parameters:
🔹 Entry: Long from current levels — ~0.2760 – 0.2773
🔹 Stop-Loss (SL): 0.22979 (placed below the local accumulation structure and support zone)
🔹 Take-Profit 1 (TP1): 0.31660 (sweeping the first structural liquidity pool)
🔹 Take-Profit 2 (TP2): 0.37420 (intermediate macro resistance level)
🔹 Take-Profit 3 (TP3): 0.44359 (final target to sweep the upside liquidity)
Trade Management Algorithm:
Upon reaching the first target (0.31660), we must secure 30–35% of the volume and move the stop-loss to Breakeven. At the 0.37420 level, we will offload another portion of the position, letting the remainder run risk-free to the final take-profit.
⚠️ DYOR: All data is published strictly for educational purposes. Control your margin and adhere to systemic risk management.
$ENA
1
184
·
--
Macro Update: Inflation, GDP, and Market Reaction
Bitcoin
Key Macro
Core PCE: 3.0% (forecast 3.3%, prev 3.0%)
Headline PCE: 3.4% (forecast 3.7%, prev 3.4%)
Both Core and Headline PCE came in below analyst expectations. Inflationary pressure is cooling faster than the market anticipated, while year-over-year Core PCE held steady at 3.0%.
US GDP (Q2): 2.2% (forecast 1.5%, prev 2.1%)
The US economy is showing excellent resilience, growing at an accelerated pace (2.2% vs. 1.5% expected). Meanwhile, the GDP deflator (6.1%) indicates that nominal economic output remained strong.
Fed Impact & Market Sentiment: Cooling inflation (PCE below expectations) combined with strong economic growth (GDP above expectations) is the textbook definition of a "Soft Landing" scenario.
Simply put: the economy is avoiding a recession while inflation steadily declines toward target levels. This is a massive "risk-on" signal for the markets.
The Fed has no fundamental reason to suppress the economy with further rate hikes, and the path to monetary easing is becoming much clearer.
Macro Update: Inflation, GDP, and Market Reaction
Bitcoin
Key Macro
Core PCE: 3.0% (forecast 3.3%, prev 3.0%)
Headline PCE: 3.4% (forecast 3.7%, prev 3.4%)
Both Core and Headline PCE came in below analyst expectations. Inflationary pressure is cooling faster than the market anticipated, while year-over-year Core PCE held steady at 3.0%.
US GDP (Q2): 2.2% (forecast 1.5%, prev 2.1%)
The US economy is showing excellent resilience, growing at an accelerated pace (2.2% vs. 1.5% expected). Meanwhile, the GDP deflator (6.1%) indicates that nominal economic output remained strong.
Fed Impact & Market Sentiment: Cooling inflation (PCE below expectations) combined with strong economic growth (GDP above expectations) is the textbook definition of a "Soft Landing" scenario.
Simply put: the economy is avoiding a recession while inflation steadily declines toward target levels. This is a massive "risk-on" signal for the markets.
The Fed has no fundamental reason to suppress the economy with further rate hikes, and the path to monetary easing is becoming much clearer.
Bitcoin
Key Macro
Core PCE: 3.0% (forecast 3.3%, prev 3.0%)
Headline PCE: 3.4% (forecast 3.7%, prev 3.4%)
Both Core and Headline PCE came in below analyst expectations. Inflationary pressure is cooling faster than the market anticipated, while year-over-year Core PCE held steady at 3.0%.
US GDP (Q2): 2.2% (forecast 1.5%, prev 2.1%)
The US economy is showing excellent resilience, growing at an accelerated pace (2.2% vs. 1.5% expected). Meanwhile, the GDP deflator (6.1%) indicates that nominal economic output remained strong.
Fed Impact & Market Sentiment: Cooling inflation (PCE below expectations) combined with strong economic growth (GDP above expectations) is the textbook definition of a "Soft Landing" scenario.
Simply put: the economy is avoiding a recession while inflation steadily declines toward target levels. This is a massive "risk-on" signal for the markets.
The Fed has no fundamental reason to suppress the economy with further rate hikes, and the path to monetary easing is becoming much clearer.
1
27
Log in to explore more content
Join global crypto users on Binance Square
⚡️ Get latest and useful information about crypto.
💬 Trusted by the world’s largest crypto exchange.
👍 Discover real insights from verified creators.
Email / Phone number
Trending Topics
A Packed Week of Earnings and Data Tests Markets
63,729 views
399 Discussing
Nvidia, Anthropic, and the Fed: Three Tests in One Week
Nick_Invest
·3 Likes
·1.4k views
AnthropicIPOTestsInvestorAppetiteForAI
119,774 views
1,380 Discussing
BitcoinExtendsLosingStreakToSixWeeks
93,836 views
742 Discussing