
molang
70 Posts

molang
Report
Block User
Hold #Gram#Not#Dogs 2025
7 Following
22 Followers
59 Liked
Posts
All
Quotes
·
--
After a slope, you may not be sure you’ve reached the peak.
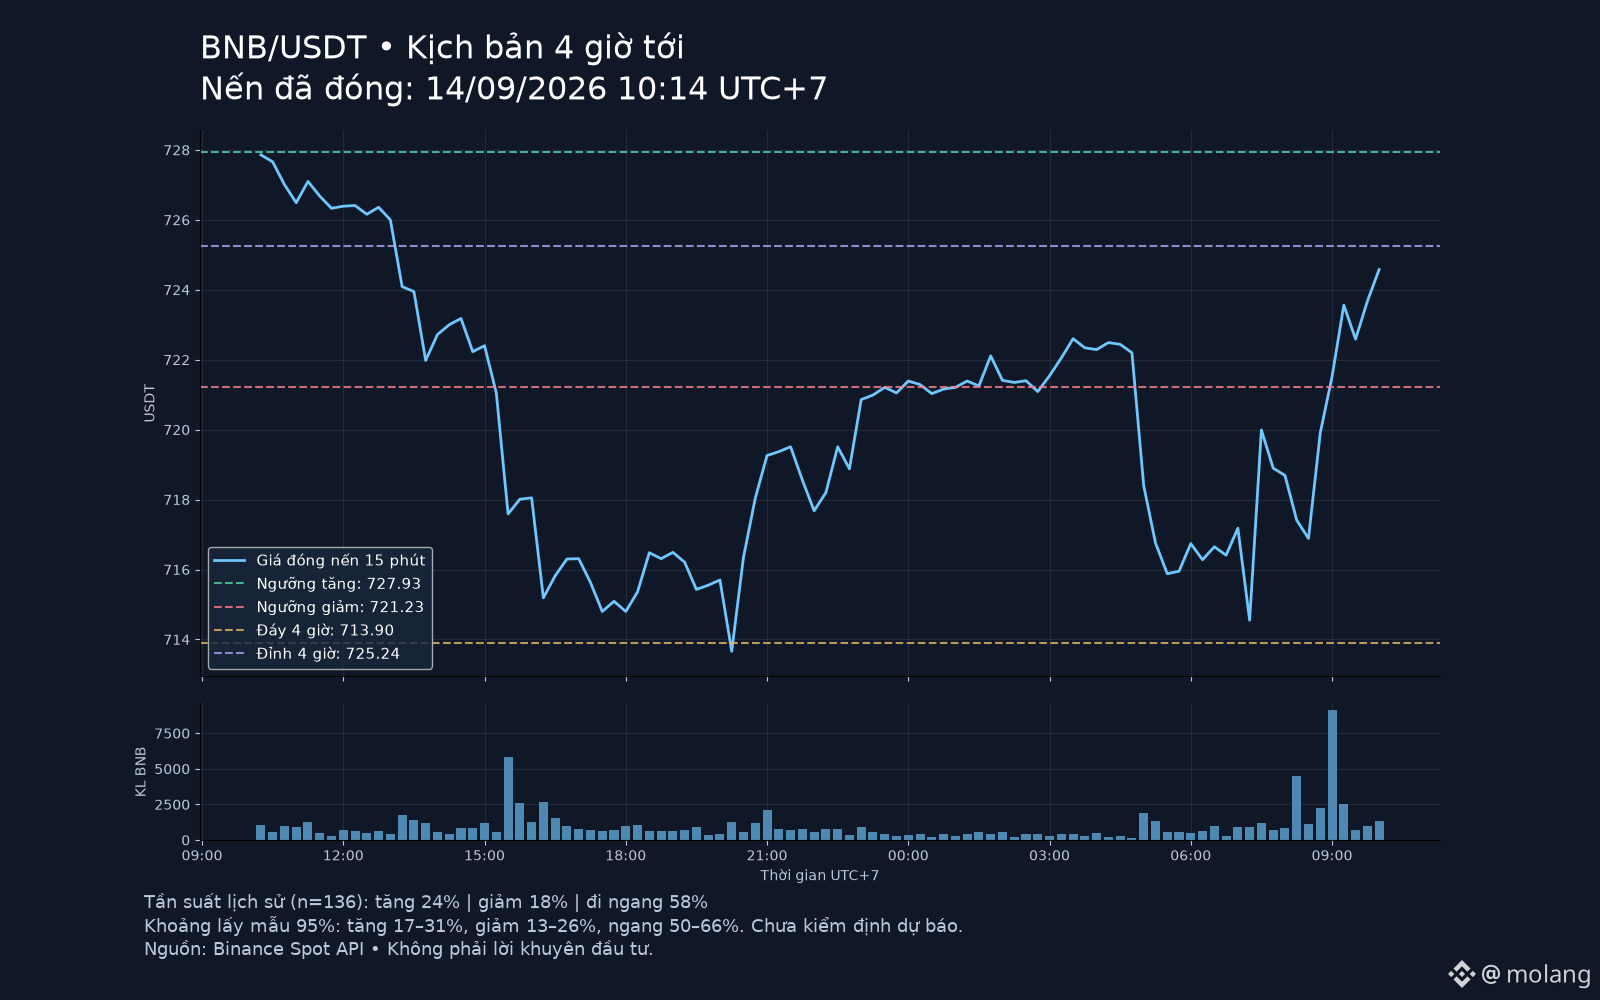
BNB spot at 10:14, 14/09 (UTC+7): 724.58 USDT, above the 1h EMA20 but close to the 4h EMA20 resistance at 724.66. The 15m volume is 0.84 times the average: not strong yet.
By 14:15, looking at the closing price:
• Up 24%: above 727.93. Break above 725.24 and hold it to keep the upward direction to 727.93; if it falls back below 725.24, it weakens.
• Sideways 58%: in the range 721.23–727.93. If the breakout border isn’t held, it still fits the scenario; if it holds outside the range, reassess.
• Down 18%: below 721.23. If you lose the level and the rebound fails, watch 713.90; if 721.23 is regained, that signals the bearish pressure is weakening.
The frequency comes from 136 historical samples—prediction hasn’t been verified, and it’s not a probability of winning trades. High leverage increases liquidation risk; plus fees and slippage.
Source: Binance Spot, 15m/1h/4h candle close.
#BNB
Not investment advice.
After a slope, you may not be sure you’ve reached the peak.
BNB spot at 10:14, 14/09 (UTC+7): 724.58 USDT, above the 1h EMA20 but close to the 4h EMA20 resistance at 724.66. The 15m volume is 0.84 times the average: not strong yet.
By 14:15, looking at the closing price:
• Up 24%: above 727.93. Break above 725.24 and hold it to keep the upward direction to 727.93; if it falls back below 725.24, it weakens.
• Sideways 58%: in the range 721.23–727.93. If the breakout border isn’t held, it still fits the scenario; if it holds outside the range, reassess.
• Down 18%: below 721.23. If you lose the level and the rebound fails, watch 713.90; if 721.23 is regained, that signals the bearish pressure is weakening.
The frequency comes from 136 historical samples—prediction hasn’t been verified, and it’s not a probability of winning trades. High leverage increases liquidation risk; plus fees and slippage.
Source: Binance Spot, 15m/1h/4h candle close.
#BNB
Not investment advice.
BNB spot at 10:14, 14/09 (UTC+7): 724.58 USDT, above the 1h EMA20 but close to the 4h EMA20 resistance at 724.66. The 15m volume is 0.84 times the average: not strong yet.
By 14:15, looking at the closing price:
• Up 24%: above 727.93. Break above 725.24 and hold it to keep the upward direction to 727.93; if it falls back below 725.24, it weakens.
• Sideways 58%: in the range 721.23–727.93. If the breakout border isn’t held, it still fits the scenario; if it holds outside the range, reassess.
• Down 18%: below 721.23. If you lose the level and the rebound fails, watch 713.90; if 721.23 is regained, that signals the bearish pressure is weakening.
The frequency comes from 136 historical samples—prediction hasn’t been verified, and it’s not a probability of winning trades. High leverage increases liquidation risk; plus fees and slippage.
Source: Binance Spot, 15m/1h/4h candle close.
#BNB
Not investment advice.
126
·
--
ETH at 2,500: reclaim this zone first, then we can talk about a breakout
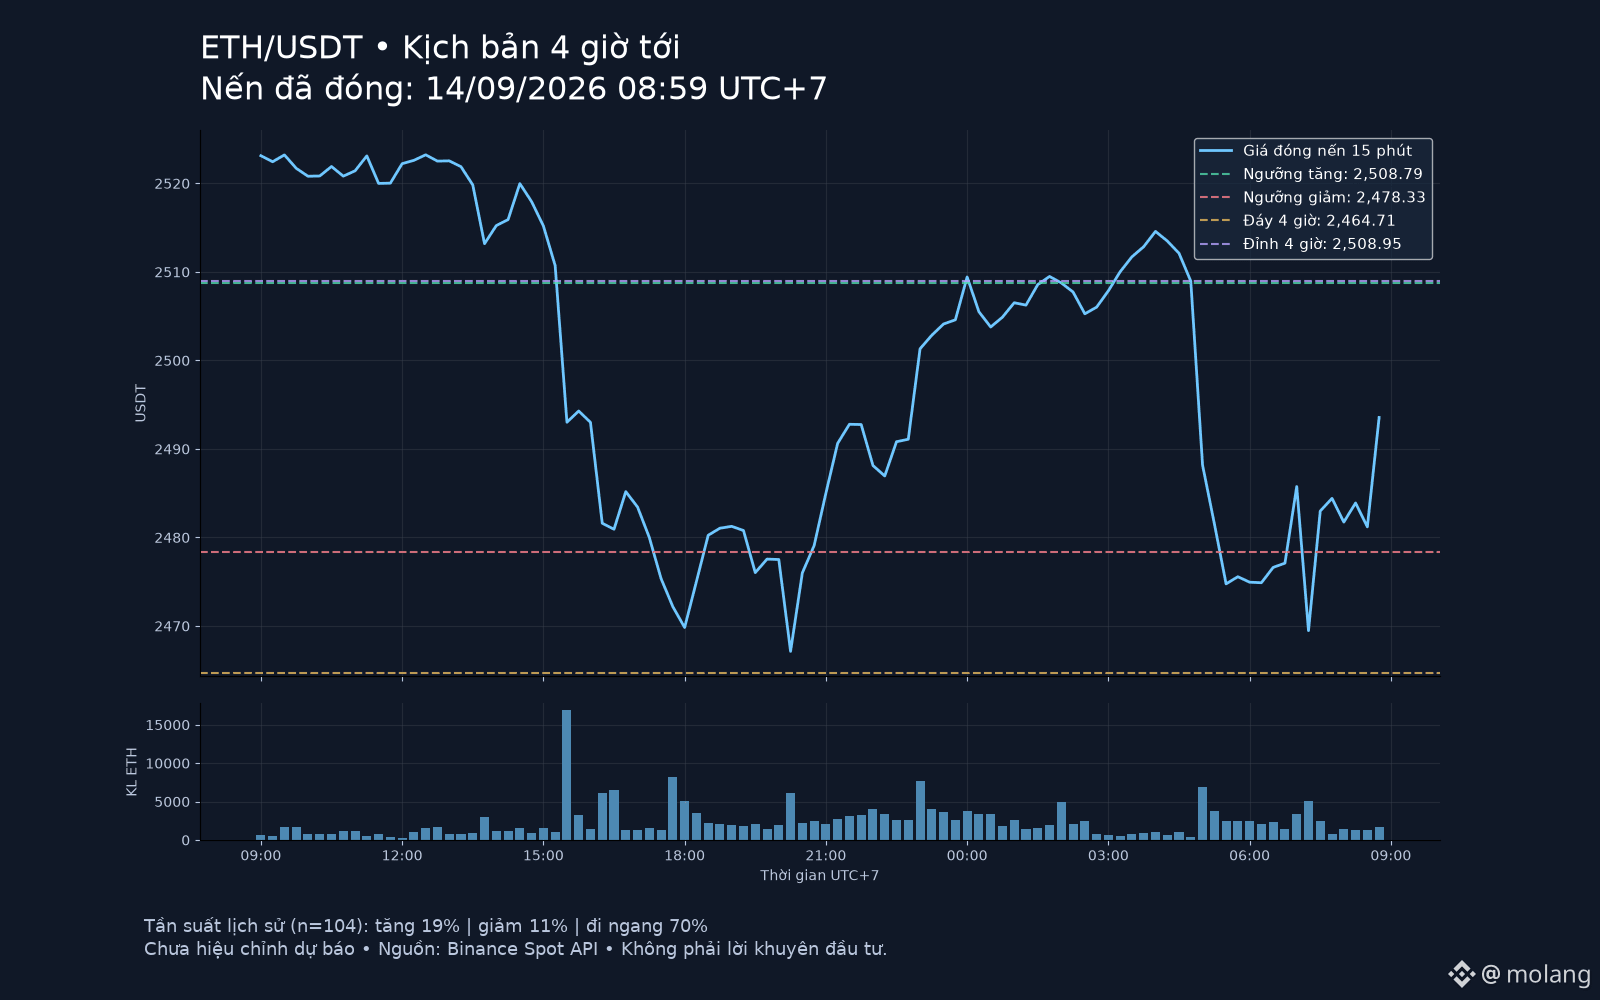
Candle at 08:59 on 14/09 (Vietnam time): ETH/USDT spot closed at 2,493.56, below the 1h EMA20 (2,497.60) and the 4h (2,500.95). The volume of the last 15-minute candle is only 0.78x the average of the previous 20 candles. I don’t yet see any notable participation force to justify going long immediately under this resistance zone.
Three scenarios up to around 13:00, categorized by FINAL PRICE, not by touching a level:
🟢 Up — ends above 2,508.79. Historical frequency 19%. Reclaim 2,501 and then break the 4-hour high 2,508.95, with a retest that holds, will strengthen the bullish move. Falling back below 2,501 would weaken the breakout idea. Note that the statistical threshold 2,508.79 is slightly below the previous high: meeting the “up” scenario doesn’t automatically mean a successful breakout.
🟡 Sideways — ends within 2,478.33–2,508.79. Frequency 70%. A move that breaks the boundary and then returns fits this scenario; if price stays outside the boundary, it needs to be reassessed. The 70% figure doesn’t mean price will remain fixed within the range for the next four hours.
🔴 Down — ends below 2,478.33. Frequency 11%. If this level is lost and price doesn’t reclaim it, the 4-hour bottom 2,464.71 will move into the watch zone. Reclaiming and holding above 2,478.33 would signal the bearish move is weakening.
Statistics use 104 non-overlapping 4h windows, from 03/08 to 14/09; filtered on the same-side relationship of price/EMA20 1h; each sample uses its own ±ATR14 1h bands. 95% sampling range: up 13–28%, down 6–18%, sideways 61–78%. This is not yet an adjusted forecast or a trade win-rate; the filter hasn’t accounted for all 4h states and volume conditions.
I prioritize waiting for confirmation. High leverage increases both potential losses and liquidation risk; fees and slippage must be accounted for separately.
Source: Binance Spot API, candles closed at 15m/1h/4h; unit: USDT.
#ETH #Ethereum
Not investment advice.
ETH at 2,500: reclaim this zone first, then we can talk about a breakout
Candle at 08:59 on 14/09 (Vietnam time): ETH/USDT spot closed at 2,493.56, below the 1h EMA20 (2,497.60) and the 4h (2,500.95). The volume of the last 15-minute candle is only 0.78x the average of the previous 20 candles. I don’t yet see any notable participation force to justify going long immediately under this resistance zone.
Three scenarios up to around 13:00, categorized by FINAL PRICE, not by touching a level:
🟢 Up — ends above 2,508.79. Historical frequency 19%. Reclaim 2,501 and then break the 4-hour high 2,508.95, with a retest that holds, will strengthen the bullish move. Falling back below 2,501 would weaken the breakout idea. Note that the statistical threshold 2,508.79 is slightly below the previous high: meeting the “up” scenario doesn’t automatically mean a successful breakout.
🟡 Sideways — ends within 2,478.33–2,508.79. Frequency 70%. A move that breaks the boundary and then returns fits this scenario; if price stays outside the boundary, it needs to be reassessed. The 70% figure doesn’t mean price will remain fixed within the range for the next four hours.
🔴 Down — ends below 2,478.33. Frequency 11%. If this level is lost and price doesn’t reclaim it, the 4-hour bottom 2,464.71 will move into the watch zone. Reclaiming and holding above 2,478.33 would signal the bearish move is weakening.
Statistics use 104 non-overlapping 4h windows, from 03/08 to 14/09; filtered on the same-side relationship of price/EMA20 1h; each sample uses its own ±ATR14 1h bands. 95% sampling range: up 13–28%, down 6–18%, sideways 61–78%. This is not yet an adjusted forecast or a trade win-rate; the filter hasn’t accounted for all 4h states and volume conditions.
I prioritize waiting for confirmation. High leverage increases both potential losses and liquidation risk; fees and slippage must be accounted for separately.
Source: Binance Spot API, candles closed at 15m/1h/4h; unit: USDT.
#ETH #Ethereum
Not investment advice.
Candle at 08:59 on 14/09 (Vietnam time): ETH/USDT spot closed at 2,493.56, below the 1h EMA20 (2,497.60) and the 4h (2,500.95). The volume of the last 15-minute candle is only 0.78x the average of the previous 20 candles. I don’t yet see any notable participation force to justify going long immediately under this resistance zone.
Three scenarios up to around 13:00, categorized by FINAL PRICE, not by touching a level:
🟢 Up — ends above 2,508.79. Historical frequency 19%. Reclaim 2,501 and then break the 4-hour high 2,508.95, with a retest that holds, will strengthen the bullish move. Falling back below 2,501 would weaken the breakout idea. Note that the statistical threshold 2,508.79 is slightly below the previous high: meeting the “up” scenario doesn’t automatically mean a successful breakout.
🟡 Sideways — ends within 2,478.33–2,508.79. Frequency 70%. A move that breaks the boundary and then returns fits this scenario; if price stays outside the boundary, it needs to be reassessed. The 70% figure doesn’t mean price will remain fixed within the range for the next four hours.
🔴 Down — ends below 2,478.33. Frequency 11%. If this level is lost and price doesn’t reclaim it, the 4-hour bottom 2,464.71 will move into the watch zone. Reclaiming and holding above 2,478.33 would signal the bearish move is weakening.
Statistics use 104 non-overlapping 4h windows, from 03/08 to 14/09; filtered on the same-side relationship of price/EMA20 1h; each sample uses its own ±ATR14 1h bands. 95% sampling range: up 13–28%, down 6–18%, sideways 61–78%. This is not yet an adjusted forecast or a trade win-rate; the filter hasn’t accounted for all 4h states and volume conditions.
I prioritize waiting for confirmation. High leverage increases both potential losses and liquidation risk; fees and slippage must be accounted for separately.
Source: Binance Spot API, candles closed at 15m/1h/4h; unit: USDT.
#ETH #Ethereum
Not investment advice.
480
·
--
BTC rebounds to 76,808: it bounced, but hasn’t regained the trend
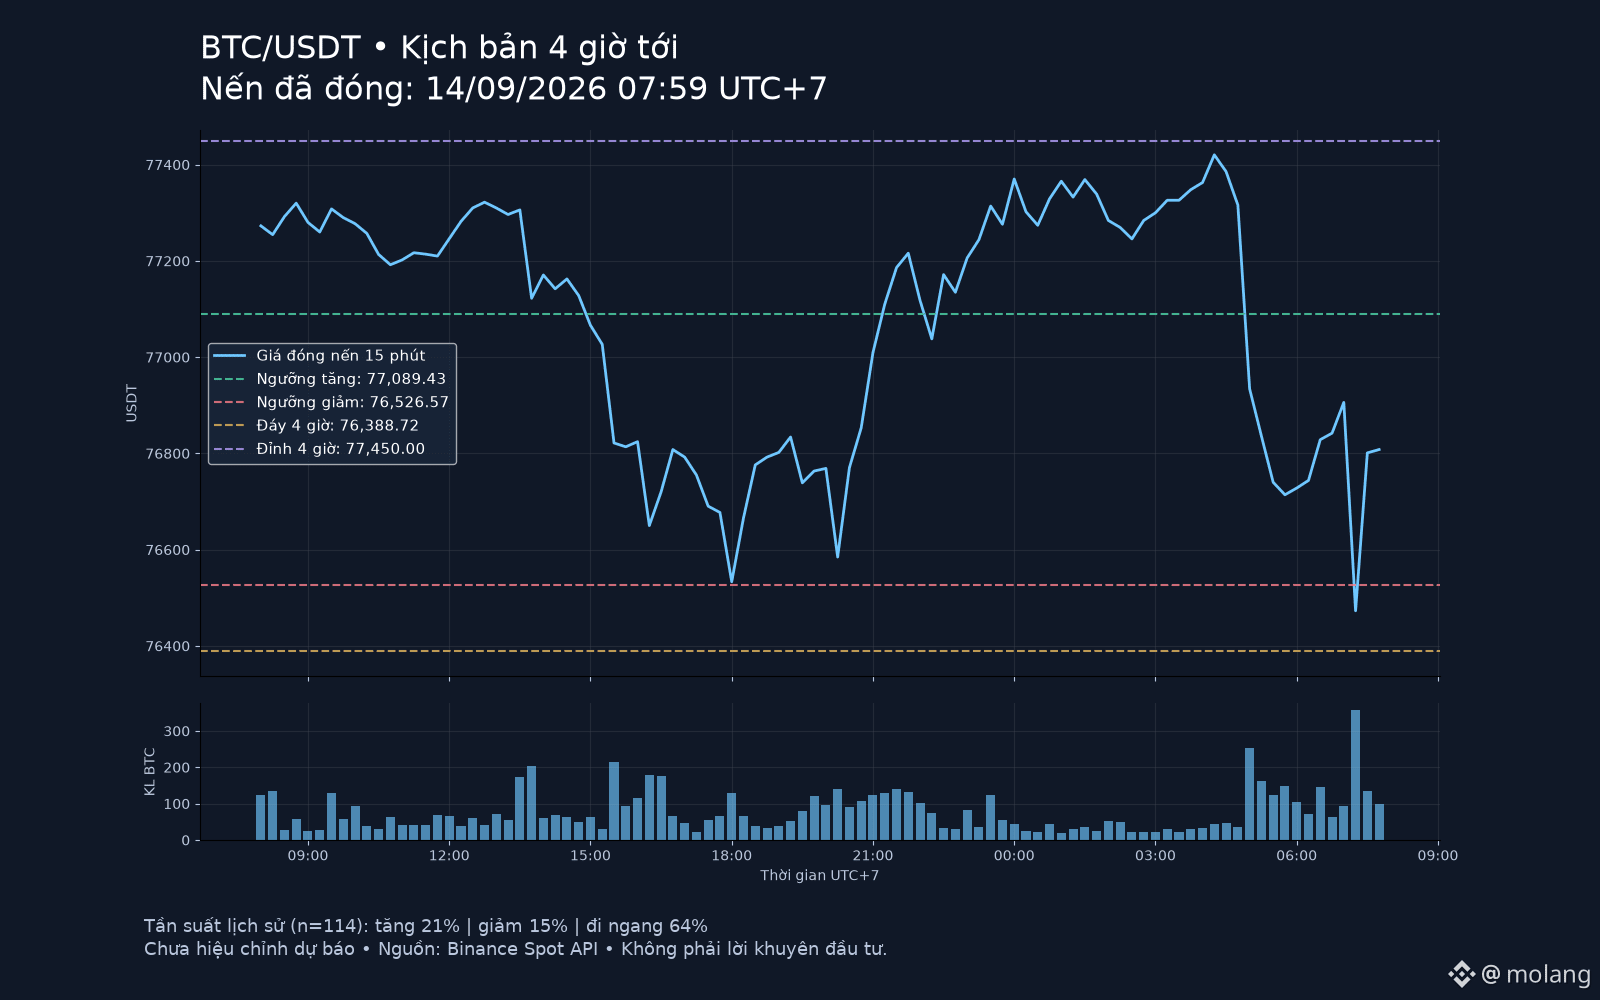
Candle at 07:59 on 14/09, Vietnam time: BTC/USDT spot at 76,808, below the 1h EMA20 (77,077.80) and 4h (77,332.70). The volume of the last 15-minute candle is 1.03x the average of the previous 20 candles—not stand-out. I want to see the price hold the resistance zone, not just a green bounce.
Three scenarios up to around 12:00, classified by the END-OF-PERIOD PRICE, not by touching specific levels:
🟢 Up: ends above 77,089.43. Historical frequency: 21%. A 15-minute close that breaks above the 77,078–77,089 zone, then holds on retest, would strengthen the rebound leg; the next watch zones are 77,333 and the 4-hour high at 77,450. Dropping back below 77,078 weakens the breakout signal.
🟡 Sideways: ends within 76,526.57–77,089.43. Frequency: 64%. Breakout attempts that can’t hold fit this scenario; if price remains outside the bands, it must be reassessed. “Sideways” here can still involve strong chop within the period.
🔴 Down: ends below 76,526.57. Frequency: 15%. If this level is lost and the price bounces without reclaiming it, the 4-hour low of 76,388.72 would come into the watch zone. Reclaiming and holding above 76,526.57 would weaken the bearish “break the low” scenario.
The ratios are taken from 114 non-overlapping 4h windows, from 03/08–14/09, filtered on the same side relative to price/1h EMA20; each sample uses its own ±ATR14 1h band. The sample coverage for 95% corresponds to: up 15–29%, down 10–23%, sideways 55–72%. This is not yet a checked/validated forecast probability; the filter hasn’t fully reflected the current 4h state and the current volume.
I don’t want to chase a long below the two moving-average lines. High leverage still carries liquidation risk; fees and slippage could wipe out the small edge.
Source: Binance Spot API, candles closed at 15m/1h/4h; unit is USDT.
#BTC #Bitcoin
Not investment advice.
BTC rebounds to 76,808: it bounced, but hasn’t regained the trend
Candle at 07:59 on 14/09, Vietnam time: BTC/USDT spot at 76,808, below the 1h EMA20 (77,077.80) and 4h (77,332.70). The volume of the last 15-minute candle is 1.03x the average of the previous 20 candles—not stand-out. I want to see the price hold the resistance zone, not just a green bounce.
Three scenarios up to around 12:00, classified by the END-OF-PERIOD PRICE, not by touching specific levels:
🟢 Up: ends above 77,089.43. Historical frequency: 21%. A 15-minute close that breaks above the 77,078–77,089 zone, then holds on retest, would strengthen the rebound leg; the next watch zones are 77,333 and the 4-hour high at 77,450. Dropping back below 77,078 weakens the breakout signal.
🟡 Sideways: ends within 76,526.57–77,089.43. Frequency: 64%. Breakout attempts that can’t hold fit this scenario; if price remains outside the bands, it must be reassessed. “Sideways” here can still involve strong chop within the period.
🔴 Down: ends below 76,526.57. Frequency: 15%. If this level is lost and the price bounces without reclaiming it, the 4-hour low of 76,388.72 would come into the watch zone. Reclaiming and holding above 76,526.57 would weaken the bearish “break the low” scenario.
The ratios are taken from 114 non-overlapping 4h windows, from 03/08–14/09, filtered on the same side relative to price/1h EMA20; each sample uses its own ±ATR14 1h band. The sample coverage for 95% corresponds to: up 15–29%, down 10–23%, sideways 55–72%. This is not yet a checked/validated forecast probability; the filter hasn’t fully reflected the current 4h state and the current volume.
I don’t want to chase a long below the two moving-average lines. High leverage still carries liquidation risk; fees and slippage could wipe out the small edge.
Source: Binance Spot API, candles closed at 15m/1h/4h; unit is USDT.
#BTC #Bitcoin
Not investment advice.
Candle at 07:59 on 14/09, Vietnam time: BTC/USDT spot at 76,808, below the 1h EMA20 (77,077.80) and 4h (77,332.70). The volume of the last 15-minute candle is 1.03x the average of the previous 20 candles—not stand-out. I want to see the price hold the resistance zone, not just a green bounce.
Three scenarios up to around 12:00, classified by the END-OF-PERIOD PRICE, not by touching specific levels:
🟢 Up: ends above 77,089.43. Historical frequency: 21%. A 15-minute close that breaks above the 77,078–77,089 zone, then holds on retest, would strengthen the rebound leg; the next watch zones are 77,333 and the 4-hour high at 77,450. Dropping back below 77,078 weakens the breakout signal.
🟡 Sideways: ends within 76,526.57–77,089.43. Frequency: 64%. Breakout attempts that can’t hold fit this scenario; if price remains outside the bands, it must be reassessed. “Sideways” here can still involve strong chop within the period.
🔴 Down: ends below 76,526.57. Frequency: 15%. If this level is lost and the price bounces without reclaiming it, the 4-hour low of 76,388.72 would come into the watch zone. Reclaiming and holding above 76,526.57 would weaken the bearish “break the low” scenario.
The ratios are taken from 114 non-overlapping 4h windows, from 03/08–14/09, filtered on the same side relative to price/1h EMA20; each sample uses its own ±ATR14 1h band. The sample coverage for 95% corresponds to: up 15–29%, down 10–23%, sideways 55–72%. This is not yet a checked/validated forecast probability; the filter hasn’t fully reflected the current 4h state and the current volume.
I don’t want to chase a long below the two moving-average lines. High leverage still carries liquidation risk; fees and slippage could wipe out the small edge.
Source: Binance Spot API, candles closed at 15m/1h/4h; unit is USDT.
#BTC #Bitcoin
Not investment advice.
330
·
--
ETH bounces at 2,501: is it truly strong or just regaining some breath?
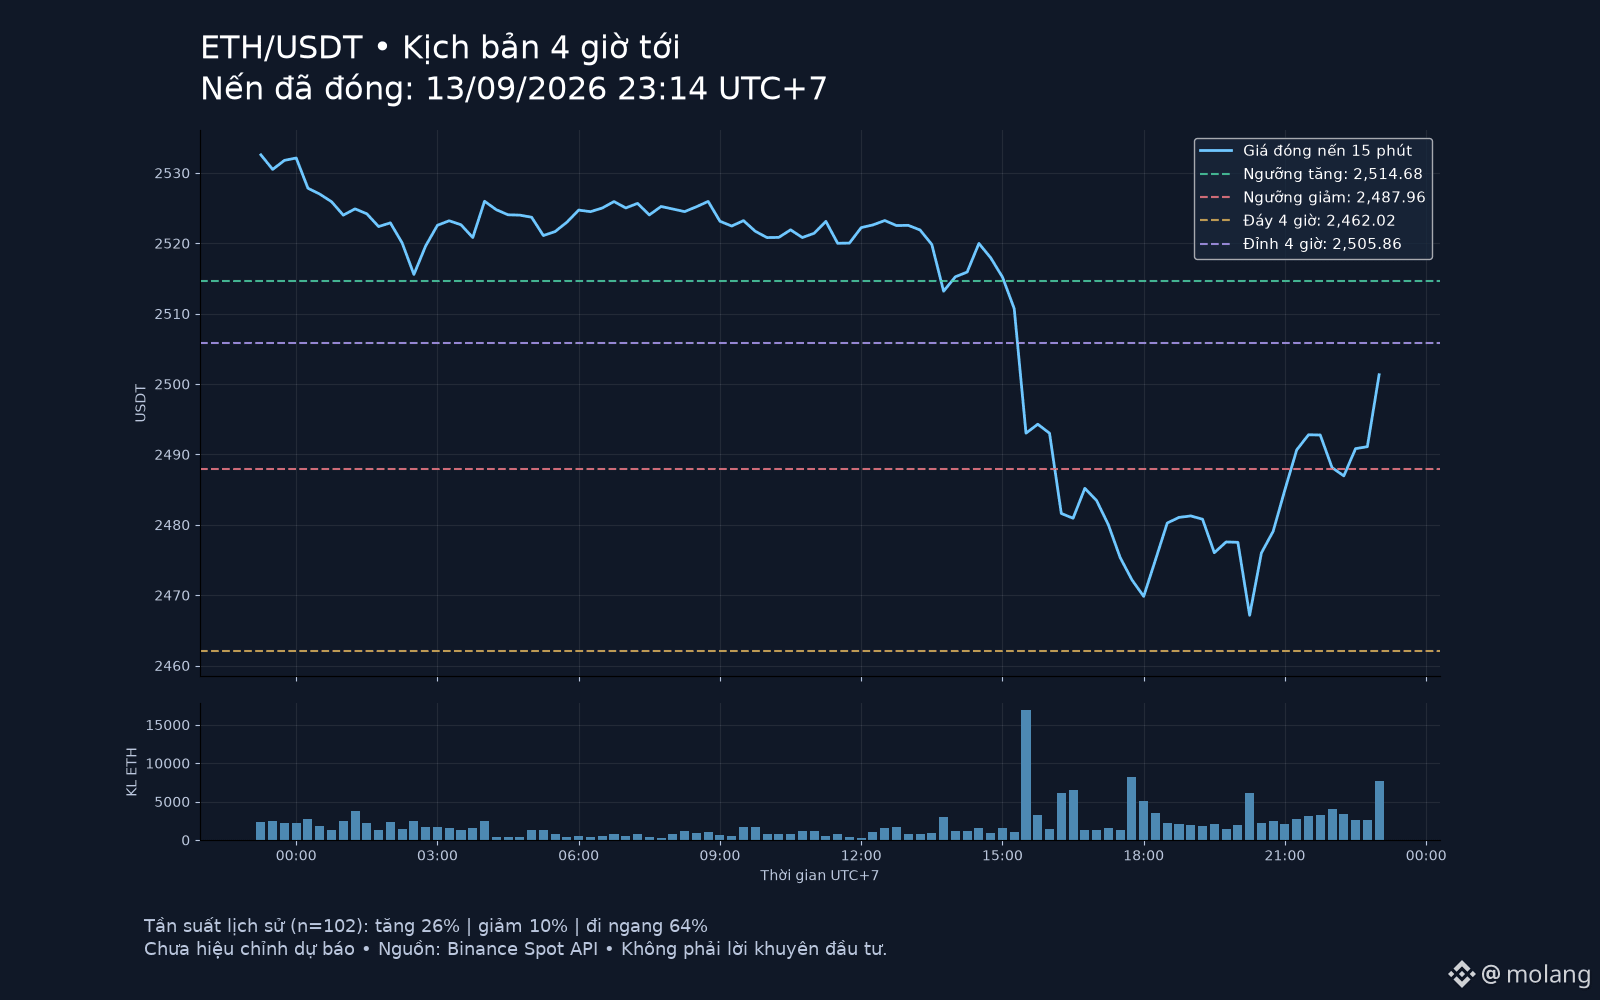
Bro, looking at this rebound you’d easily feel like chasing. But at the 23:14 candle on 13/09 (UTC+7), ETH/USDT Spot is at 2,501.32 — close to the 1h EMA20 at 2,501.63 and the 4h EMA20 at 2,503.19. I see this as the zone that needs confirmation; there isn’t enough to conclude a reversal yet. Nearest 4-hour high–low range: 2,462.02–2,505.86.
I break down the outcomes around 03:15 on 14/09 into three scenarios, based on the ENDING PRICE, not just touching a level:
🟢 Up — close above 2,514.68. Reference frequency: 26%. Breaking above 2,505.86 and then holding it upon re-check will strengthen the bounce; 2,514.68 is the next level to surpass. Falling back below 2,501 would weaken the “break-through resistance” signal.
🟡 Sideways — end between 2,487.96–2,514.68. Frequency: 64%. If the breakouts on both sides of the range can’t hold, I’d lean toward waiting instead of chasing price. Candle close and staying outside the range would require reassessing this scenario.
🔴 Down — close below 2,487.96. Frequency: 10%. Losing this zone and then bouncing up without reclaiming it will reinforce the bearish side; 2,462.02 is the area to watch, not a guaranteed target. Reclaiming and holding above 2,487.96 would weaken the bearish signal.
These ratios are derived from 102 non-overlapping 4h windows between 03/08–13/09, filtered by the same side of price/1h EMA20. Each sample uses that sample’s own 1h ATR14 ± bands. Sampling error at 95% is approximately: up 19–36%, down 5–17%, sideways 54–72%; this does not include the risk of a market regime change. This is historical frequency only; it has not been validated for out-of-sample prediction or win-rate.
I don’t see a reason to chase a long just because the candle is green. With high leverage, fees, slippage, and liquidation can still ruin an otherwise correct idea.
Source: Binance Spot API ETHUSDT, candles closed 15m/1h/4h. The attached chart shows the actual price; the horizontal lines are the levels to watch.
#ETH #Ethereum
Not investment advice.
ETH bounces at 2,501: is it truly strong or just regaining some breath?
Bro, looking at this rebound you’d easily feel like chasing. But at the 23:14 candle on 13/09 (UTC+7), ETH/USDT Spot is at 2,501.32 — close to the 1h EMA20 at 2,501.63 and the 4h EMA20 at 2,503.19. I see this as the zone that needs confirmation; there isn’t enough to conclude a reversal yet. Nearest 4-hour high–low range: 2,462.02–2,505.86.
I break down the outcomes around 03:15 on 14/09 into three scenarios, based on the ENDING PRICE, not just touching a level:
🟢 Up — close above 2,514.68. Reference frequency: 26%. Breaking above 2,505.86 and then holding it upon re-check will strengthen the bounce; 2,514.68 is the next level to surpass. Falling back below 2,501 would weaken the “break-through resistance” signal.
🟡 Sideways — end between 2,487.96–2,514.68. Frequency: 64%. If the breakouts on both sides of the range can’t hold, I’d lean toward waiting instead of chasing price. Candle close and staying outside the range would require reassessing this scenario.
🔴 Down — close below 2,487.96. Frequency: 10%. Losing this zone and then bouncing up without reclaiming it will reinforce the bearish side; 2,462.02 is the area to watch, not a guaranteed target. Reclaiming and holding above 2,487.96 would weaken the bearish signal.
These ratios are derived from 102 non-overlapping 4h windows between 03/08–13/09, filtered by the same side of price/1h EMA20. Each sample uses that sample’s own 1h ATR14 ± bands. Sampling error at 95% is approximately: up 19–36%, down 5–17%, sideways 54–72%; this does not include the risk of a market regime change. This is historical frequency only; it has not been validated for out-of-sample prediction or win-rate.
I don’t see a reason to chase a long just because the candle is green. With high leverage, fees, slippage, and liquidation can still ruin an otherwise correct idea.
Source: Binance Spot API ETHUSDT, candles closed 15m/1h/4h. The attached chart shows the actual price; the horizontal lines are the levels to watch.
#ETH #Ethereum
Not investment advice.
Bro, looking at this rebound you’d easily feel like chasing. But at the 23:14 candle on 13/09 (UTC+7), ETH/USDT Spot is at 2,501.32 — close to the 1h EMA20 at 2,501.63 and the 4h EMA20 at 2,503.19. I see this as the zone that needs confirmation; there isn’t enough to conclude a reversal yet. Nearest 4-hour high–low range: 2,462.02–2,505.86.
I break down the outcomes around 03:15 on 14/09 into three scenarios, based on the ENDING PRICE, not just touching a level:
🟢 Up — close above 2,514.68. Reference frequency: 26%. Breaking above 2,505.86 and then holding it upon re-check will strengthen the bounce; 2,514.68 is the next level to surpass. Falling back below 2,501 would weaken the “break-through resistance” signal.
🟡 Sideways — end between 2,487.96–2,514.68. Frequency: 64%. If the breakouts on both sides of the range can’t hold, I’d lean toward waiting instead of chasing price. Candle close and staying outside the range would require reassessing this scenario.
🔴 Down — close below 2,487.96. Frequency: 10%. Losing this zone and then bouncing up without reclaiming it will reinforce the bearish side; 2,462.02 is the area to watch, not a guaranteed target. Reclaiming and holding above 2,487.96 would weaken the bearish signal.
These ratios are derived from 102 non-overlapping 4h windows between 03/08–13/09, filtered by the same side of price/1h EMA20. Each sample uses that sample’s own 1h ATR14 ± bands. Sampling error at 95% is approximately: up 19–36%, down 5–17%, sideways 54–72%; this does not include the risk of a market regime change. This is historical frequency only; it has not been validated for out-of-sample prediction or win-rate.
I don’t see a reason to chase a long just because the candle is green. With high leverage, fees, slippage, and liquidation can still ruin an otherwise correct idea.
Source: Binance Spot API ETHUSDT, candles closed 15m/1h/4h. The attached chart shows the actual price; the horizontal lines are the levels to watch.
#ETH #Ethereum
Not investment advice.
186
·
--
BTC — Don’t let a single green candle make you rush
Brothers, have you ever seen BTC pump and immediately felt like you wanted to go long? For me, one green candle isn’t enough to call it a trend change. The way I want to check is to look at the 1-hour timeframe first, then see whether the 15-minute candle can break above the most recent nearby high and hold when price comes back.
If it just broke out and then drops back below that zone right away, then the buy scenario needs to be reconsidered. If the price already ran away, then it is what it is—you don’t necessarily have to chase. High leverage means that even a small opposite move can make losses on your margin increase very fast.
This version doesn’t have live candle data to confirm the exact price zone yet, so I’m only sharing how to observe.
#BTC #Bitcoin
Not investment advice.
BTC — Don’t let a single green candle make you rush
Brothers, have you ever seen BTC pump and immediately felt like you wanted to go long? For me, one green candle isn’t enough to call it a trend change. The way I want to check is to look at the 1-hour timeframe first, then see whether the 15-minute candle can break above the most recent nearby high and hold when price comes back.
If it just broke out and then drops back below that zone right away, then the buy scenario needs to be reconsidered. If the price already ran away, then it is what it is—you don’t necessarily have to chase. High leverage means that even a small opposite move can make losses on your margin increase very fast.
This version doesn’t have live candle data to confirm the exact price zone yet, so I’m only sharing how to observe.
#BTC #Bitcoin
Not investment advice.
Brothers, have you ever seen BTC pump and immediately felt like you wanted to go long? For me, one green candle isn’t enough to call it a trend change. The way I want to check is to look at the 1-hour timeframe first, then see whether the 15-minute candle can break above the most recent nearby high and hold when price comes back.
If it just broke out and then drops back below that zone right away, then the buy scenario needs to be reconsidered. If the price already ran away, then it is what it is—you don’t necessarily have to chase. High leverage means that even a small opposite move can make losses on your margin increase very fast.
This version doesn’t have live candle data to confirm the exact price zone yet, so I’m only sharing how to observe.
#BTC #Bitcoin
Not investment advice.
686
·
--
BTC H4 - 13/09
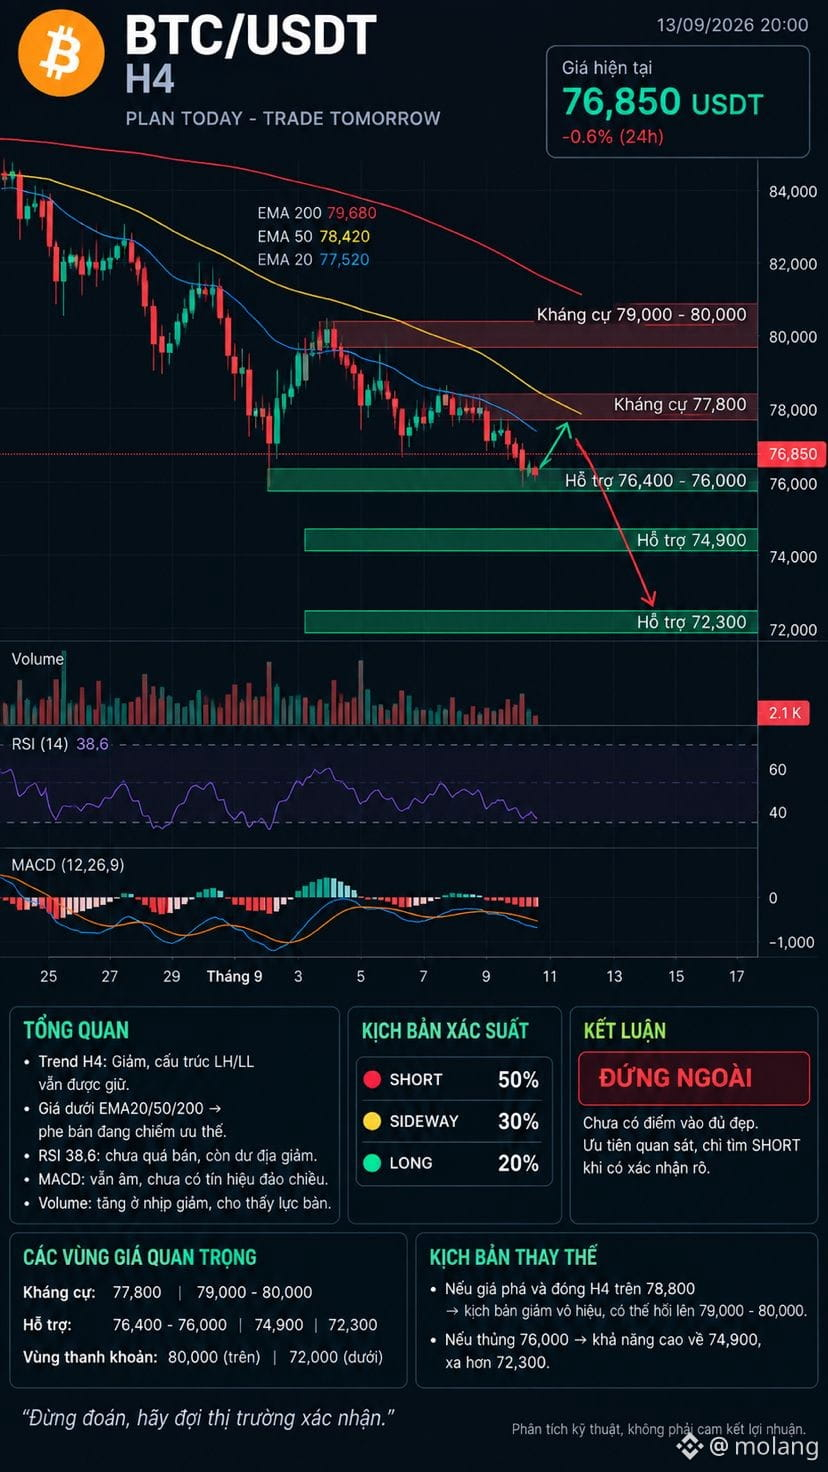
BTC around 76.8k. H4 is still slanting downward; the LH/LL structure has not been broken. Price is currently below EMA20 ~77.0k, EMA50 ~77.26k, EMA200 ~78.06k. RSI 38.8, MACD -135.9, and selling pressure still dominates.
Probability: 🔴 SHORT 50% | 🟡 SIDEWAY 30% | 🟢 LONG 20%
Conclusion: STAND ASIDE, wait for SHORT.
A better setup is to wait for a retracement to 77.050-77.250; only consider SHORT after a rejection candle forms. SL 77.600 | TP1 76.250 | TP2 75.500 | TP3 74.500. R:R is from about 1:2 or higher.
If H4 closes above 77.800, skip the SHORT setup. If it breaks through 76.400-76.000, the chance of further continuation down to a lower area increases significantly. Current price and the day’s range are also indicating that 76.4k is a nearby support level that needs to be held.
When the trend is down, don’t rush to catch the falling knife. Wait for it to bounce, then decide.
Technical analysis only, not a commitment to profits.
BTC H4 - 13/09
BTC around 76.8k. H4 is still slanting downward; the LH/LL structure has not been broken. Price is currently below EMA20 ~77.0k, EMA50 ~77.26k, EMA200 ~78.06k. RSI 38.8, MACD -135.9, and selling pressure still dominates.
Probability: 🔴 SHORT 50% | 🟡 SIDEWAY 30% | 🟢 LONG 20%
Conclusion: STAND ASIDE, wait for SHORT.
A better setup is to wait for a retracement to 77.050-77.250; only consider SHORT after a rejection candle forms. SL 77.600 | TP1 76.250 | TP2 75.500 | TP3 74.500. R:R is from about 1:2 or higher.
If H4 closes above 77.800, skip the SHORT setup. If it breaks through 76.400-76.000, the chance of further continuation down to a lower area increases significantly. Current price and the day’s range are also indicating that 76.4k is a nearby support level that needs to be held.
When the trend is down, don’t rush to catch the falling knife. Wait for it to bounce, then decide.
Technical analysis only, not a commitment to profits.
BTC around 76.8k. H4 is still slanting downward; the LH/LL structure has not been broken. Price is currently below EMA20 ~77.0k, EMA50 ~77.26k, EMA200 ~78.06k. RSI 38.8, MACD -135.9, and selling pressure still dominates.
Probability: 🔴 SHORT 50% | 🟡 SIDEWAY 30% | 🟢 LONG 20%
Conclusion: STAND ASIDE, wait for SHORT.
A better setup is to wait for a retracement to 77.050-77.250; only consider SHORT after a rejection candle forms. SL 77.600 | TP1 76.250 | TP2 75.500 | TP3 74.500. R:R is from about 1:2 or higher.
If H4 closes above 77.800, skip the SHORT setup. If it breaks through 76.400-76.000, the chance of further continuation down to a lower area increases significantly. Current price and the day’s range are also indicating that 76.4k is a nearby support level that needs to be held.
When the trend is down, don’t rush to catch the falling knife. Wait for it to bounce, then decide.
Technical analysis only, not a commitment to profits.
236
·
--
Bullish
CRYPTO TOP 12/09
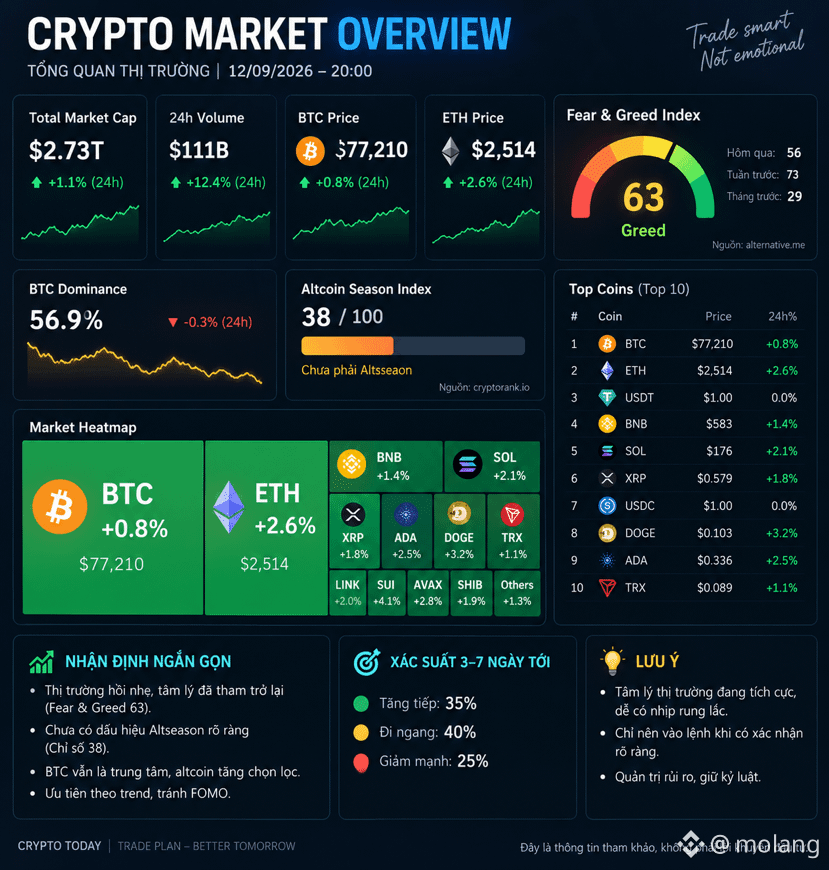
😏 Fear & Greed: 63 - Greed
₿ BTC: ~77.2k
💰 BTC.D: 56.9%
🔥 Altcoin Season: 38/100 - no Altseason yet
Market sentiment is turning back to greed, but the money hasn’t spread strongly into Altcoins yet.
Probability for the next 3-7 days:
🟢 Up: 35%
🟡 Sideways/choppy: 40%
🔴 Sharp drop: 25%
Viewpoint: No FOMO yet. BTC is still the driver; Alt should only pick the strongest to trade.
Reference analysis, not investment advice.
CRYPTO TOP 12/09
😏 Fear & Greed: 63 - Greed
₿ BTC: ~77.2k
💰 BTC.D: 56.9%
🔥 Altcoin Season: 38/100 - no Altseason yet
Market sentiment is turning back to greed, but the money hasn’t spread strongly into Altcoins yet.
Probability for the next 3-7 days:
🟢 Up: 35%
🟡 Sideways/choppy: 40%
🔴 Sharp drop: 25%
Viewpoint: No FOMO yet. BTC is still the driver; Alt should only pick the strongest to trade.
Reference analysis, not investment advice.
😏 Fear & Greed: 63 - Greed
₿ BTC: ~77.2k
💰 BTC.D: 56.9%
🔥 Altcoin Season: 38/100 - no Altseason yet
Market sentiment is turning back to greed, but the money hasn’t spread strongly into Altcoins yet.
Probability for the next 3-7 days:
🟢 Up: 35%
🟡 Sideways/choppy: 40%
🔴 Sharp drop: 25%
Viewpoint: No FOMO yet. BTC is still the driver; Alt should only pick the strongest to trade.
Reference analysis, not investment advice.
411
·
--
BTC H4 TILL 12/09
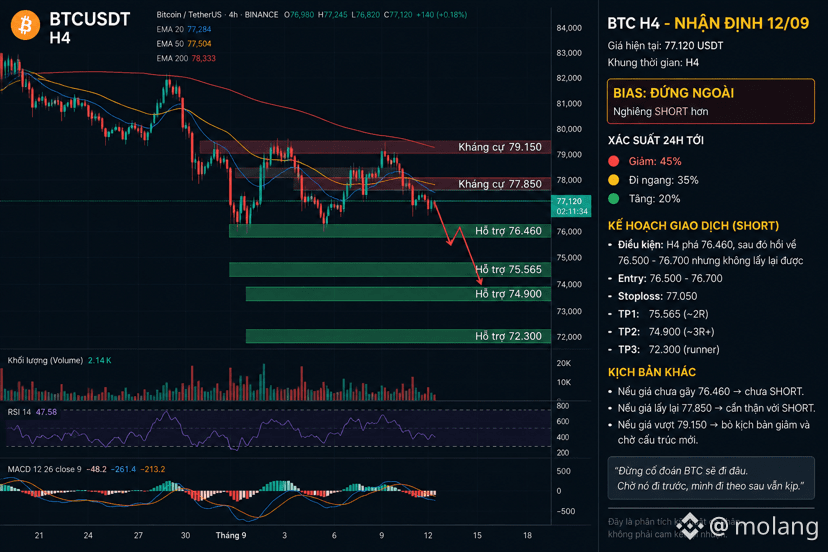
BTC is currently around 77,000 - 77,200 USD.
My view right now: STAND ASIDE, but leaning more towards SHORT.
The H4 timeframe is still rather weak. Price is below key EMA lines, MACD is still negative, and RSI hasn’t fallen into oversold territory yet. In simple terms, the selling side is still slightly stronger—but a SHORT right around 77k isn’t ideal because there is support below.
My probability assessment for the next 24h:
🔴 Down: 45%
🟡 Sideways: 35%
🟢 Up: 20%
The level I care about most is 76,460.
If H4 breaks 76,460, then rebounds back to the 76,500 - 76,700 area but fails to reclaim it, then I’ll consider taking a SHORT.
Entry: 76,500 - 76,700
SL: 77,050
TP1: 75,565
TP2: 74,900
TP3: 72,300
This setup prioritizes trading with the trend; R:R is around 1:2 or higher. If BTC moves strongly, let TP3 run as a runner—no need to close everything too early.
On the other hand, if BTC reclaims 77,850, then be careful with SHORT. If it breaks above 79,150, I’ll completely abandon the bearish scenario and wait for a new structure.
In summary:
Not broken 76,460 → still no SHORT.
Break + failed retest → look for SHORT.
Above 79,150 → abandon the SHORT setup.
Don’t try to predict where BTC will go. Let it move first, and you can follow—still not too late.
This is my personal technical analysis perspective, not a commitment of profit.
BTC H4 TILL 12/09
BTC is currently around 77,000 - 77,200 USD.
My view right now: STAND ASIDE, but leaning more towards SHORT.
The H4 timeframe is still rather weak. Price is below key EMA lines, MACD is still negative, and RSI hasn’t fallen into oversold territory yet. In simple terms, the selling side is still slightly stronger—but a SHORT right around 77k isn’t ideal because there is support below.
My probability assessment for the next 24h:
🔴 Down: 45%
🟡 Sideways: 35%
🟢 Up: 20%
The level I care about most is 76,460.
If H4 breaks 76,460, then rebounds back to the 76,500 - 76,700 area but fails to reclaim it, then I’ll consider taking a SHORT.
Entry: 76,500 - 76,700
SL: 77,050
TP1: 75,565
TP2: 74,900
TP3: 72,300
This setup prioritizes trading with the trend; R:R is around 1:2 or higher. If BTC moves strongly, let TP3 run as a runner—no need to close everything too early.
On the other hand, if BTC reclaims 77,850, then be careful with SHORT. If it breaks above 79,150, I’ll completely abandon the bearish scenario and wait for a new structure.
In summary:
Not broken 76,460 → still no SHORT.
Break + failed retest → look for SHORT.
Above 79,150 → abandon the SHORT setup.
Don’t try to predict where BTC will go. Let it move first, and you can follow—still not too late.
This is my personal technical analysis perspective, not a commitment of profit.
BTC is currently around 77,000 - 77,200 USD.
My view right now: STAND ASIDE, but leaning more towards SHORT.
The H4 timeframe is still rather weak. Price is below key EMA lines, MACD is still negative, and RSI hasn’t fallen into oversold territory yet. In simple terms, the selling side is still slightly stronger—but a SHORT right around 77k isn’t ideal because there is support below.
My probability assessment for the next 24h:
🔴 Down: 45%
🟡 Sideways: 35%
🟢 Up: 20%
The level I care about most is 76,460.
If H4 breaks 76,460, then rebounds back to the 76,500 - 76,700 area but fails to reclaim it, then I’ll consider taking a SHORT.
Entry: 76,500 - 76,700
SL: 77,050
TP1: 75,565
TP2: 74,900
TP3: 72,300
This setup prioritizes trading with the trend; R:R is around 1:2 or higher. If BTC moves strongly, let TP3 run as a runner—no need to close everything too early.
On the other hand, if BTC reclaims 77,850, then be careful with SHORT. If it breaks above 79,150, I’ll completely abandon the bearish scenario and wait for a new structure.
In summary:
Not broken 76,460 → still no SHORT.
Break + failed retest → look for SHORT.
Above 79,150 → abandon the SHORT setup.
Don’t try to predict where BTC will go. Let it move first, and you can follow—still not too late.
This is my personal technical analysis perspective, not a commitment of profit.
764
·
--
Binance’s introduction of products related to U.S. securities on its platform is a major step forward, making it easier for crypto investors to access the traditional financial market.
This shows that the boundary between crypto and traditional finance is becoming increasingly blurred. In the future, capital flows may be able to move more flexibly between the two markets, opening up many opportunities but also bringing with it significant risks.
Binance’s introduction of products related to U.S. securities on its platform is a major step forward, making it easier for crypto investors to access the traditional financial market.
This shows that the boundary between crypto and traditional finance is becoming increasingly blurred. In the future, capital flows may be able to move more flexibly between the two markets, opening up many opportunities but also bringing with it significant risks.
This shows that the boundary between crypto and traditional finance is becoming increasingly blurred. In the future, capital flows may be able to move more flexibly between the two markets, opening up many opportunities but also bringing with it significant risks.
57
·
--
In investing, being wrong isn’t what’s scary—being stubborn is.
The market doesn’t care what you think, and it doesn’t run on anyone’s emotions. When you already have data and signals showing you’re wrong, what you need to do is to accept it, adjust, or stop.
Many people don’t lose money because they choose incorrectly; they lose everything because they’re too stubborn—refusing to change and always trying to prove they’re right.
Remember: stubbornness can make you lose everything, but knowing how to admit you’re wrong helps you last long enough to wait for the next opportunity. #btc #ETH #GRAM
In investing, being wrong isn’t what’s scary—being stubborn is.
The market doesn’t care what you think, and it doesn’t run on anyone’s emotions. When you already have data and signals showing you’re wrong, what you need to do is to accept it, adjust, or stop.
Many people don’t lose money because they choose incorrectly; they lose everything because they’re too stubborn—refusing to change and always trying to prove they’re right.
Remember: stubbornness can make you lose everything, but knowing how to admit you’re wrong helps you last long enough to wait for the next opportunity. #btc #ETH #GRAM
The market doesn’t care what you think, and it doesn’t run on anyone’s emotions. When you already have data and signals showing you’re wrong, what you need to do is to accept it, adjust, or stop.
Many people don’t lose money because they choose incorrectly; they lose everything because they’re too stubborn—refusing to change and always trying to prove they’re right.
Remember: stubbornness can make you lose everything, but knowing how to admit you’re wrong helps you last long enough to wait for the next opportunity. #btc #ETH #GRAM
247
·
--
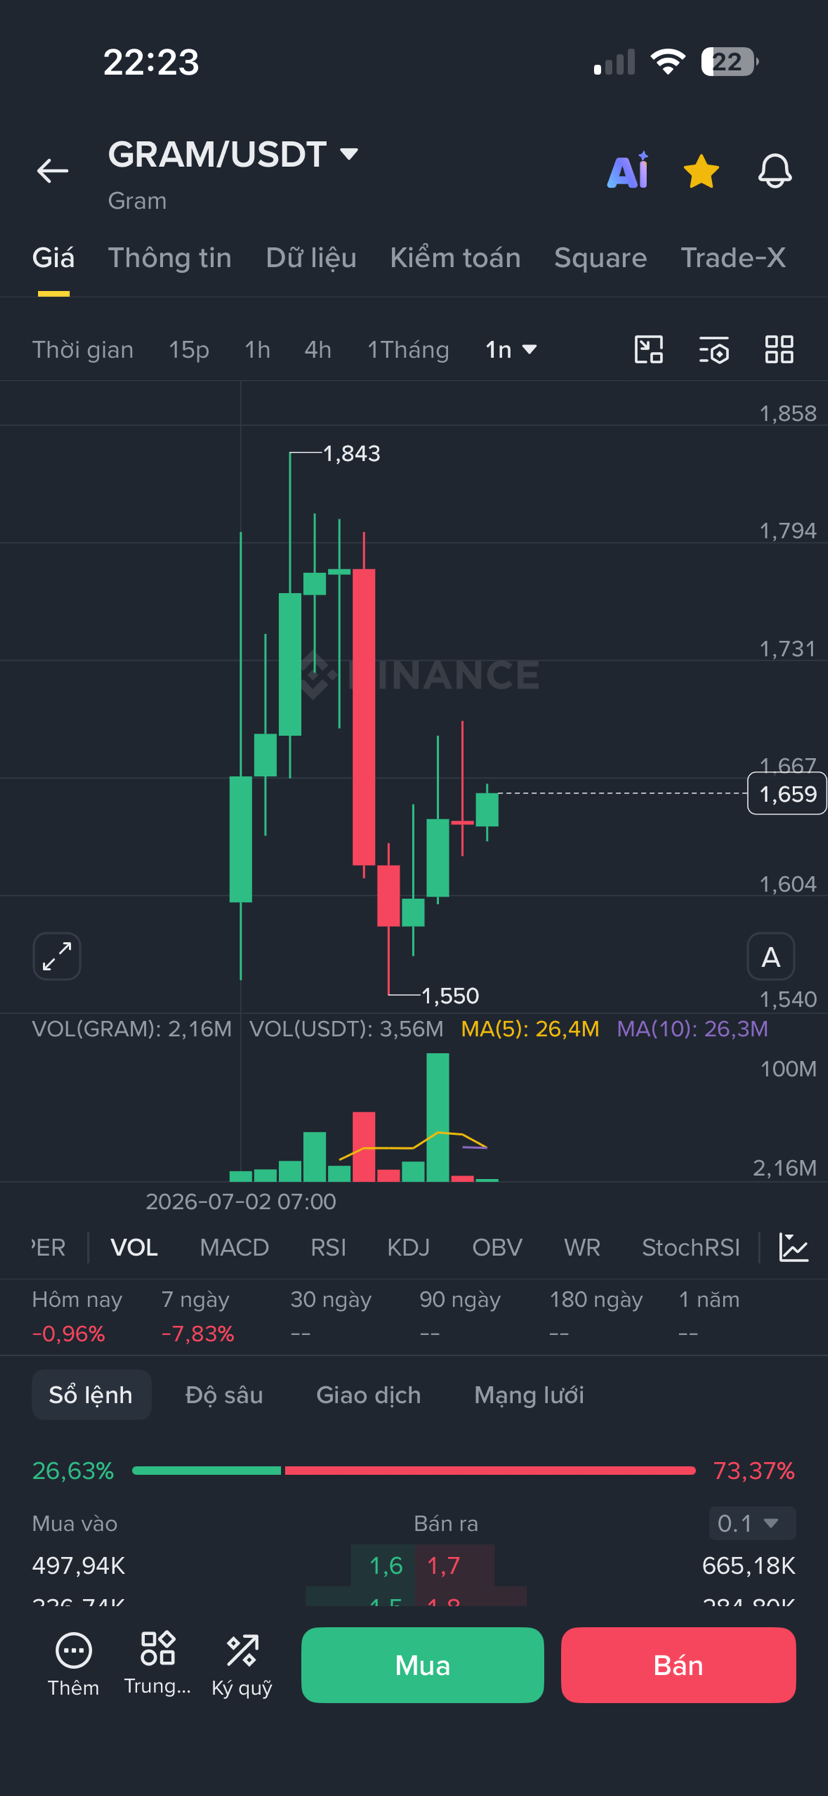
Learn through all kinds of indicators, and I become even more convinced of one thing:
Price can be pushed up, driven down to mislead the crowd. But money flow is very hard to fake.
For a major trend to form, real money must participate. And that trace is found in Volume.
Beginners look at price.
Experienced people look at structure.
Those who’ve been in the market long enough look at money flow.
Because:
Price is a phenomenon.
Volume is the essence.#gram
Learn through all kinds of indicators, and I become even more convinced of one thing:
Price can be pushed up, driven down to mislead the crowd. But money flow is very hard to fake.
For a major trend to form, real money must participate. And that trace is found in Volume.
Beginners look at price.
Experienced people look at structure.
Those who’ve been in the market long enough look at money flow.
Because:
Price is a phenomenon.
Volume is the essence.#gram
Price can be pushed up, driven down to mislead the crowd. But money flow is very hard to fake.
For a major trend to form, real money must participate. And that trace is found in Volume.
Beginners look at price.
Experienced people look at structure.
Those who’ve been in the market long enough look at money flow.
Because:
Price is a phenomenon.
Volume is the essence.#gram
192
·
--
What indicator is this, friend?
What indicator is this, friend?

Captain Hope
·
--
who has rice to help me with a little support for some friends who are in trouble. contributing to the storm. I turned on the tip mode.
Video analysis of altss
Video analysis of altss
1
·
--
@BiBi verification
@Binance BiBi verification

James_BNB
·
--
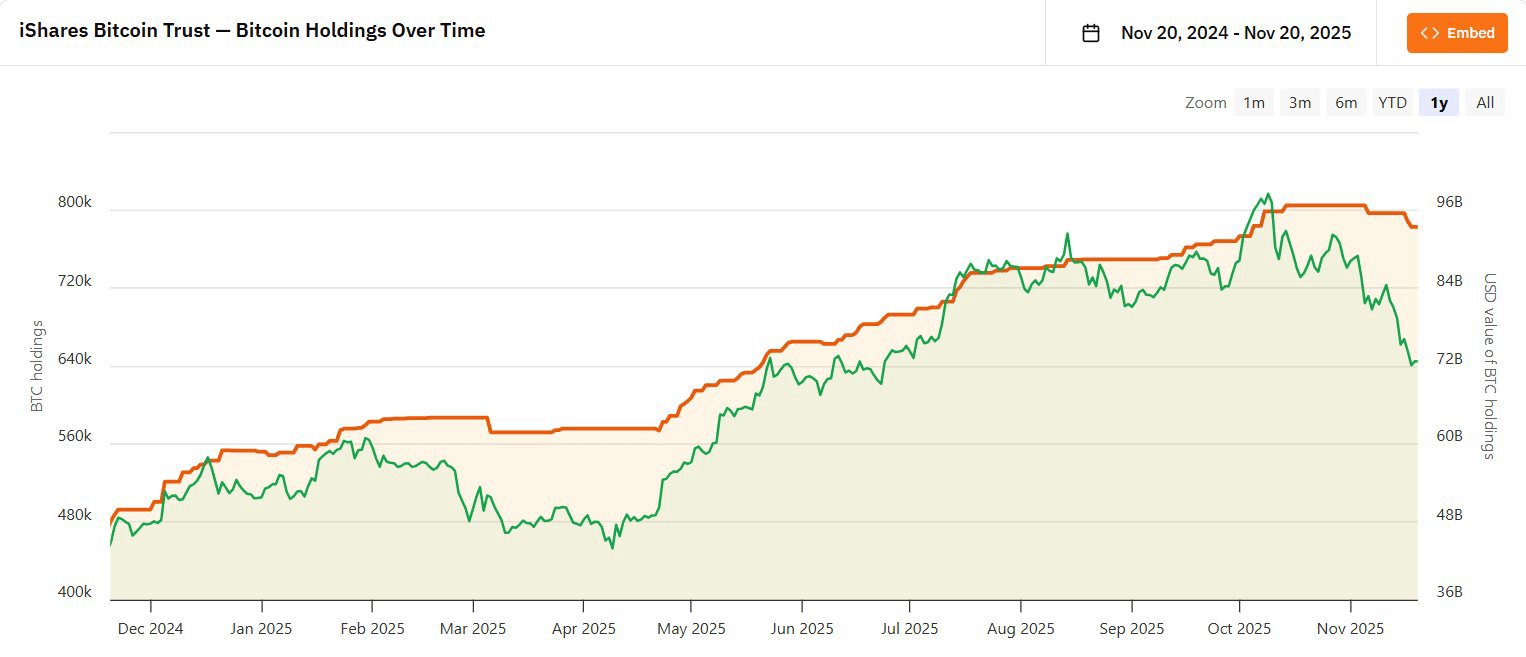
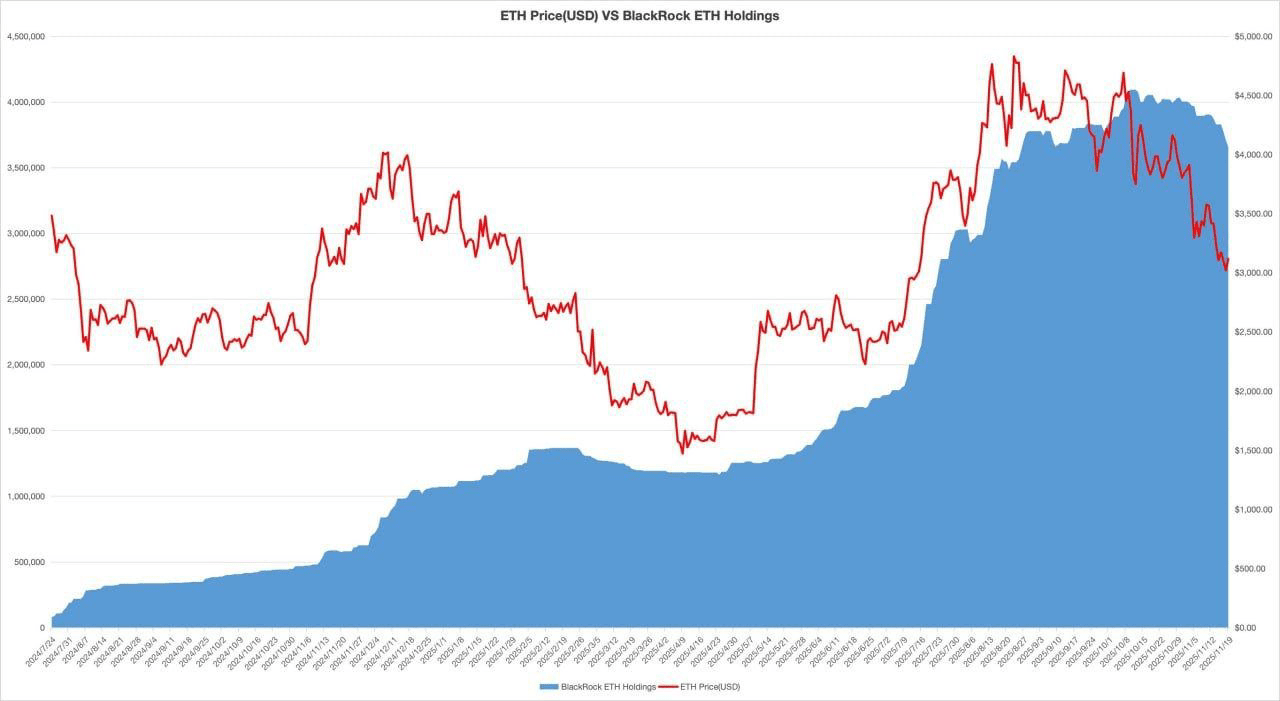
🚨 INSTITUTIONAL SHIFT: BlackRock Leads Major Crypto Liquidation
The market is absorbing significant selling pressure, but the source has shifted dramatically from last month.
New data indicates that US institutions, notably **BlackRock**, have been leading the recent dump:
* **BlackRock Sold:** $1.72 Billion in $BTC and $1.1 Billion in $ETH *this month alone*.
* **Total Liquidation:** A staggering $2.82 Billion combined.
**The Narrative Flip:**
If the October market slump was primarily driven by Asian whales taking profits (or reacting to regulations), the November pressure is being spearheaded by major US financial players.
This suggests a complex dynamic: while institutional adoption is expected to fuel the next bull run, institutions are also actively managing their large existing positions, causing volatility.
**Is this just profit-taking after a strong Q3/early Q4, or is the institutional confidence wavering ahead of key regulatory decisions?**
#BTC90kBreakingPoint #USStocksForecast2026
The market is absorbing significant selling pressure, but the source has shifted dramatically from last month.
New data indicates that US institutions, notably **BlackRock**, have been leading the recent dump:
* **BlackRock Sold:** $1.72 Billion in $BTC and $1.1 Billion in $ETH *this month alone*.
* **Total Liquidation:** A staggering $2.82 Billion combined.
**The Narrative Flip:**
If the October market slump was primarily driven by Asian whales taking profits (or reacting to regulations), the November pressure is being spearheaded by major US financial players.
This suggests a complex dynamic: while institutional adoption is expected to fuel the next bull run, institutions are also actively managing their large existing positions, causing volatility.
**Is this just profit-taking after a strong Q3/early Q4, or is the institutional confidence wavering ahead of key regulatory decisions?**
#BTC90kBreakingPoint #USStocksForecast2026
2
·
--
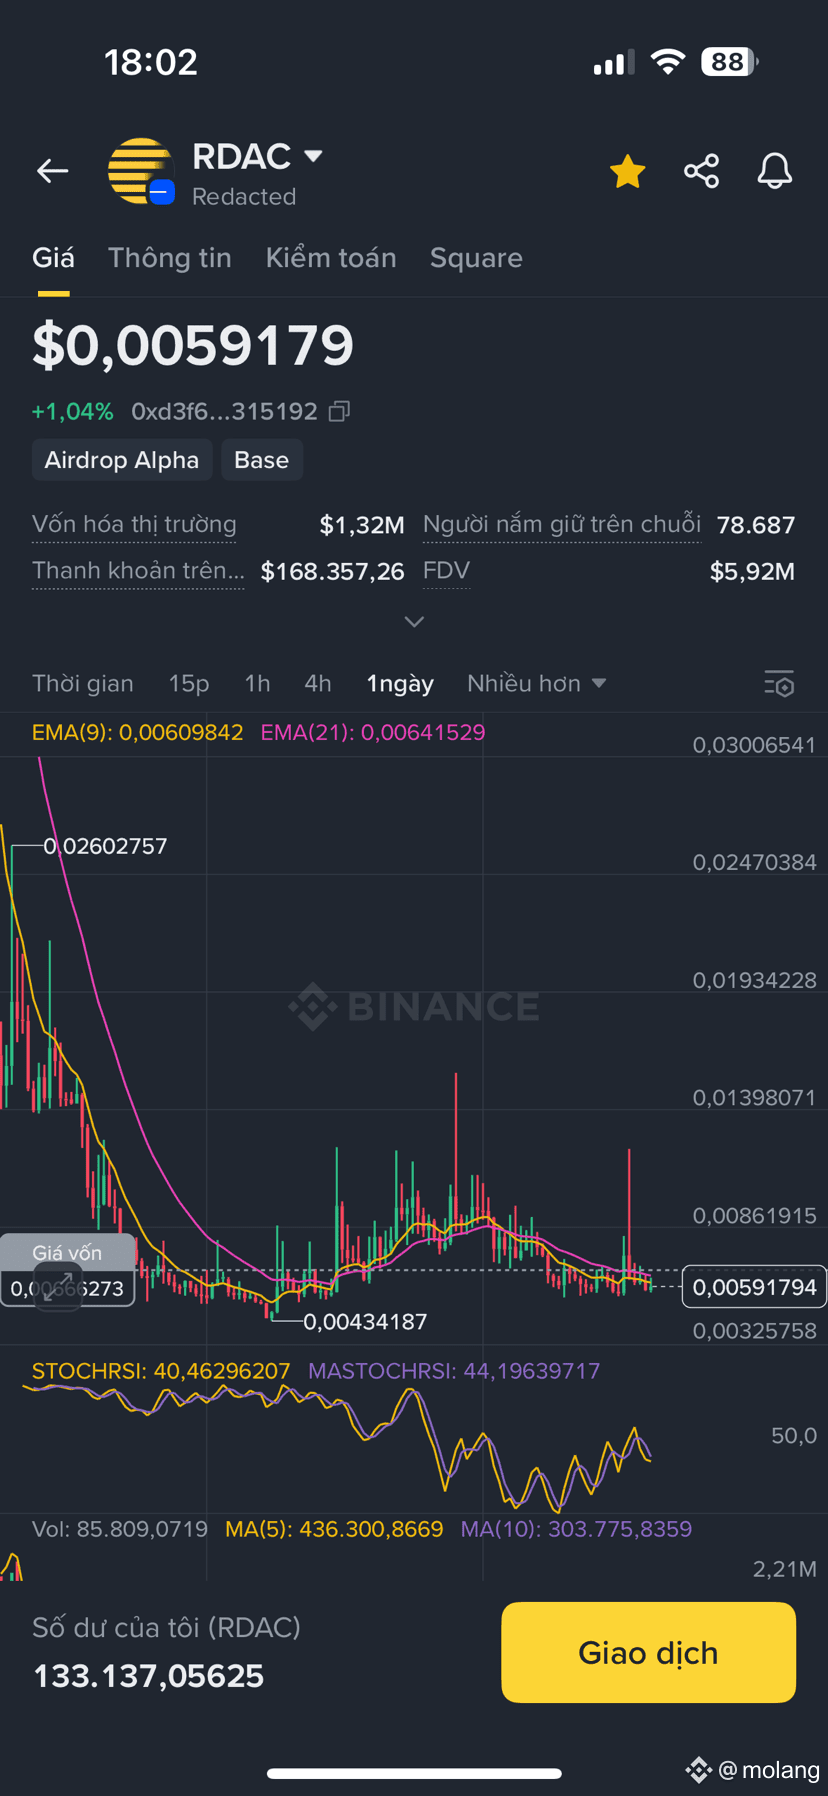
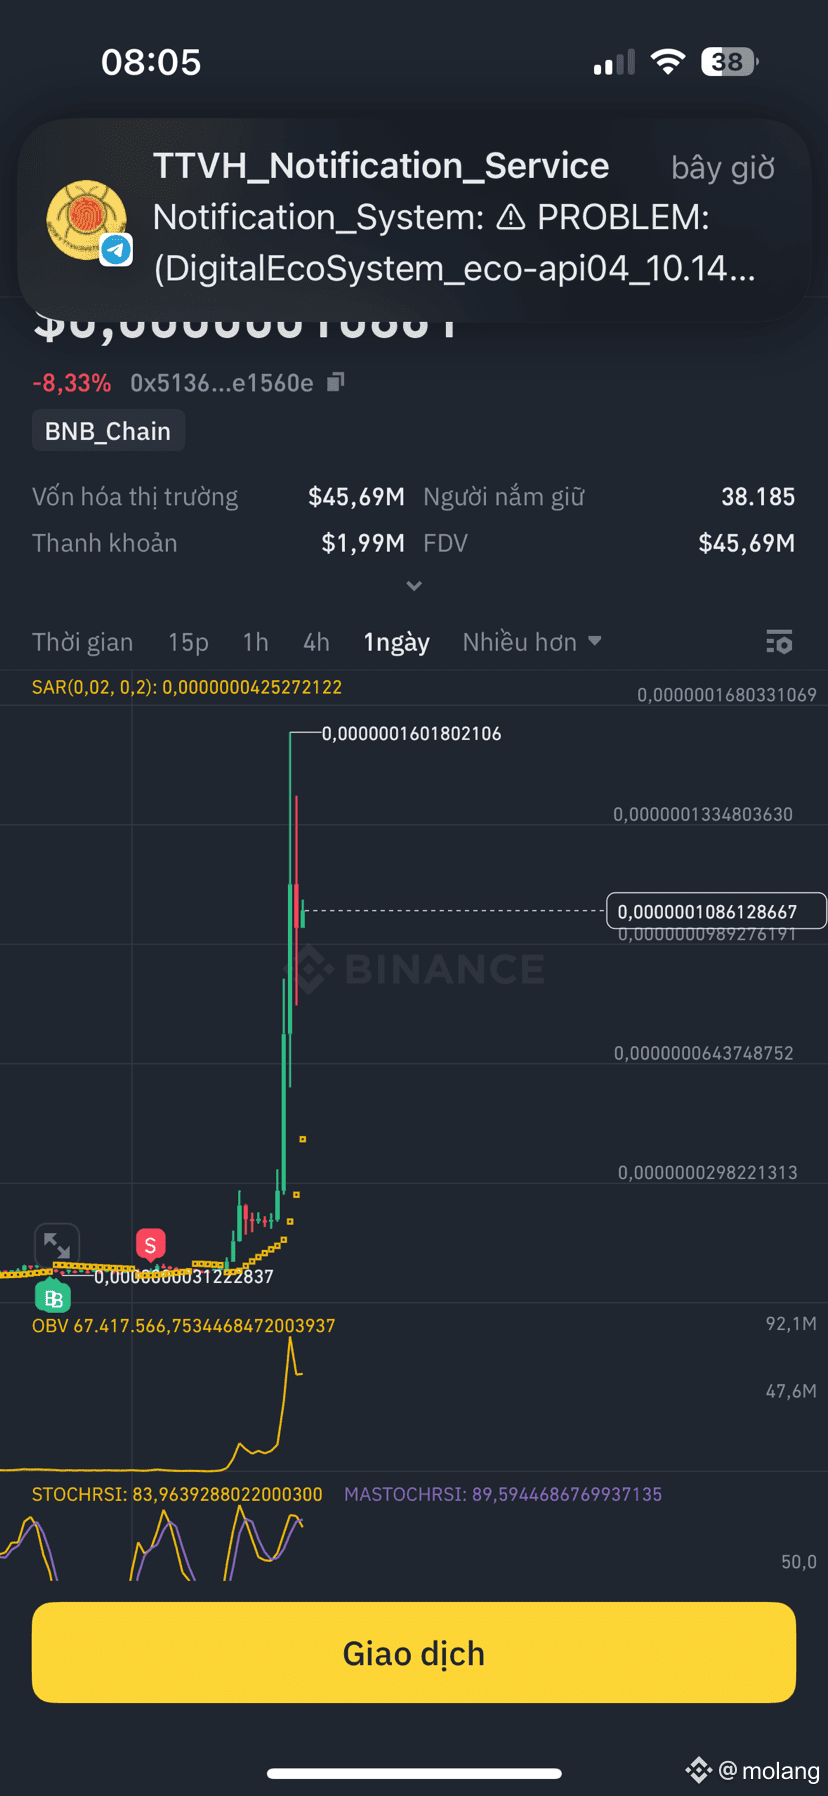
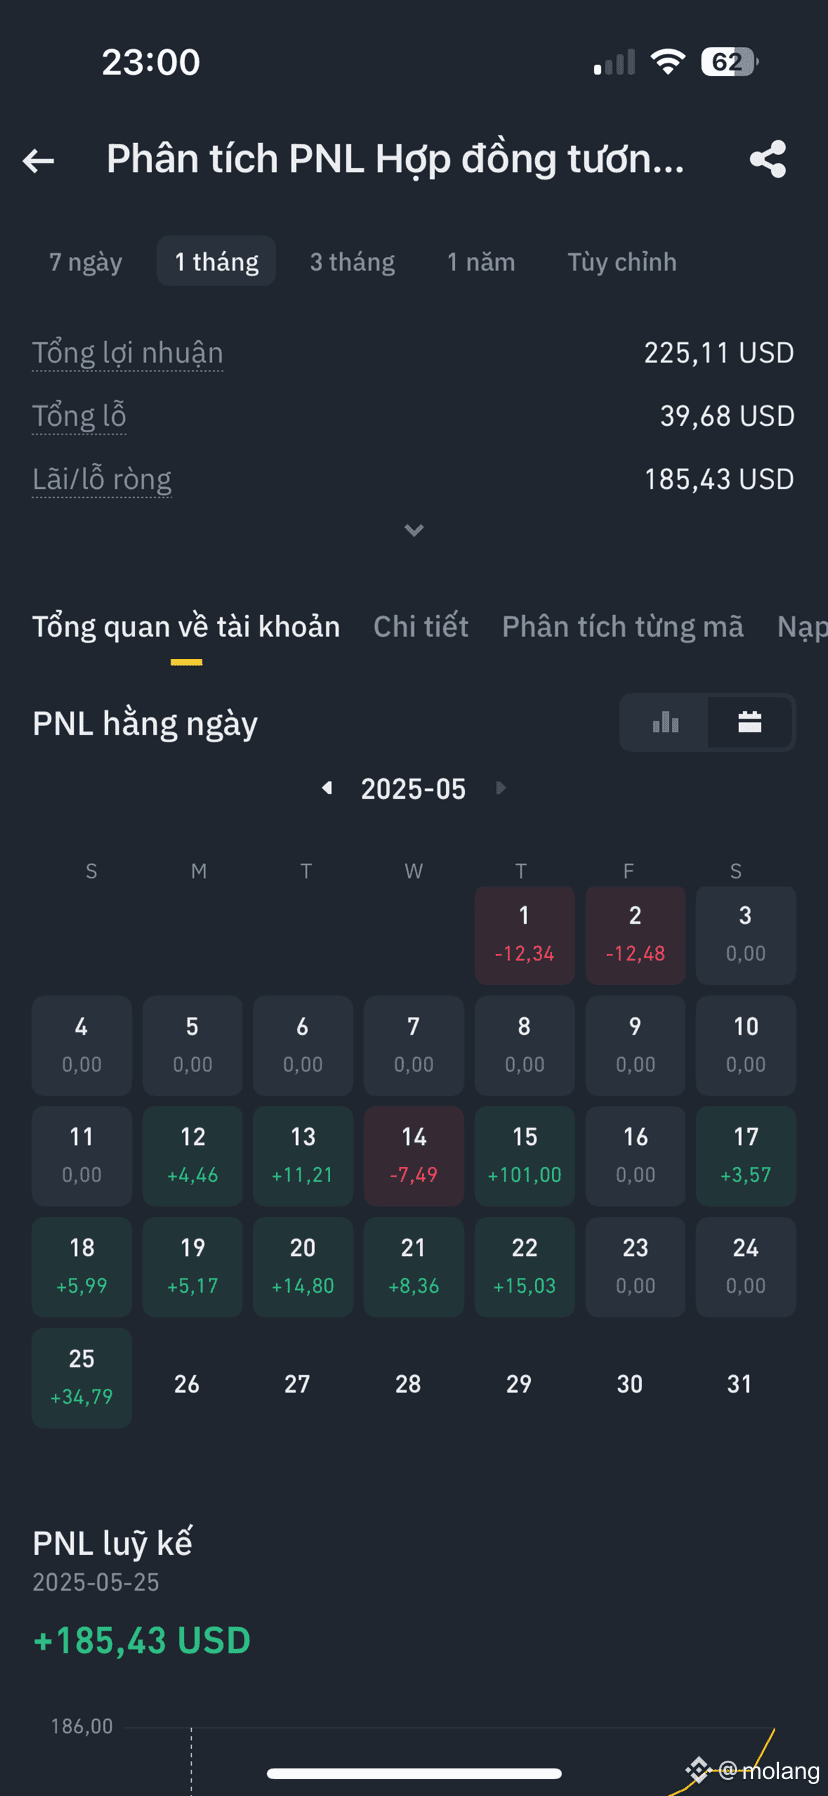
Safe price range for 1 item raising funds of 10m, target. No x10 no sale.
Safe price range for 1 item raising funds of 10m, target. No x10 no sale.
902
·
--
Bullish
At this time, anyone looking to short altcoins should forget it :)). #dogs#not
At this time, anyone looking to short altcoins should forget it :)). #dogs#not
2
894
Log in to explore more content
Join global crypto users on Binance Square
⚡️ Get latest and useful information about crypto.
💬 Trusted by the world’s largest crypto exchange.
👍 Discover real insights from verified creators.
Email / Phone number
Trending Topics
BitcoinHoldsAbove$77000
0 views
21 Discussing
I am Decide To Open Big long in $BTC 💀🔥
Btc Is Respecting 4H Trendline and Then Pump
Entery : 76826 - 76500
Profit : 76900 - 77000 - 77300
Stop loss : 76400
Also keep long $LSK and $POWR
LedgerXpert
·2 Likes
·833 views
BitcoinCrosses$78000
1,749 views
105 Discussing
AvalancheIntegratesIntoUAEPassDigitalVault
6,764 views
227 Discussing