

imad soukkou
متداول العملات الرقمية 📊
Open Trade

APT Holder
Occasional Trader
3.5 Years
1 Following
75 Followers
59 Liked
Posts
Portfolio
All
Quotes
imad soukkou
·
--
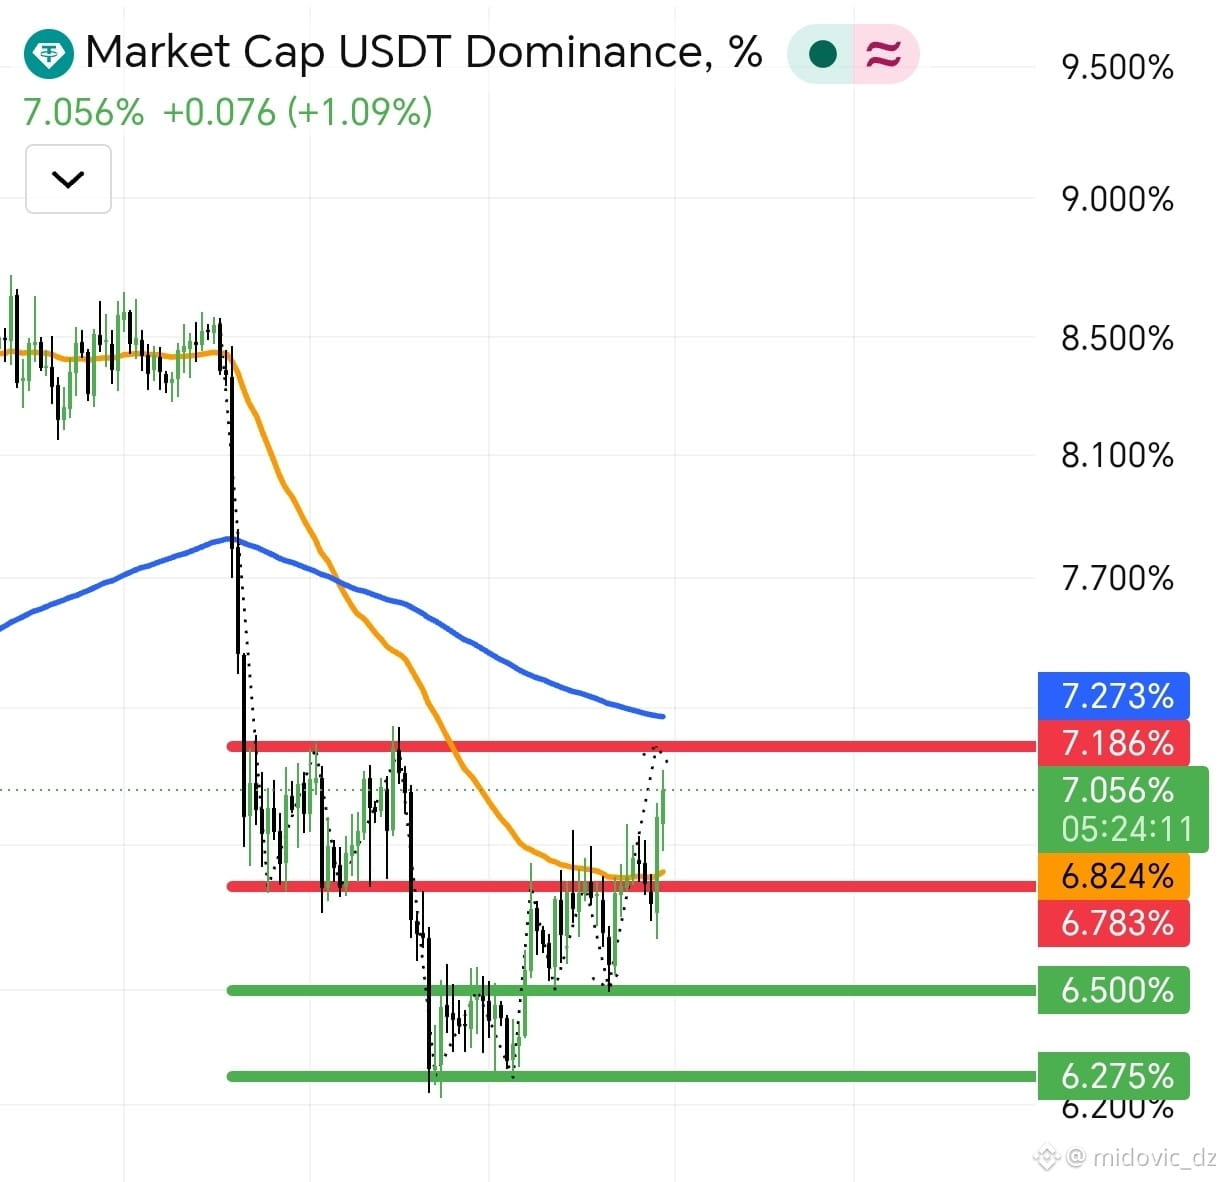
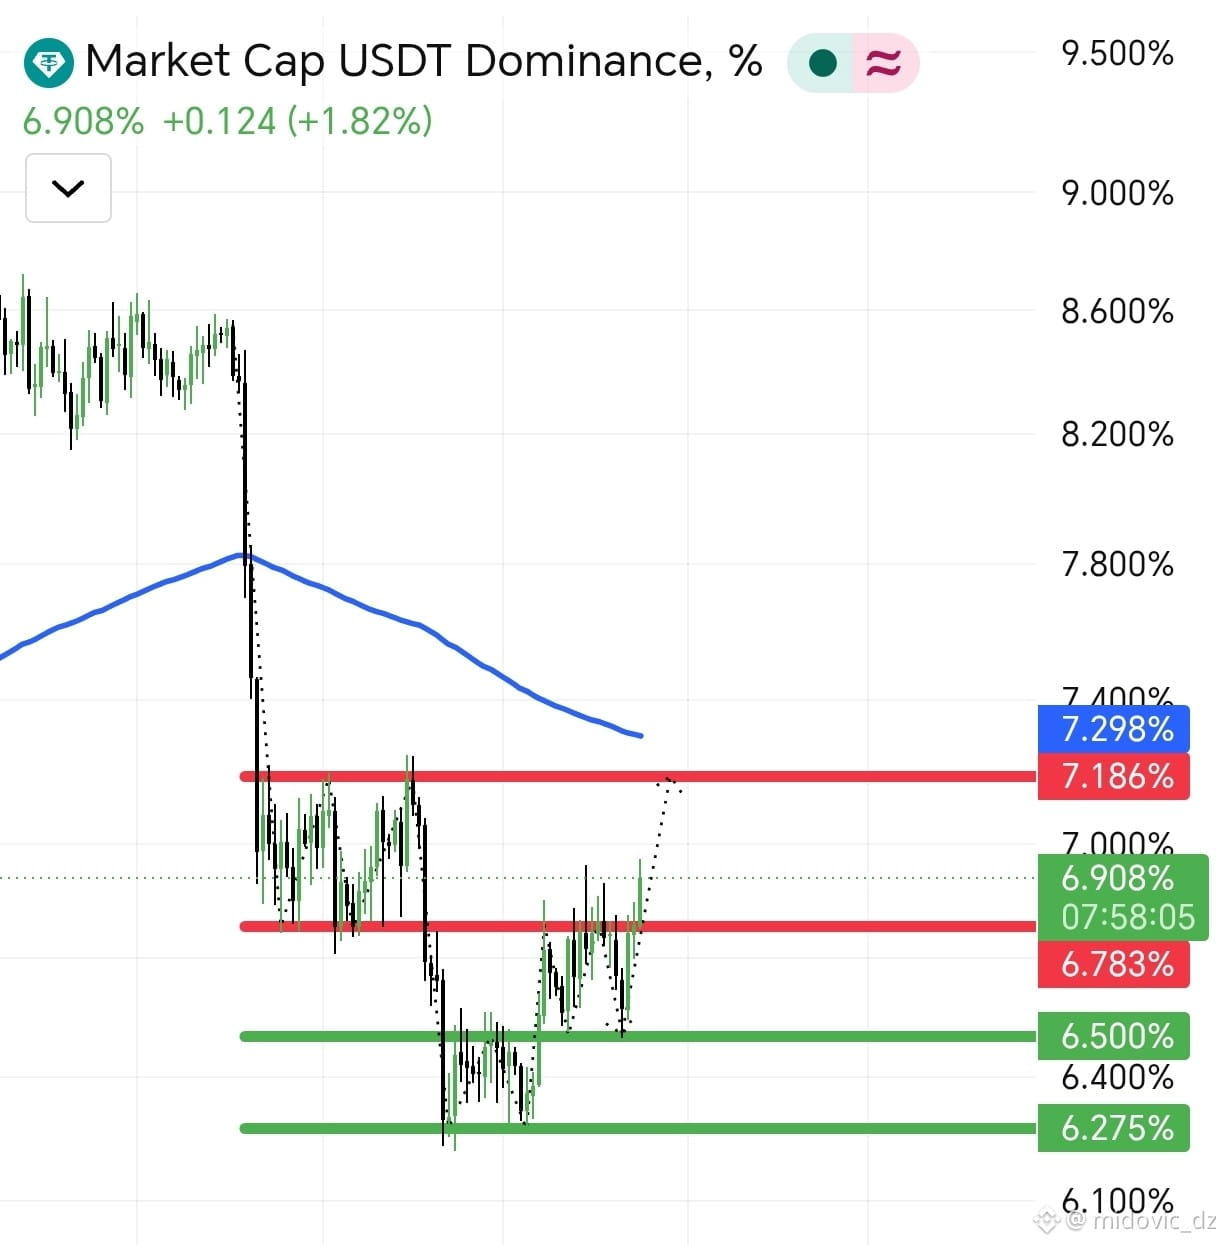
Market Cap USDT Dominance 🤯
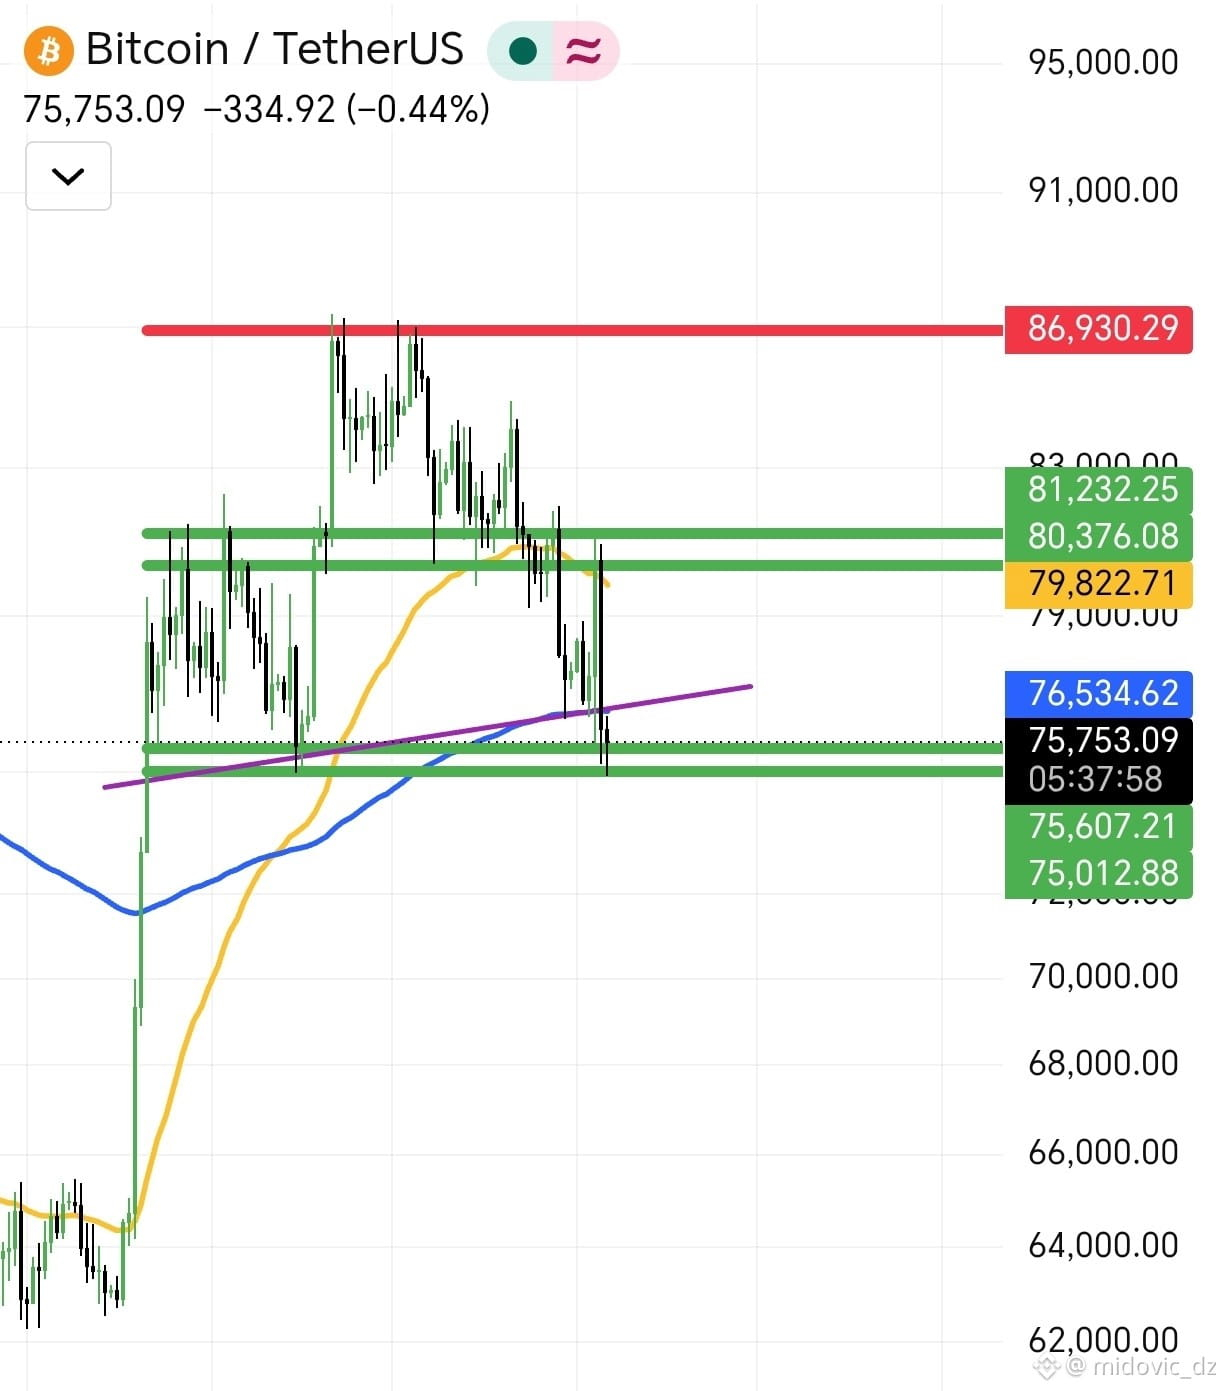
Next Target : 7% 😩
$BTC
$ETH
#EarningsSeason
Next Target : 7% 😩
$BTC
$ETH
#EarningsSeason
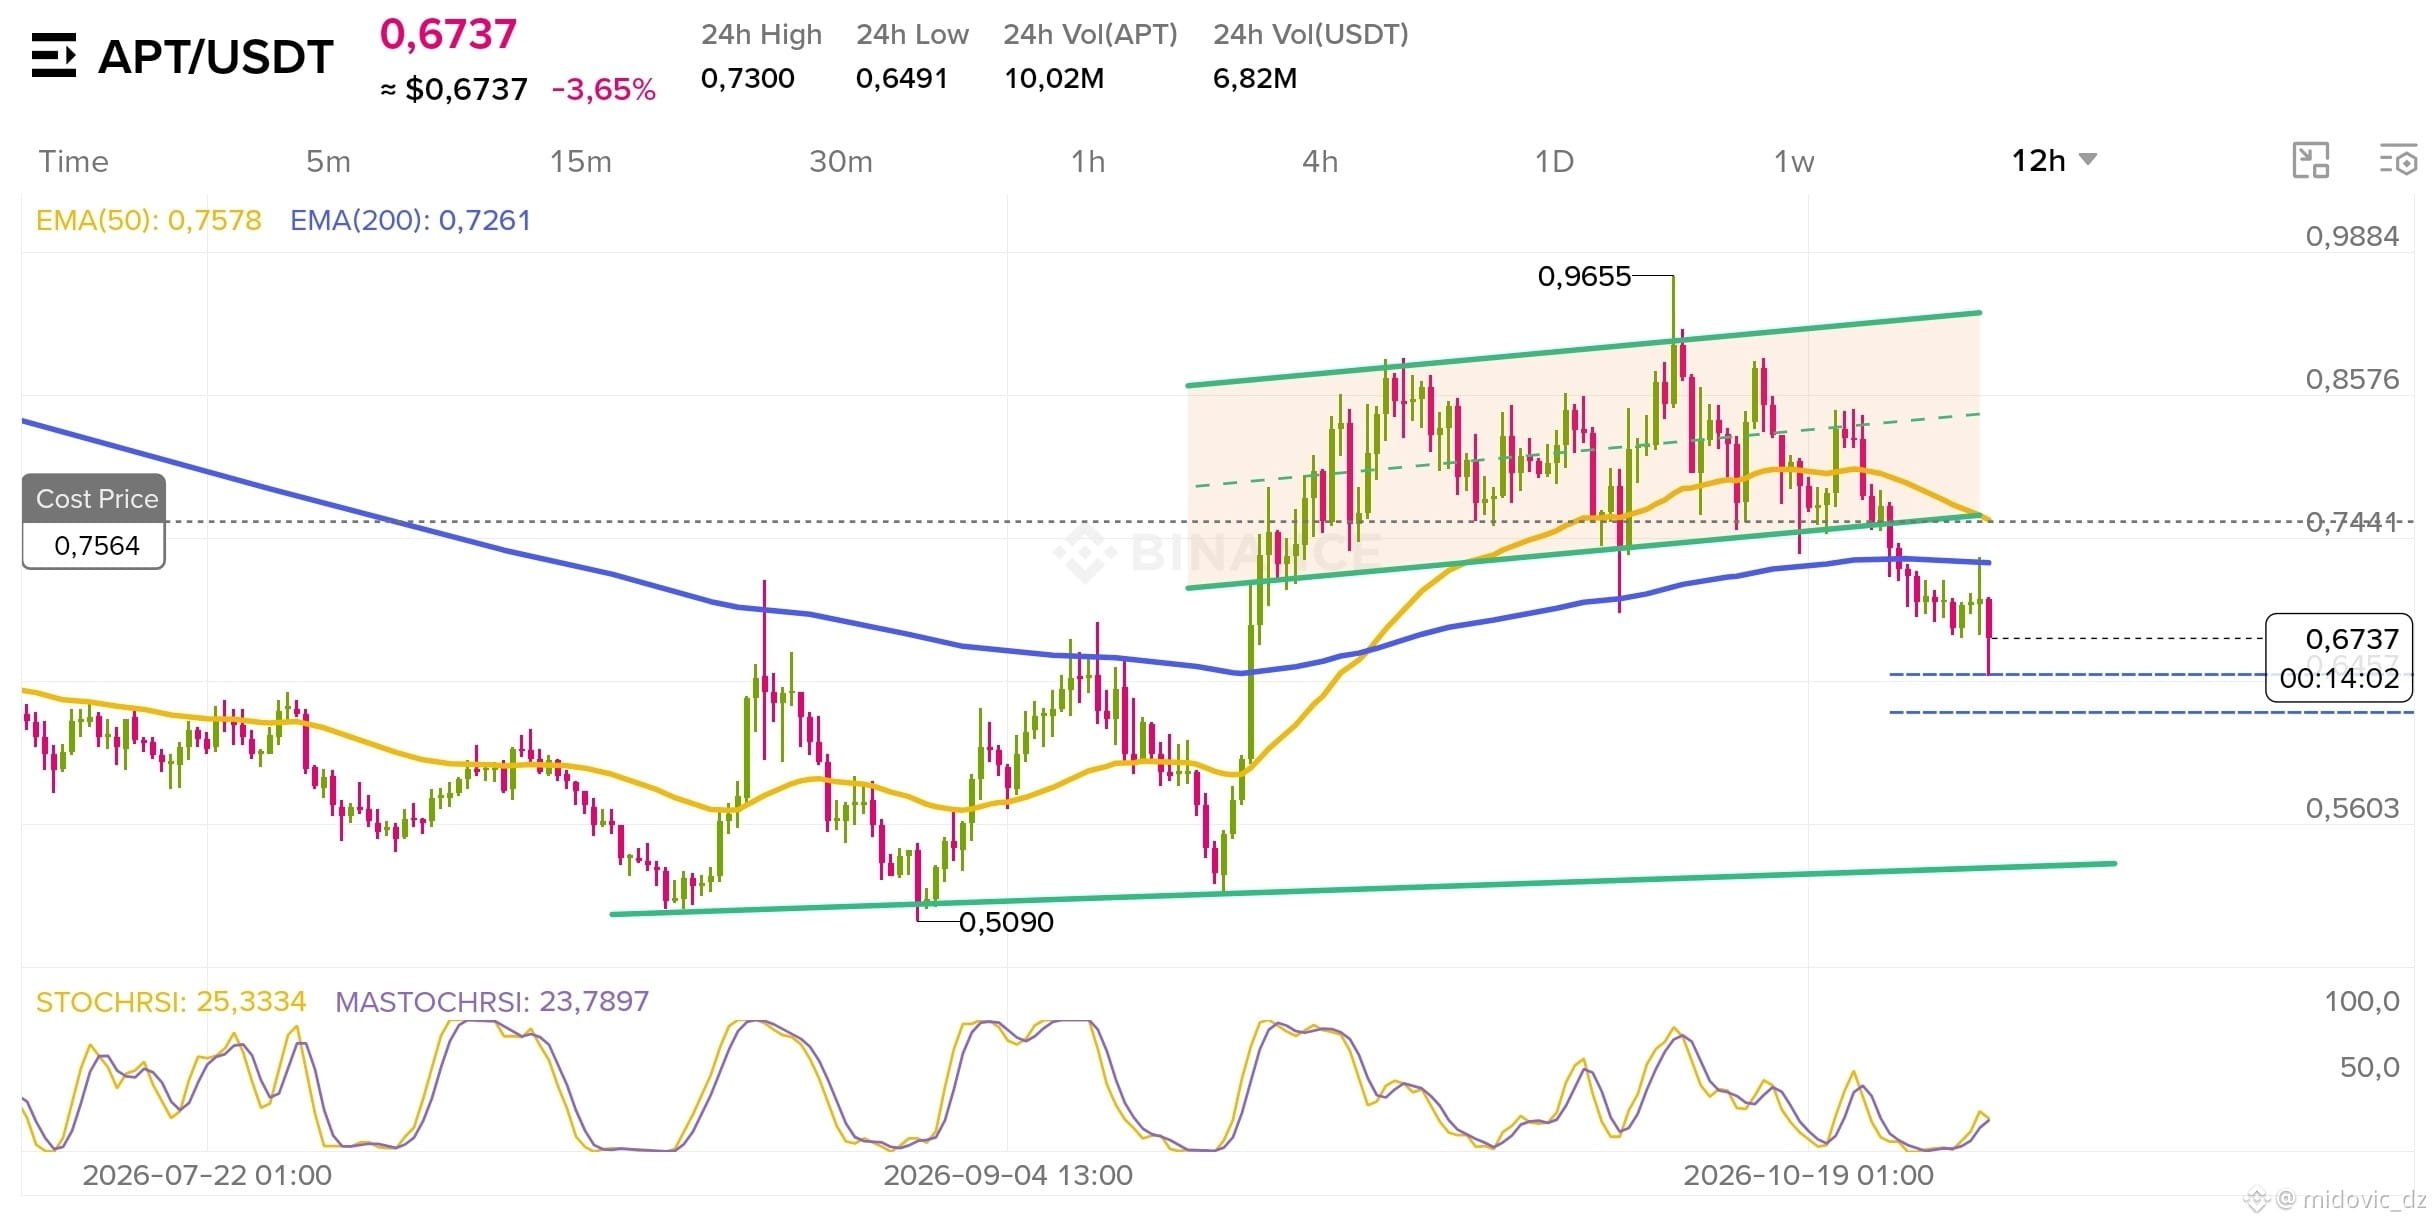
Holding $TWT 92.8 USDT
imad soukkou
·
--
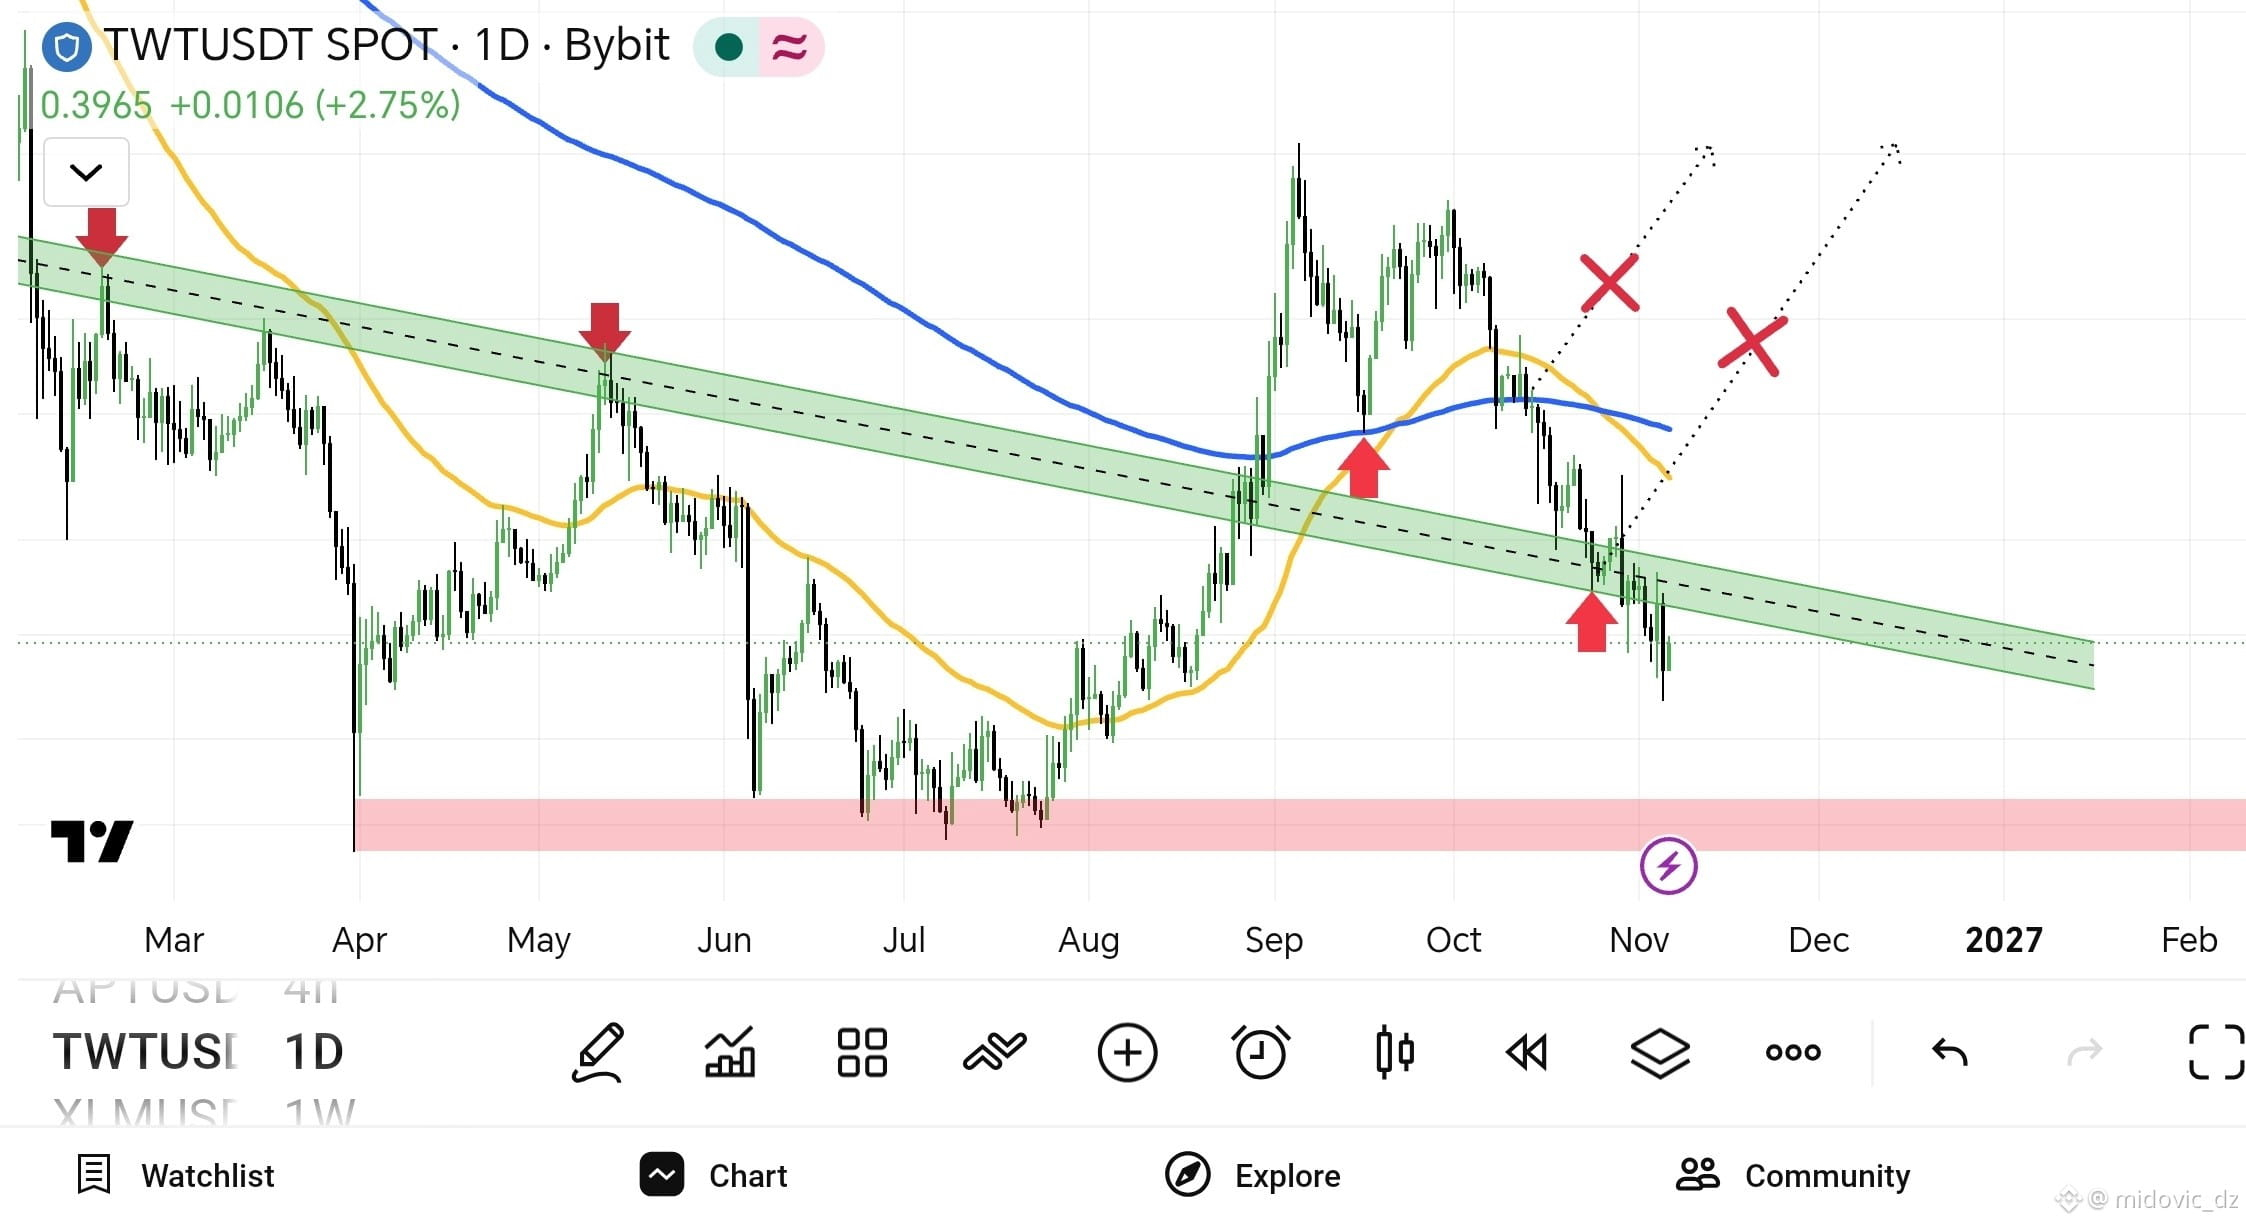
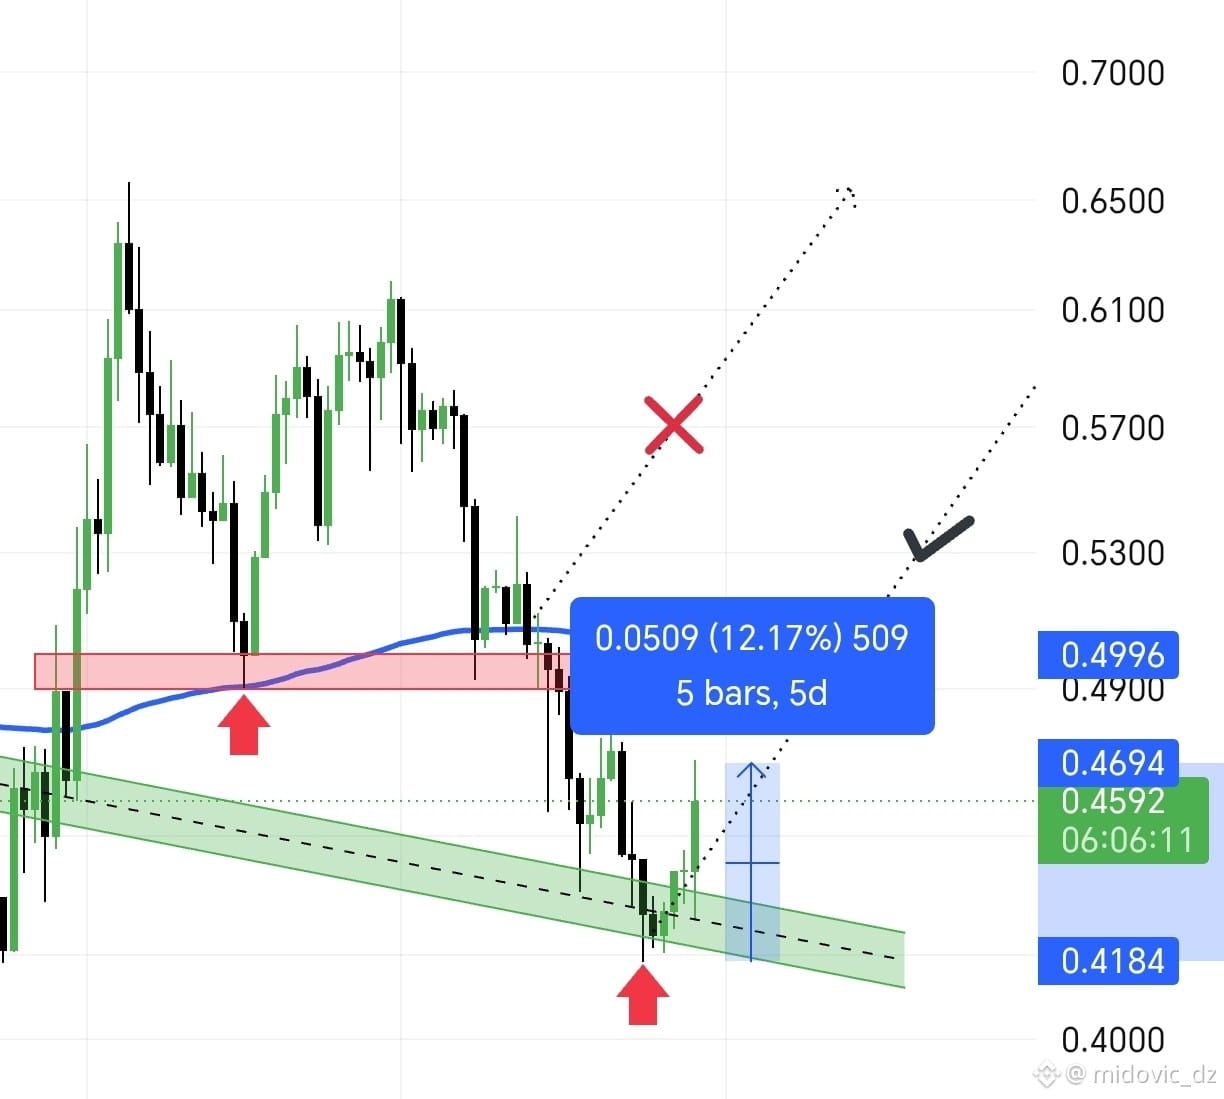
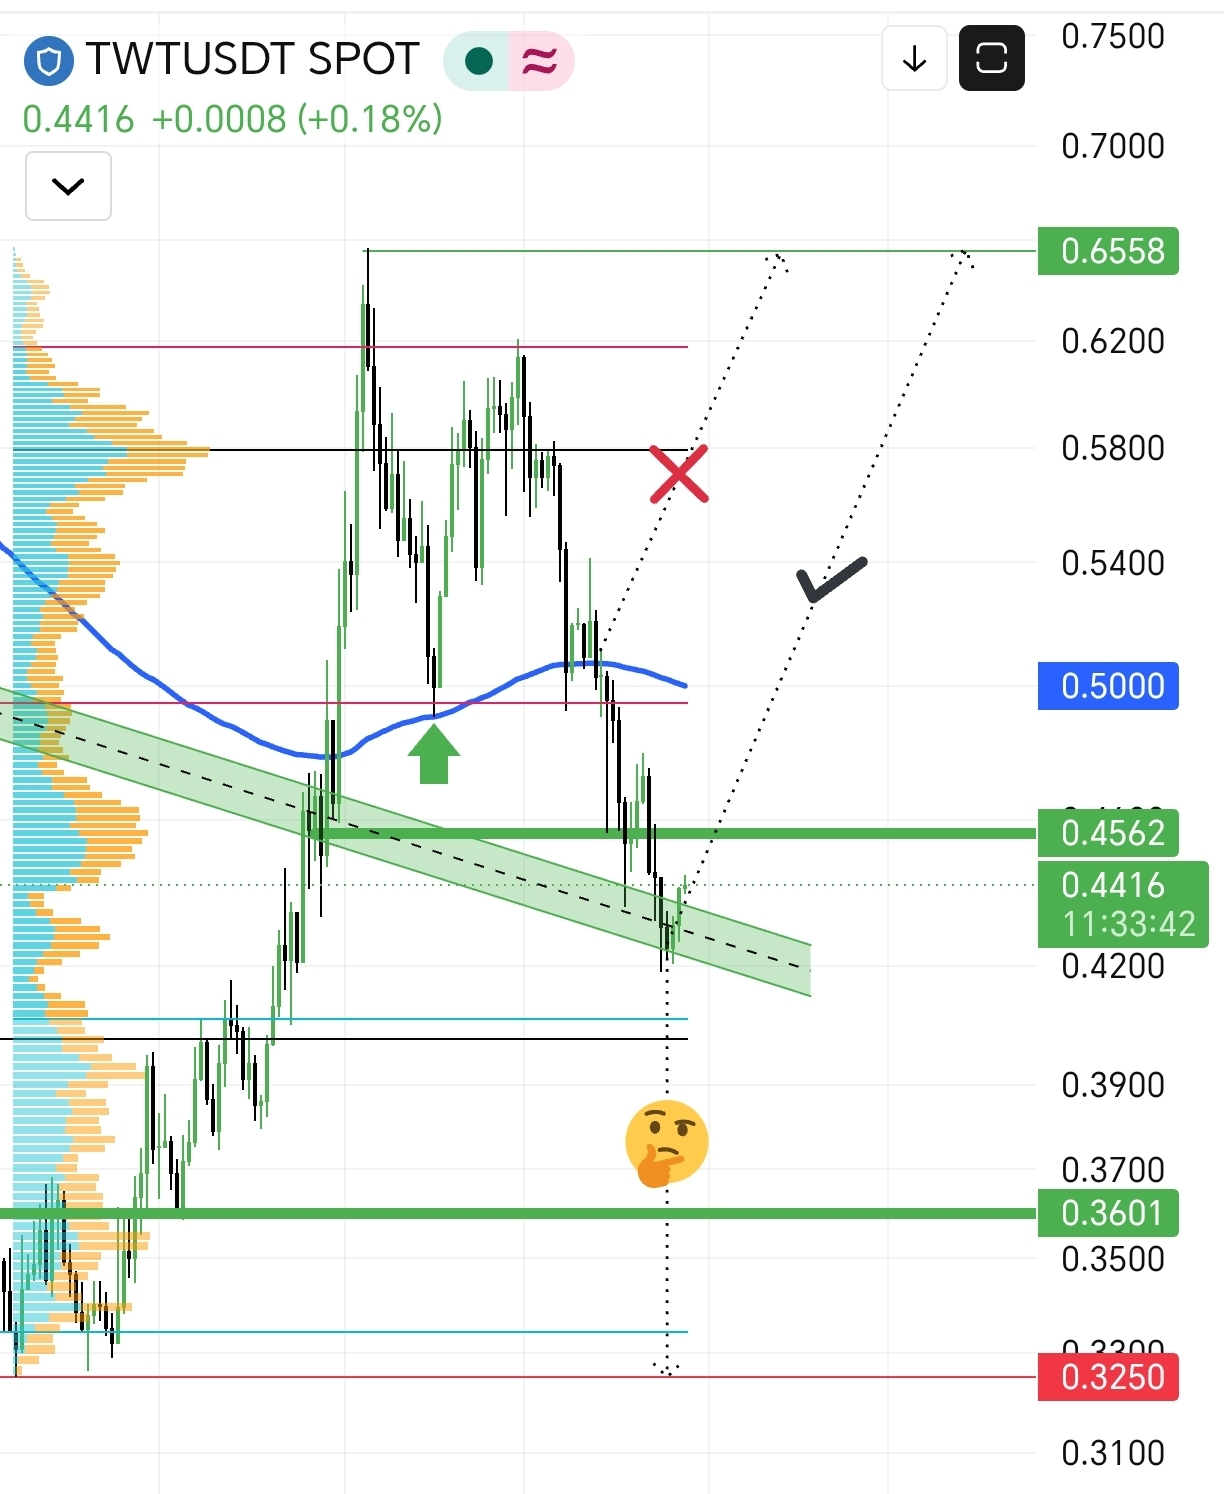
Bullish📊 Quick technical analysis of $TWT
The current price is trading around $0.4416, while testing a critical area and the boundaries of a minor price channel.
Current pivot zone: The price is currently testing a descending support range within the channel shown (the green area). This level may offer an opportunity for a temporary corrective rebound if it holds.
Moving averages: The price is below the main moving average (the blue line, at around $0.5000), reflecting previous selling pressure and attempts to break above the trend line.
Possible scenarios:
📈 Positive rebound scenario: If the price manages to hold the current support and break above $0.4562, we could target a return toward resistance near $0.5000.
📉 Continued decline scenario: A break below the current support could push the price toward lower liquidity levels, with historical support at $0.3601.
Note: Please monitor the current candle's close and manage risk carefully.
The current price is trading around $0.4416, while testing a critical area and the boundaries of a minor price channel.
Current pivot zone: The price is currently testing a descending support range within the channel shown (the green area). This level may offer an opportunity for a temporary corrective rebound if it holds.
Moving averages: The price is below the main moving average (the blue line, at around $0.5000), reflecting previous selling pressure and attempts to break above the trend line.
Possible scenarios:
📈 Positive rebound scenario: If the price manages to hold the current support and break above $0.4562, we could target a return toward resistance near $0.5000.
📉 Continued decline scenario: A break below the current support could push the price toward lower liquidity levels, with historical support at $0.3601.
Note: Please monitor the current candle's close and manage risk carefully.
imad soukkou
·
--
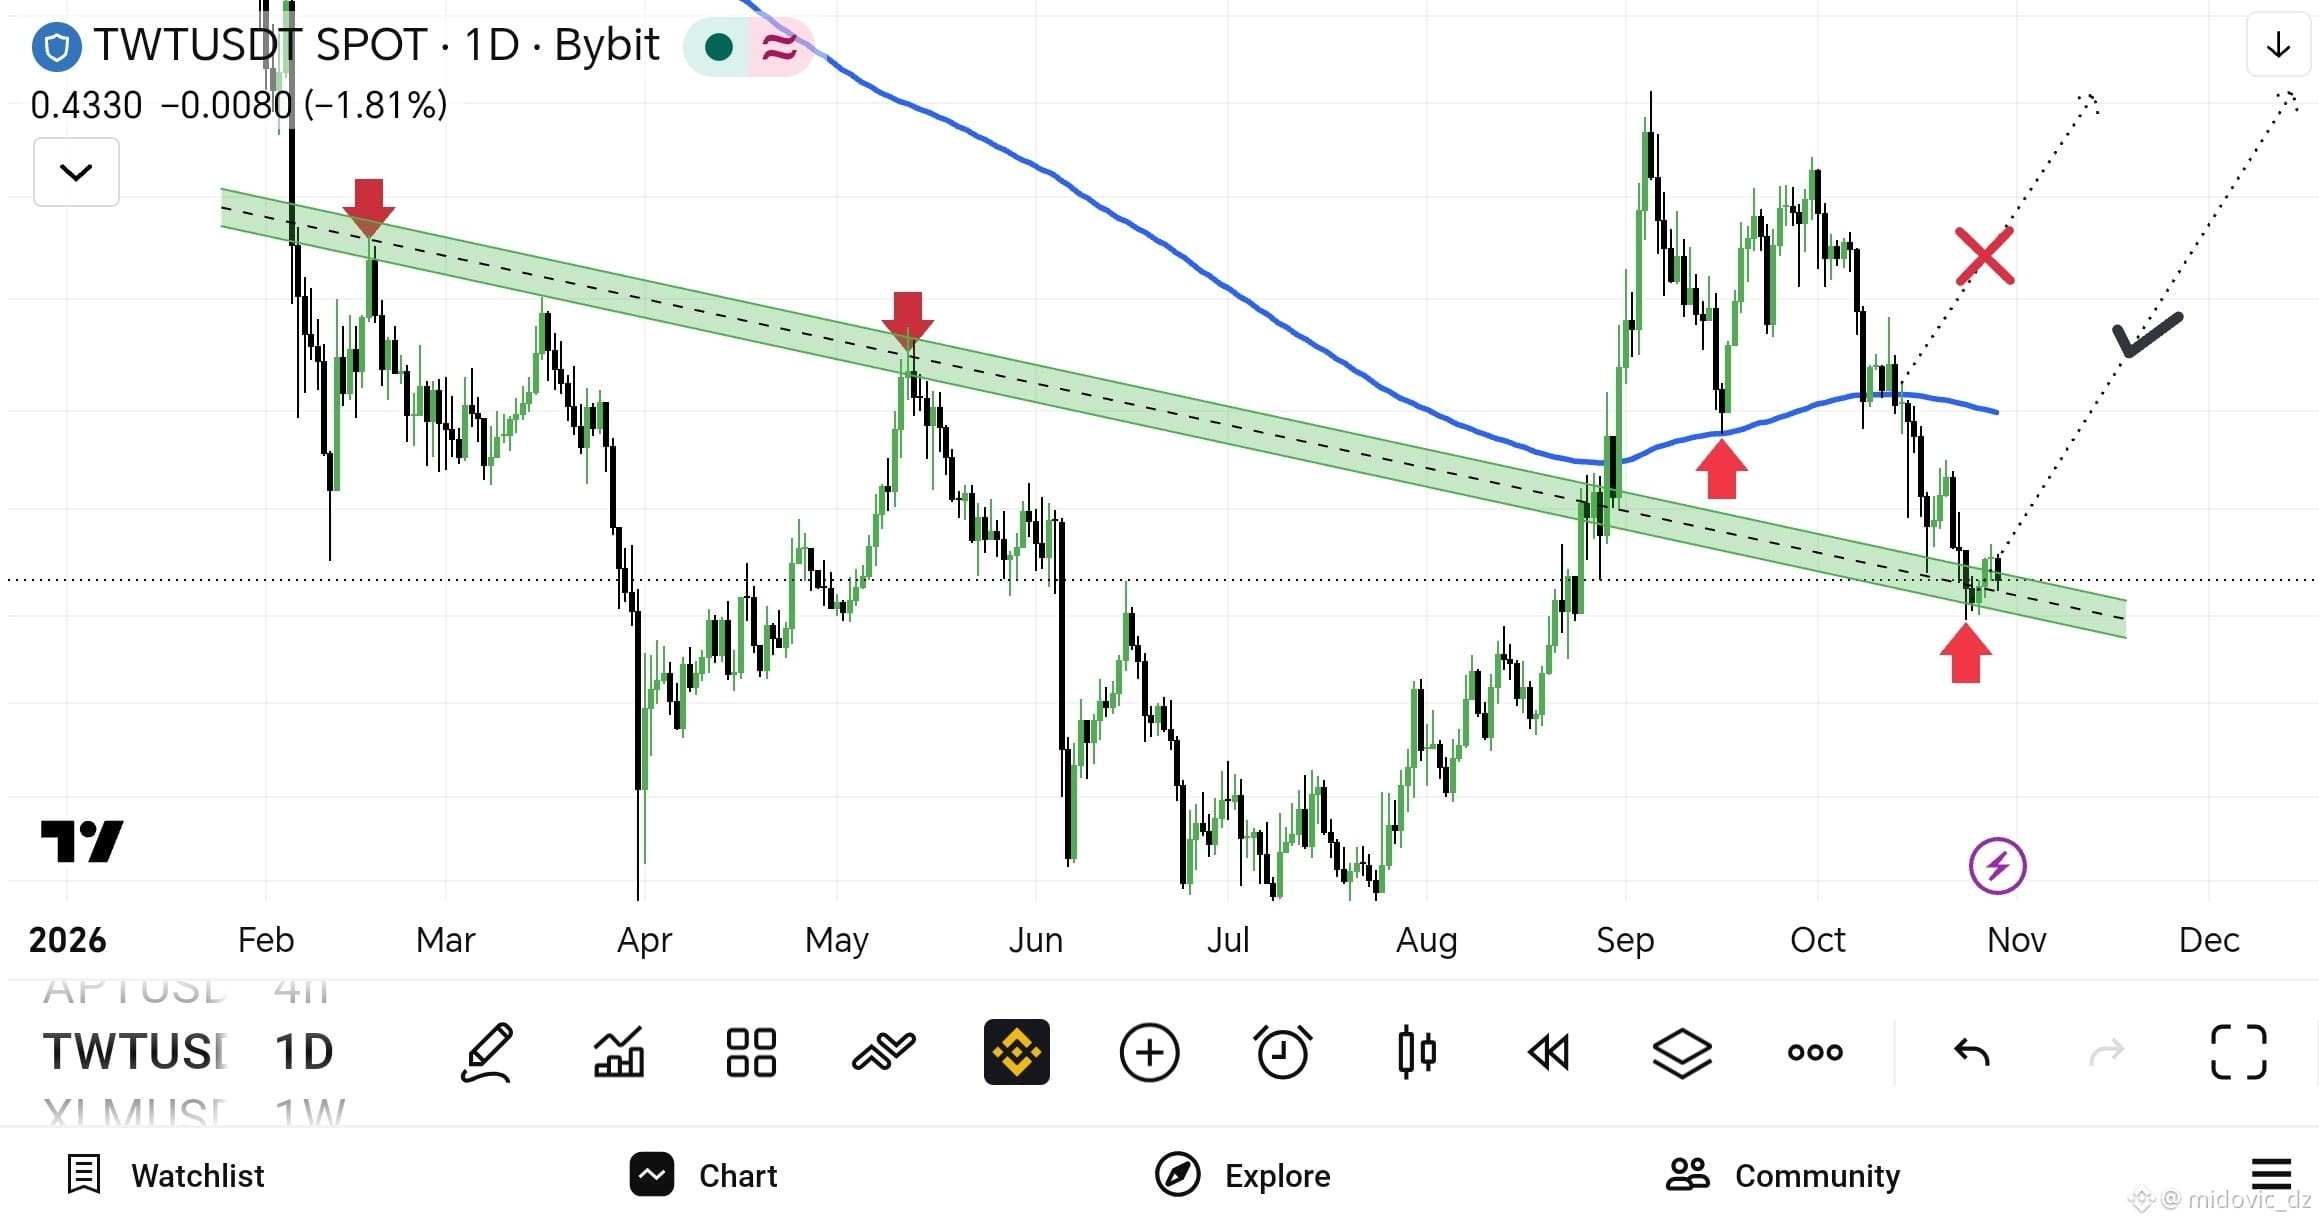
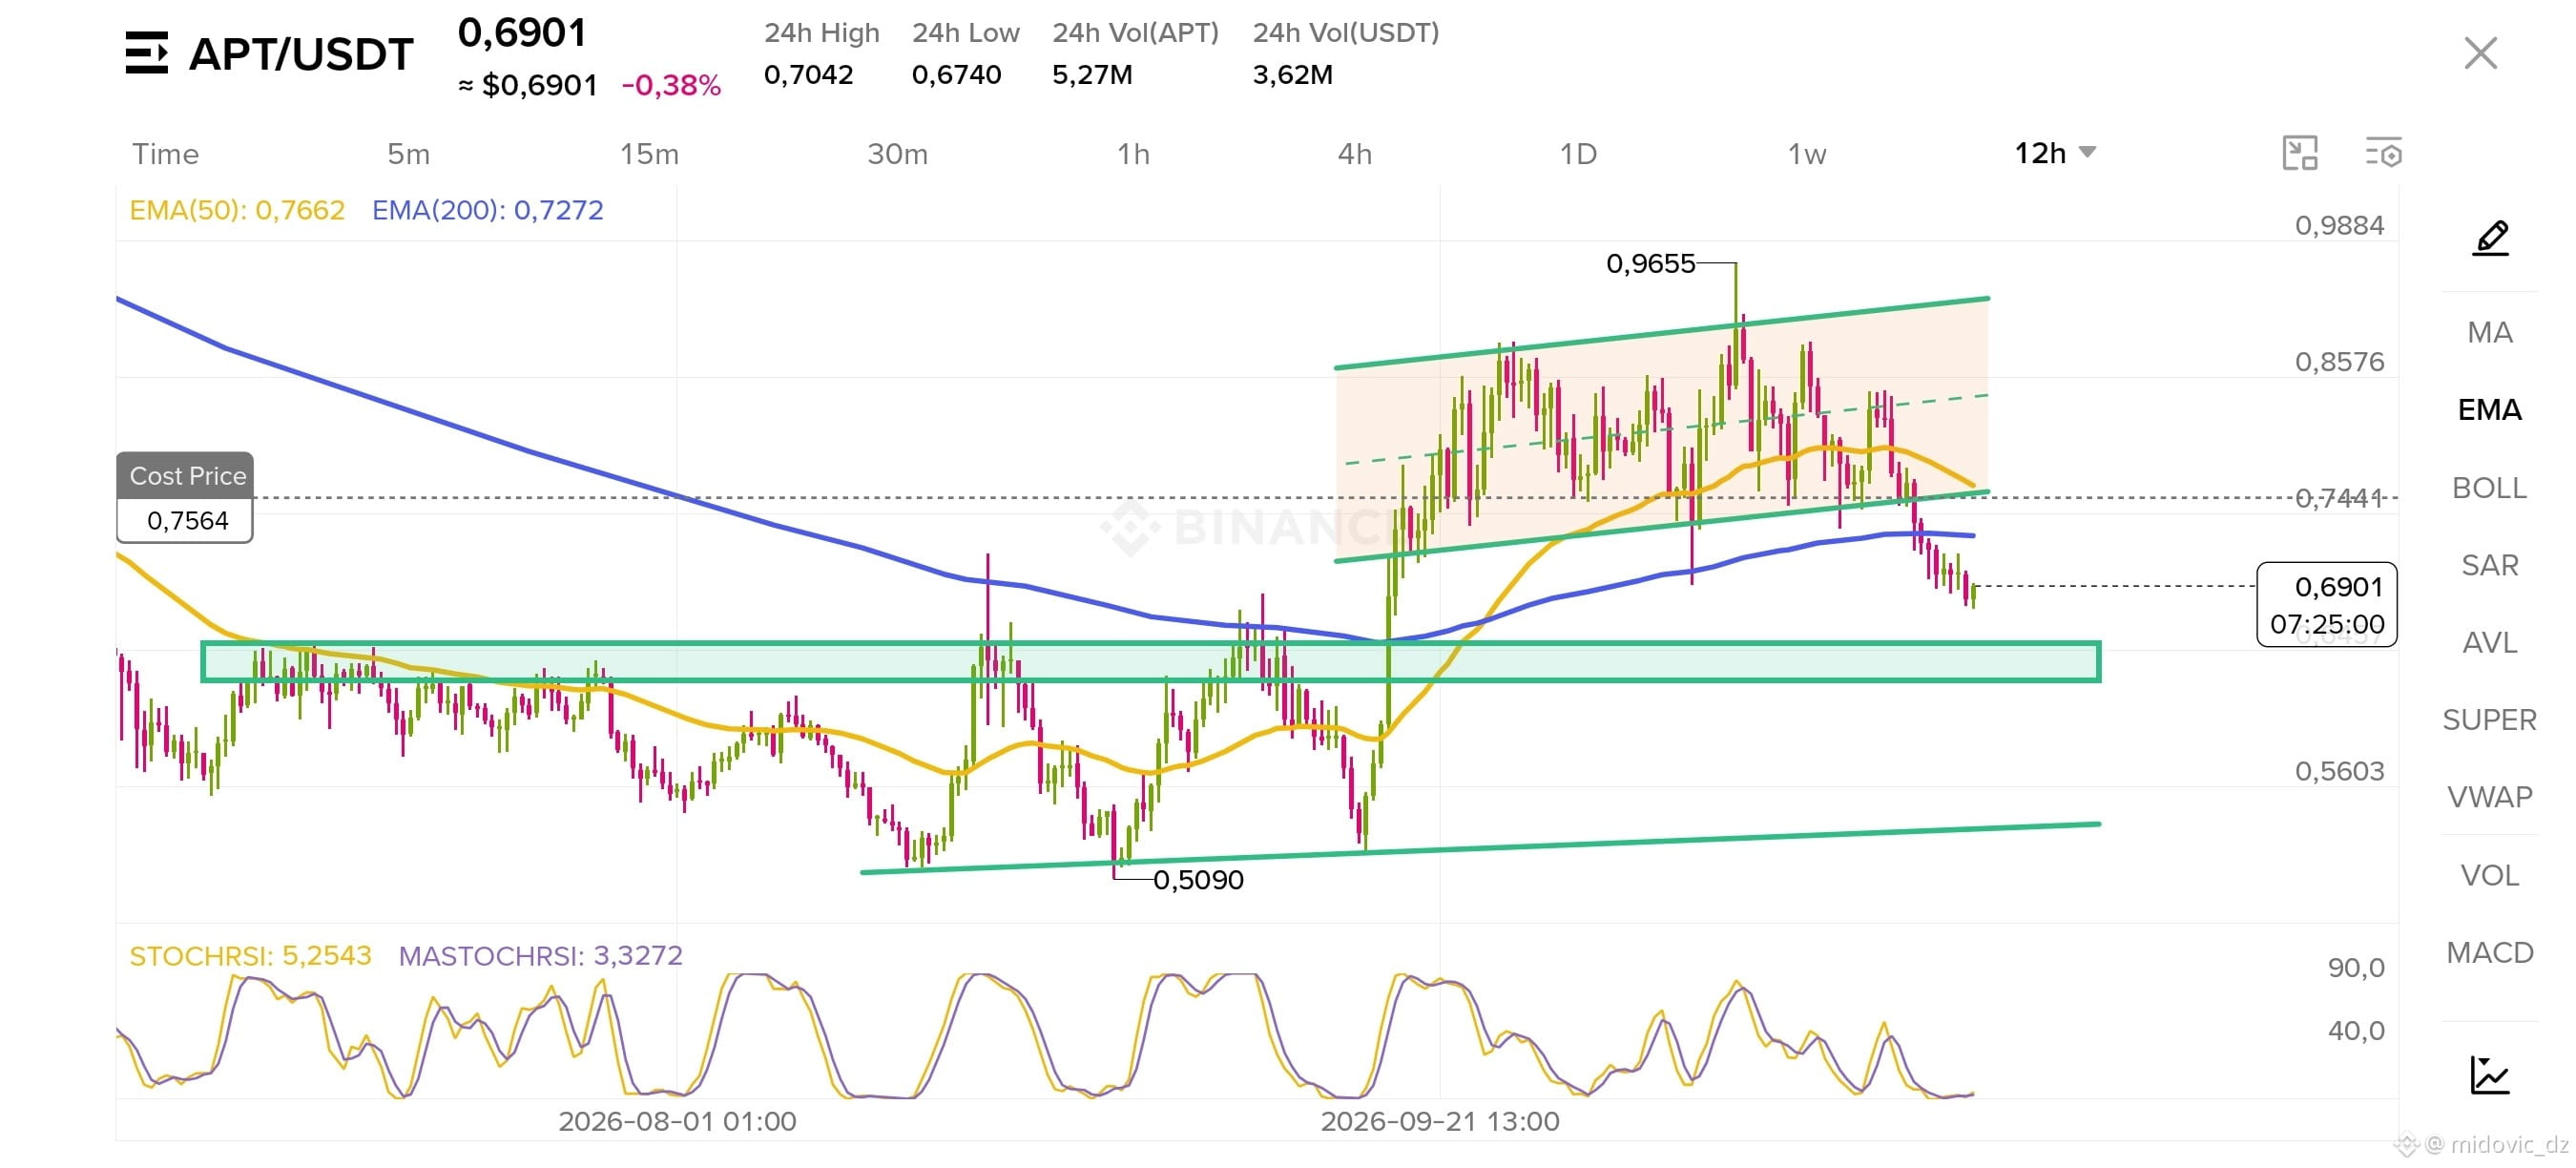
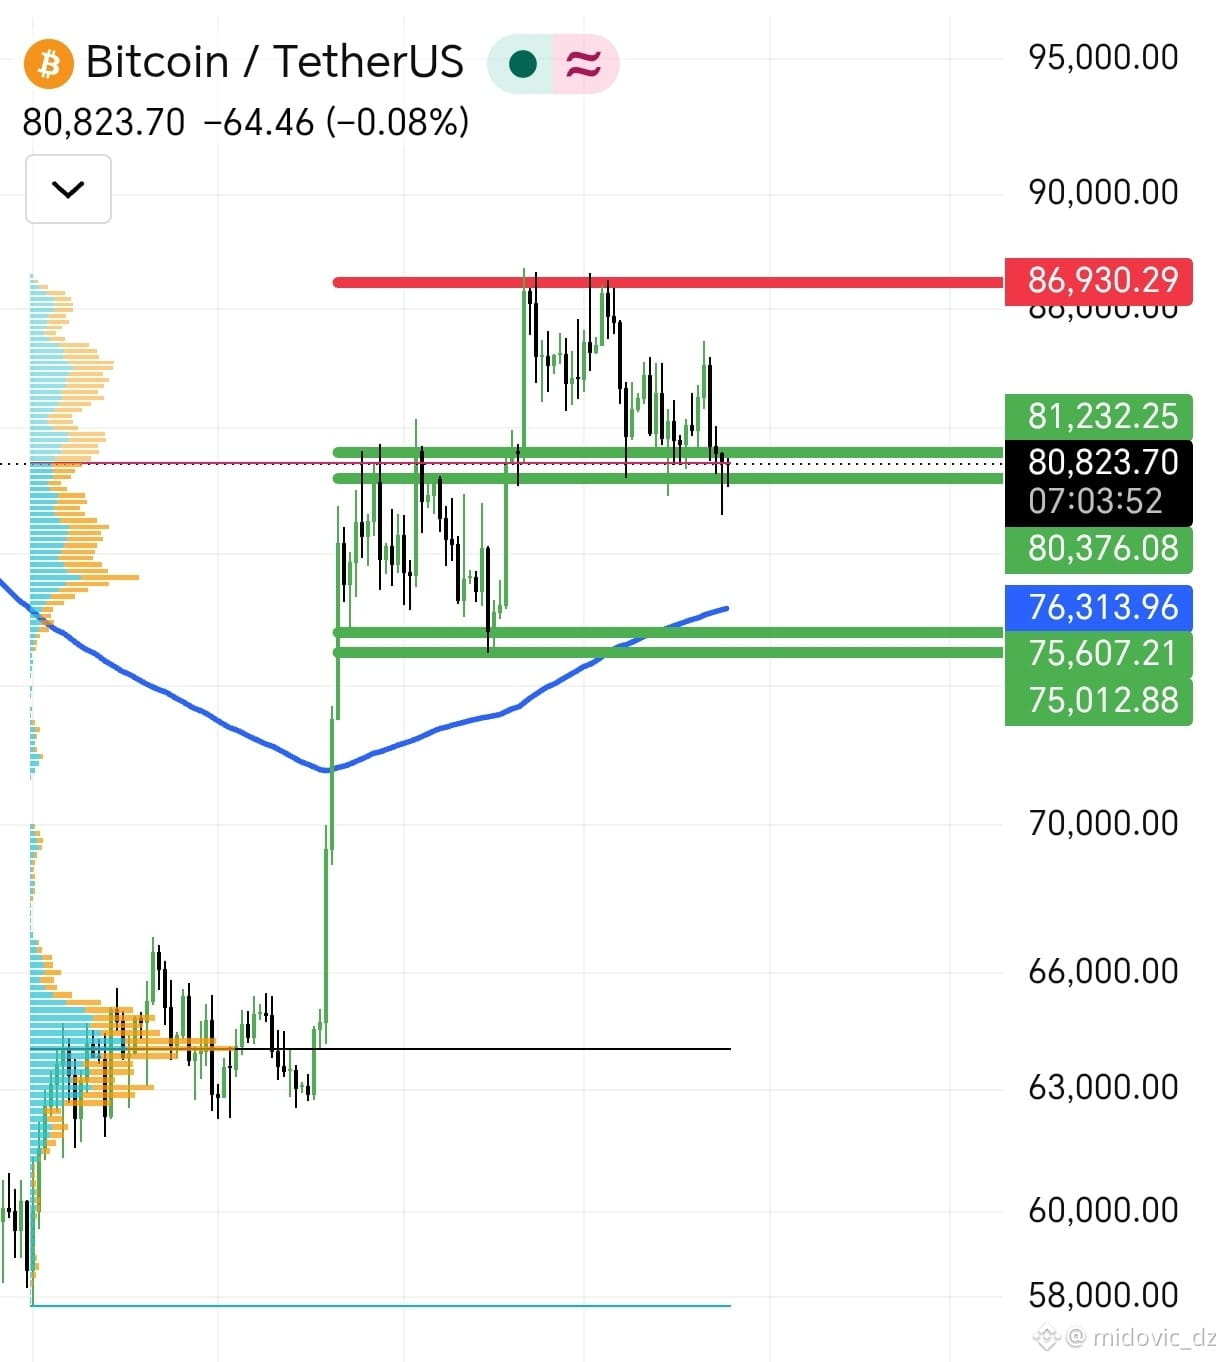
$TWT 😫😫
First possibility: ❌
Second possibility: 80٪
Third possibility: 20٪
What do you all think? 🤔
First possibility: ❌
Second possibility: 80٪
Third possibility: 20٪
What do you all think? 🤔
imad soukkou
·
--
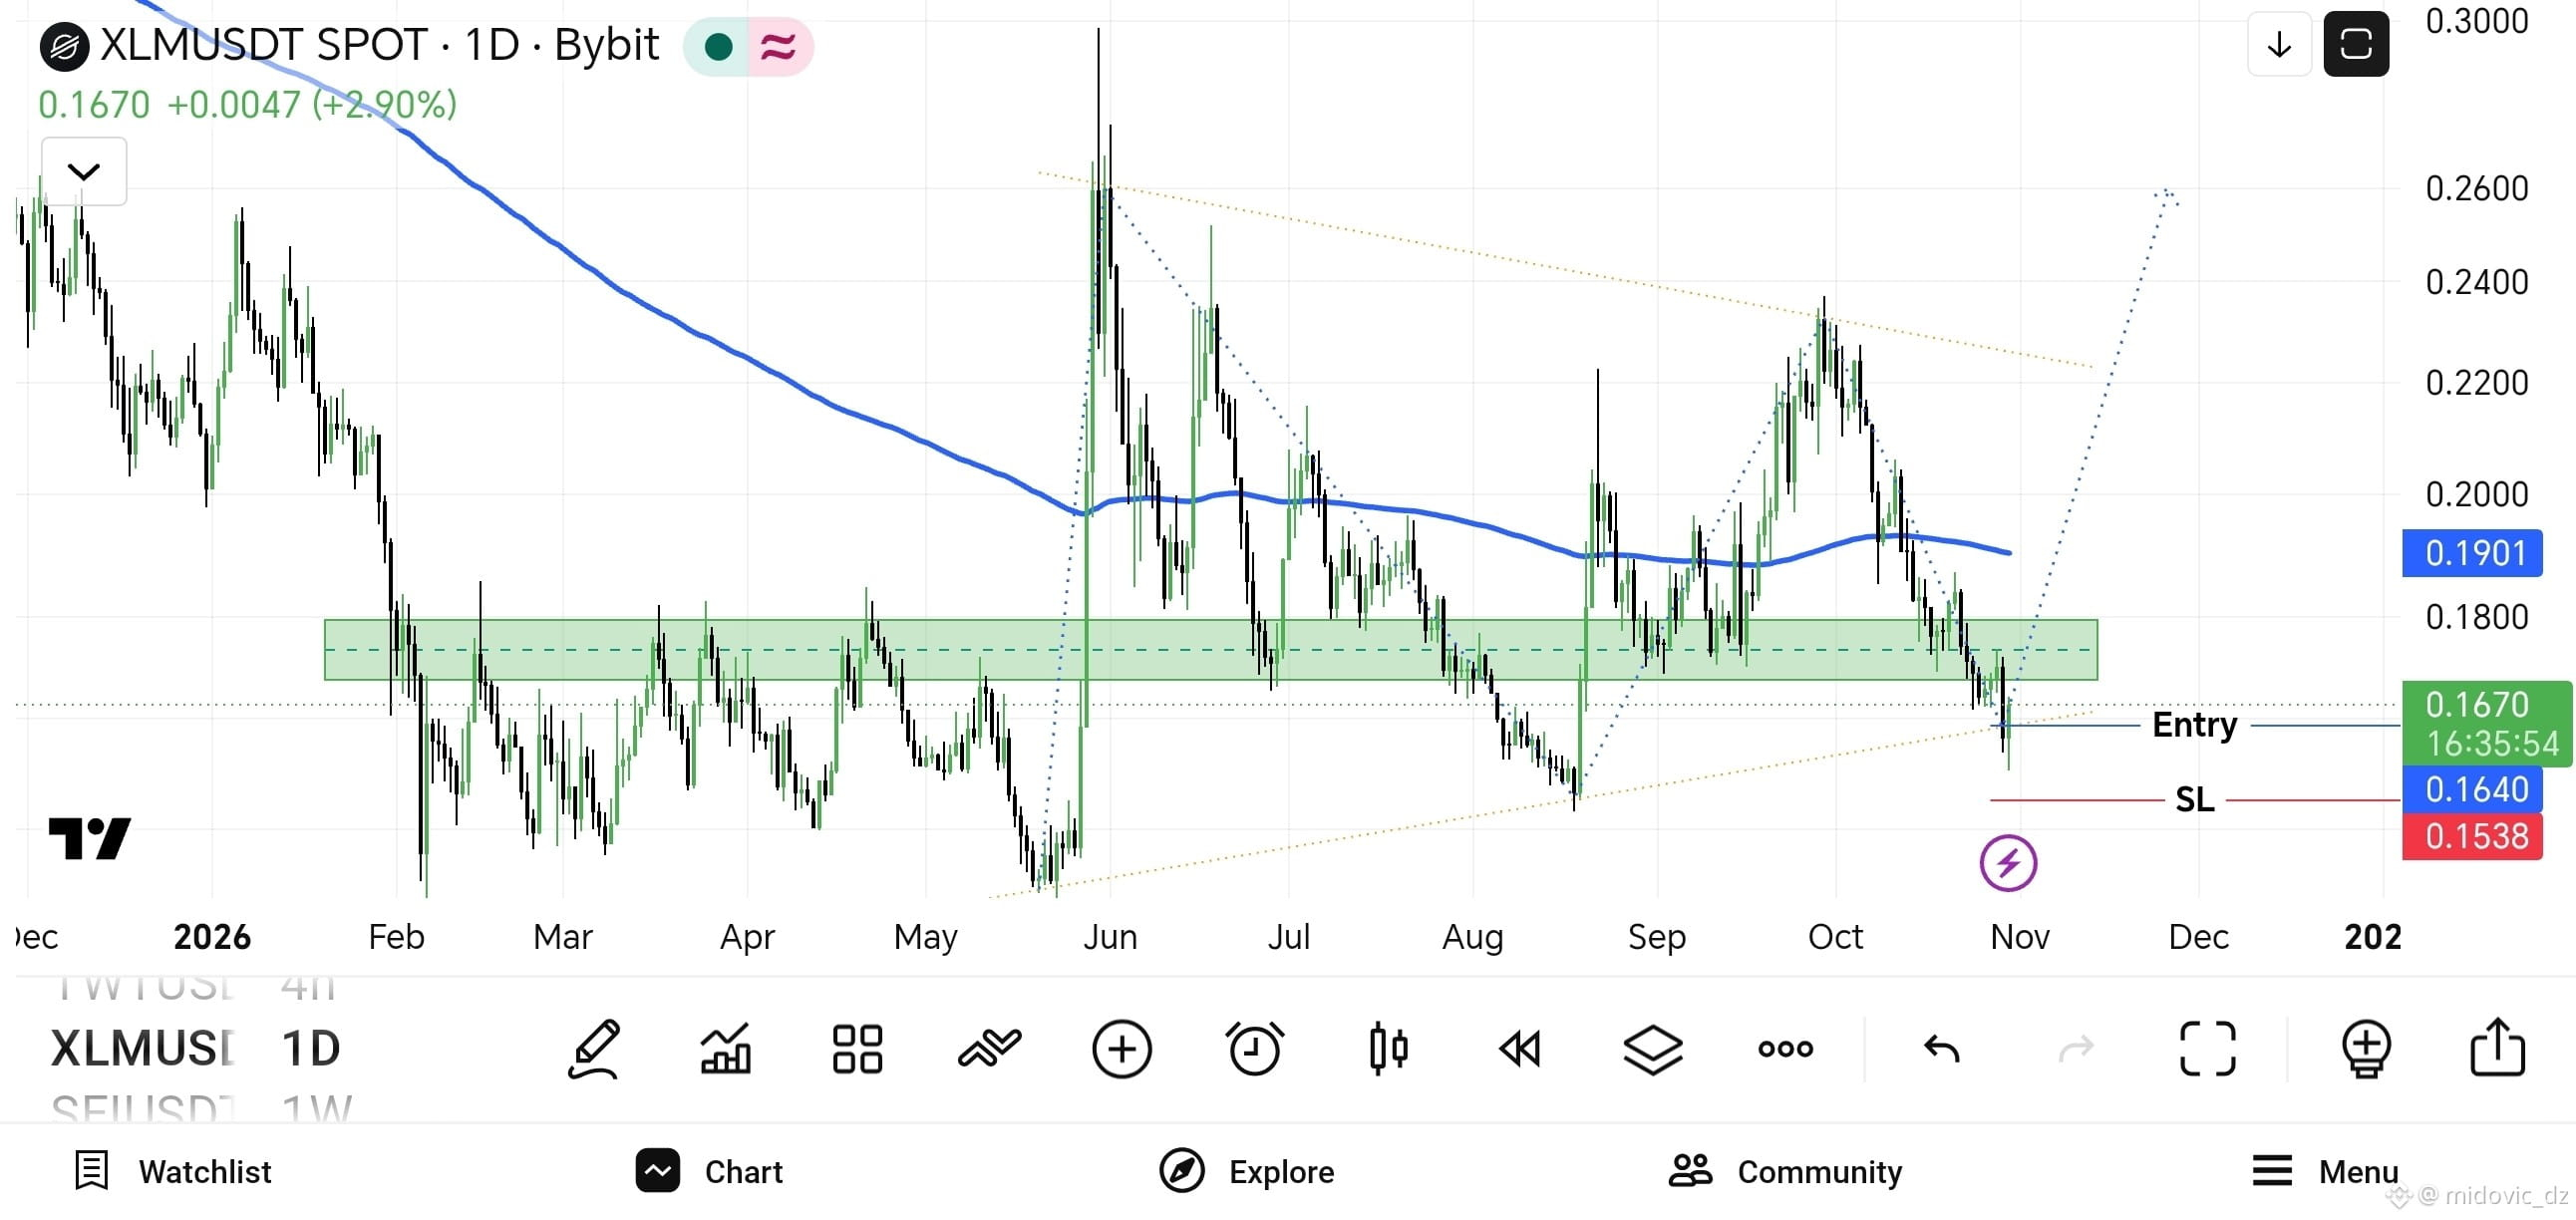
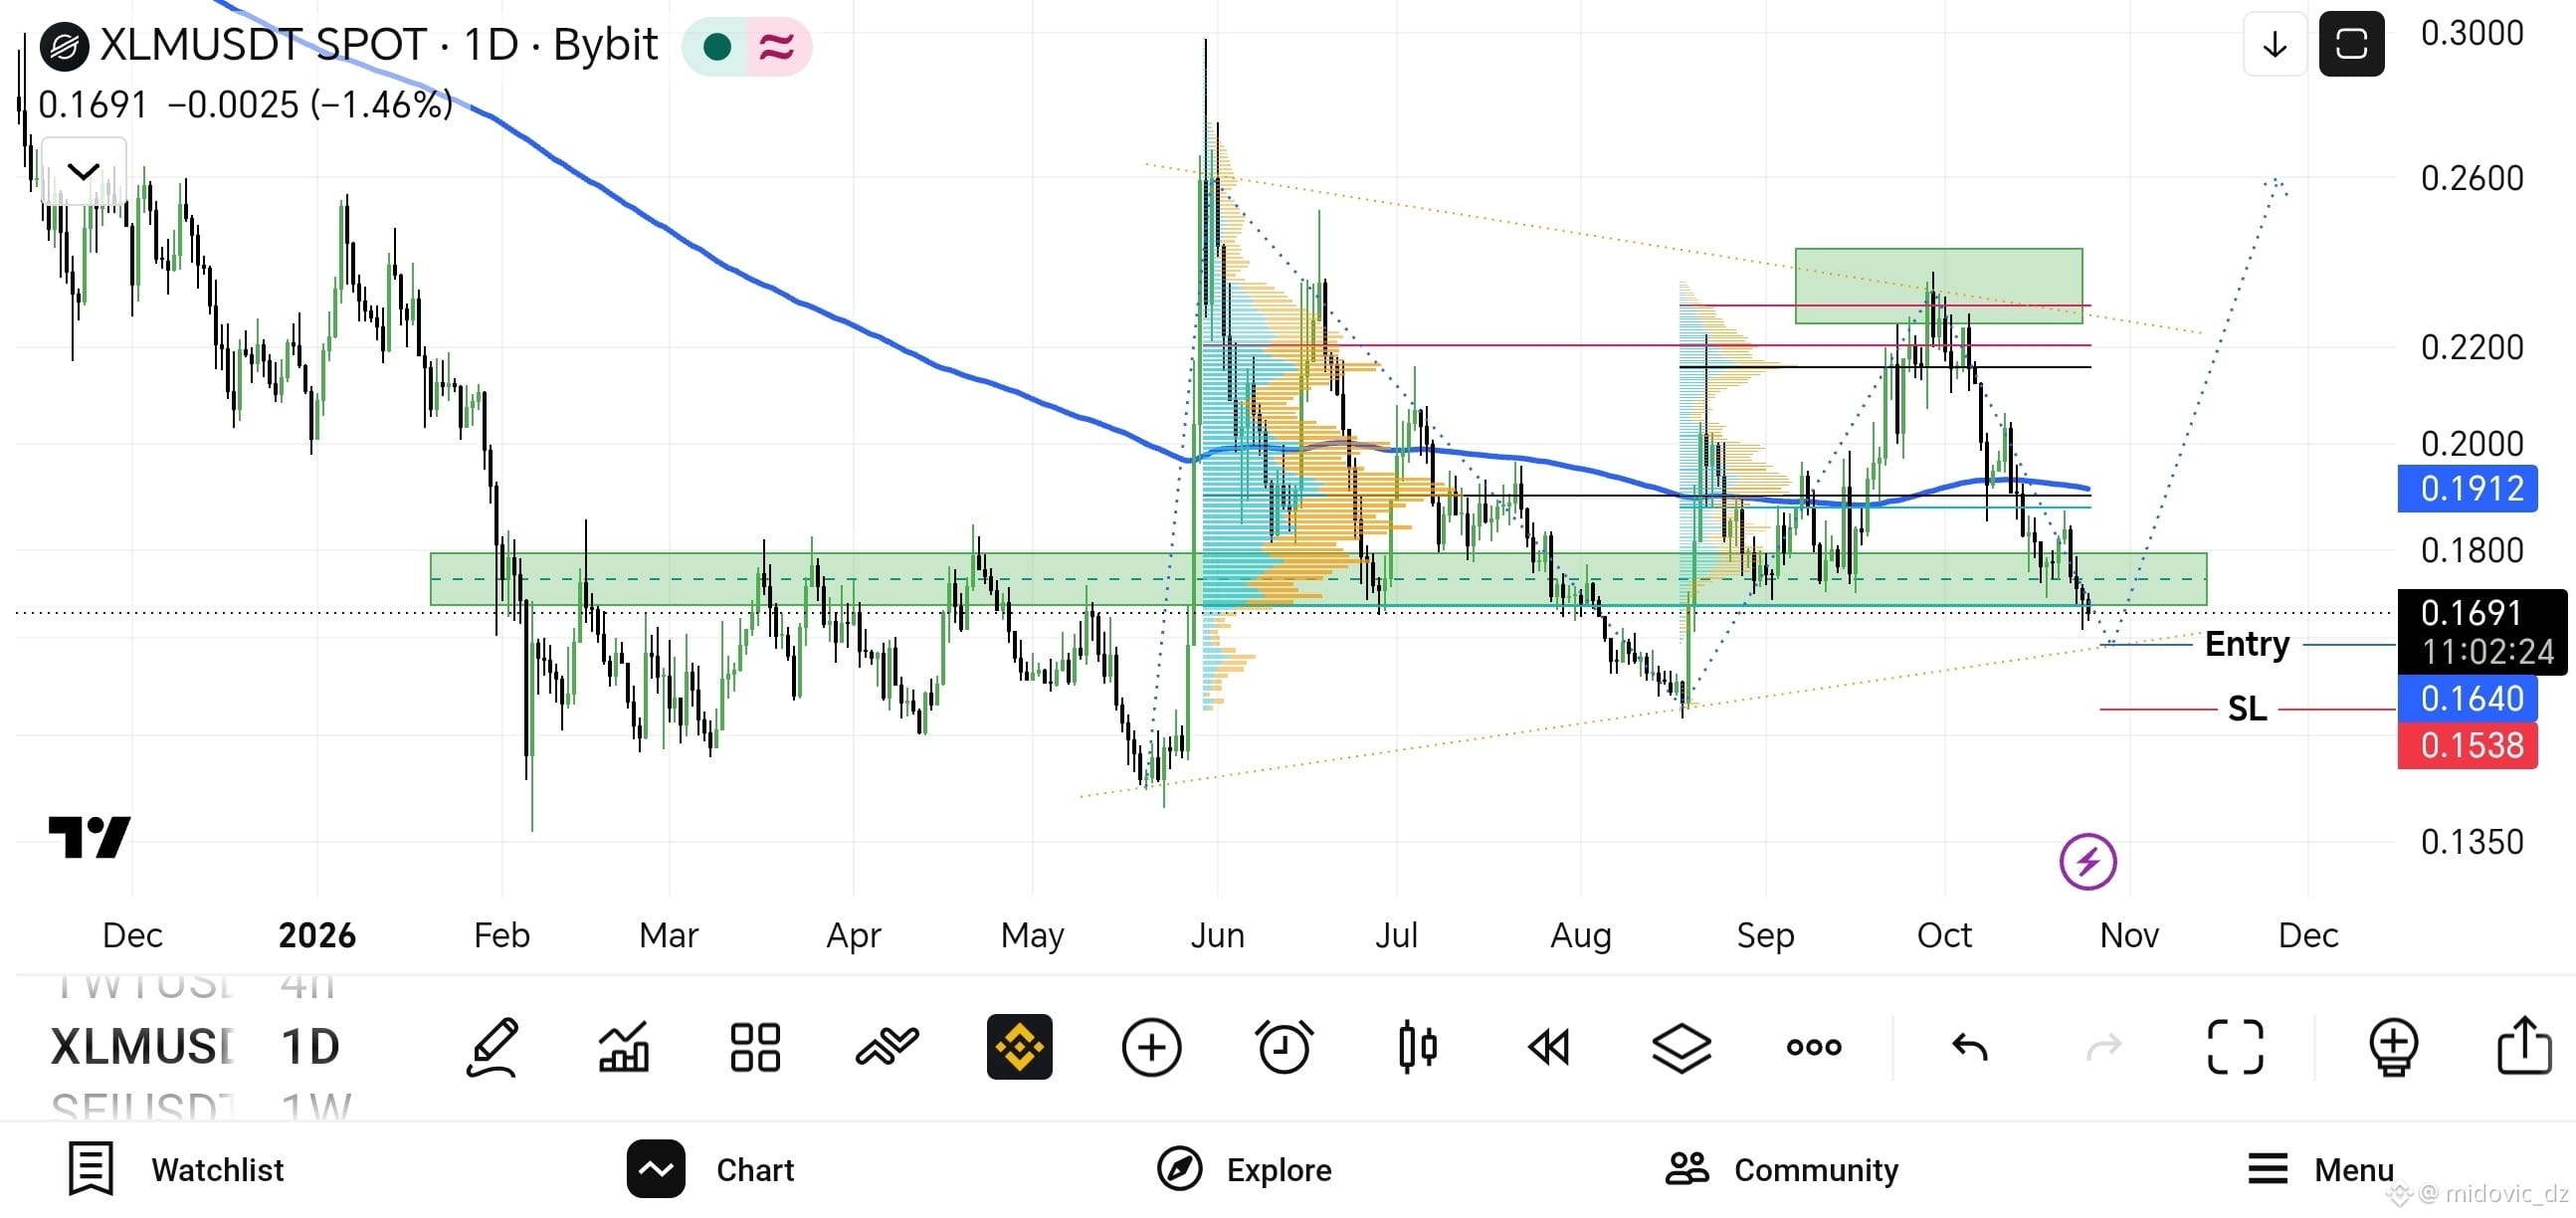
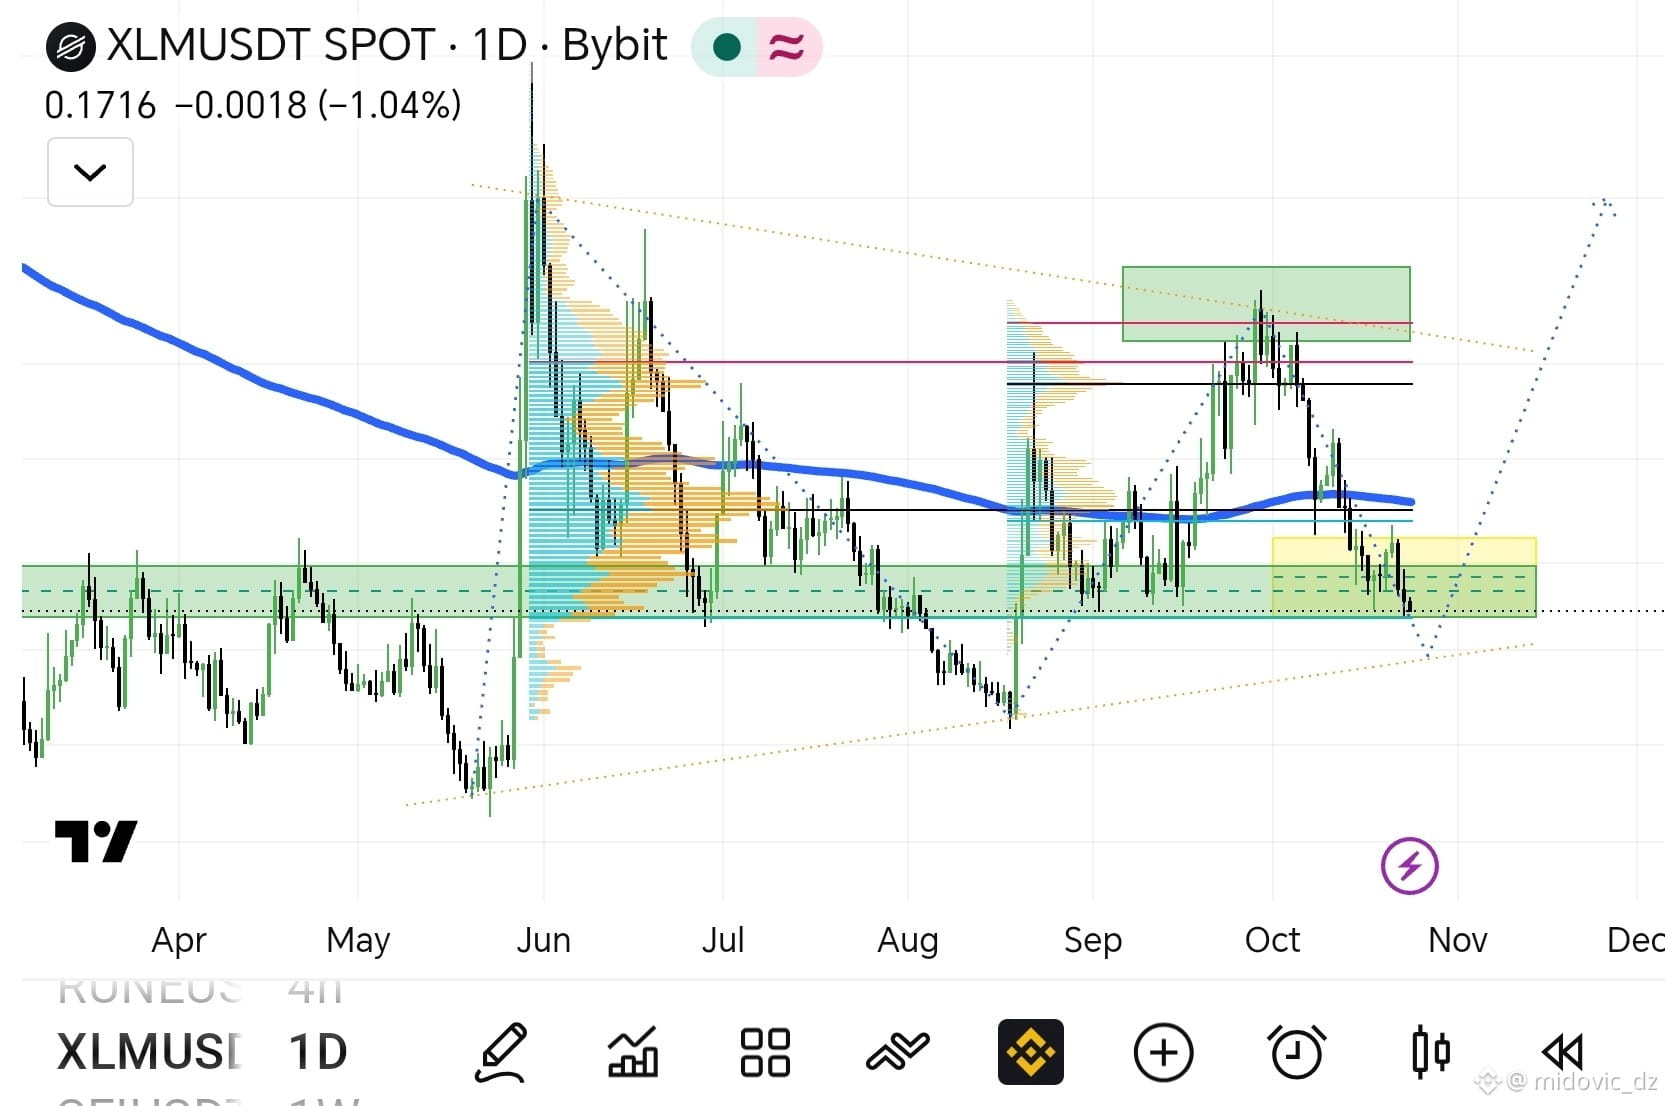
BullishQuick analysis of coin $XLM (Daily timeframe - 1D)
The coin is currently trading around $0.1716 amid calm price action and a test of an important support zone.
Current demand zone: The price is currently testing a notable key support range (shown in the yellow and green areas below the chart), which represents a historical liquidity cluster (Order Block / Support Zone) and could be a potential bounce point.
Moving averages: The price is moving near the main moving average (blue), reflecting a period of fluctuation as the market awaits a test of the next direction.
Target levels:
📉 If support breaks: We may see a retest of lower levels within the ascending channel.
📈 If the price bounces: The first target will be to break through nearby resistance and return to the upper trading range.
#BinancePick #EarningsSeason
The coin is currently trading around $0.1716 amid calm price action and a test of an important support zone.
Current demand zone: The price is currently testing a notable key support range (shown in the yellow and green areas below the chart), which represents a historical liquidity cluster (Order Block / Support Zone) and could be a potential bounce point.
Moving averages: The price is moving near the main moving average (blue), reflecting a period of fluctuation as the market awaits a test of the next direction.
Target levels:
📉 If support breaks: We may see a retest of lower levels within the ascending channel.
📈 If the price bounces: The first target will be to break through nearby resistance and return to the upper trading range.
#BinancePick #EarningsSeason
Log in to explore more content