
MEM973
527 Posts

MEM973
دارس علوم التحليل/ تحليل زمني ورقمي ـ موجي ـ SMC_ SK system _ ICT ـكلاسيكي ـ برايس أكشن ـ علم الايشيموكو
12.4K+ Following
5.0K+ Followers
2.3K+ Liked
Posts
All
Quotes
Live
PINNED
$BTW #BTWUSDT I think that the next rise will reach the level 0.6, and if it breaks through 0.77, then we will continue the rise to complete its uptrend cycle
MEM973
·
--
And indeed it worked, $BTW corrected with a strong correction.
I expect the coin to move within a sideways upward range, based on the current trend.
The absolute negativity is breaking the trend and closing a daily candle below the trend
I expect the coin to move within a sideways upward range, based on the current trend.
The absolute negativity is breaking the trend and closing a daily candle below the trend
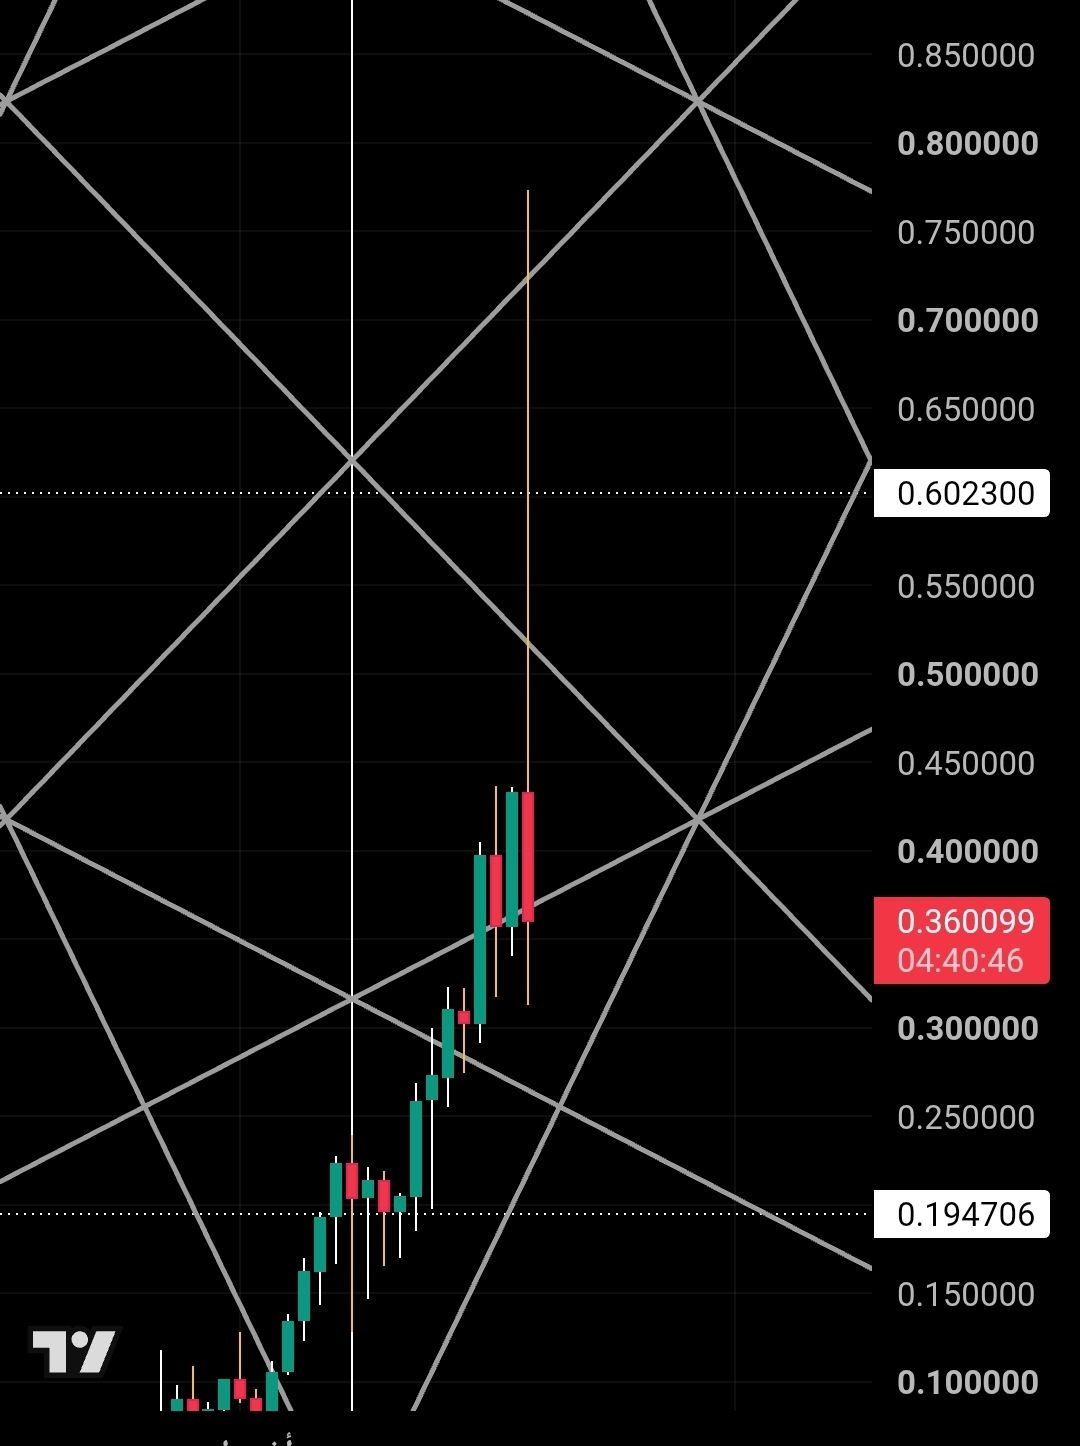
The coin $BTW started a correction from trend 1:1, and it had strong resistance.
I expected in the previous post that it would bounce from trend 1:2, and the scenario is still in place: the bounce from trend 1:2 would be at a price of 0.86.
I expected in the previous post that it would bounce from trend 1:2, and the scenario is still in place: the bounce from trend 1:2 would be at a price of 0.86.
MEM973
·
--
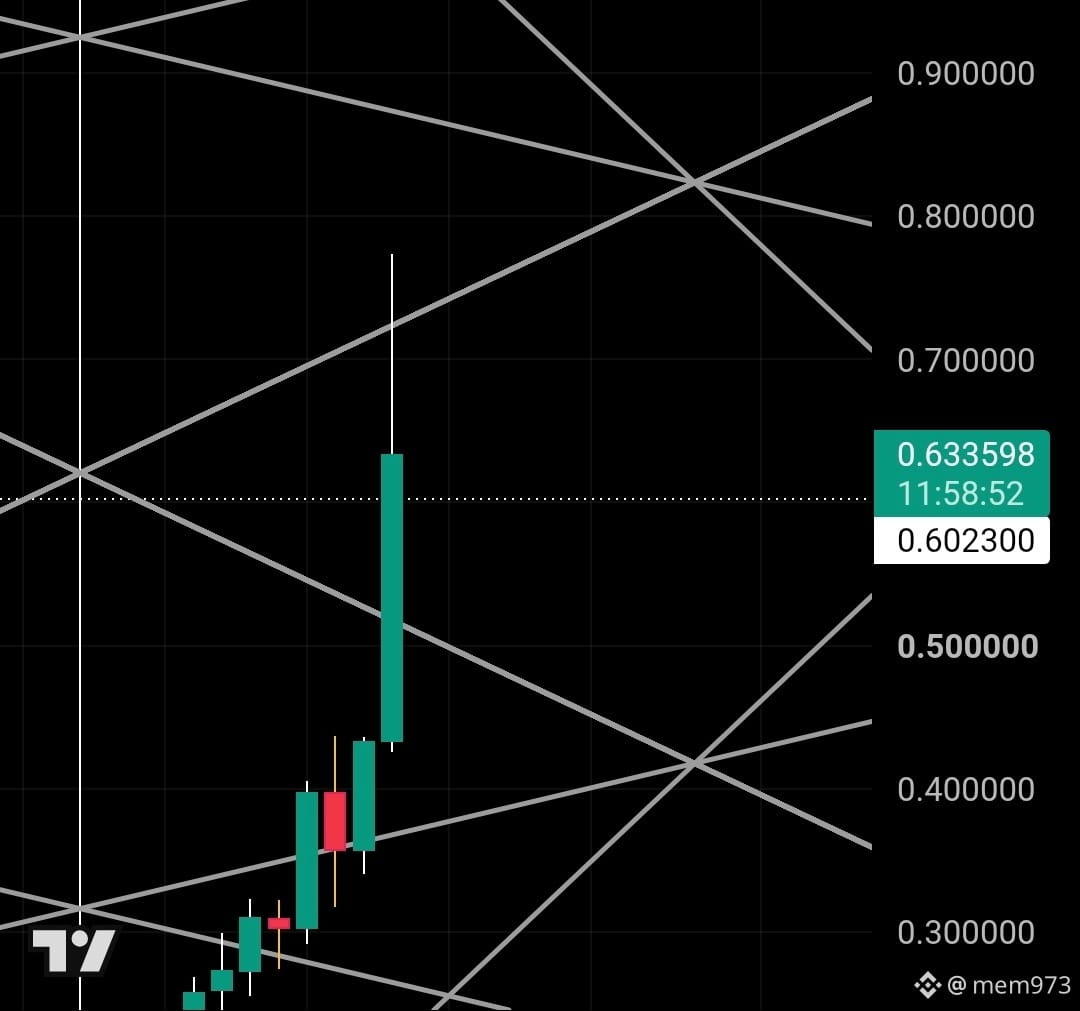
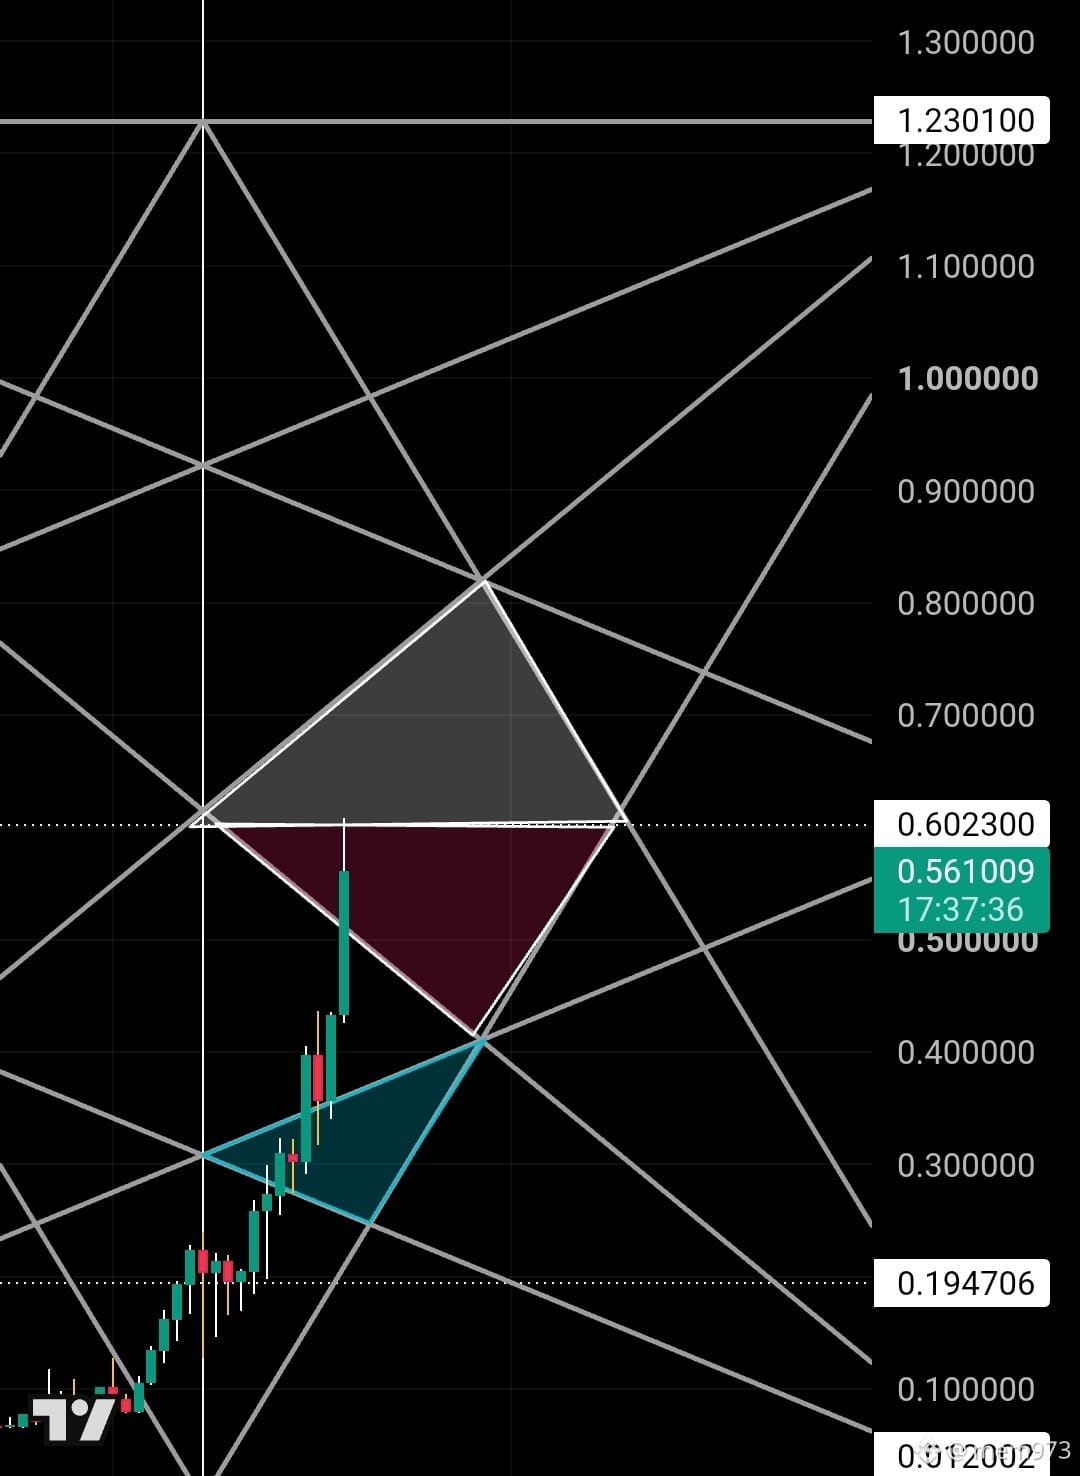
And indeed its performance $BTW #BTWUSDT⚡️ brought the target, the second one at 0.61 angle 120, and I was explaining that the coin would correct at price 0.29 to 0.28, but the coin stopped at correcting at 0.315.
And it rebounded from the second target with a strong candle, and this is the middle of the geometric shape.
I expect the deep correction from the red triangle zone going down to 0.49,
or the rise and rebound from the upper 1:2 trend to calm the speed and break 0=61,
or the rise until it hits 157 degrees at the end of the polygon at a price of 0.96, and the deep correction from there.
All of this will be determined by the close of a candle for 3 days or a week above or below the level 0.61.
Good luck,
And it rebounded from the second target with a strong candle, and this is the middle of the geometric shape.
I expect the deep correction from the red triangle zone going down to 0.49,
or the rise and rebound from the upper 1:2 trend to calm the speed and break 0=61,
or the rise until it hits 157 degrees at the end of the polygon at a price of 0.96, and the deep correction from there.
All of this will be determined by the close of a candle for 3 days or a week above or below the level 0.61.
Good luck,
And indeed its performance $BTW #BTWUSDT⚡️ brought the target, the second one at 0.61 angle 120, and I was explaining that the coin would correct at price 0.29 to 0.28, but the coin stopped at correcting at 0.315.
And it rebounded from the second target with a strong candle, and this is the middle of the geometric shape.
I expect the deep correction from the red triangle zone going down to 0.49,
or the rise and rebound from the upper 1:2 trend to calm the speed and break 0=61,
or the rise until it hits 157 degrees at the end of the polygon at a price of 0.96, and the deep correction from there.
All of this will be determined by the close of a candle for 3 days or a week above or below the level 0.61.
Good luck,
And it rebounded from the second target with a strong candle, and this is the middle of the geometric shape.
I expect the deep correction from the red triangle zone going down to 0.49,
or the rise and rebound from the upper 1:2 trend to calm the speed and break 0=61,
or the rise until it hits 157 degrees at the end of the polygon at a price of 0.96, and the deep correction from there.
All of this will be determined by the close of a candle for 3 days or a week above or below the level 0.61.
Good luck,
MEM973
·
--
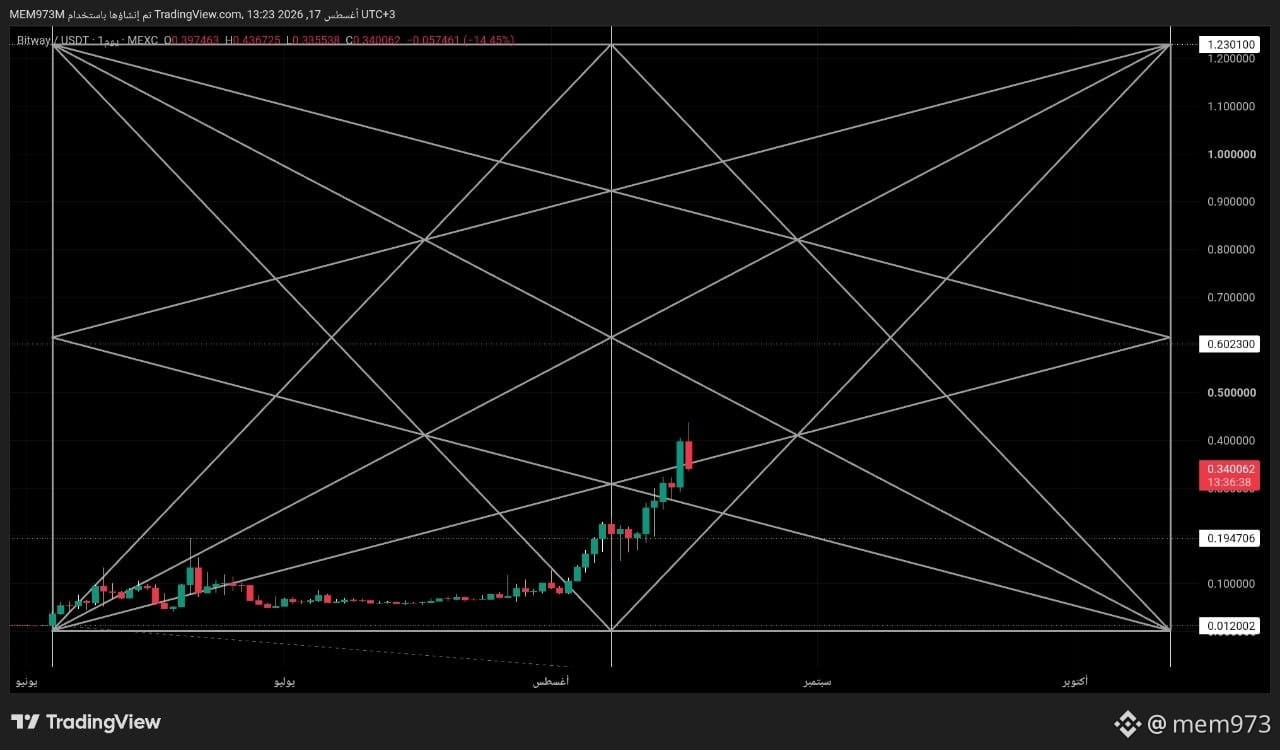
Analysis of trade $BTW #btwusdt using time analysis
The deal began forming the cluster with the letter N, and in line with the time interval it started from a price of 0.012 up to 0.19 at an angle of 60
The coin/asset took on a three-dimensional geometric shape
Second target 0.61 at an angle of 120
Final target 1.23 at an angle of 180
The asset has selling pressure, due to resistance 0.41 at the bottom of the crystal
Midpoint of the geometric shape: at an angle of 90 at a price of 0.37
Midpoint of the geometric shape roughly standardizes at 0.61 at an angle of 120
The geometric shape is supposed to end at an angle of 180, but it’s possible the asset breaks/extends with a larger displacement and completes a full cycle of 360, which would be at 4.4—and I don’t rule out it being an Alpha wave/coin
The important part is that the asset should complete its correction at 0.29–0.28
Angle 72
I analyzed it only because I saw that some people were getting a bad result due to the coin’s death/death move and because of the risky nature of the futures
Good luck
The deal began forming the cluster with the letter N, and in line with the time interval it started from a price of 0.012 up to 0.19 at an angle of 60
The coin/asset took on a three-dimensional geometric shape
Second target 0.61 at an angle of 120
Final target 1.23 at an angle of 180
The asset has selling pressure, due to resistance 0.41 at the bottom of the crystal
Midpoint of the geometric shape: at an angle of 90 at a price of 0.37
Midpoint of the geometric shape roughly standardizes at 0.61 at an angle of 120
The geometric shape is supposed to end at an angle of 180, but it’s possible the asset breaks/extends with a larger displacement and completes a full cycle of 360, which would be at 4.4—and I don’t rule out it being an Alpha wave/coin
The important part is that the asset should complete its correction at 0.29–0.28
Angle 72
I analyzed it only because I saw that some people were getting a bad result due to the coin’s death/death move and because of the risky nature of the futures
Good luck
Analysis of trade $BTW #btwusdt using time analysis
The deal began forming the cluster with the letter N, and in line with the time interval it started from a price of 0.012 up to 0.19 at an angle of 60
The coin/asset took on a three-dimensional geometric shape
Second target 0.61 at an angle of 120
Final target 1.23 at an angle of 180
The asset has selling pressure, due to resistance 0.41 at the bottom of the crystal
Midpoint of the geometric shape: at an angle of 90 at a price of 0.37
Midpoint of the geometric shape roughly standardizes at 0.61 at an angle of 120
The geometric shape is supposed to end at an angle of 180, but it’s possible the asset breaks/extends with a larger displacement and completes a full cycle of 360, which would be at 4.4—and I don’t rule out it being an Alpha wave/coin
The important part is that the asset should complete its correction at 0.29–0.28
Angle 72
I analyzed it only because I saw that some people were getting a bad result due to the coin’s death/death move and because of the risky nature of the futures
Good luck
The deal began forming the cluster with the letter N, and in line with the time interval it started from a price of 0.012 up to 0.19 at an angle of 60
The coin/asset took on a three-dimensional geometric shape
Second target 0.61 at an angle of 120
Final target 1.23 at an angle of 180
The asset has selling pressure, due to resistance 0.41 at the bottom of the crystal
Midpoint of the geometric shape: at an angle of 90 at a price of 0.37
Midpoint of the geometric shape roughly standardizes at 0.61 at an angle of 120
The geometric shape is supposed to end at an angle of 180, but it’s possible the asset breaks/extends with a larger displacement and completes a full cycle of 360, which would be at 4.4—and I don’t rule out it being an Alpha wave/coin
The important part is that the asset should complete its correction at 0.29–0.28
Angle 72
I analyzed it only because I saw that some people were getting a bad result due to the coin’s death/death move and because of the risky nature of the futures
Good luck
Hello everyone
I will explain soon this theory of the technical analysis with a special trading school and more than one strategy
The explanation will be in the meeting
Who is ready to raise their level?
I will explain soon this theory of the technical analysis with a special trading school and more than one strategy
The explanation will be in the meeting
Who is ready to raise their level?
Light me up in a Binance chat room
إنضمام
إنضمام

Bitcoin Status Update #BTC
I believe Bitcoin isn't going to change the overall bearish trend, and that the climb will continue to the $68k level. If we break through $68k with strong momentum, the rise will continue towards resistance at $71,500. However, I'm ruling out that scenario since I anticipate a correction from the $68k level, followed by a retest to attempt breaking $68k again, and then forming a bearish pattern to continue the downtrend #BTC
I believe Bitcoin isn't going to change the overall bearish trend, and that the climb will continue to the $68k level. If we break through $68k with strong momentum, the rise will continue towards resistance at $71,500. However, I'm ruling out that scenario since I anticipate a correction from the $68k level, followed by a retest to attempt breaking $68k again, and then forming a bearish pattern to continue the downtrend #BTC
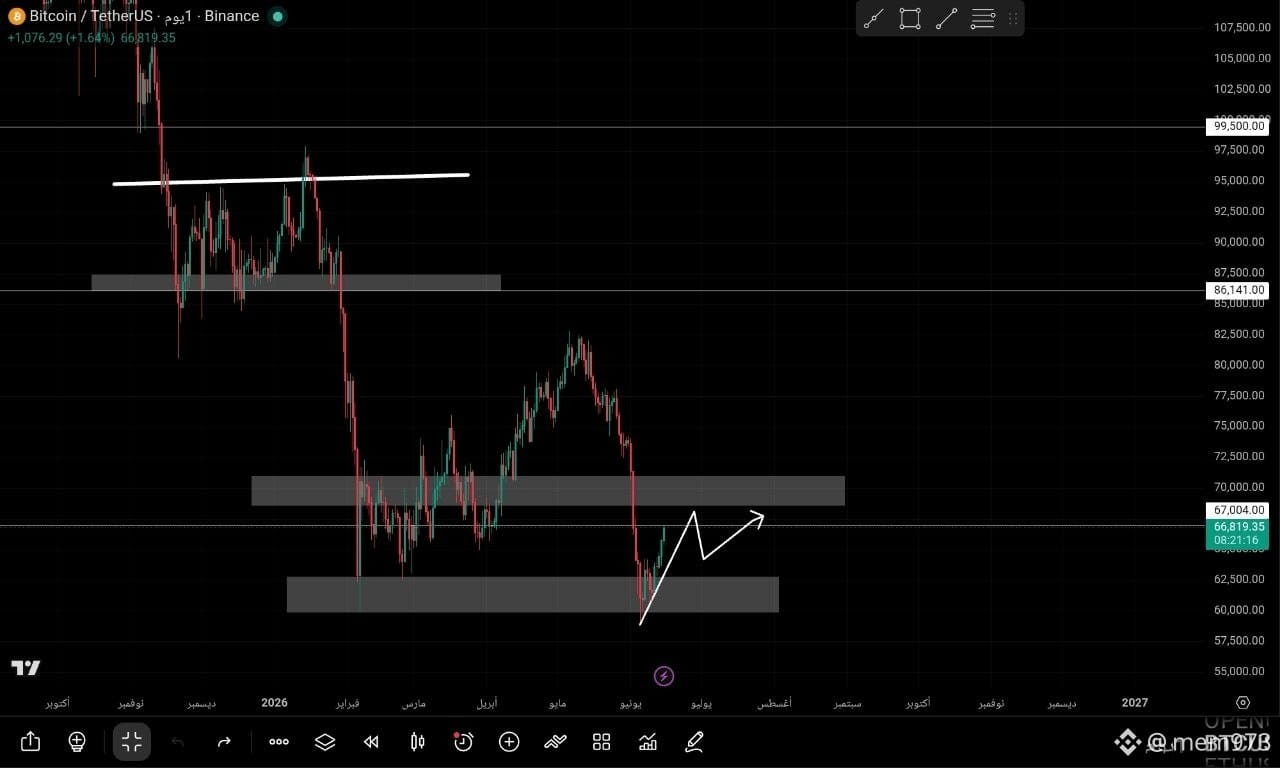
Wishing you all the best every year, with good health, peace, happiness, and abundance.
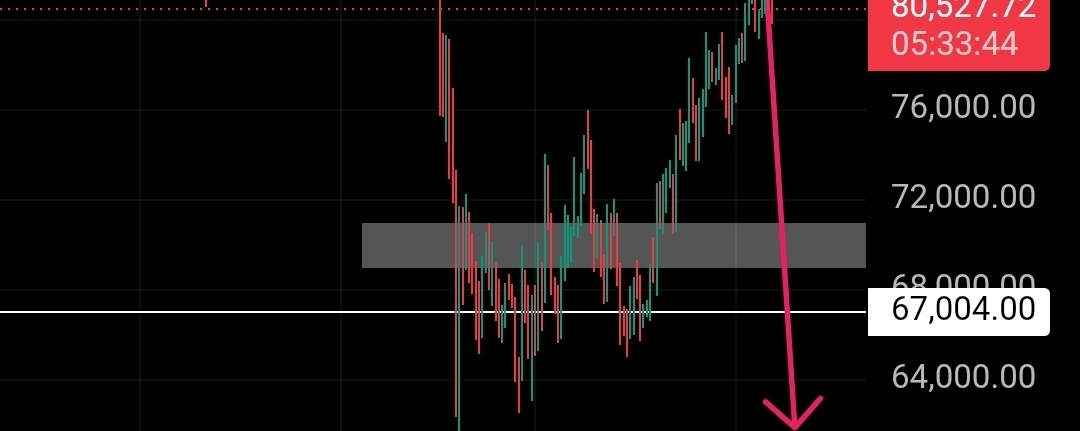
In the case of the price, it will continue to rise positively at 77100 and bounce back from there
MEM973
·
--
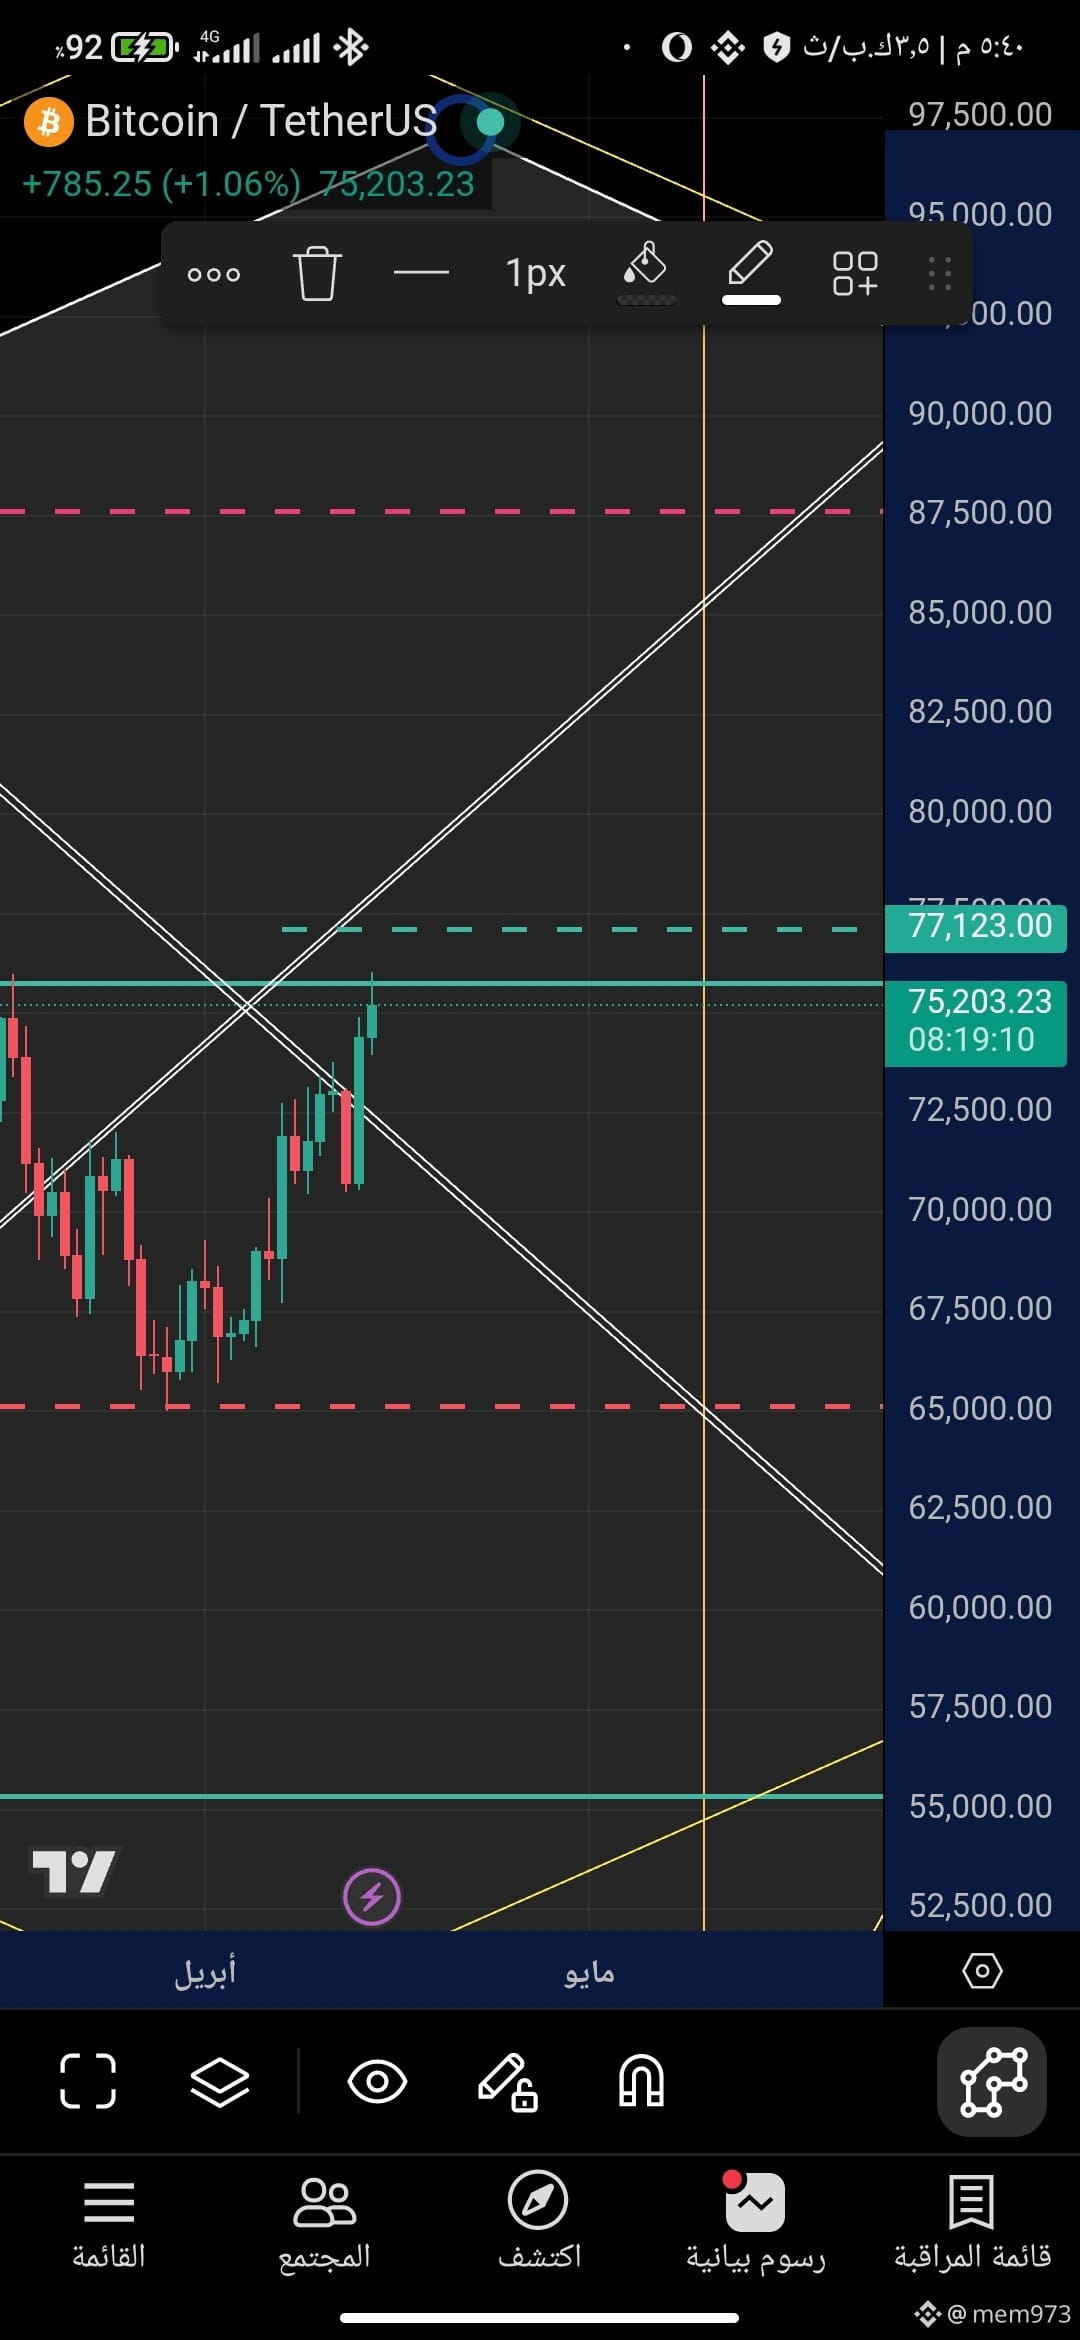
Bitcoin Status Update / The Slip is Coming
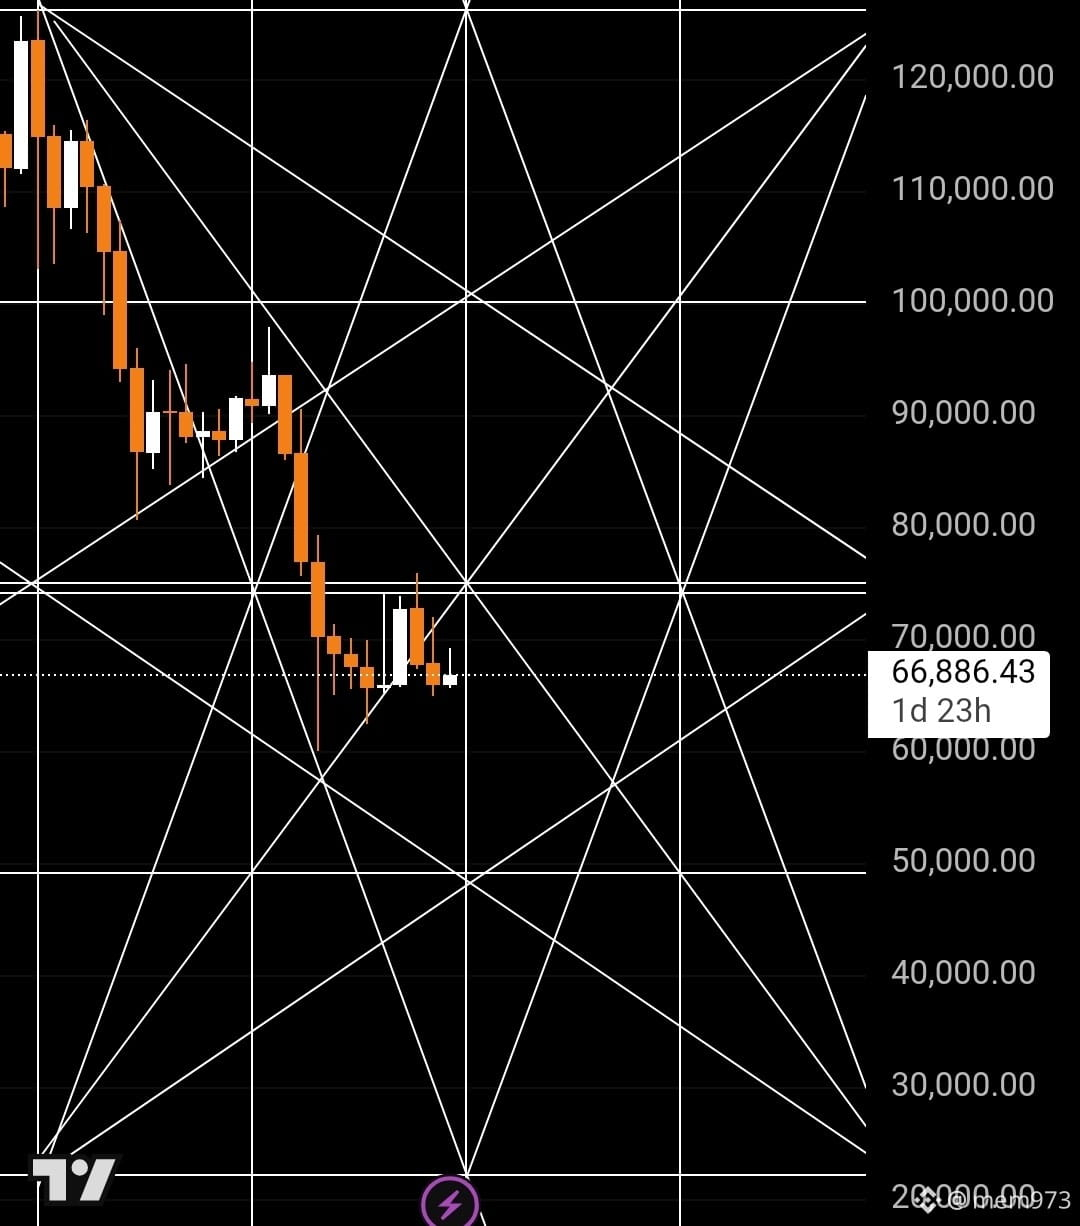
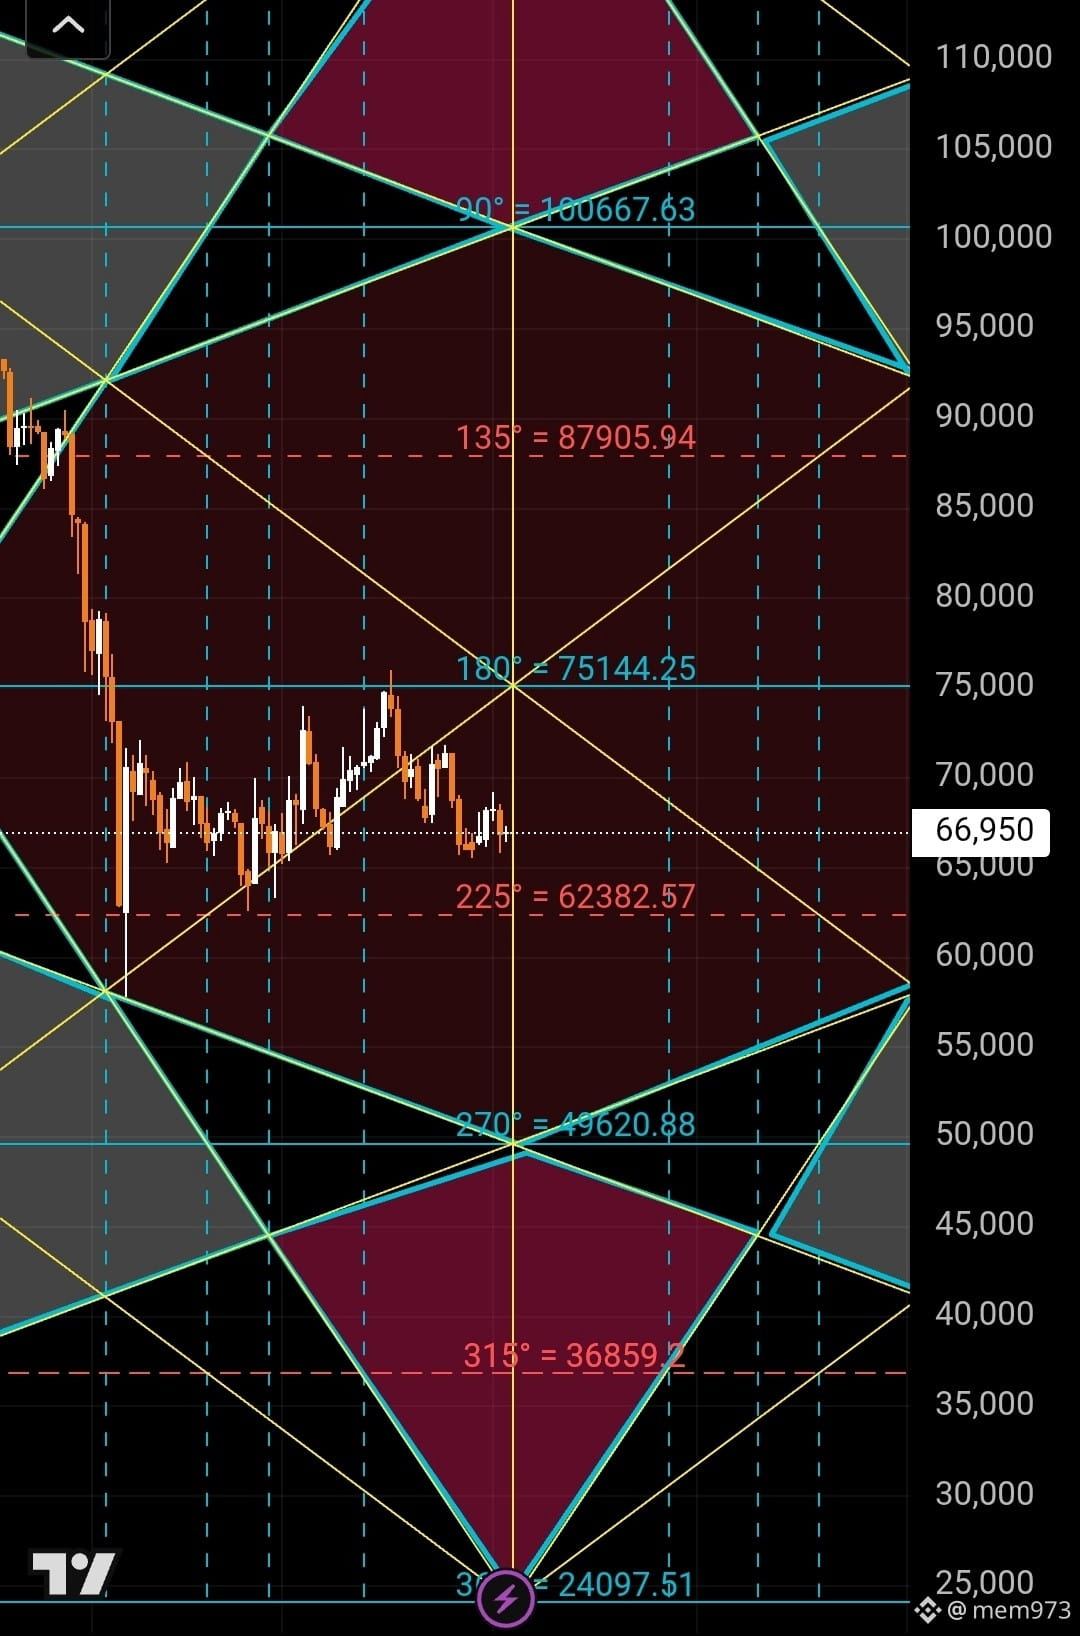
Now Bitcoin #BTC broke the 1:1 trend and interacted with it with a slip at first and then broke it.
I'm not convinced about the rise because the price can't act with a bump since there are 2 important angle supports at 144 which are at a price of 75700 and a 1:1 trend above it.
The slip should first break 65 thousand and interact with the time frame to reach a price of 55 thousand by the arrival time of May 10, meaning that the current trend will be broken.
I'm not convinced about the rise because the price can't act with a bump since there are 2 important angle supports at 144 which are at a price of 75700 and a 1:1 trend above it.
The slip should first break 65 thousand and interact with the time frame to reach a price of 55 thousand by the arrival time of May 10, meaning that the current trend will be broken.
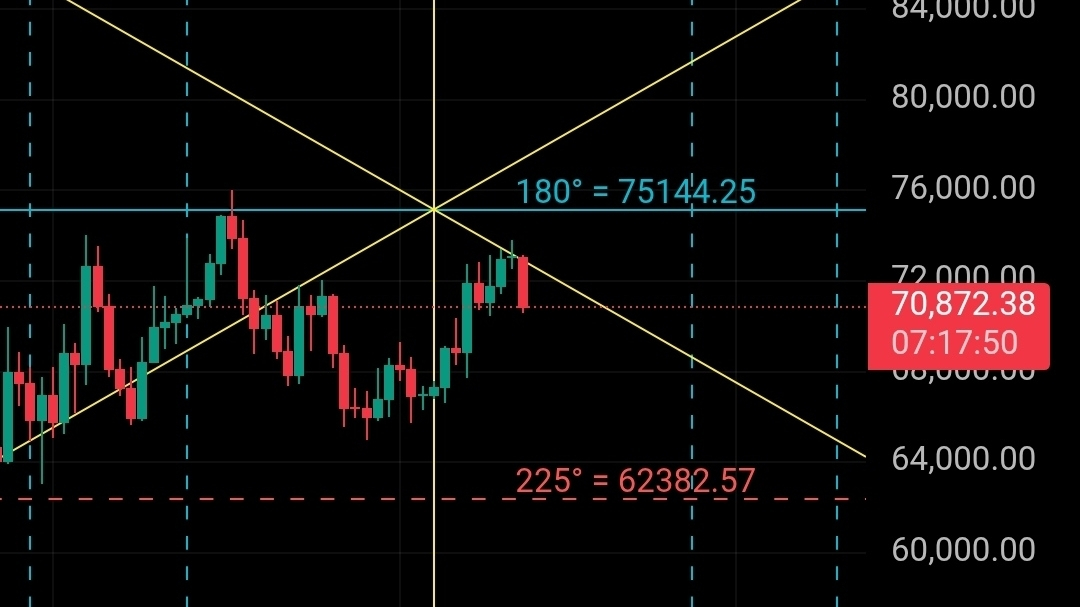
The currency may retest 0.03155 and it may be broken.
MEM973
·
--
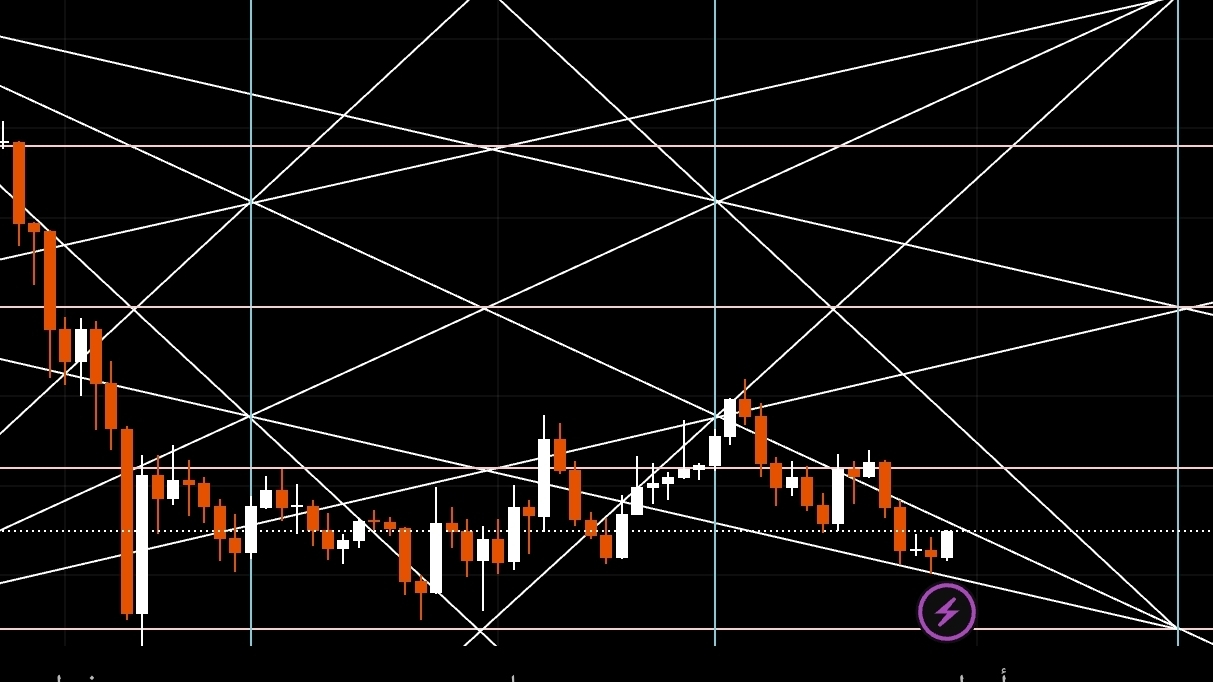
Currency $pippin #PİPPİN Alpha and Spot Other Platforms The important thing is I believe that the currency has ended its negativity when it reached the level of 0.03155 and has very strong targets at the level of 0.13 The time analysis and the harmonic, but for the positive model in the time analysis to be activated, level 0.0486 must be breached, and for the positivity in the harmonic to be activated, the trend of the model must be breached. Currently, it is necessary to stabilize above the level of 0.03155 and start positivity by breaking through 0.0486.
Currency $pippin #PİPPİN Alpha and Spot Other Platforms The important thing is I believe that the currency has ended its negativity when it reached the level of 0.03155 and has very strong targets at the level of 0.13 The time analysis and the harmonic, but for the positive model in the time analysis to be activated, level 0.0486 must be breached, and for the positivity in the harmonic to be activated, the trend of the model must be breached. Currently, it is necessary to stabilize above the level of 0.03155 and start positivity by breaking through 0.0486.
Hello, peace be upon you
I have a feature opened for me on Binance, which is that I can open a group
I created the group, you can enlighten me from here #BTC
I have a feature opened for me on Binance, which is that I can open a group
I created the group, you can enlighten me from here #BTC

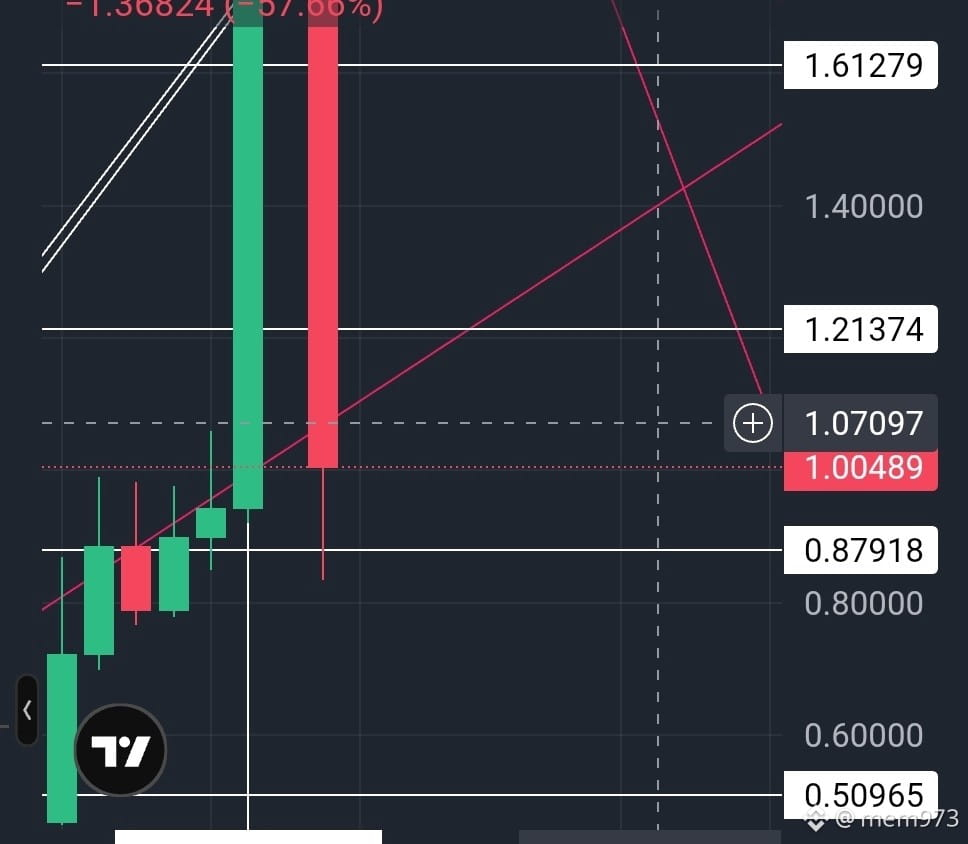
Currency $SIREN #siren must close a candle today at 1=092 and is based on the red trend because it cannot go outside the star. If it closes below the trend, we will continue the collapse.
Log in to explore more content