
trader berlin
482 Posts

trader berlin
Report
Block User
67k
140k
37k
High-Frequency Trader
5.7 Years
84 Following
119 Followers
360 Liked
Posts
All
Quotes
·
--
Bullish
$WLD
🚀 CAN WLD RISE 15%?
💰 Strong capital inflows
📈 Buyers are regaining control
🎯 Target: US$ 0.65
WLDUSDT
Article caption:
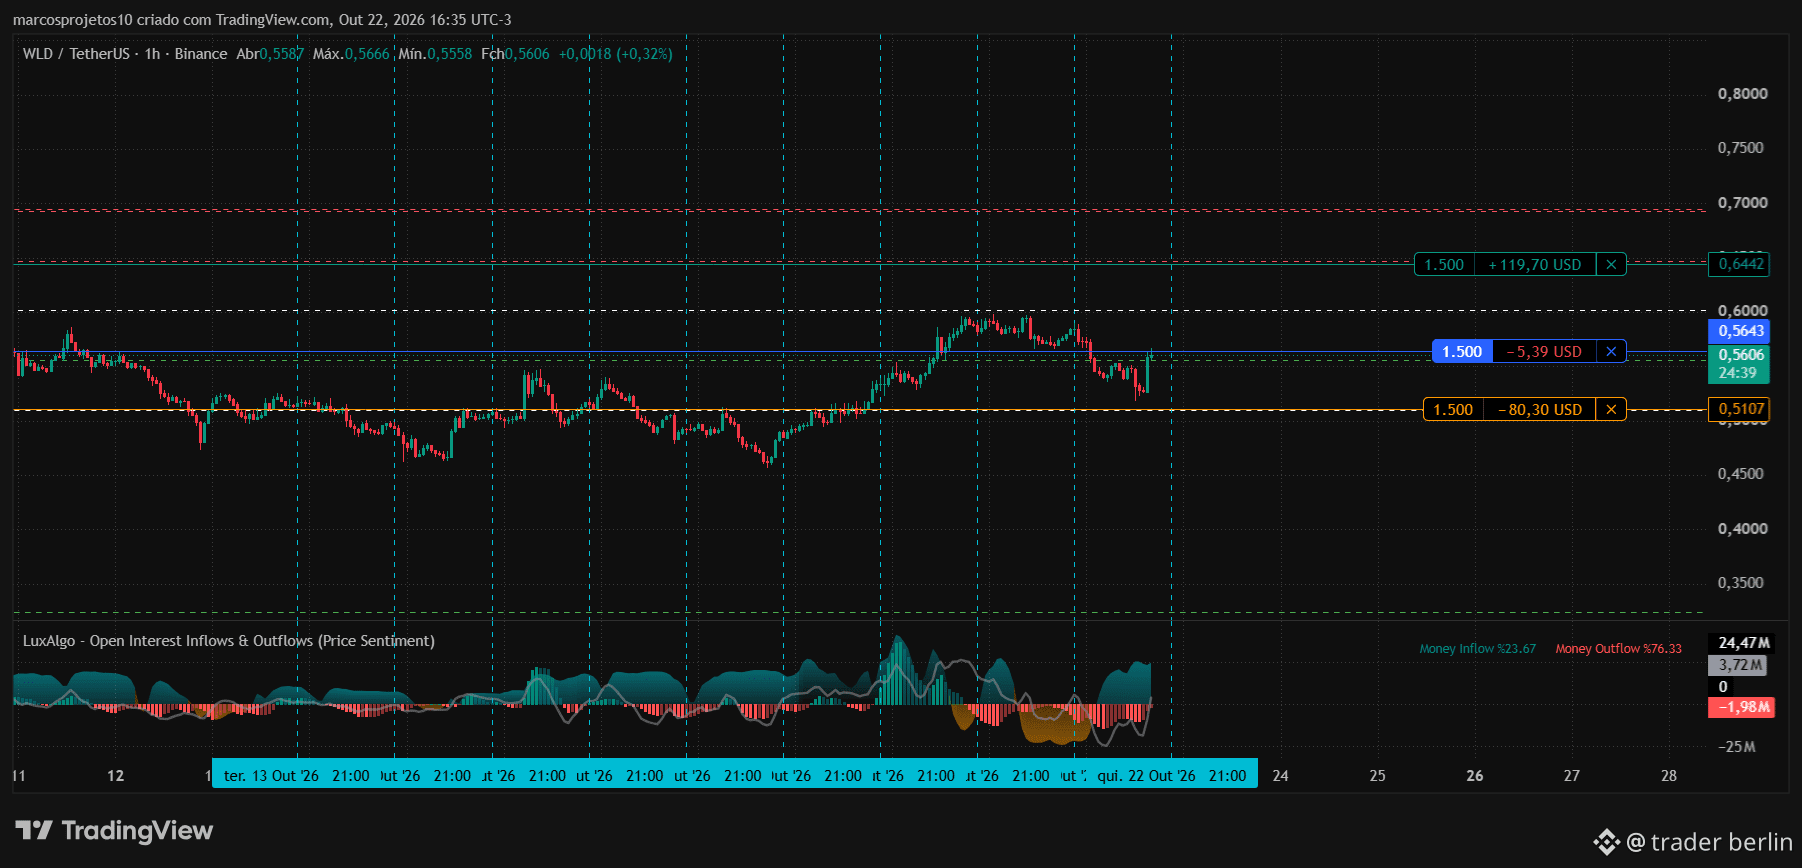
🚀 WLD eyes 15% gain after strong capital inflows
Worldcoin (WLD) has shown renewed buying strength after defending support at US$ 0.54 and recording an increase in capital flows.
📈 The price is trying to break above the US$ 0.57 area, which could open the way for a move toward US$ 0.65.
🎯 Targets: ✅ US$ 0.60
✅ US$ 0.65 (+15%)
⚠️ In the short term, a drop below US$ 0.54 could weaken the bullish outlook.
#WLD #Worldcoin #WLDUSDT #Binance #BinanceSquare #Crypto #Cryptocurrencies #Altcoins #Trading #Bullish #CryptoNews #Bitcoin #Ethereum #PriceAction #OpenInterest #Investments #CryptoBrazil
{future}(WLDUSDT)
$WLD
🚀 CAN WLD RISE 15%?
💰 Strong capital inflows
📈 Buyers are regaining control
🎯 Target: US$ 0.65
WLDUSDT
Article caption:
🚀 WLD eyes 15% gain after strong capital inflows
Worldcoin (WLD) has shown renewed buying strength after defending support at US$ 0.54 and recording an increase in capital flows.
📈 The price is trying to break above the US$ 0.57 area, which could open the way for a move toward US$ 0.65.
🎯 Targets: ✅ US$ 0.60
✅ US$ 0.65 (+15%)
⚠️ In the short term, a drop below US$ 0.54 could weaken the bullish outlook.
#WLD #Worldcoin #WLDUSDT #Binance #BinanceSquare #Crypto #Cryptocurrencies #Altcoins #Trading #Bullish #CryptoNews #Bitcoin #Ethereum #PriceAction #OpenInterest #Investments #CryptoBrazil
🚀 CAN WLD RISE 15%?
💰 Strong capital inflows
📈 Buyers are regaining control
🎯 Target: US$ 0.65
WLDUSDT
Article caption:
🚀 WLD eyes 15% gain after strong capital inflows
Worldcoin (WLD) has shown renewed buying strength after defending support at US$ 0.54 and recording an increase in capital flows.
📈 The price is trying to break above the US$ 0.57 area, which could open the way for a move toward US$ 0.65.
🎯 Targets: ✅ US$ 0.60
✅ US$ 0.65 (+15%)
⚠️ In the short term, a drop below US$ 0.54 could weaken the bullish outlook.
#WLD #Worldcoin #WLDUSDT #Binance #BinanceSquare #Crypto #Cryptocurrencies #Altcoins #Trading #Bullish #CryptoNews #Bitcoin #Ethereum #PriceAction #OpenInterest #Investments #CryptoBrazil
170
·
--
Bullish
....
....
trader berlin
·
--
Bullish$BTC
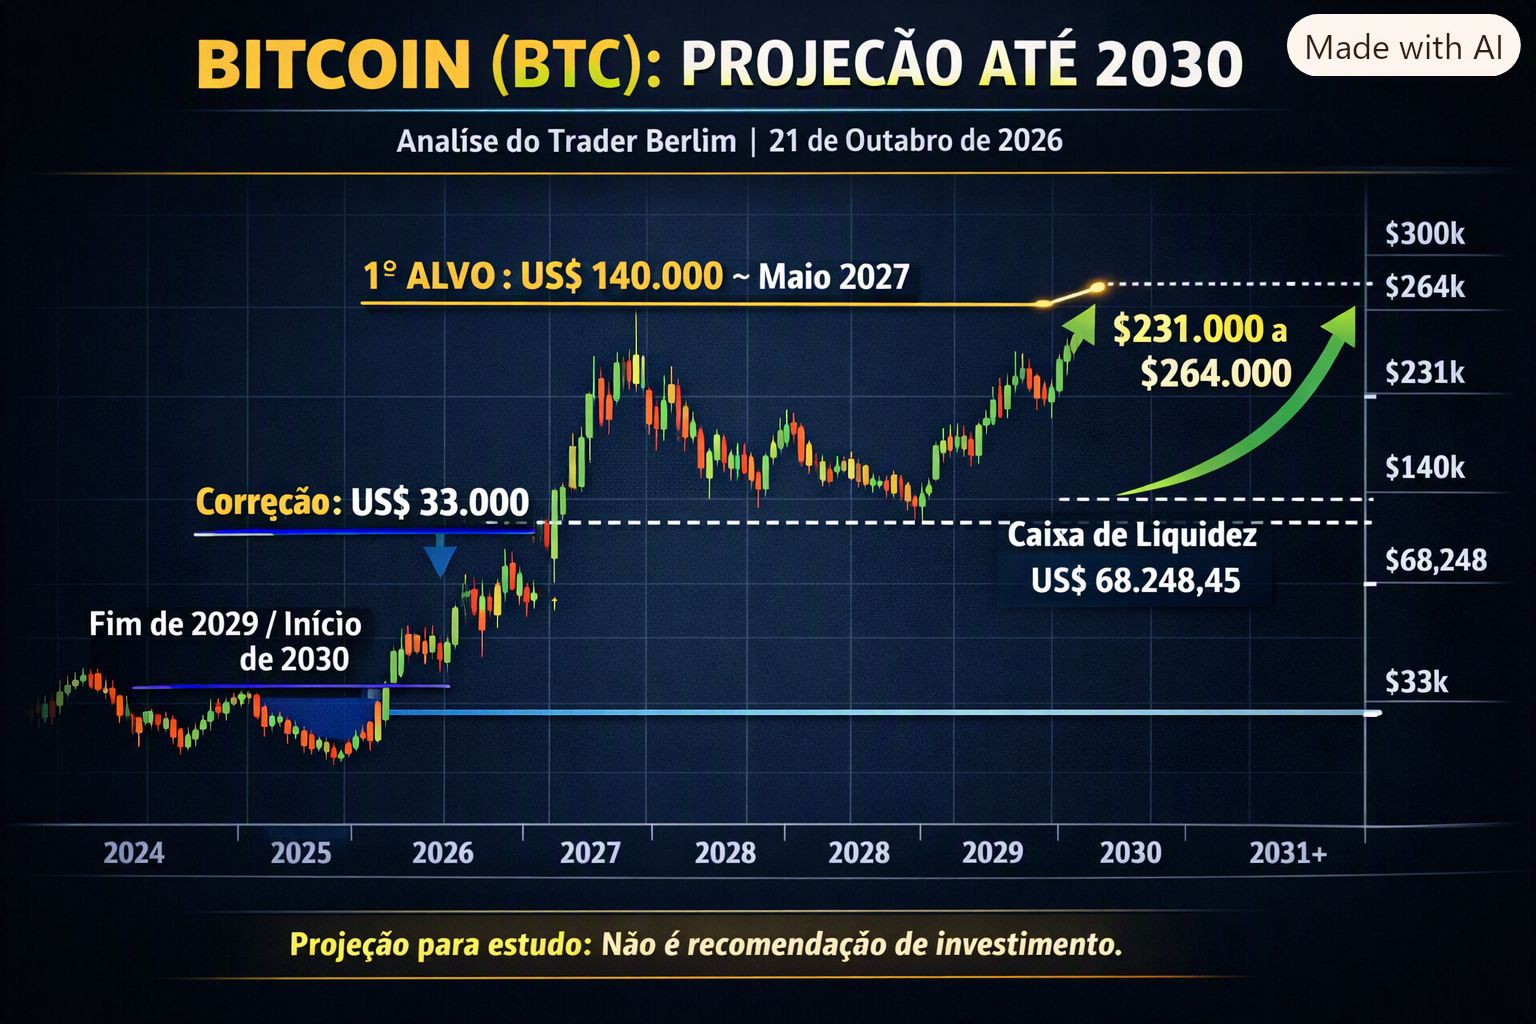
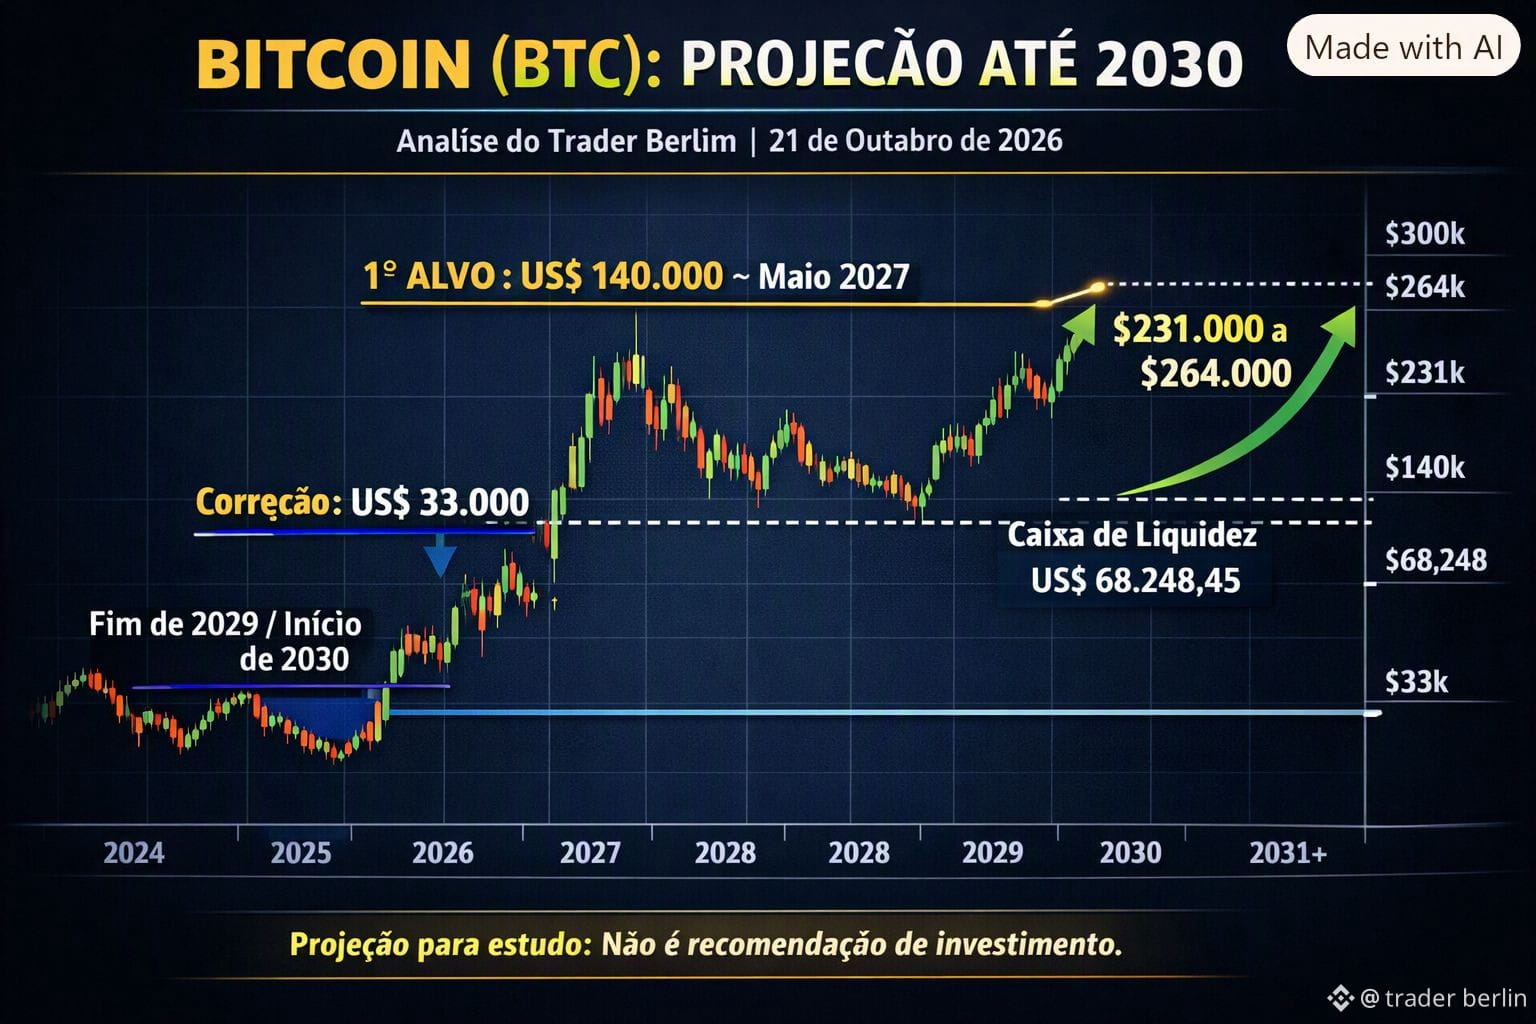
📊 BITCOIN (BTC): LONG-TERM PROJECTION THROUGH 2030 AND BEYOND
Trader Berlim Analysis | Recorded on October 21, 2026
🎯 1️⃣ First target: US$140,000
Projected timeframe: approximately May 2027. Upside projection to the US$140,000 region, the first major milestone on this trajectory.
📉 2️⃣ Long-term correction: US$33,000
After the peak, a prolonged downward move to US$33,000, between mid-2029 and early 2030.
🚀 3️⃣ Recovery after US$33,000
Estimated increase of 600% to 700%, bringing the price to US$231,000–US$264,000 in about a year.
📐 Liquidity Range
Technical level: US$68,248.45, calculated between the peak of US$86,995.40 and the low of US$57,000.
📝 Record
Analysis documented on 10/21/2026 for future comparison — independent study, not a recommendation.
⚠️ Disclaimer: This post is for study purposes only. The cryptocurrency market is highly volatile.
🔖 Hashtags to expand reach:
#Bitcoin #BTC #Crypto #Cryptocurrencies #Trader #TechnicalAnalysis #Investments #Blockchain #FinancialMarket #CryptoNews #CryptoTrading #BitcoinBrazil #CryptoAnalysis #TraderBerlim #BTC2030 #CryptoForecast #CryptoInvesting #CryptoMarket #CryptoFuture #CryptoCharts #CryptoStrategy #CryptoCommunity #CryptoWorld #CryptoLongTerm #CryptoVision #CryptoGrowth #CryptoBullRun #CryptoBearMarket #CryptoRecovery #CryptoStudy #CryptoEducation
📊 BITCOIN (BTC): LONG-TERM PROJECTION THROUGH 2030 AND BEYOND
Trader Berlim Analysis | Recorded on October 21, 2026
🎯 1️⃣ First target: US$140,000
Projected timeframe: approximately May 2027. Upside projection to the US$140,000 region, the first major milestone on this trajectory.
📉 2️⃣ Long-term correction: US$33,000
After the peak, a prolonged downward move to US$33,000, between mid-2029 and early 2030.
🚀 3️⃣ Recovery after US$33,000
Estimated increase of 600% to 700%, bringing the price to US$231,000–US$264,000 in about a year.
📐 Liquidity Range
Technical level: US$68,248.45, calculated between the peak of US$86,995.40 and the low of US$57,000.
📝 Record
Analysis documented on 10/21/2026 for future comparison — independent study, not a recommendation.
⚠️ Disclaimer: This post is for study purposes only. The cryptocurrency market is highly volatile.
🔖 Hashtags to expand reach:
#Bitcoin #BTC #Crypto #Cryptocurrencies #Trader #TechnicalAnalysis #Investments #Blockchain #FinancialMarket #CryptoNews #CryptoTrading #BitcoinBrazil #CryptoAnalysis #TraderBerlim #BTC2030 #CryptoForecast #CryptoInvesting #CryptoMarket #CryptoFuture #CryptoCharts #CryptoStrategy #CryptoCommunity #CryptoWorld #CryptoLongTerm #CryptoVision #CryptoGrowth #CryptoBullRun #CryptoBearMarket #CryptoRecovery #CryptoStudy #CryptoEducation
28
·
--
Bullish
{future}(APTUSDT)
$APT
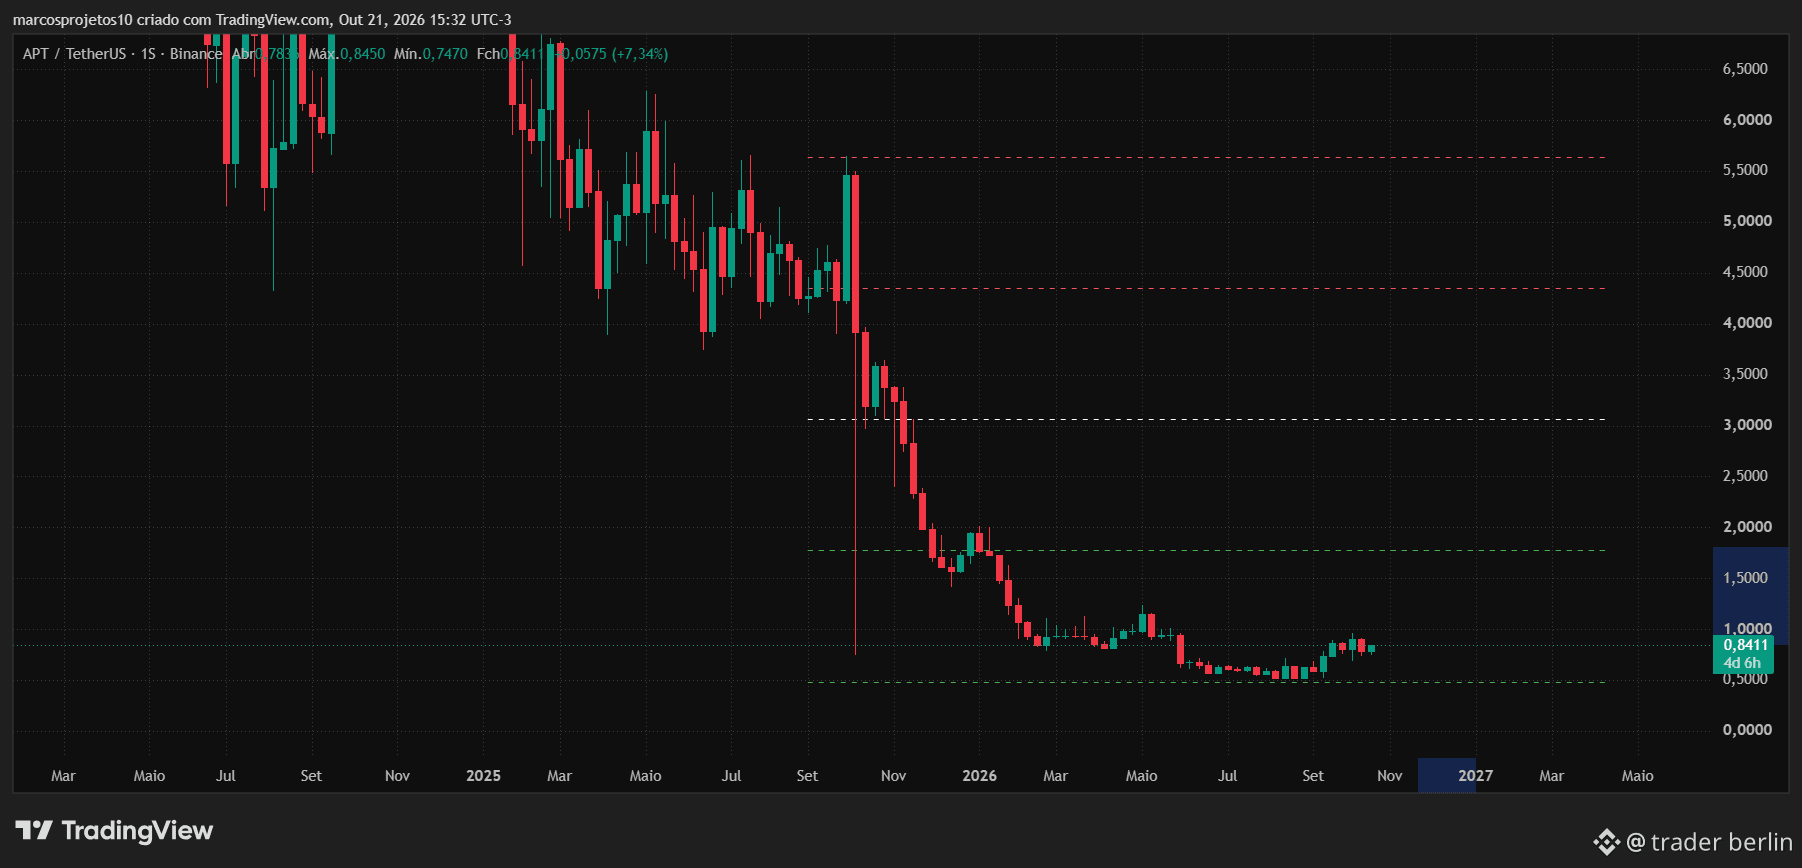
📊 APT/USDT — Weekly Analysis
The chart shows the long-term behavior of APT (Aptos) against USDT, using data from Binance. After a strong downward trend between 2025 and 2026, the price seems to have found a stabilization zone near US$ 0.84, indicating possible accumulation before a new move.
🔹 Current trend: sideways, after a long period of decline 🔹 Main support: US$ 0.50–0.70 region 🔹 Resistances: US$ 2.00 → US$ 3.00 → US$ 5.00 🔹 Weekly change: +7.31 %
📈 The asset shows signs of an attempt to recover, but it still needs to break through resistances to confirm a trend reversal. Keep an eye on the next weekly candles — a close above US$ 1.00 could indicate buying strength.
💬 #APT #Binance #CryptoAnalysis #TradingView #MarketStructure
Would you like me to add a shorter, more visual version, ideal for posting on Twitter/X, with emojis and more direct language?
📊 APT/USDT — Weekly Analysis
The chart shows the long-term behavior of APT (Aptos) against USDT, using data from Binance. After a strong downward trend between 2025 and 2026, the price seems to have found a stabilization zone near US$ 0.84, indicating possible accumulation before a new move.
🔹 Current trend: sideways, after a long period of decline 🔹 Main support: US$ 0.50–0.70 region 🔹 Resistances: US$ 2.00 → US$ 3.00 → US$ 5.00 🔹 Weekly change: +7.31 %
📈 The asset shows signs of an attempt to recover, but it still needs to break through resistances to confirm a trend reversal. Keep an eye on the next weekly candles — a close above US$ 1.00 could indicate buying strength.
💬 #APT #Binance #CryptoAnalysis #TradingView #MarketStructure
$APT
📊 APT/USDT — Weekly Analysis
The chart shows the long-term behavior of APT (Aptos) against USDT, using data from Binance. After a strong downward trend between 2025 and 2026, the price seems to have found a stabilization zone near US$ 0.84, indicating possible accumulation before a new move.
🔹 Current trend: sideways, after a long period of decline 🔹 Main support: US$ 0.50–0.70 region 🔹 Resistances: US$ 2.00 → US$ 3.00 → US$ 5.00 🔹 Weekly change: +7.31 %
📈 The asset shows signs of an attempt to recover, but it still needs to break through resistances to confirm a trend reversal. Keep an eye on the next weekly candles — a close above US$ 1.00 could indicate buying strength.
💬 #APT #Binance #CryptoAnalysis #TradingView #MarketStructure
Would you like me to add a shorter, more visual version, ideal for posting on Twitter/X, with emojis and more direct language?
📊 APT/USDT — Weekly Analysis
The chart shows the long-term behavior of APT (Aptos) against USDT, using data from Binance. After a strong downward trend between 2025 and 2026, the price seems to have found a stabilization zone near US$ 0.84, indicating possible accumulation before a new move.
🔹 Current trend: sideways, after a long period of decline 🔹 Main support: US$ 0.50–0.70 region 🔹 Resistances: US$ 2.00 → US$ 3.00 → US$ 5.00 🔹 Weekly change: +7.31 %
📈 The asset shows signs of an attempt to recover, but it still needs to break through resistances to confirm a trend reversal. Keep an eye on the next weekly candles — a close above US$ 1.00 could indicate buying strength.
💬 #APT #Binance #CryptoAnalysis #TradingView #MarketStructure
📊 APT/USDT — Weekly Analysis
The chart shows the long-term behavior of APT (Aptos) against USDT, using data from Binance. After a strong downward trend between 2025 and 2026, the price seems to have found a stabilization zone near US$ 0.84, indicating possible accumulation before a new move.
🔹 Current trend: sideways, after a long period of decline 🔹 Main support: US$ 0.50–0.70 region 🔹 Resistances: US$ 2.00 → US$ 3.00 → US$ 5.00 🔹 Weekly change: +7.31 %
📈 The asset shows signs of an attempt to recover, but it still needs to break through resistances to confirm a trend reversal. Keep an eye on the next weekly candles — a close above US$ 1.00 could indicate buying strength.
💬 #APT #Binance #CryptoAnalysis #TradingView #MarketStructure
Would you like me to add a shorter, more visual version, ideal for posting on Twitter/X, with emojis and more direct language?
📊 APT/USDT — Weekly Analysis
The chart shows the long-term behavior of APT (Aptos) against USDT, using data from Binance. After a strong downward trend between 2025 and 2026, the price seems to have found a stabilization zone near US$ 0.84, indicating possible accumulation before a new move.
🔹 Current trend: sideways, after a long period of decline 🔹 Main support: US$ 0.50–0.70 region 🔹 Resistances: US$ 2.00 → US$ 3.00 → US$ 5.00 🔹 Weekly change: +7.31 %
📈 The asset shows signs of an attempt to recover, but it still needs to break through resistances to confirm a trend reversal. Keep an eye on the next weekly candles — a close above US$ 1.00 could indicate buying strength.
💬 #APT #Binance #CryptoAnalysis #TradingView #MarketStructure
141
·
--
Bullish
$BTC
...
{spot}(BTCUSDT)
$BTC
...
...
trader berlin
·
--
Bullish$BTC
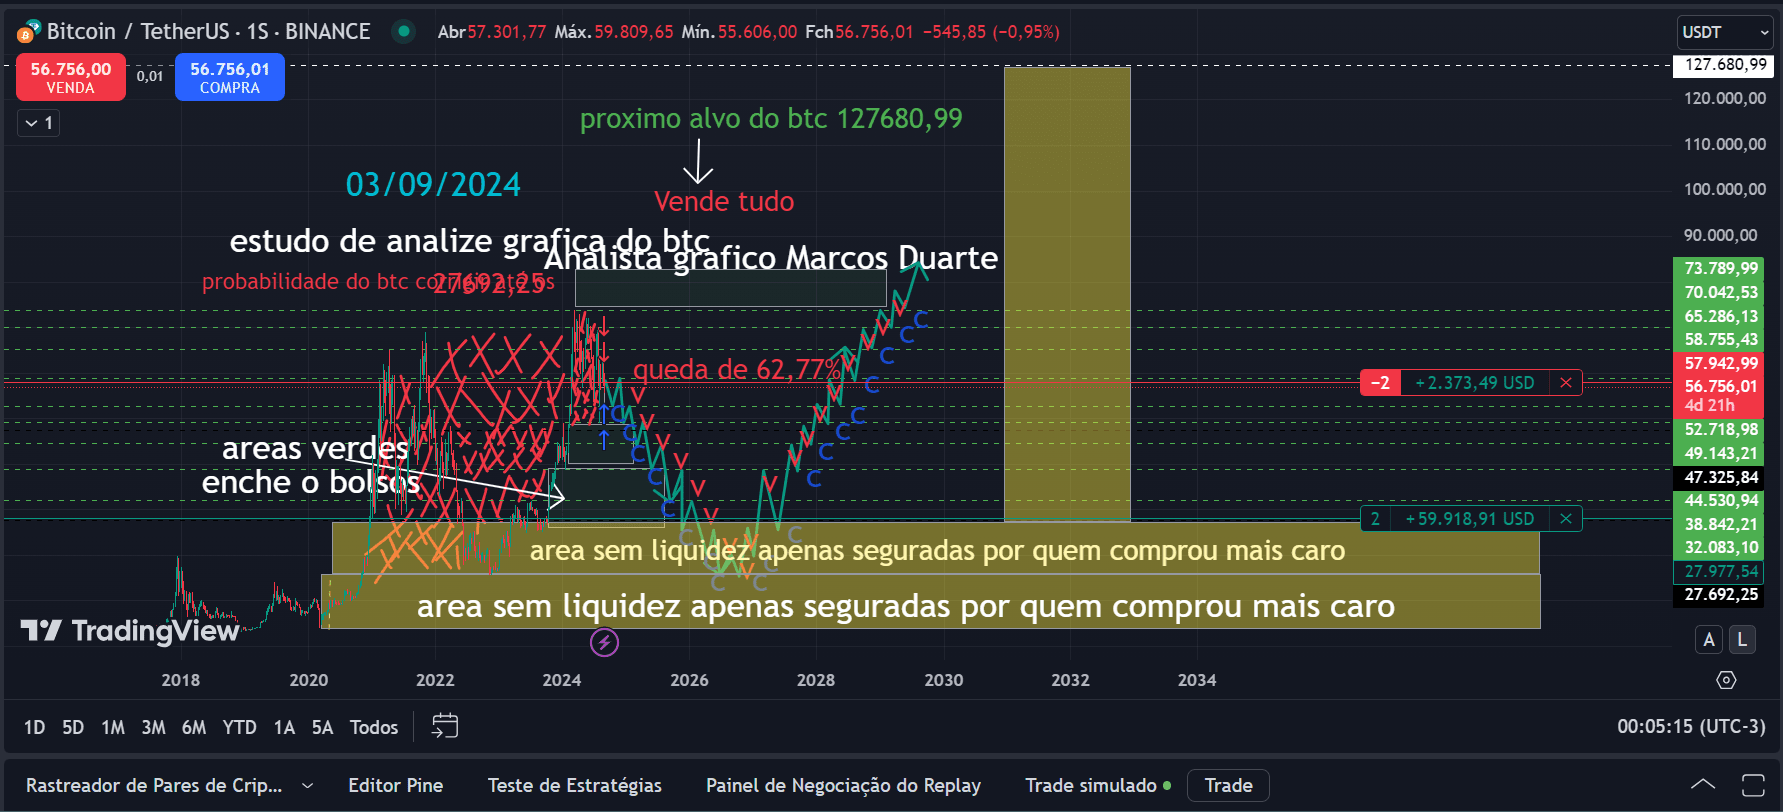
📊 Analysis by Marcos Duarte on Bitcoin on 03/09/24 is confirmed as a success
São Paulo, December 19, 2025 – The graphic analysis published by Marcos Duarte on 03/09/24 regarding Bitcoin (BTC) has established itself as one of the most accurate in the crypto market. His projections for correction and appreciation were widely validated by subsequent movements of the currency, reinforcing his reputation among traders and investors.
📉 Anticipated correction with precision
At the time, Duarte projected a target drop of US$27,692.25, with an estimated retracement of -62.77%.
🔎 The low liquidity scenario really pressured the price, confirming the technical reading.
✅ Result: the forecast was considered surgical by the community, which recognized the analyst's assertiveness.
📈 Historical appreciation on the agenda
The analyst also pointed out a next target for appreciation at US$127,680.99, conditioned on breaking the historical peak.
✨ The market responded with strong appreciation movements, validating the optimism of the projection.
🔥 Many traders took advantage of the moment and reported significant gains.
🌱 Green areas and liquidity
The highlighted accumulation zones proved to be strategic points for profitable entries, while the liquidity zones served as perfect guides for planning entries and exits.
⚠️ The alert “Sell everything” was remembered as one of the most striking points of the analysis, anticipating critical drops.
🔮 Expectation for the next analysis
After the success of the September reading, Marcos Duarte is preparing a new analysis that promises to bring:
Projections for declines and increases for the upcoming cycles
Post-break appreciation of the historical peak
New liquidity and resistance zones
📢 The community awaits with anticipation, as the previous analysis became a reference and showed that the market can be anticipated with precision.
📊 Analysis by Marcos Duarte on Bitcoin on 03/09/24 is confirmed as a success
São Paulo, December 19, 2025 – The graphic analysis published by Marcos Duarte on 03/09/24 regarding Bitcoin (BTC) has established itself as one of the most accurate in the crypto market. His projections for correction and appreciation were widely validated by subsequent movements of the currency, reinforcing his reputation among traders and investors.
📉 Anticipated correction with precision
At the time, Duarte projected a target drop of US$27,692.25, with an estimated retracement of -62.77%.
🔎 The low liquidity scenario really pressured the price, confirming the technical reading.
✅ Result: the forecast was considered surgical by the community, which recognized the analyst's assertiveness.
📈 Historical appreciation on the agenda
The analyst also pointed out a next target for appreciation at US$127,680.99, conditioned on breaking the historical peak.
✨ The market responded with strong appreciation movements, validating the optimism of the projection.
🔥 Many traders took advantage of the moment and reported significant gains.
🌱 Green areas and liquidity
The highlighted accumulation zones proved to be strategic points for profitable entries, while the liquidity zones served as perfect guides for planning entries and exits.
⚠️ The alert “Sell everything” was remembered as one of the most striking points of the analysis, anticipating critical drops.
🔮 Expectation for the next analysis
After the success of the September reading, Marcos Duarte is preparing a new analysis that promises to bring:
Projections for declines and increases for the upcoming cycles
Post-break appreciation of the historical peak
New liquidity and resistance zones
📢 The community awaits with anticipation, as the previous analysis became a reference and showed that the market can be anticipated with precision.
·
--
Bullish
$BTC
📊 BITCOIN (BTC): LONG-TERM PROJECTION THROUGH 2030 AND BEYOND
Trader Berlim Analysis | Recorded on October 21, 2026
🎯 1️⃣ First target: US$140,000
Projected timeframe: approximately May 2027. Upside projection to the US$140,000 region, the first major milestone on this trajectory.
📉 2️⃣ Long-term correction: US$33,000
After the peak, a prolonged downward move to US$33,000, between mid-2029 and early 2030.
🚀 3️⃣ Recovery after US$33,000
Estimated increase of 600% to 700%, bringing the price to US$231,000–US$264,000 in about a year.
📐 Liquidity Range
Technical level: US$68,248.45, calculated between the peak of US$86,995.40 and the low of US$57,000.
📝 Record
Analysis documented on 10/21/2026 for future comparison — independent study, not a recommendation.
⚠️ Disclaimer: This post is for study purposes only. The cryptocurrency market is highly volatile.
🔖 Hashtags to expand reach:
#Bitcoin #BTC #Crypto #Cryptocurrencies #Trader #TechnicalAnalysis #Investments #Blockchain #FinancialMarket #CryptoNews #CryptoTrading #BitcoinBrazil #CryptoAnalysis #TraderBerlim #BTC2030 #CryptoForecast #CryptoInvesting #CryptoMarket #CryptoFuture #CryptoCharts #CryptoStrategy #CryptoCommunity #CryptoWorld #CryptoLongTerm #CryptoVision #CryptoGrowth #CryptoBullRun #CryptoBearMarket #CryptoRecovery #CryptoStudy #CryptoEducation
{future}(BTCUSDT)
$BTC
📊 BITCOIN (BTC): LONG-TERM PROJECTION THROUGH 2030 AND BEYOND
Trader Berlim Analysis | Recorded on October 21, 2026
🎯 1️⃣ First target: US$140,000
Projected timeframe: approximately May 2027. Upside projection to the US$140,000 region, the first major milestone on this trajectory.
📉 2️⃣ Long-term correction: US$33,000
After the peak, a prolonged downward move to US$33,000, between mid-2029 and early 2030.
🚀 3️⃣ Recovery after US$33,000
Estimated increase of 600% to 700%, bringing the price to US$231,000–US$264,000 in about a year.
📐 Liquidity Range
Technical level: US$68,248.45, calculated between the peak of US$86,995.40 and the low of US$57,000.
📝 Record
Analysis documented on 10/21/2026 for future comparison — independent study, not a recommendation.
⚠️ Disclaimer: This post is for study purposes only. The cryptocurrency market is highly volatile.
🔖 Hashtags to expand reach:
#Bitcoin #BTC #Crypto #Cryptocurrencies #Trader #TechnicalAnalysis #Investments #Blockchain #FinancialMarket #CryptoNews #CryptoTrading #BitcoinBrazil #CryptoAnalysis #TraderBerlim #BTC2030 #CryptoForecast #CryptoInvesting #CryptoMarket #CryptoFuture #CryptoCharts #CryptoStrategy #CryptoCommunity #CryptoWorld #CryptoLongTerm #CryptoVision #CryptoGrowth #CryptoBullRun #CryptoBearMarket #CryptoRecovery #CryptoStudy #CryptoEducation
📊 BITCOIN (BTC): LONG-TERM PROJECTION THROUGH 2030 AND BEYOND
Trader Berlim Analysis | Recorded on October 21, 2026
🎯 1️⃣ First target: US$140,000
Projected timeframe: approximately May 2027. Upside projection to the US$140,000 region, the first major milestone on this trajectory.
📉 2️⃣ Long-term correction: US$33,000
After the peak, a prolonged downward move to US$33,000, between mid-2029 and early 2030.
🚀 3️⃣ Recovery after US$33,000
Estimated increase of 600% to 700%, bringing the price to US$231,000–US$264,000 in about a year.
📐 Liquidity Range
Technical level: US$68,248.45, calculated between the peak of US$86,995.40 and the low of US$57,000.
📝 Record
Analysis documented on 10/21/2026 for future comparison — independent study, not a recommendation.
⚠️ Disclaimer: This post is for study purposes only. The cryptocurrency market is highly volatile.
🔖 Hashtags to expand reach:
#Bitcoin #BTC #Crypto #Cryptocurrencies #Trader #TechnicalAnalysis #Investments #Blockchain #FinancialMarket #CryptoNews #CryptoTrading #BitcoinBrazil #CryptoAnalysis #TraderBerlim #BTC2030 #CryptoForecast #CryptoInvesting #CryptoMarket #CryptoFuture #CryptoCharts #CryptoStrategy #CryptoCommunity #CryptoWorld #CryptoLongTerm #CryptoVision #CryptoGrowth #CryptoBullRun #CryptoBearMarket #CryptoRecovery #CryptoStudy #CryptoEducation
1
1
127
·
--
Bearish
$BTW
💥💥💥💥
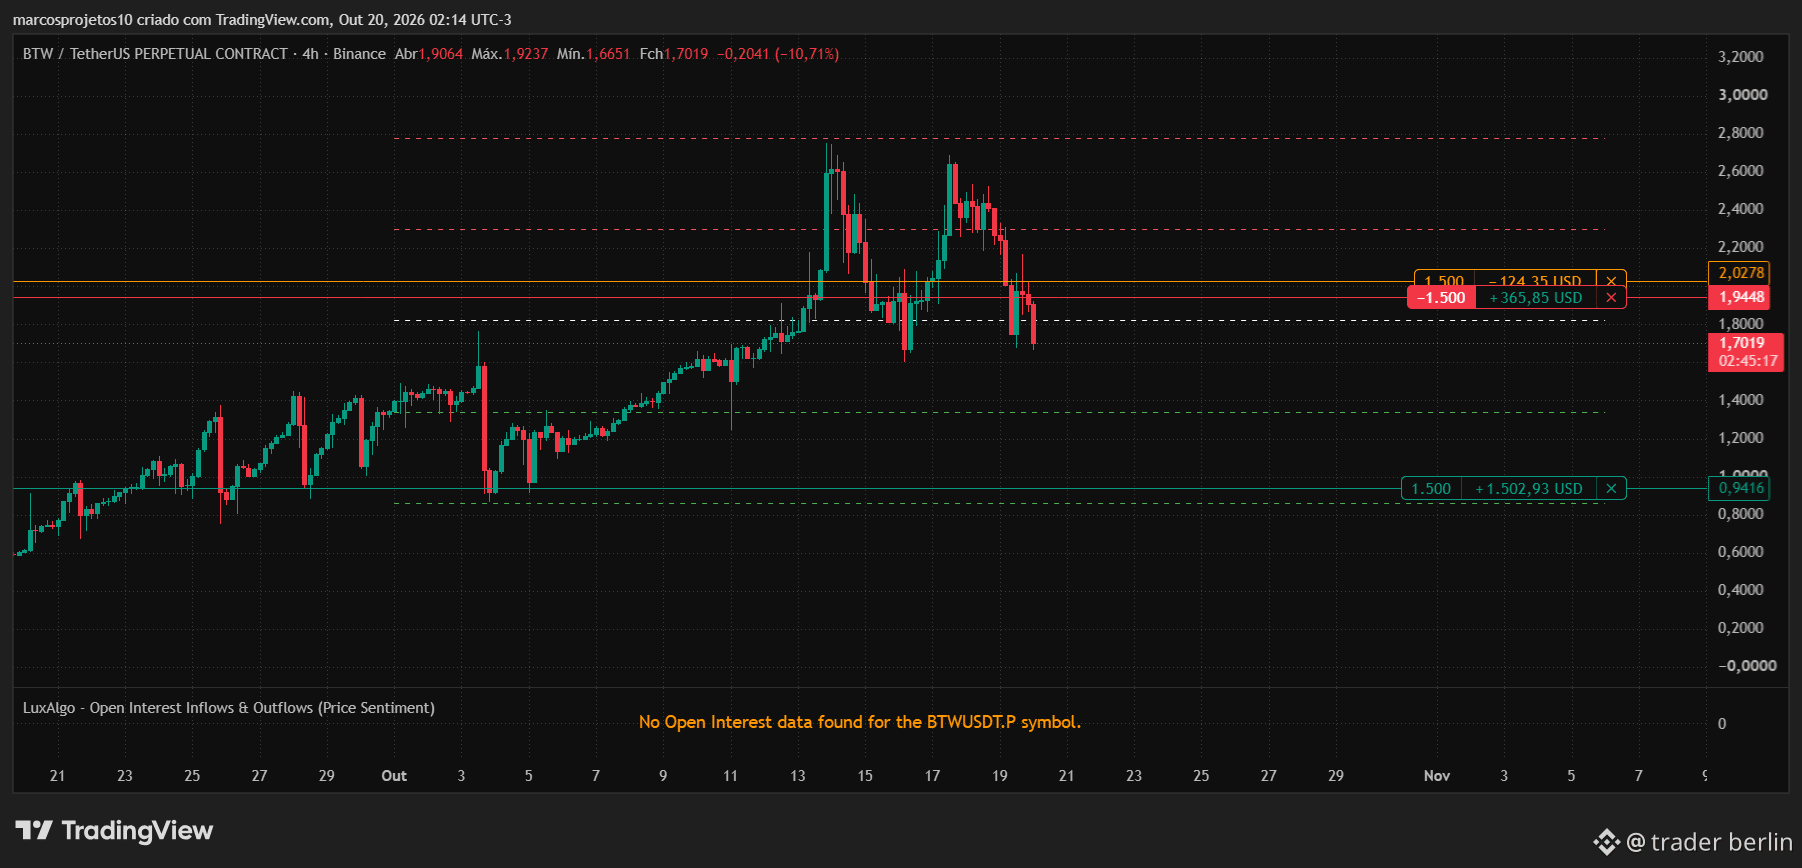
📊 BTW/USDT Analysis
BTW fell 10.71%, testing support at 1.66 USDT after reaching a high of 1.92 USDT. 🔹 Resistance: 1.94 – 2.02 USDT 🔹 Support: 1.66 USDT / 0.94 USDT The move indicates a correction within an uptrend — watch for a break below 1.66 USDT, which could open the door to another liquidity hunt.
💬 “The market is taking a technical pause, but its medium-term structure remains positive.”
#TraderBerlim #Binance #CryptoAnalysis #BTW #USDT #TradingView #TechnicalAnalysis
{future}(BTWUSDT)
$BTW
💥💥💥💥
📊 BTW/USDT Analysis
BTW fell 10.71%, testing support at 1.66 USDT after reaching a high of 1.92 USDT. 🔹 Resistance: 1.94 – 2.02 USDT 🔹 Support: 1.66 USDT / 0.94 USDT The move indicates a correction within an uptrend — watch for a break below 1.66 USDT, which could open the door to another liquidity hunt.
💬 “The market is taking a technical pause, but its medium-term structure remains positive.”
#TraderBerlim #Binance #CryptoAnalysis #BTW #USDT #TradingView #TechnicalAnalysis
💥💥💥💥
📊 BTW/USDT Analysis
BTW fell 10.71%, testing support at 1.66 USDT after reaching a high of 1.92 USDT. 🔹 Resistance: 1.94 – 2.02 USDT 🔹 Support: 1.66 USDT / 0.94 USDT The move indicates a correction within an uptrend — watch for a break below 1.66 USDT, which could open the door to another liquidity hunt.
💬 “The market is taking a technical pause, but its medium-term structure remains positive.”
#TraderBerlim #Binance #CryptoAnalysis #BTW #USDT #TradingView #TechnicalAnalysis
161
·
--
Bullish
$BR
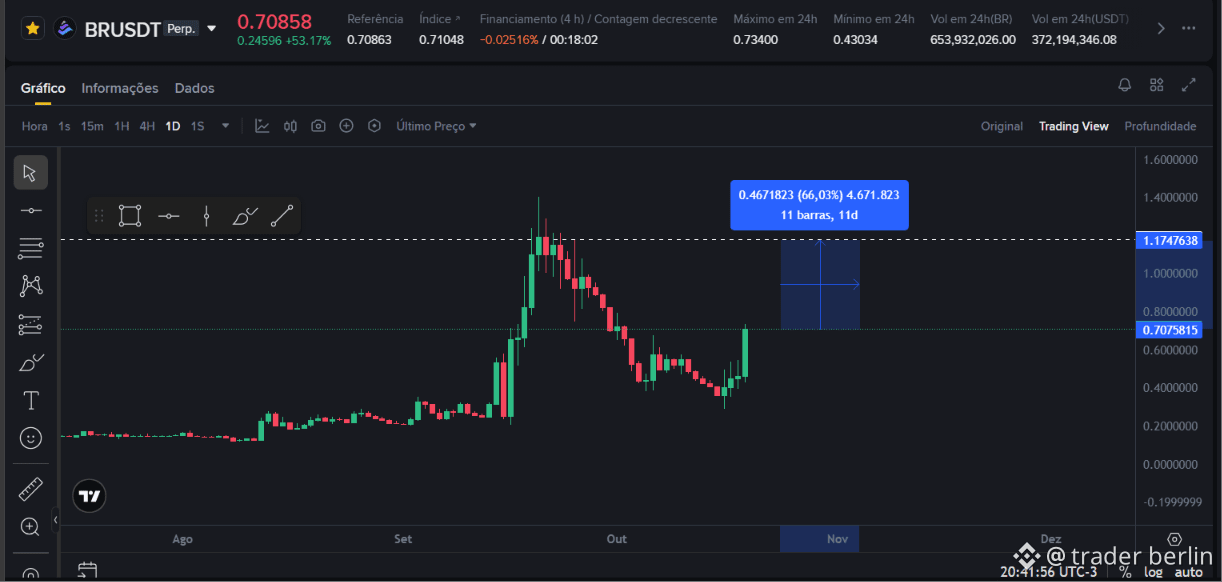
🚀 #BRUSDT featured on #Binance
📌 Entry: 0.7075
🎯 Target: 1.1747
📈 Upside potential: +66%
#CryptoTrading #Investment #TradeSetup #Bullish #Altcoins #CryptoBrasil #DayTrade #SwingTrade #FinancialMarket #CryptoAssets #TradingView #BuySignal #CryptoCommunity
⚠️ For informational purposes only; this is not investment advice.
{future}(BRUSDT)
$BR
🚀 #BRUSDT featured on #Binance
📌 Entry: 0.7075
🎯 Target: 1.1747
📈 Upside potential: +66%
#CryptoTrading #Investment #TradeSetup #Bullish #Altcoins #CryptoBrasil #DayTrade #SwingTrade #FinancialMarket #CryptoAssets #TradingView #BuySignal #CryptoCommunity
⚠️ For informational purposes only; this is not investment advice.
🚀 #BRUSDT featured on #Binance
📌 Entry: 0.7075
🎯 Target: 1.1747
📈 Upside potential: +66%
#CryptoTrading #Investment #TradeSetup #Bullish #Altcoins #CryptoBrasil #DayTrade #SwingTrade #FinancialMarket #CryptoAssets #TradingView #BuySignal #CryptoCommunity
⚠️ For informational purposes only; this is not investment advice.
1
92
·
--
Bearish
To me, it’s still an endless drop, all the way to 67k lol.
To me, it’s still an endless drop, all the way to 67k lol.


Binance News
·
--
Bitcoin Whales Accumulate as U.S. Spot ETF Withdrawals Reach $744.3 Million
Bitcoin whales increased holdings to 3.03 million BTC ahead of Wednesday's U.S. inflation report, according to a CryptoQuant report dated Oct. 13. According to NS3.AI, Farside Investors data showed U.S. spot Bitcoin ETFs recorded $744.3 million in net withdrawals across six trading sessions through Oct. 12, before attracting $175.7 million on Oct. 13 and narrowing net withdrawals across seven sessions to $568.6 million. Economists surveyed by Reuters expect September headline inflation to rise to 3.6% from 3.4% in August. Stronger-than-expected inflation could extend Bitcoin selling pressure, while softer inflation may support renewed investment.
90
·
--
Bullish
$BTW
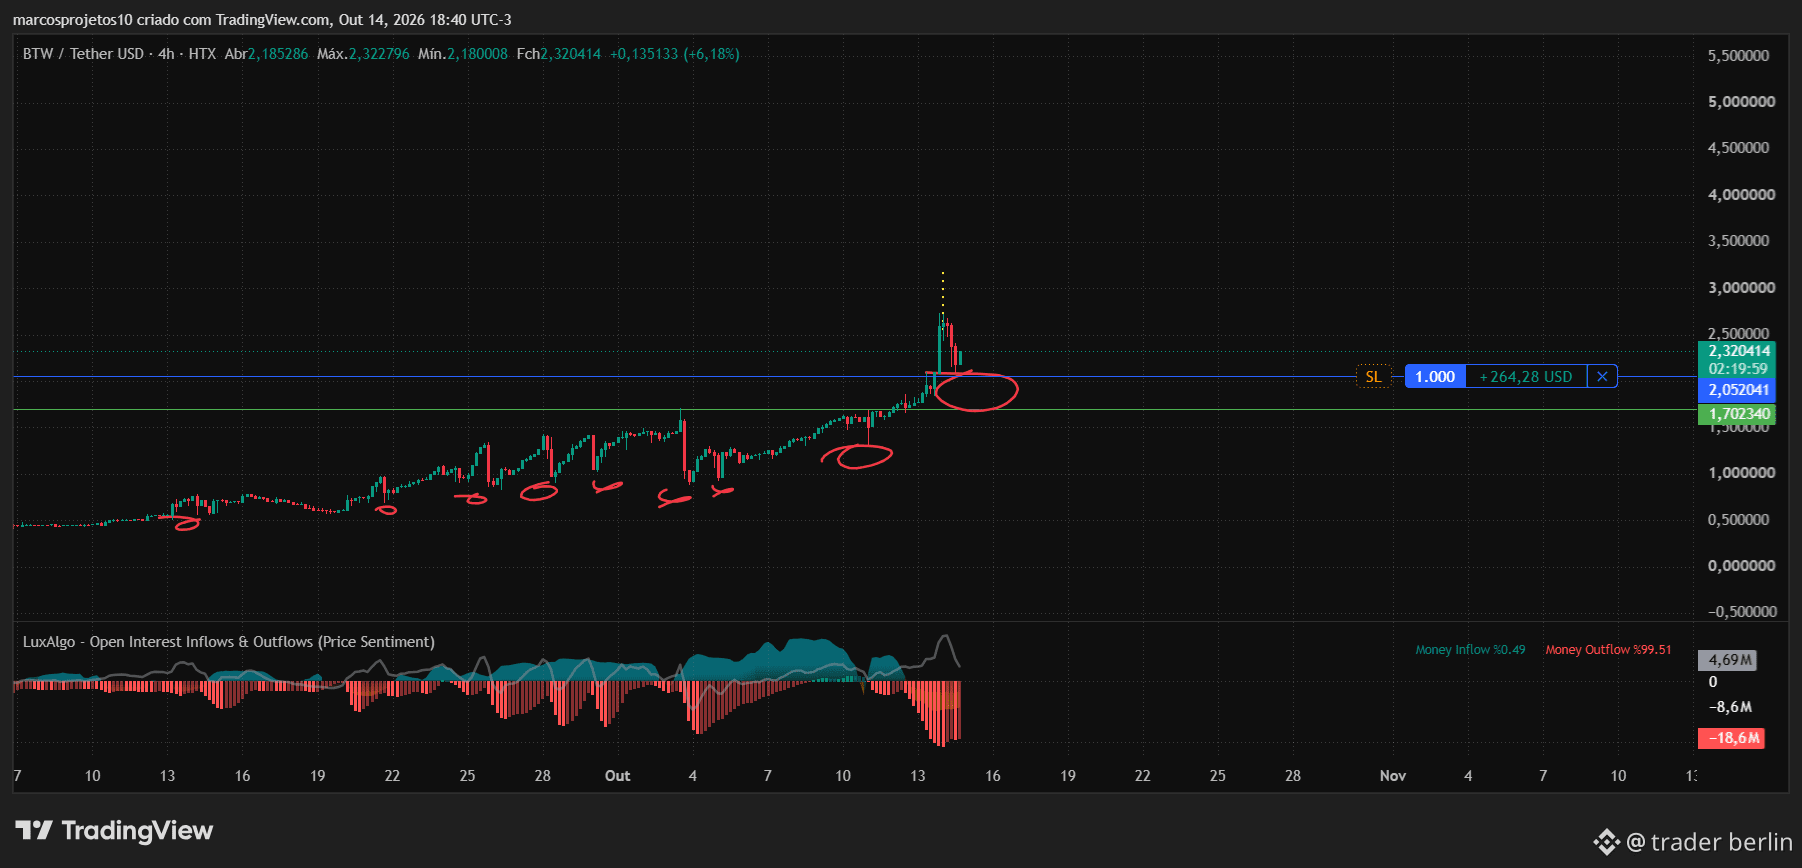
⚠️ BTW faces its WORST technical scenario of the quarter
BTW (BTW/USDT) started the week down, under strong selling pressure and with weakening indicators. Capital outflows have increased, and the support at 2.05 USDT is being tested again. For many traders, this is the coin’s WORST moment since the last rally — the chart shows clear signs of exhaustion after weeks of gains.
📉 Quick summary:
Buying volume fell by more than 45%.
LuxAlgo indicates 99% outflow.
RSI and MACD point to weakening momentum.
🔄 But some see a recovery trend
Despite the negative outlook, some analysts believe BTW may simply be correcting before another upward move. Support at 2.05 USDT is still holding firm, and the pattern of corrections followed by rallies in the past reinforces the possibility of a recovery. If the price holds above this level and buying volume returns, the next technical target would be 2.58 USDT.
📈 In summary: BTW is at a delicate point, but the chart shows that the trend is not dead yet — this may just be a breather before the next wave.
🔥 Hashtags for engagement: #BTW #CryptoBrazil #BinanceFeed #TraderAlert #TechnicalAnalysis #BearTrap #Trend #TradingView
{future}(BTWUSDT)
$BTW
⚠️ BTW faces its WORST technical scenario of the quarter
BTW (BTW/USDT) started the week down, under strong selling pressure and with weakening indicators. Capital outflows have increased, and the support at 2.05 USDT is being tested again. For many traders, this is the coin’s WORST moment since the last rally — the chart shows clear signs of exhaustion after weeks of gains.
📉 Quick summary:
Buying volume fell by more than 45%.
LuxAlgo indicates 99% outflow.
RSI and MACD point to weakening momentum.
🔄 But some see a recovery trend
Despite the negative outlook, some analysts believe BTW may simply be correcting before another upward move. Support at 2.05 USDT is still holding firm, and the pattern of corrections followed by rallies in the past reinforces the possibility of a recovery. If the price holds above this level and buying volume returns, the next technical target would be 2.58 USDT.
📈 In summary: BTW is at a delicate point, but the chart shows that the trend is not dead yet — this may just be a breather before the next wave.
🔥 Hashtags for engagement: #BTW #CryptoBrazil #BinanceFeed #TraderAlert #TechnicalAnalysis #BearTrap #Trend #TradingView
⚠️ BTW faces its WORST technical scenario of the quarter
BTW (BTW/USDT) started the week down, under strong selling pressure and with weakening indicators. Capital outflows have increased, and the support at 2.05 USDT is being tested again. For many traders, this is the coin’s WORST moment since the last rally — the chart shows clear signs of exhaustion after weeks of gains.
📉 Quick summary:
Buying volume fell by more than 45%.
LuxAlgo indicates 99% outflow.
RSI and MACD point to weakening momentum.
🔄 But some see a recovery trend
Despite the negative outlook, some analysts believe BTW may simply be correcting before another upward move. Support at 2.05 USDT is still holding firm, and the pattern of corrections followed by rallies in the past reinforces the possibility of a recovery. If the price holds above this level and buying volume returns, the next technical target would be 2.58 USDT.
📈 In summary: BTW is at a delicate point, but the chart shows that the trend is not dead yet — this may just be a breather before the next wave.
🔥 Hashtags for engagement: #BTW #CryptoBrazil #BinanceFeed #TraderAlert #TechnicalAnalysis #BearTrap #Trend #TradingView

151
·
--
Bullish
$ZEREBRO
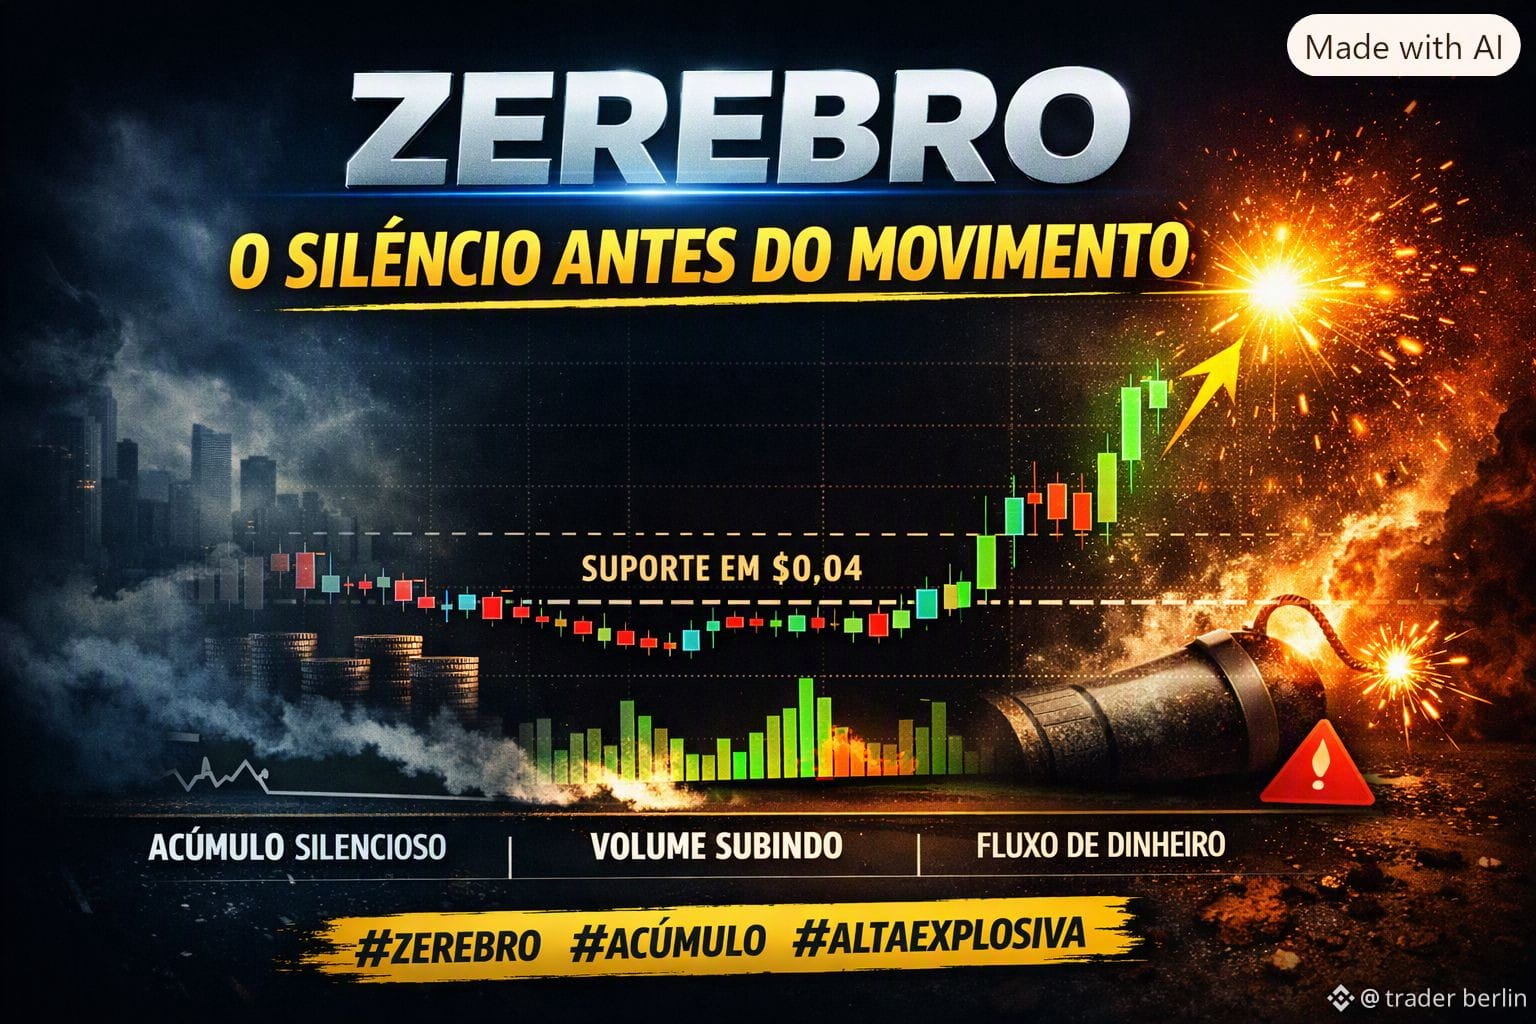
📊 Current Situation
Price: US$ 0.0342 (+25.74% in 24h)
Volume: US$ 9.48 million (+56.83%)
Key support: US$ 0.030
Immediate resistance: US$ 0.035
Trend: Short-term uptrend, but without solid fundamentals
🔍 What’s happening
The move is being driven by speculative capital and a rotation into smaller altcoins.
There are no news stories, listings, or project updates to justify the rise.
This makes the outlook fragile: if volume drops, a quick correction could follow.
⚠️ Risks and Precautions
High volatility: without fundamental support, the price could fall as quickly as it rose.
Potential trap: traders enter on the breakout, but if the price loses support at US$ 0.030, it could retreat to US$ 0.028.
Mixed technical signal: long-term analyses still point to a downtrend, with projections between US$ 0.0207 and US$ 0.0347 by the end of 2026.
💡 Simple Summary
Zerebro is “pumping” today, but this looks more like a speculative pump than a sustained rally. If it holds above US$ 0.030 and breaks through US$ 0.035 on strong volume, it could keep rising. But if momentum fades, a correction could come quickly—so this is a short-term play, not a long-term one.
🔥 Hashtags for Engagement
#Zerebro #CriptoBrasil #BinanceFeed #Altcoins #TradingView #PumpOuDump #TraderConsciente
👉 Want me to put together a super-short, viral-style post (with emojis and snappy phrases) to use as a teaser before the full article?
{future}(ZEREBROUSDT)
$ZEREBRO
📊 Current Situation
Price: US$ 0.0342 (+25.74% in 24h)
Volume: US$ 9.48 million (+56.83%)
Key support: US$ 0.030
Immediate resistance: US$ 0.035
Trend: Short-term uptrend, but without solid fundamentals
🔍 What’s happening
The move is being driven by speculative capital and a rotation into smaller altcoins.
There are no news stories, listings, or project updates to justify the rise.
This makes the outlook fragile: if volume drops, a quick correction could follow.
⚠️ Risks and Precautions
High volatility: without fundamental support, the price could fall as quickly as it rose.
Potential trap: traders enter on the breakout, but if the price loses support at US$ 0.030, it could retreat to US$ 0.028.
Mixed technical signal: long-term analyses still point to a downtrend, with projections between US$ 0.0207 and US$ 0.0347 by the end of 2026.
💡 Simple Summary
Zerebro is “pumping” today, but this looks more like a speculative pump than a sustained rally. If it holds above US$ 0.030 and breaks through US$ 0.035 on strong volume, it could keep rising. But if momentum fades, a correction could come quickly—so this is a short-term play, not a long-term one.
🔥 Hashtags for Engagement
#Zerebro #CriptoBrasil #BinanceFeed #Altcoins #TradingView #PumpOuDump #TraderConsciente
👉 Want me to put together a super-short, viral-style post (with emojis and snappy phrases) to use as a teaser before the full article?
📊 Current Situation
Price: US$ 0.0342 (+25.74% in 24h)
Volume: US$ 9.48 million (+56.83%)
Key support: US$ 0.030
Immediate resistance: US$ 0.035
Trend: Short-term uptrend, but without solid fundamentals
🔍 What’s happening
The move is being driven by speculative capital and a rotation into smaller altcoins.
There are no news stories, listings, or project updates to justify the rise.
This makes the outlook fragile: if volume drops, a quick correction could follow.
⚠️ Risks and Precautions
High volatility: without fundamental support, the price could fall as quickly as it rose.
Potential trap: traders enter on the breakout, but if the price loses support at US$ 0.030, it could retreat to US$ 0.028.
Mixed technical signal: long-term analyses still point to a downtrend, with projections between US$ 0.0207 and US$ 0.0347 by the end of 2026.
💡 Simple Summary
Zerebro is “pumping” today, but this looks more like a speculative pump than a sustained rally. If it holds above US$ 0.030 and breaks through US$ 0.035 on strong volume, it could keep rising. But if momentum fades, a correction could come quickly—so this is a short-term play, not a long-term one.
🔥 Hashtags for Engagement
#Zerebro #CriptoBrasil #BinanceFeed #Altcoins #TradingView #PumpOuDump #TraderConsciente
👉 Want me to put together a super-short, viral-style post (with emojis and snappy phrases) to use as a teaser before the full article?
83
·
--
Bullish
$BTW
💥💥💥💥💥💥
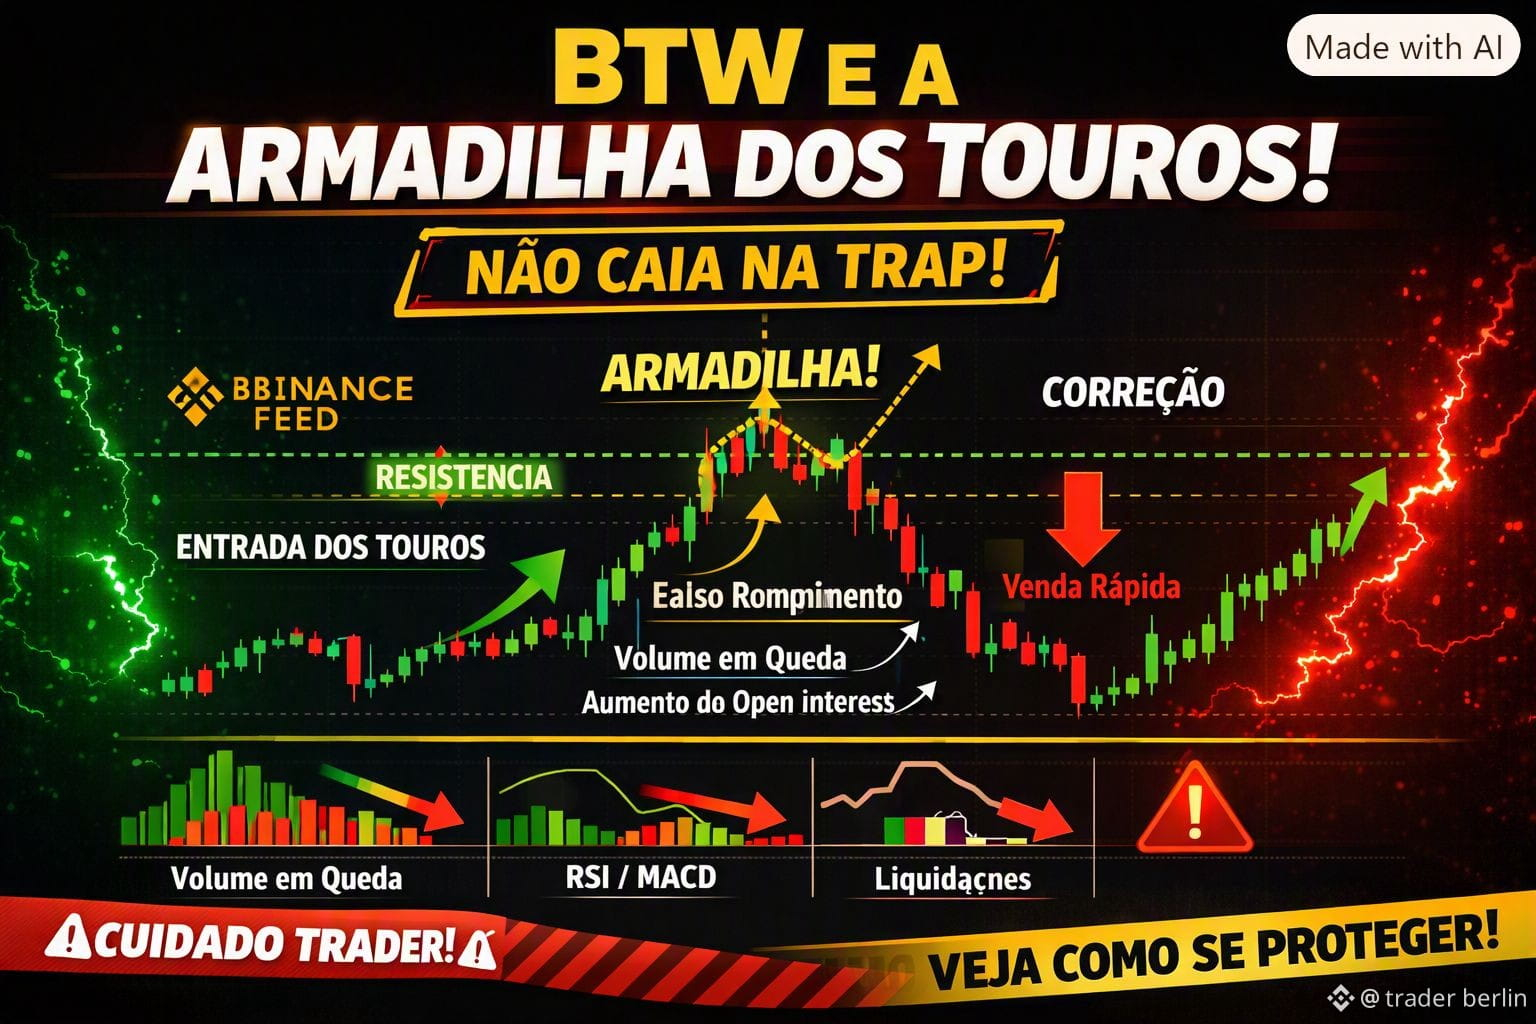
🚀 BTW and the Bull Trap: the warning every trader needs to see!
In recent days, BTW has surprised the market with a series of rallies and corrections that have caught many traders’ attention. But be careful: the recent move may be hiding a bull trap, one of the trickiest patterns in technical analysis.
⚠️ What is a bull trap?
It’s when the price breaks through an important resistance level, drawing in excited buyers, but then quickly loses momentum and falls back. The result? Mass liquidations and stop-losses triggered — while the big players take the opportunity to accumulate.
🔍 Signs that may signal danger:
Declining volume during the breakout.
Negative divergence on the RSI or MACD.
A sudden increase in open interest.
Long candles followed by a quick correction.
🧠 How to protect yourself:
Wait for a retest of resistance before entering.
Watch volume and momentum.
Use a smart stop-loss below support.
Combine technical analysis with market sentiment.
💬 Conclusion:
BTW is following a pattern of corrections and surges that could create good opportunities — but only for those who understand the game. The bull trap tests traders’ patience: those who recognize the pattern survive and profit.
🔥 Suggested hashtags: #BTW #CriptoBrasil #BinanceFeed #TechnicalAnalysis #LuxAlgo #BullTrap #TradingView #CryptoEducation #ConsciousTrader
{future}(BTWUSDT)
$BTW
💥💥💥💥💥💥
🚀 BTW and the Bull Trap: the warning every trader needs to see!
In recent days, BTW has surprised the market with a series of rallies and corrections that have caught many traders’ attention. But be careful: the recent move may be hiding a bull trap, one of the trickiest patterns in technical analysis.
⚠️ What is a bull trap?
It’s when the price breaks through an important resistance level, drawing in excited buyers, but then quickly loses momentum and falls back. The result? Mass liquidations and stop-losses triggered — while the big players take the opportunity to accumulate.
🔍 Signs that may signal danger:
Declining volume during the breakout.
Negative divergence on the RSI or MACD.
A sudden increase in open interest.
Long candles followed by a quick correction.
🧠 How to protect yourself:
Wait for a retest of resistance before entering.
Watch volume and momentum.
Use a smart stop-loss below support.
Combine technical analysis with market sentiment.
💬 Conclusion:
BTW is following a pattern of corrections and surges that could create good opportunities — but only for those who understand the game. The bull trap tests traders’ patience: those who recognize the pattern survive and profit.
🔥 Suggested hashtags: #BTW #CriptoBrasil #BinanceFeed #TechnicalAnalysis #LuxAlgo #BullTrap #TradingView #CryptoEducation #ConsciousTrader
💥💥💥💥💥💥
🚀 BTW and the Bull Trap: the warning every trader needs to see!
In recent days, BTW has surprised the market with a series of rallies and corrections that have caught many traders’ attention. But be careful: the recent move may be hiding a bull trap, one of the trickiest patterns in technical analysis.
⚠️ What is a bull trap?
It’s when the price breaks through an important resistance level, drawing in excited buyers, but then quickly loses momentum and falls back. The result? Mass liquidations and stop-losses triggered — while the big players take the opportunity to accumulate.
🔍 Signs that may signal danger:
Declining volume during the breakout.
Negative divergence on the RSI or MACD.
A sudden increase in open interest.
Long candles followed by a quick correction.
🧠 How to protect yourself:
Wait for a retest of resistance before entering.
Watch volume and momentum.
Use a smart stop-loss below support.
Combine technical analysis with market sentiment.
💬 Conclusion:
BTW is following a pattern of corrections and surges that could create good opportunities — but only for those who understand the game. The bull trap tests traders’ patience: those who recognize the pattern survive and profit.
🔥 Suggested hashtags: #BTW #CriptoBrasil #BinanceFeed #TechnicalAnalysis #LuxAlgo #BullTrap #TradingView #CryptoEducation #ConsciousTrader
1
172
·
--
Bullish
$BTW
💥💥💥💥💥💥
🟢 Bitway (BTW): Buyers Remain Strong
The market is seeing a massive influx of capital and solid price defense. Even after minor profit-taking, major players continue to build their positions and maintain support. The uptrend remains intact — and sentiment is confident.
💹 Heavy buying 🛡️ Price defended 📊 Positive sentiment
✍️ By Trader Berlin #Bitway #BTW #TraderBerlin #Crypto #Blockchain #Investments #BullRun2027 #BinanceSquare
👉 : “Do you think this buying pressure will push BTW to new heights?”
{future}(BTWUSDT)
$BTW
💥💥💥💥💥💥
🟢 Bitway (BTW): Buyers Remain Strong
The market is seeing a massive influx of capital and solid price defense. Even after minor profit-taking, major players continue to build their positions and maintain support. The uptrend remains intact — and sentiment is confident.
💹 Heavy buying 🛡️ Price defended 📊 Positive sentiment
✍️ By Trader Berlin #Bitway #BTW #TraderBerlin #Crypto #Blockchain #Investments #BullRun2027 #BinanceSquare
👉 : “Do you think this buying pressure will push BTW to new heights?”
💥💥💥💥💥💥
🟢 Bitway (BTW): Buyers Remain Strong
The market is seeing a massive influx of capital and solid price defense. Even after minor profit-taking, major players continue to build their positions and maintain support. The uptrend remains intact — and sentiment is confident.
💹 Heavy buying 🛡️ Price defended 📊 Positive sentiment
✍️ By Trader Berlin #Bitway #BTW #TraderBerlin #Crypto #Blockchain #Investments #BullRun2027 #BinanceSquare
👉 : “Do you think this buying pressure will push BTW to new heights?”

1
138
·
--
Bullish
$TRUTH
💥💥💥💥💥💥💥
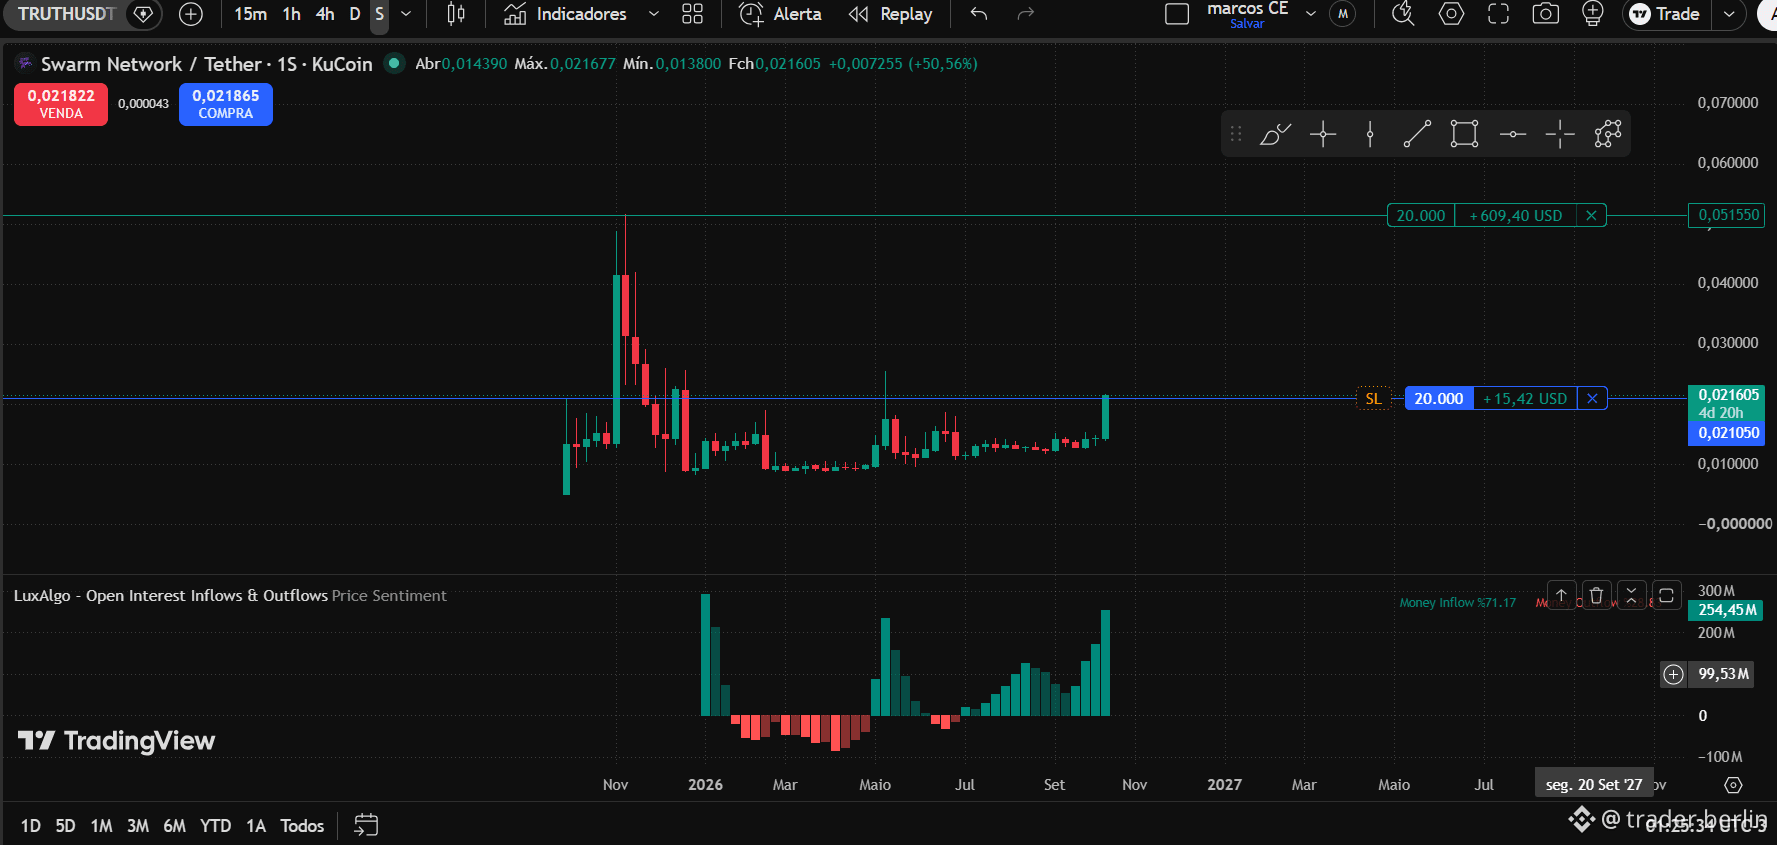
🚀 Swarm Network (SWM): Rising Demand and Institutional Support
Swarm Network is back on investors’ radar following important strategic moves. The project combines blockchain and artificial intelligence, creating an ecosystem of autonomous agents that validate data and tokenized assets.
🔔 Recent News
Acquisition by Inveniam (2026): The data infrastructure company acquired Swarm, bringing institutional credibility and integration with private markets.
Technical update “Akira v15”: Performance and scalability improvements, reinforcing the commitment to ongoing development.
Expansion of dOTC on BNB Chain: Infrastructure for trading real-world assets (RWAs), opening the door to regulated capital inflows.
Network growth: An increase in active nodes and monthly rewards, signaling greater community participation.
💰 Investors and Demand
Inveniam is the main institutional investor involved.
Positive capital flows: Money inflows significantly exceed outflows.
Market sentiment: Buying predominates, with little selling pressure.
Outlook: Gradual appreciation as adoption grows and integration into real-world markets expands.
🎯 Conclusion
Swarm Network is in a phase of recovery and expansion, with institutional support and a strong AI + blockchain narrative. Growing demand reflects confidence in the project and could drive further gains in the coming months.
✍️ By Trader Berlin #SwarmNetwork #SWM #Blockchain #AI #Investments #TraderBerlin #BinanceSquare #Crypto #Tokenization #BullRun2027
{future}(TRUTHUSDT)
$TRUTH
💥💥💥💥💥💥💥
🚀 Swarm Network (SWM): Rising Demand and Institutional Support
Swarm Network is back on investors’ radar following important strategic moves. The project combines blockchain and artificial intelligence, creating an ecosystem of autonomous agents that validate data and tokenized assets.
🔔 Recent News
Acquisition by Inveniam (2026): The data infrastructure company acquired Swarm, bringing institutional credibility and integration with private markets.
Technical update “Akira v15”: Performance and scalability improvements, reinforcing the commitment to ongoing development.
Expansion of dOTC on BNB Chain: Infrastructure for trading real-world assets (RWAs), opening the door to regulated capital inflows.
Network growth: An increase in active nodes and monthly rewards, signaling greater community participation.
💰 Investors and Demand
Inveniam is the main institutional investor involved.
Positive capital flows: Money inflows significantly exceed outflows.
Market sentiment: Buying predominates, with little selling pressure.
Outlook: Gradual appreciation as adoption grows and integration into real-world markets expands.
🎯 Conclusion
Swarm Network is in a phase of recovery and expansion, with institutional support and a strong AI + blockchain narrative. Growing demand reflects confidence in the project and could drive further gains in the coming months.
✍️ By Trader Berlin #SwarmNetwork #SWM #Blockchain #AI #Investments #TraderBerlin #BinanceSquare #Crypto #Tokenization #BullRun2027
💥💥💥💥💥💥💥
🚀 Swarm Network (SWM): Rising Demand and Institutional Support
Swarm Network is back on investors’ radar following important strategic moves. The project combines blockchain and artificial intelligence, creating an ecosystem of autonomous agents that validate data and tokenized assets.
🔔 Recent News
Acquisition by Inveniam (2026): The data infrastructure company acquired Swarm, bringing institutional credibility and integration with private markets.
Technical update “Akira v15”: Performance and scalability improvements, reinforcing the commitment to ongoing development.
Expansion of dOTC on BNB Chain: Infrastructure for trading real-world assets (RWAs), opening the door to regulated capital inflows.
Network growth: An increase in active nodes and monthly rewards, signaling greater community participation.
💰 Investors and Demand
Inveniam is the main institutional investor involved.
Positive capital flows: Money inflows significantly exceed outflows.
Market sentiment: Buying predominates, with little selling pressure.
Outlook: Gradual appreciation as adoption grows and integration into real-world markets expands.
🎯 Conclusion
Swarm Network is in a phase of recovery and expansion, with institutional support and a strong AI + blockchain narrative. Growing demand reflects confidence in the project and could drive further gains in the coming months.
✍️ By Trader Berlin #SwarmNetwork #SWM #Blockchain #AI #Investments #TraderBerlin #BinanceSquare #Crypto #Tokenization #BullRun2027
95
·
--
Bullish
$BTW
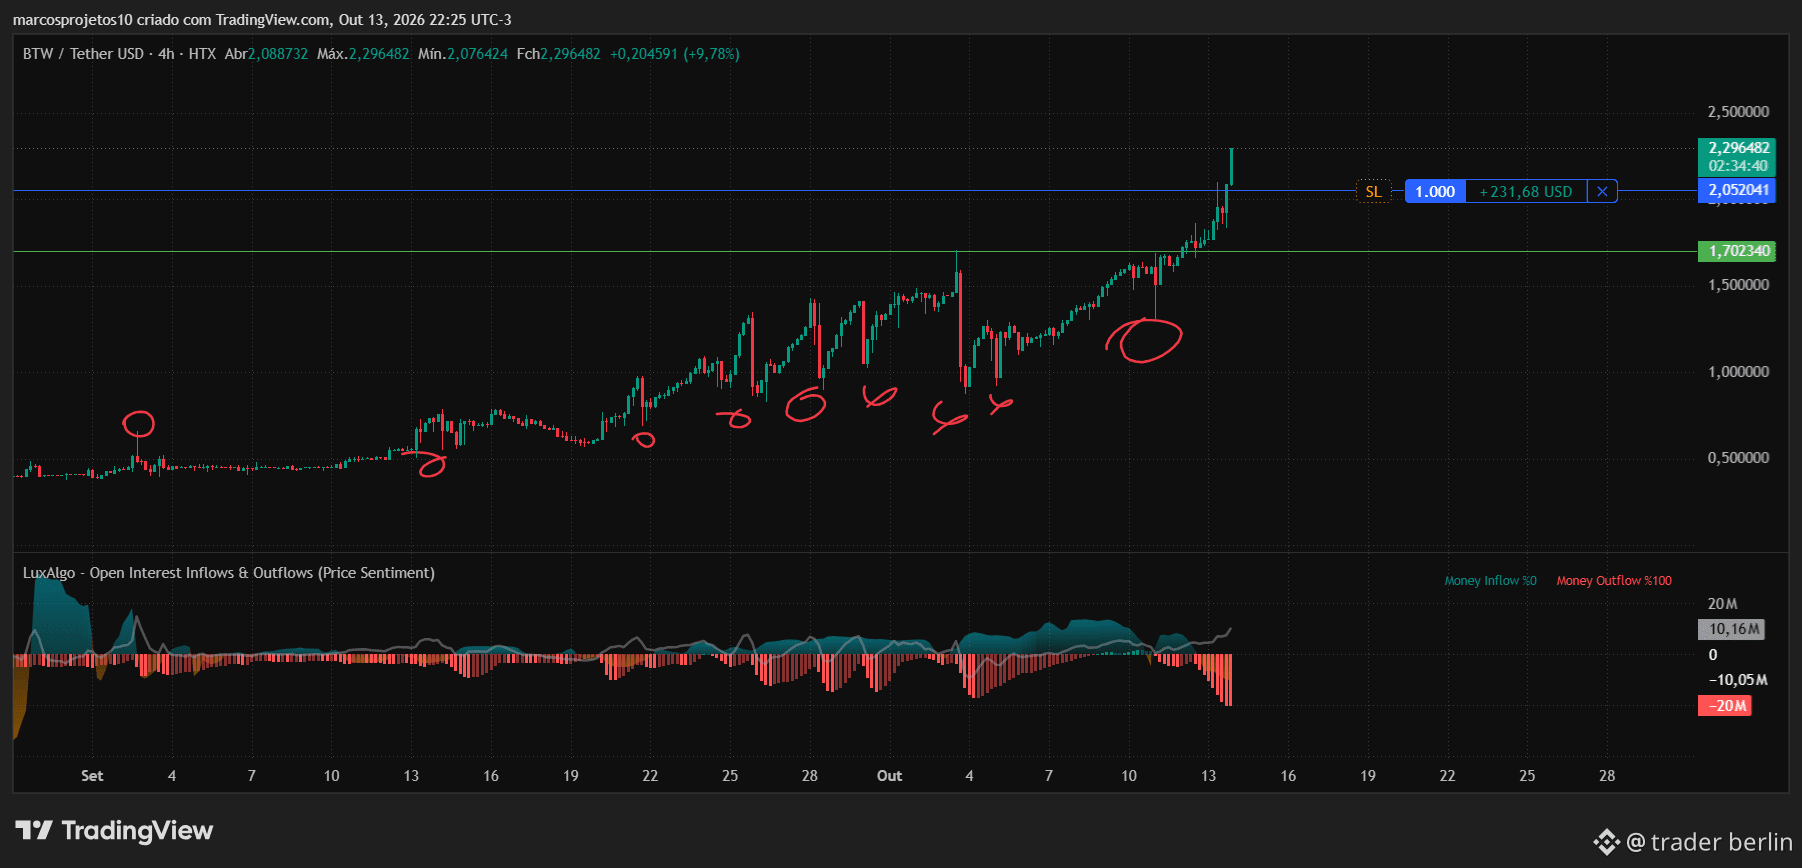
📈 Bitway (BTW): Profit-Taking and Expectations of a New Rally
The chart clearly shows moments of profit-taking (marked in red), when some investors took the opportunity to cash out with partial gains. Even so, the overall movement remains strongly upward, with the current price around US$2.29, up +9.78% over the past few hours.
These isolated profit-taking moves have not changed the trend—the flow of capital remains positive, and many traders are still waiting for another wave of gains before taking profits. Technical support at US$1.70 remains firm, while the psychological target of US$2.50 is beginning to emerge as the next resistance level.
💹 Technical summary:
Some profit-taking has already occurred.
The overall trend remains bullish.
Money inflow still exceeds outflow.
Expectations of further profit-taking above US$2.50.
✍️ By Trader Berlin Technical analysis and market behavior BTW/USDT
🔖 Hashtags
#Bitway #BTW #TraderBerlin #Crypto #Blockchain #Investments #TechnicalAnalysis #BullRun2027 #BinanceSquare
{future}(BTWUSDT)
$BTW
📈 Bitway (BTW): Profit-Taking and Expectations of a New Rally
The chart clearly shows moments of profit-taking (marked in red), when some investors took the opportunity to cash out with partial gains. Even so, the overall movement remains strongly upward, with the current price around US$2.29, up +9.78% over the past few hours.
These isolated profit-taking moves have not changed the trend—the flow of capital remains positive, and many traders are still waiting for another wave of gains before taking profits. Technical support at US$1.70 remains firm, while the psychological target of US$2.50 is beginning to emerge as the next resistance level.
💹 Technical summary:
Some profit-taking has already occurred.
The overall trend remains bullish.
Money inflow still exceeds outflow.
Expectations of further profit-taking above US$2.50.
✍️ By Trader Berlin Technical analysis and market behavior BTW/USDT
🔖 Hashtags
#Bitway #BTW #TraderBerlin #Crypto #Blockchain #Investments #TechnicalAnalysis #BullRun2027 #BinanceSquare
📈 Bitway (BTW): Profit-Taking and Expectations of a New Rally
The chart clearly shows moments of profit-taking (marked in red), when some investors took the opportunity to cash out with partial gains. Even so, the overall movement remains strongly upward, with the current price around US$2.29, up +9.78% over the past few hours.
These isolated profit-taking moves have not changed the trend—the flow of capital remains positive, and many traders are still waiting for another wave of gains before taking profits. Technical support at US$1.70 remains firm, while the psychological target of US$2.50 is beginning to emerge as the next resistance level.
💹 Technical summary:
Some profit-taking has already occurred.
The overall trend remains bullish.
Money inflow still exceeds outflow.
Expectations of further profit-taking above US$2.50.
✍️ By Trader Berlin Technical analysis and market behavior BTW/USDT
🔖 Hashtags
#Bitway #BTW #TraderBerlin #Crypto #Blockchain #Investments #TechnicalAnalysis #BullRun2027 #BinanceSquare
215
·
--
Bullish
{future}(BTWUSDT)
$BTW
💥💥💥💥💥
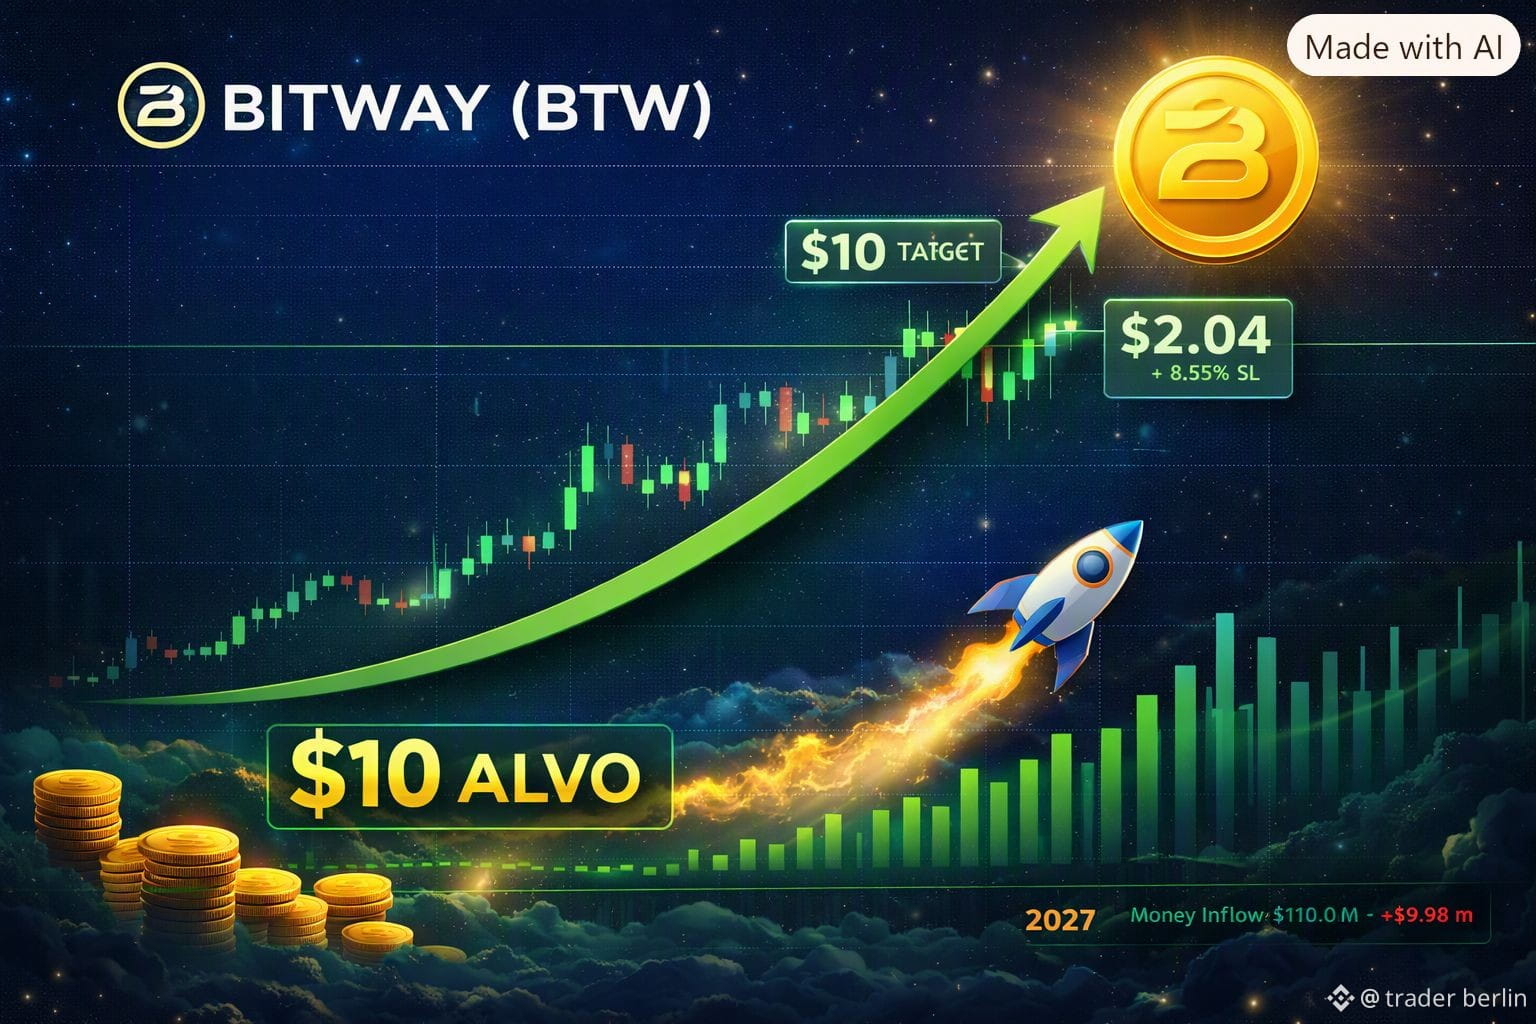
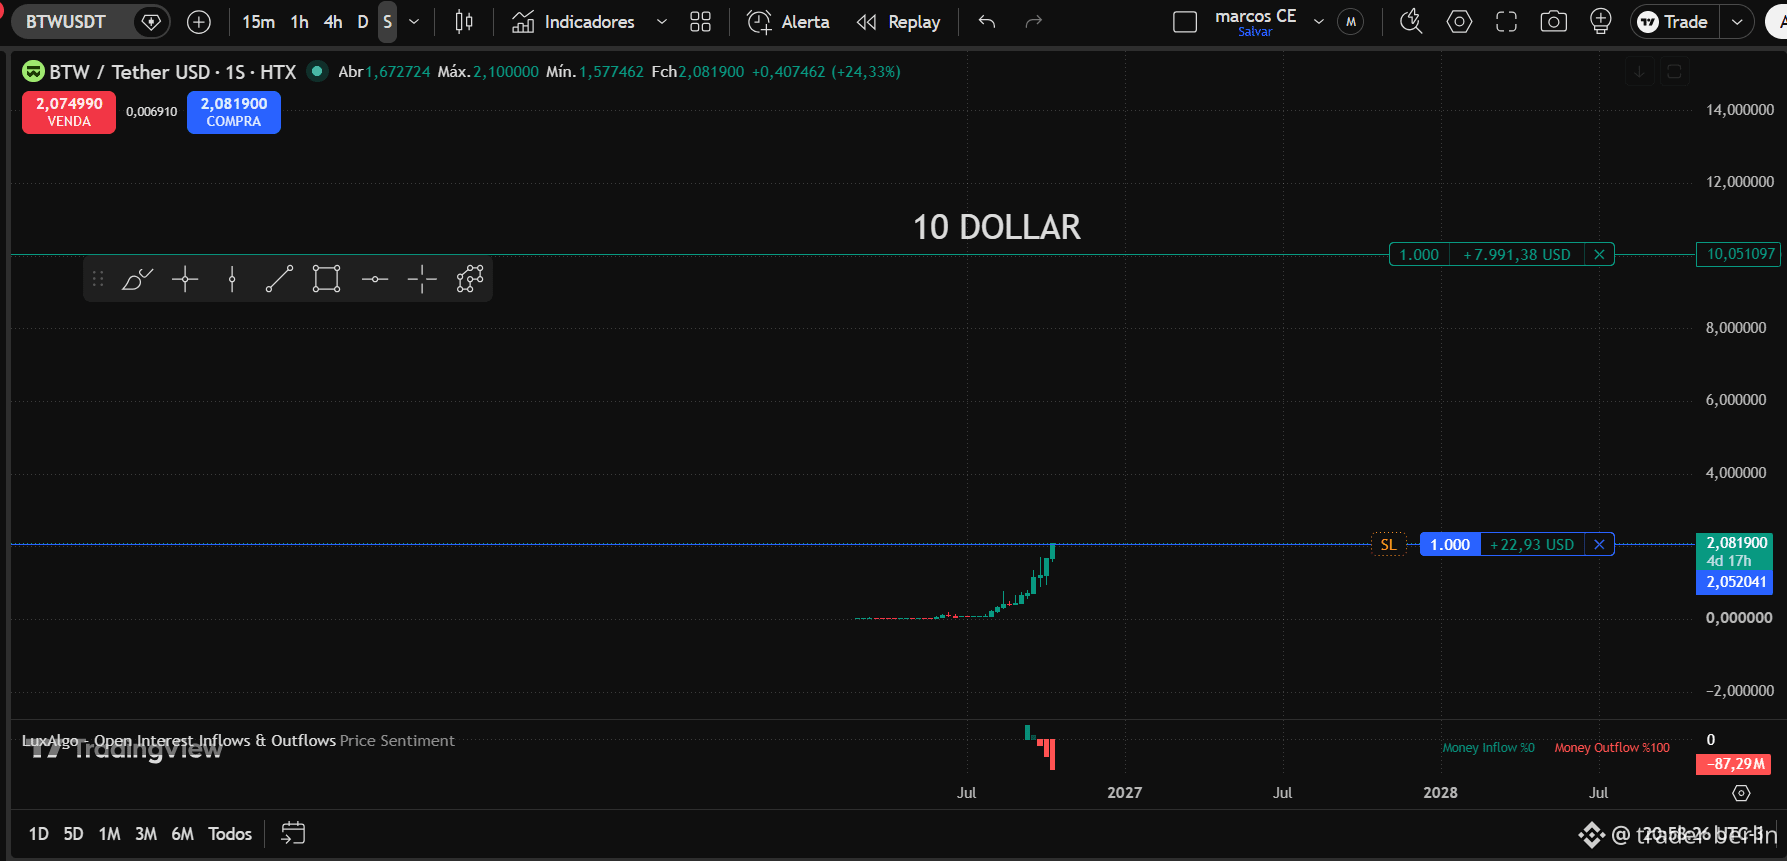
🚀 Bitway (BTW) on its way to $10 in 2027! With 71% of tokens locked until 2030, the market continues to absorb unlocks without major drops. Growing liquidity and a strong narrative make the $10 target in 2027 increasingly plausible.
🎯 Do you believe BTW will get there?
🔖 Hashtags
#Bitway #BTW #BinanceSquare #Crypto #Blockchain #Investment #BullRun2027 #TraderBerlin
$BTW
💥💥💥💥💥
🚀 Bitway (BTW) on its way to $10 in 2027! With 71% of tokens locked until 2030, the market continues to absorb unlocks without major drops. Growing liquidity and a strong narrative make the $10 target in 2027 increasingly plausible.
🎯 Do you believe BTW will get there?
🔖 Hashtags
#Bitway #BTW #BinanceSquare #Crypto #Blockchain #Investment #BullRun2027 #TraderBerlin
💥💥💥💥💥
🚀 Bitway (BTW) on its way to $10 in 2027! With 71% of tokens locked until 2030, the market continues to absorb unlocks without major drops. Growing liquidity and a strong narrative make the $10 target in 2027 increasingly plausible.
🎯 Do you believe BTW will get there?
🔖 Hashtags
#Bitway #BTW #BinanceSquare #Crypto #Blockchain #Investment #BullRun2027 #TraderBerlin
2
545
·
--
Bullish
$BTW
🚀 Bitway (BTW): On Track for US$10 in 2027
📊 Current Situation
Price: ~US$1.88 (R$8.64)
Market cap: ~R$25.1 billion
Circulating supply: 29% (2.91 billion BTW)
Major exchanges: Binance, Bybit, Gate, MEXC, Bitget
BTW has already risen as much as 18x since its presale, with growing volumes and robust liquidity.
🔒 Vesting and Holder Influence
71% of tokens are still locked until 2030.
Backers (16.3%) and the Team (20%) hold significant selling power, but can only release tokens according to the schedule.
Upcoming critical unlocks:
02/11/2026 → 101.6M BTW (1%)
01/01/2027 → 200M BTW (2%) → Backers
02/03/2027 → 250M BTW (2.5%) → Team
📈 Outlook
Short term (2026): moderate risk, small unlocks.
Medium term (2027): elevated risk, large releases.
Bullish outlook: market absorption and growing adoption could take BTW to US$10 in 2027.
Comparisons with SUI, APT, and ARB show that tokens with long vesting periods can appreciate even after large unlocks, provided there is liquidity and a strong narrative.
🎯 Conclusion
Bitway (BTW) combines solid fundamentals, growing liquidity, and an active community. If the market continues to absorb the unlocks without major drops, the US$10 target in 2027 is technically viable and supported by positive flows.
✍️ By Trader Berlin, market analyst and crypto asset specialist
🔖 Hashtags
#Bitway #BTW #Crypto #Blockchain #Binance #Investments #Cryptocurrency #BullRun2027 #TraderBerlin #Bitway #BTW #BinanceSquare #Crypto #Blockchain #Investment #BullRun2027
{future}(BTWUSDT)
$BTW
🚀 Bitway (BTW): On Track for US$10 in 2027
📊 Current Situation
Price: ~US$1.88 (R$8.64)
Market cap: ~R$25.1 billion
Circulating supply: 29% (2.91 billion BTW)
Major exchanges: Binance, Bybit, Gate, MEXC, Bitget
BTW has already risen as much as 18x since its presale, with growing volumes and robust liquidity.
🔒 Vesting and Holder Influence
71% of tokens are still locked until 2030.
Backers (16.3%) and the Team (20%) hold significant selling power, but can only release tokens according to the schedule.
Upcoming critical unlocks:
02/11/2026 → 101.6M BTW (1%)
01/01/2027 → 200M BTW (2%) → Backers
02/03/2027 → 250M BTW (2.5%) → Team
📈 Outlook
Short term (2026): moderate risk, small unlocks.
Medium term (2027): elevated risk, large releases.
Bullish outlook: market absorption and growing adoption could take BTW to US$10 in 2027.
Comparisons with SUI, APT, and ARB show that tokens with long vesting periods can appreciate even after large unlocks, provided there is liquidity and a strong narrative.
🎯 Conclusion
Bitway (BTW) combines solid fundamentals, growing liquidity, and an active community. If the market continues to absorb the unlocks without major drops, the US$10 target in 2027 is technically viable and supported by positive flows.
✍️ By Trader Berlin, market analyst and crypto asset specialist
🔖 Hashtags
#Bitway #BTW #Crypto #Blockchain #Binance #Investments #Cryptocurrency #BullRun2027 #TraderBerlin #Bitway #BTW #BinanceSquare #Crypto #Blockchain #Investment #BullRun2027
🚀 Bitway (BTW): On Track for US$10 in 2027
📊 Current Situation
Price: ~US$1.88 (R$8.64)
Market cap: ~R$25.1 billion
Circulating supply: 29% (2.91 billion BTW)
Major exchanges: Binance, Bybit, Gate, MEXC, Bitget
BTW has already risen as much as 18x since its presale, with growing volumes and robust liquidity.
🔒 Vesting and Holder Influence
71% of tokens are still locked until 2030.
Backers (16.3%) and the Team (20%) hold significant selling power, but can only release tokens according to the schedule.
Upcoming critical unlocks:
02/11/2026 → 101.6M BTW (1%)
01/01/2027 → 200M BTW (2%) → Backers
02/03/2027 → 250M BTW (2.5%) → Team
📈 Outlook
Short term (2026): moderate risk, small unlocks.
Medium term (2027): elevated risk, large releases.
Bullish outlook: market absorption and growing adoption could take BTW to US$10 in 2027.
Comparisons with SUI, APT, and ARB show that tokens with long vesting periods can appreciate even after large unlocks, provided there is liquidity and a strong narrative.
🎯 Conclusion
Bitway (BTW) combines solid fundamentals, growing liquidity, and an active community. If the market continues to absorb the unlocks without major drops, the US$10 target in 2027 is technically viable and supported by positive flows.
✍️ By Trader Berlin, market analyst and crypto asset specialist
🔖 Hashtags
#Bitway #BTW #Crypto #Blockchain #Binance #Investments #Cryptocurrency #BullRun2027 #TraderBerlin #Bitway #BTW #BinanceSquare #Crypto #Blockchain #Investment #BullRun2027

1
317
·
--
Bullish
$btw
{future}(BTWUSDT)
🚀 Bitway (BTW): On track for US$10 in 2027!
The project remains strong, with rising volumes and positive flows, while 71% of the tokens are still locked — ensuring stability and reducing selling pressure.
With growing adoption and solid liquidity, the outlook points to steady appreciation without major drops.
💹 Target: US$10 in 2027 — Bitway's future is just getting started!
#Bitway #BTW #Crypto #Blockchain #Binance #Investments #Cryptocurrencies #BullRun2027 #Bitway #BTW #BinanceSquare #Crypto #Blockchain #Investment #BullRun2027
$btw
🚀 Bitway (BTW): On track for US$10 in 2027!
The project remains strong, with rising volumes and positive flows, while 71% of the tokens are still locked — ensuring stability and reducing selling pressure.
With growing adoption and solid liquidity, the outlook points to steady appreciation without major drops.
💹 Target: US$10 in 2027 — Bitway's future is just getting started!
#Bitway #BTW #Crypto #Blockchain #Binance #Investments #Cryptocurrencies #BullRun2027 #Bitway #BTW #BinanceSquare #Crypto #Blockchain #Investment #BullRun2027
🚀 Bitway (BTW): On track for US$10 in 2027!
The project remains strong, with rising volumes and positive flows, while 71% of the tokens are still locked — ensuring stability and reducing selling pressure.
With growing adoption and solid liquidity, the outlook points to steady appreciation without major drops.
💹 Target: US$10 in 2027 — Bitway's future is just getting started!
#Bitway #BTW #Crypto #Blockchain #Binance #Investments #Cryptocurrencies #BullRun2027 #Bitway #BTW #BinanceSquare #Crypto #Blockchain #Investment #BullRun2027

200
·
--
Bearish
$btc
{future}(BTCUSDT)
🚆 Those who missed the entry got lucky!
The market gave us a second chance — Bitcoin’s price returned to the entry point, ready to board.
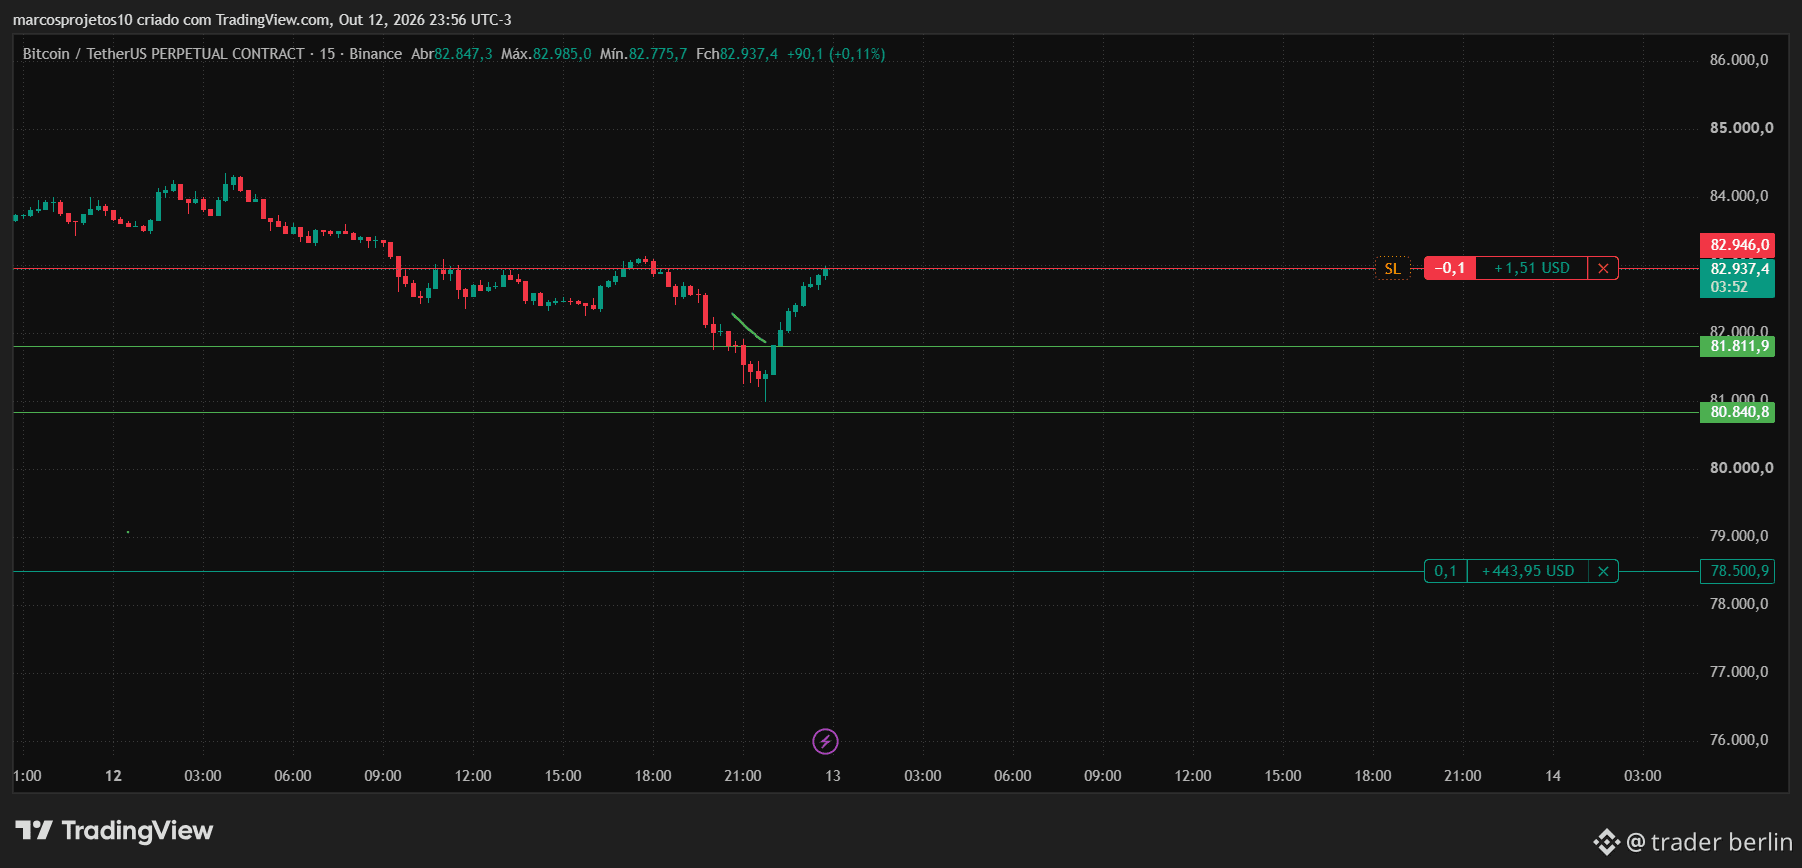
The chart shows the opportunity train passing through the 81,811.9 USD station again, headed for the target at 78,500.9 USD.
Those who missed the first ride can now get on board and take advantage of the move.
Stop adjusted to 82,946.0 USD for added security.
#Bitcoin #TradingView #Crypto #TechnicalAnalysis #BTC #Trader #Investments #FinancialMarkets #Opportunity #CryptoTrain #TradeSetup #PriceAction
$btc
🚆 Those who missed the entry got lucky!
The market gave us a second chance — Bitcoin’s price returned to the entry point, ready to board.
The chart shows the opportunity train passing through the 81,811.9 USD station again, headed for the target at 78,500.9 USD.
Those who missed the first ride can now get on board and take advantage of the move.
Stop adjusted to 82,946.0 USD for added security.
#Bitcoin #TradingView #Crypto #TechnicalAnalysis #BTC #Trader #Investments #FinancialMarkets #Opportunity #CryptoTrain #TradeSetup #PriceAction
🚆 Those who missed the entry got lucky!
The market gave us a second chance — Bitcoin’s price returned to the entry point, ready to board.
The chart shows the opportunity train passing through the 81,811.9 USD station again, headed for the target at 78,500.9 USD.
Those who missed the first ride can now get on board and take advantage of the move.
Stop adjusted to 82,946.0 USD for added security.
#Bitcoin #TradingView #Crypto #TechnicalAnalysis #BTC #Trader #Investments #FinancialMarkets #Opportunity #CryptoTrain #TradeSetup #PriceAction
107
·
--
Bullish
$BTC
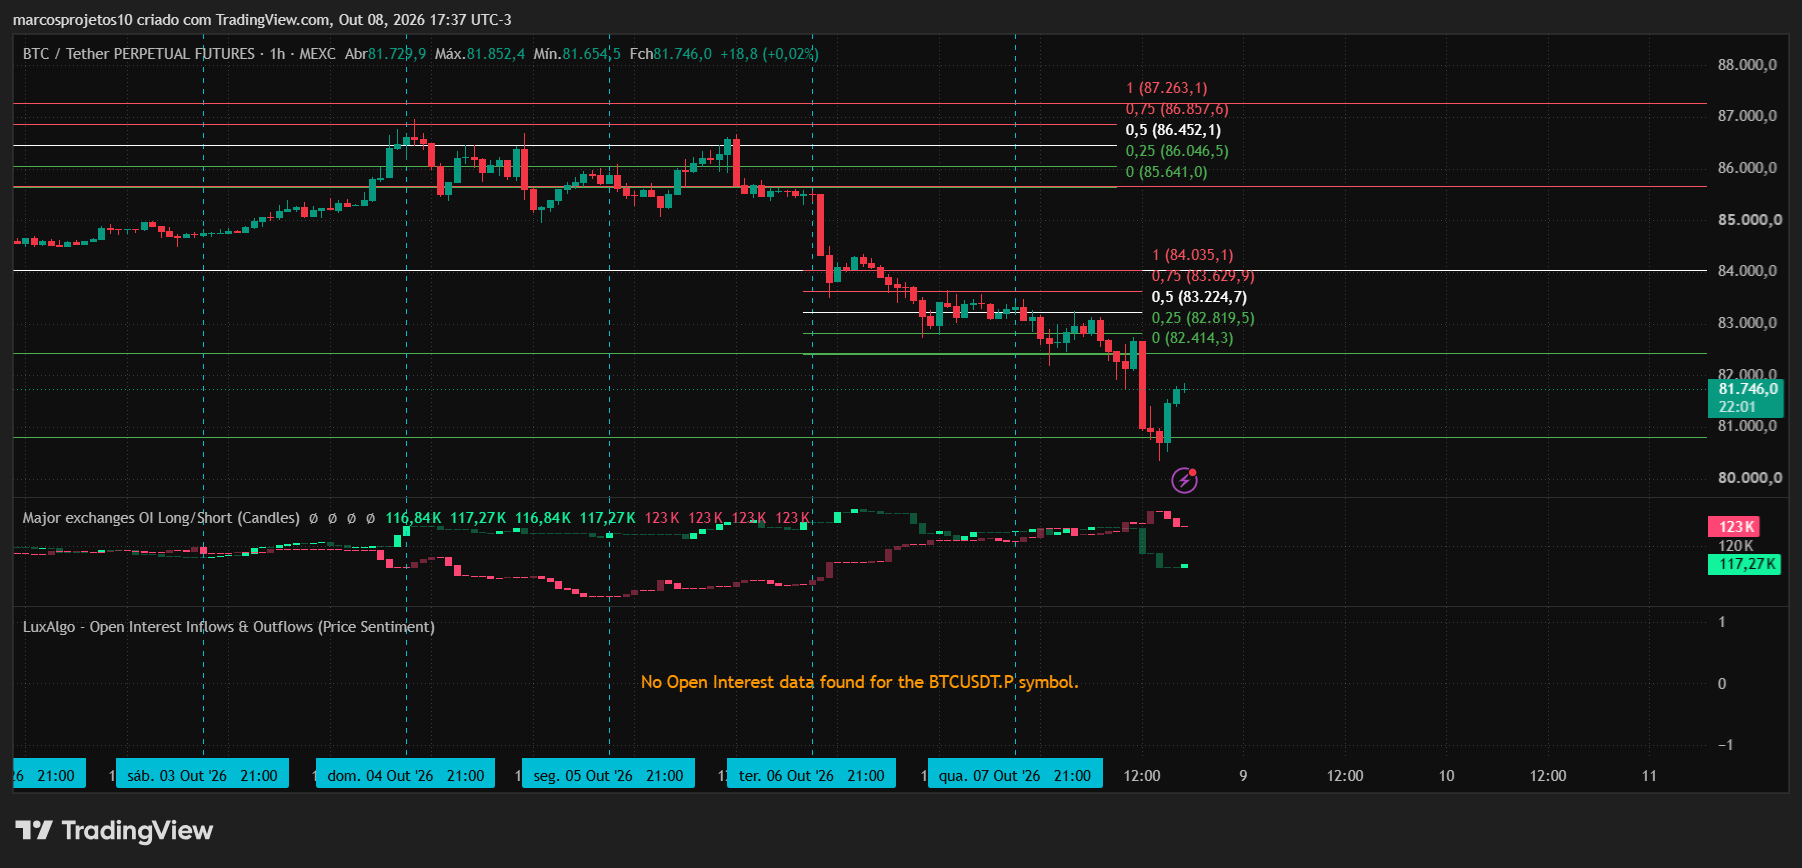
🚀 Bitcoin confirms support — buying opportunity!
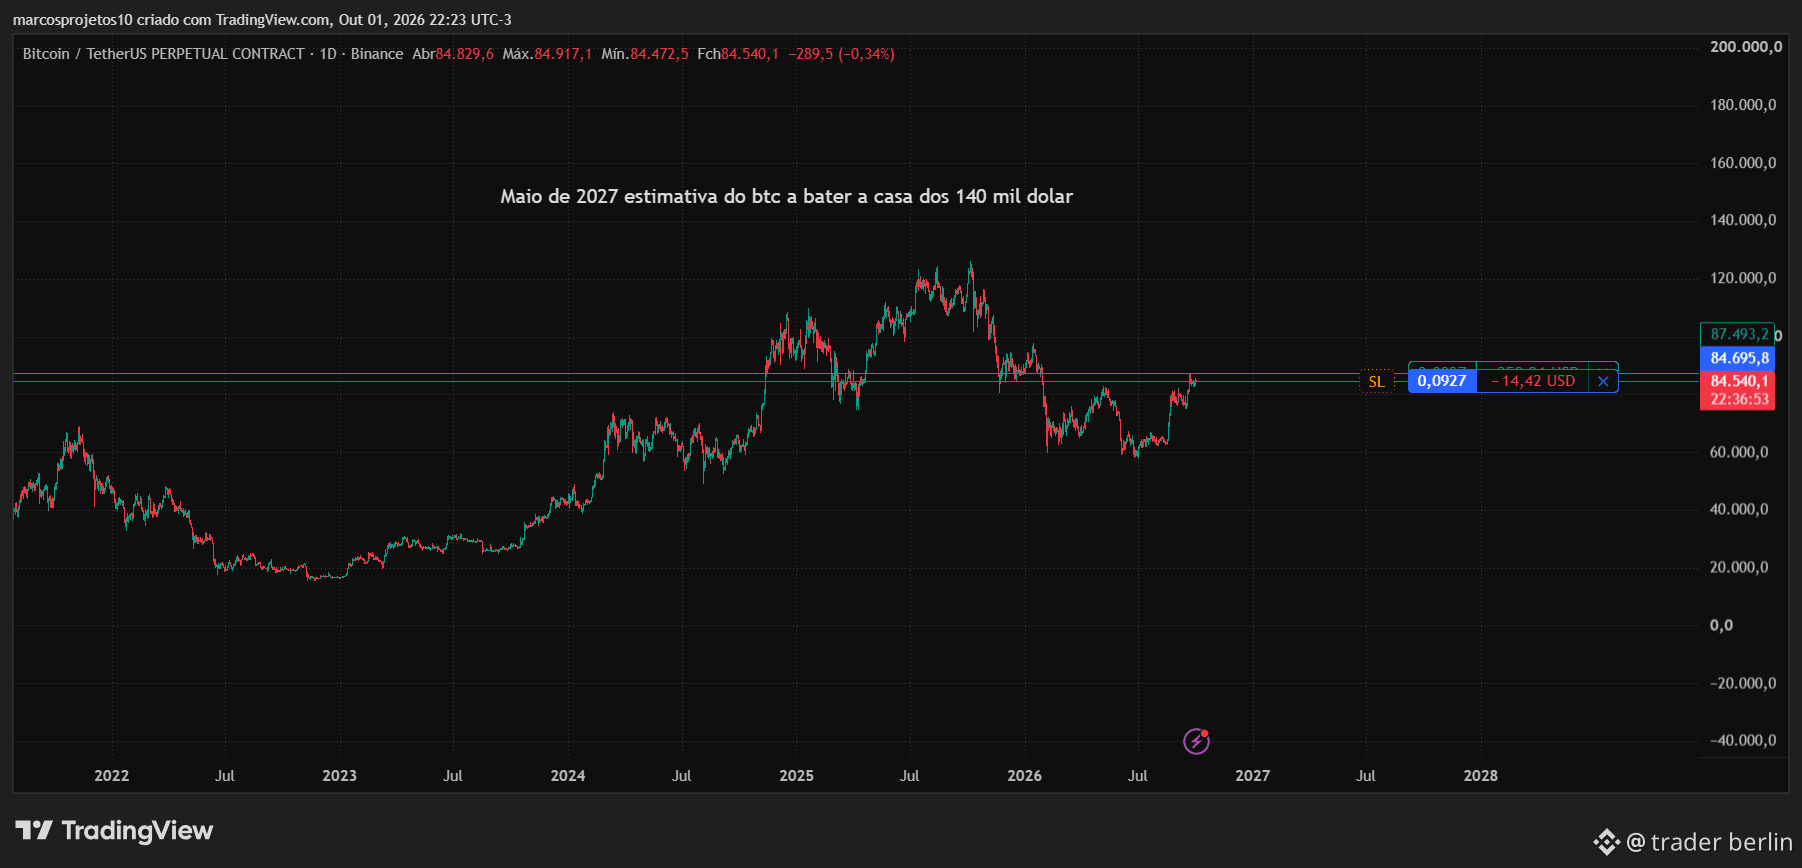
Text: Bitcoin held support at $80,193 and is showing signs of a reversal on the 4-hour chart. The technical target is $84,000, with a stop below support. Growing buying volume and favorable OI reinforce the bullish outlook. 📈 Validated technical setup — focus on the trend resuming!
{future}(BTCUSDT)
$BTC
🚀 Bitcoin confirms support — buying opportunity!
Text: Bitcoin held support at $80,193 and is showing signs of a reversal on the 4-hour chart. The technical target is $84,000, with a stop below support. Growing buying volume and favorable OI reinforce the bullish outlook. 📈 Validated technical setup — focus on the trend resuming!
🚀 Bitcoin confirms support — buying opportunity!
Text: Bitcoin held support at $80,193 and is showing signs of a reversal on the 4-hour chart. The technical target is $84,000, with a stop below support. Growing buying volume and favorable OI reinforce the bullish outlook. 📈 Validated technical setup — focus on the trend resuming!
873
Log in to explore more content
Join global crypto users on Binance Square
⚡️ Get latest and useful information about crypto.
💬 Trusted by the world’s largest crypto exchange.
👍 Discover real insights from verified creators.
Email / Phone number
Trending Topics
WhoWillSucceedJensenHuangatNvidia?
62,897 views
850 Discussing
Nvidia Says No CEO Talks Underway as "Stand With Jensen" Petition Tops 77,900 Signatures
Binance News
·20 Likes
·27k views
WhatWillDriveCryptoandStocks’NextRebound?
395,377 views
2,799 Discussing
BitcoinActiveSupplyInProfitDropsBelow45%
6,769 views
158 Discussing