
AiCoin小编
346 Posts

AiCoin小编
Report
Block User
盯数据,看主力,偶尔聊点盘口之外的思考
1 Following
73 Followers
114 Liked
Posts
All
Quotes
Videos
·
--
Verified
$ANTHROPIC The market hasn’t even opened yet, and crypto has already pumped it up 25% 👀
Anthropic officially debuts on Nasdaq tonight, with its IPO priced at $83.
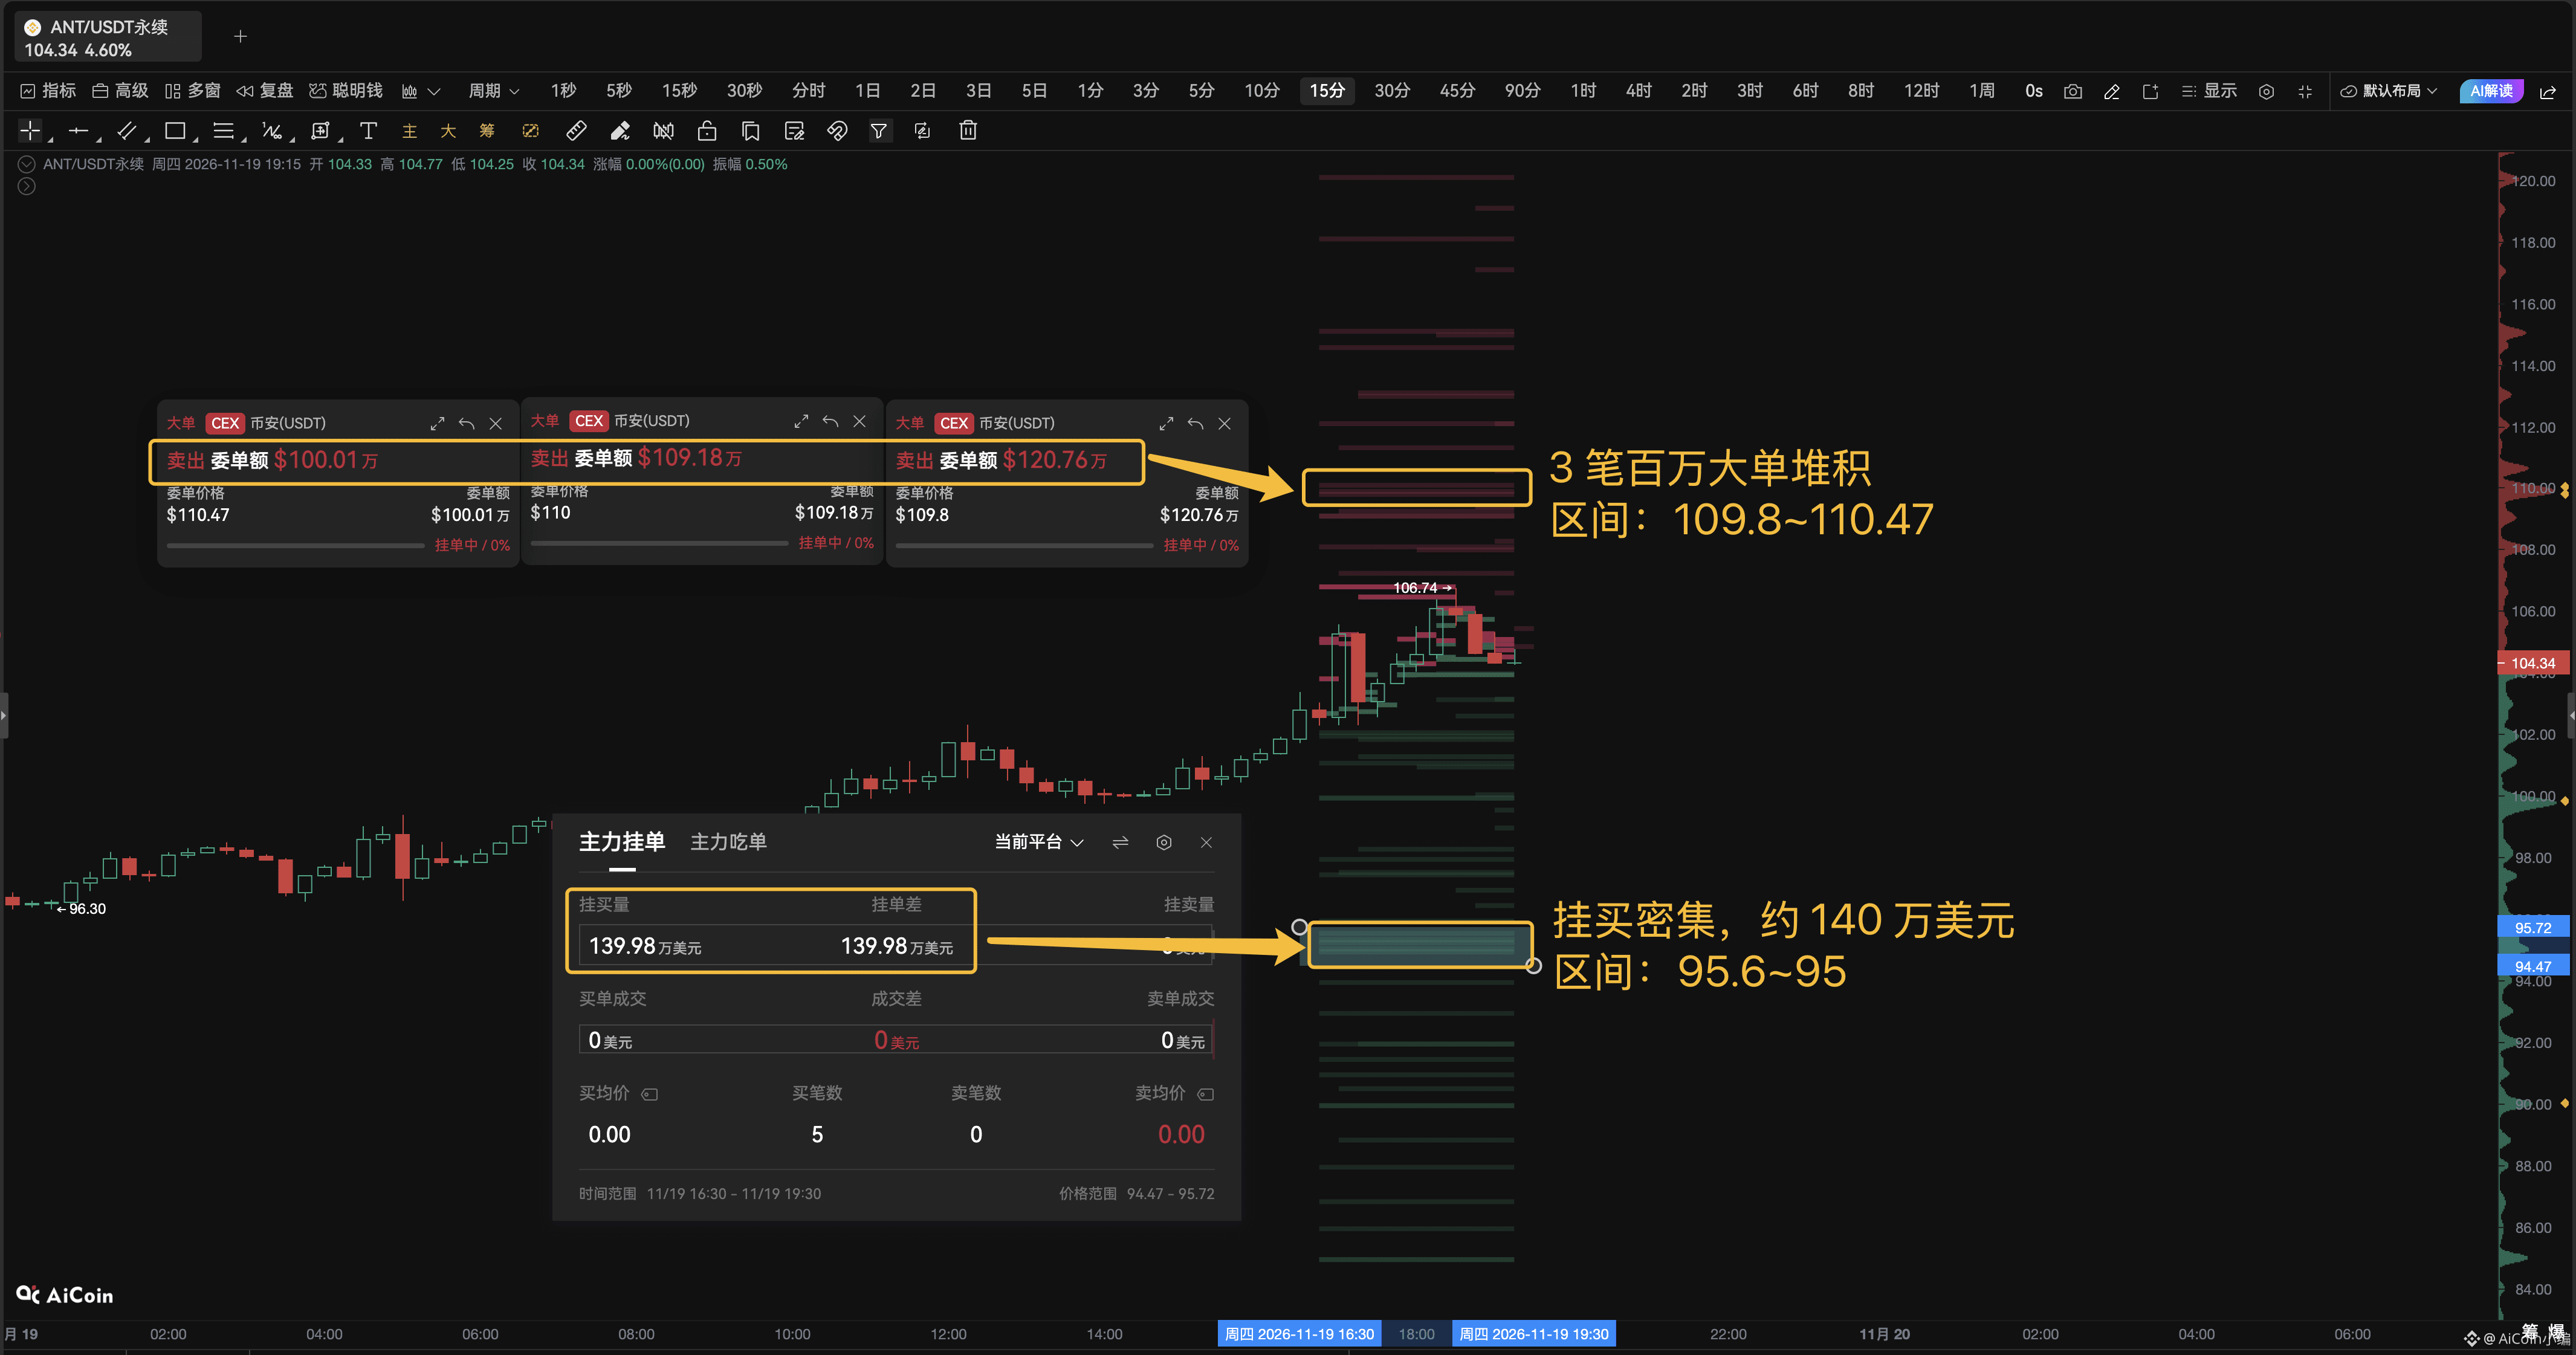
But Binance’s ANT/USDT perpetual is already trading around $104, a premium of about 25%.
As for the order book:
🔺 Above, at $109.8–$110.47: three million-dollar sell orders, totaling around $3.3 million.
🔻 Below, at $95.6–$95: buy orders worth nearly $1.4 million are stacked up.
So the question now isn’t whether ANT will rise—it’s whether ANT is worth $95 or $110+ tonight.
If the U.S. market opens and immediately eats through the sell orders above $110, that means buyers are still scrambling to get in on day one;
if the open disappoints, the $95 area is where the first wave of early buyers will look to catch it.
#Anthropic #Claude
$ANTHROPIC The market hasn’t even opened yet, and crypto has already pumped it up 25% 👀
Anthropic officially debuts on Nasdaq tonight, with its IPO priced at $83.
But Binance’s ANT/USDT perpetual is already trading around $104, a premium of about 25%.
As for the order book:
🔺 Above, at $109.8–$110.47: three million-dollar sell orders, totaling around $3.3 million.
🔻 Below, at $95.6–$95: buy orders worth nearly $1.4 million are stacked up.
So the question now isn’t whether ANT will rise—it’s whether ANT is worth $95 or $110+ tonight.
If the U.S. market opens and immediately eats through the sell orders above $110, that means buyers are still scrambling to get in on day one;
if the open disappoints, the $95 area is where the first wave of early buyers will look to catch it.
#Anthropic #Claude
Anthropic officially debuts on Nasdaq tonight, with its IPO priced at $83.
But Binance’s ANT/USDT perpetual is already trading around $104, a premium of about 25%.
As for the order book:
🔺 Above, at $109.8–$110.47: three million-dollar sell orders, totaling around $3.3 million.
🔻 Below, at $95.6–$95: buy orders worth nearly $1.4 million are stacked up.
So the question now isn’t whether ANT will rise—it’s whether ANT is worth $95 or $110+ tonight.
If the U.S. market opens and immediately eats through the sell orders above $110, that means buyers are still scrambling to get in on day one;
if the open disappoints, the $95 area is where the first wave of early buyers will look to catch it.
#Anthropic #Claude
1
1.2k
·
--
Bearish
Who exactly is dumping BTC this time—$BTC ?! 🤨
No guessing institutions or whales, and no talking about OTC or split orders.
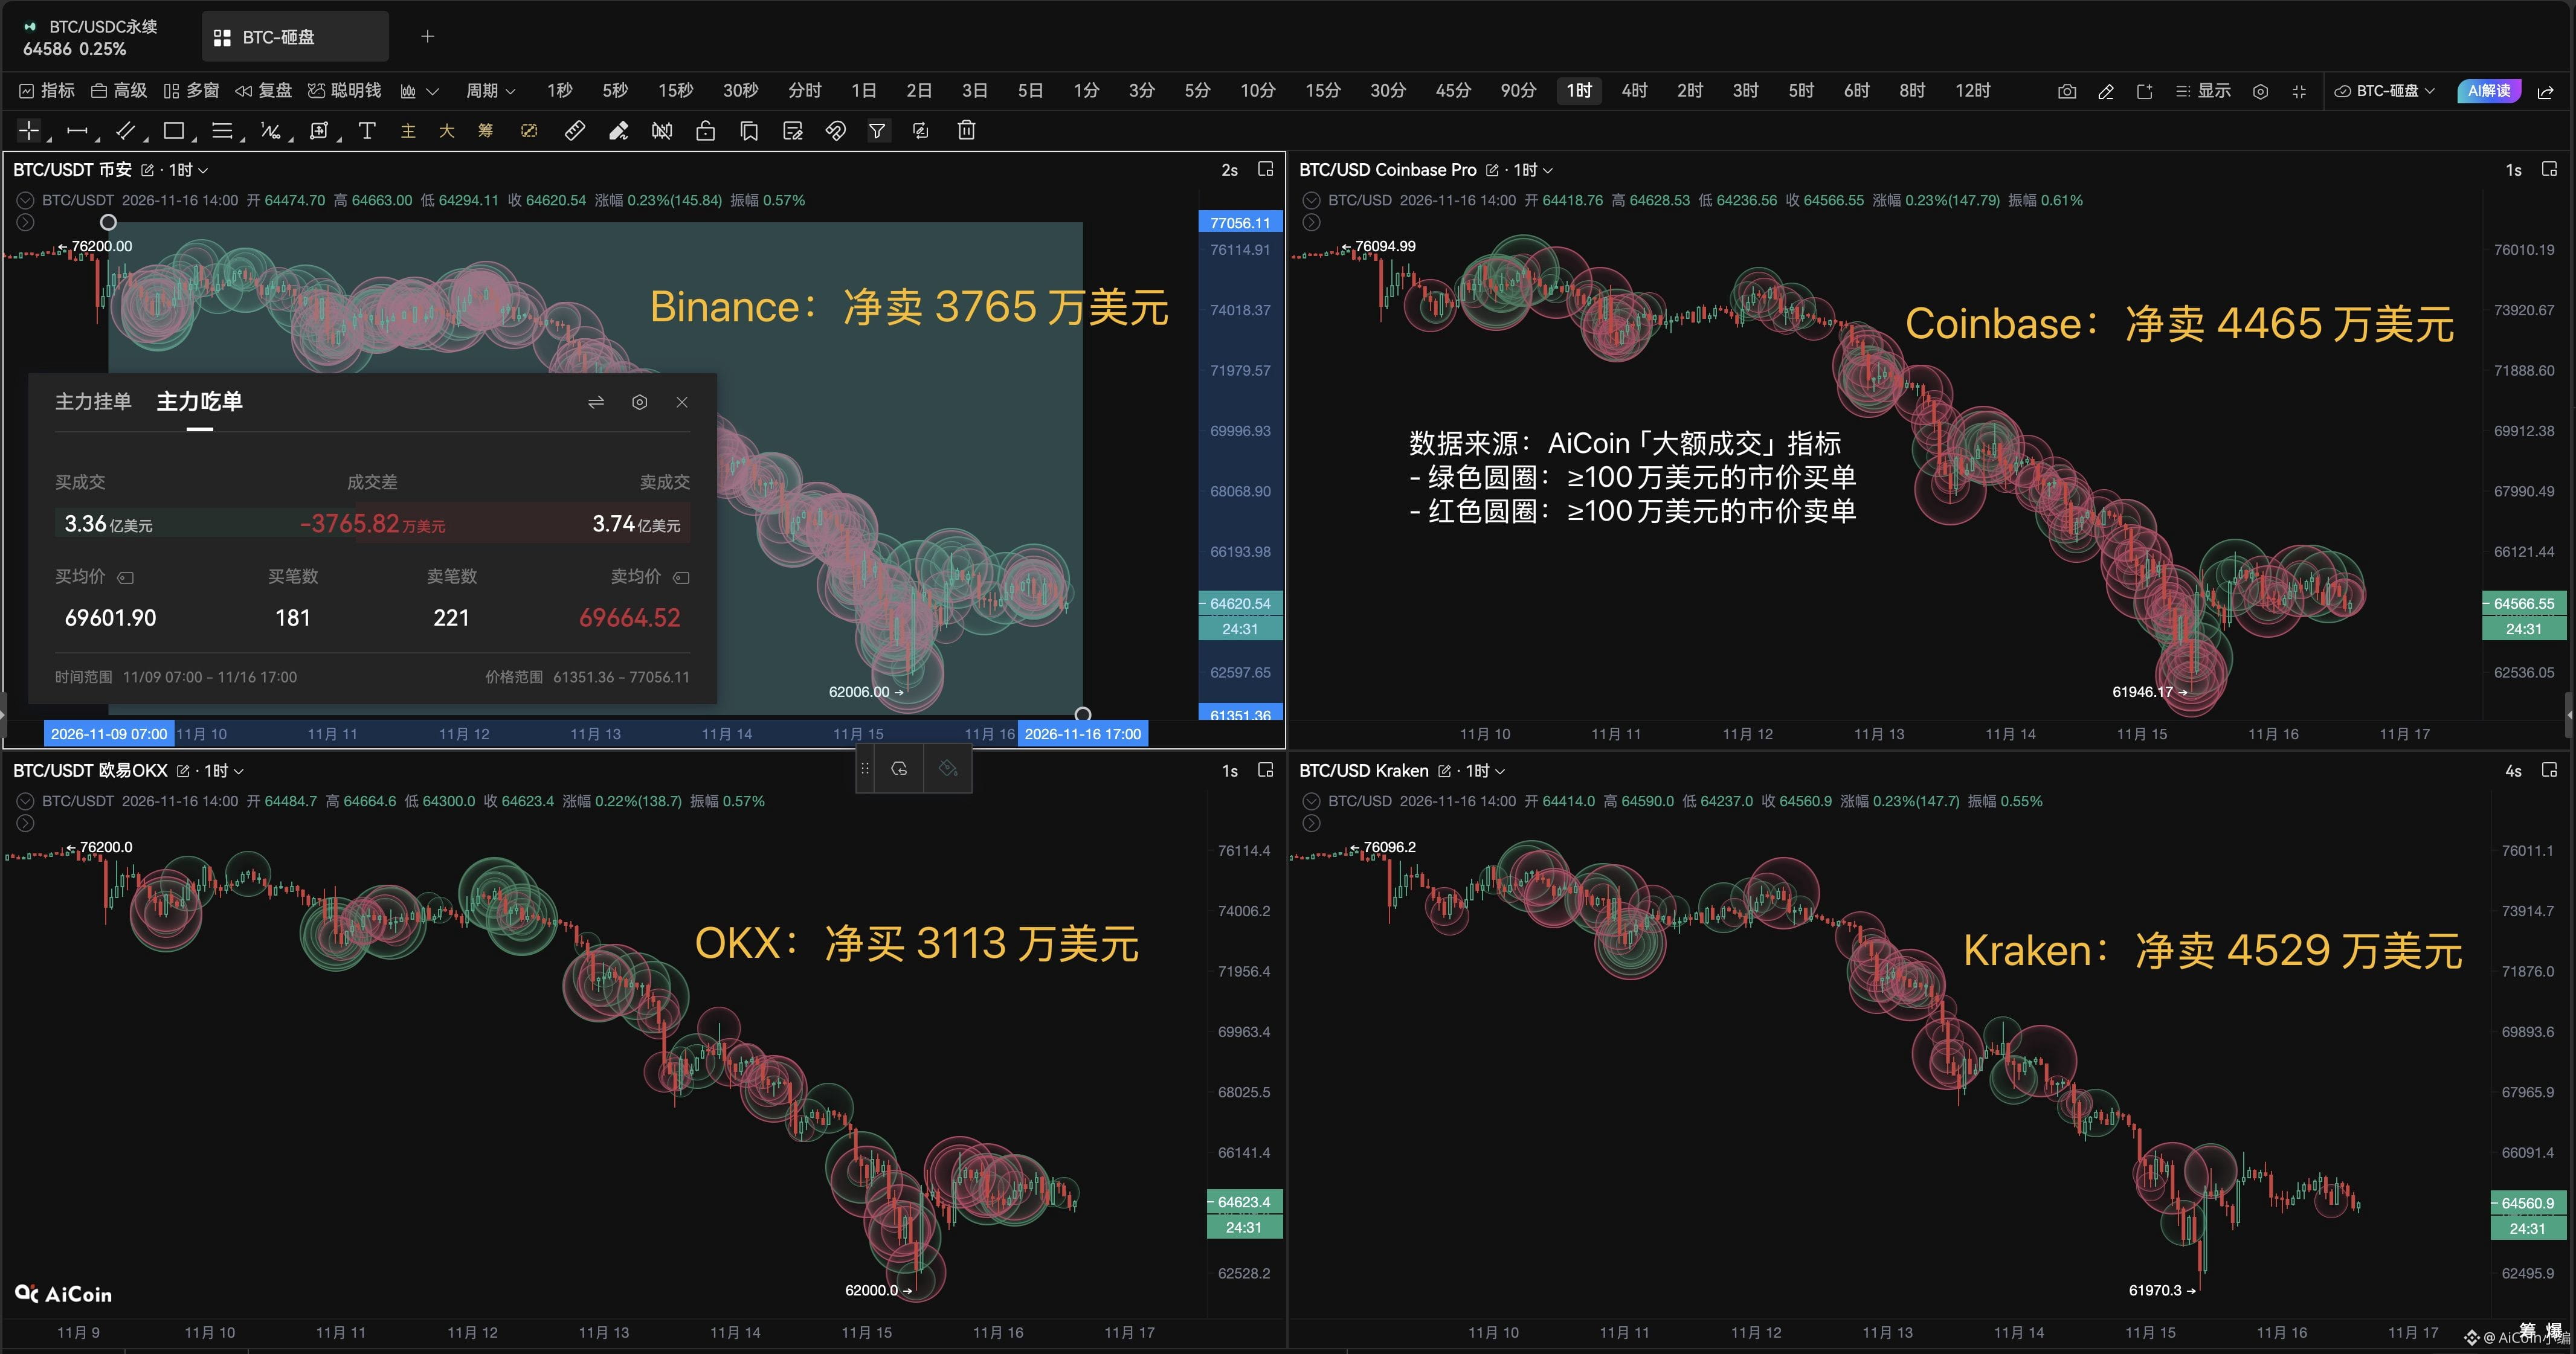
Just spot market orders of ≥$1 million over the past 7 days: 👇
- Binance: $336 million in aggressive buys, $374 million in aggressive sells, net sells of $37.65 million
- Coinbase: $185 million in aggressive buys, $230 million in aggressive sells, net sells of $44.65 million
- OKX: $112 million in aggressive buys, $80.43 million in aggressive sells, net buys of $31.13 million
- Kraken: $63.14 million in aggressive buys, $108 million in aggressive sells, net sells of $45.29 million
Across the four platforms, net selling totaled nearly $100 million, and the selling pressure was spread out—not driven by a single whale unloading on one exchange.
So at least by this measure, this drop wasn’t because “there were no buyers.” Rather, large aggressive sell orders kept dominating, while truly aggressive spot buying hasn’t returned yet.
BTC has now rebounded from 61,950 to around 64,300, but futures open interest (OI) is still declining. This looks more like a sideways recovery than a return of capital to the market.
So for now, I wouldn’t call this rebound a reversal. The real signs of a shift will be:
1️⃣ Spot net buying starts to show up consistently
2️⃣ Futures OI starts rising again
Who exactly is dumping BTC this time—$BTC ?! 🤨
No guessing institutions or whales, and no talking about OTC or split orders.
Just spot market orders of ≥$1 million over the past 7 days: 👇
- Binance: $336 million in aggressive buys, $374 million in aggressive sells, net sells of $37.65 million
- Coinbase: $185 million in aggressive buys, $230 million in aggressive sells, net sells of $44.65 million
- OKX: $112 million in aggressive buys, $80.43 million in aggressive sells, net buys of $31.13 million
- Kraken: $63.14 million in aggressive buys, $108 million in aggressive sells, net sells of $45.29 million
Across the four platforms, net selling totaled nearly $100 million, and the selling pressure was spread out—not driven by a single whale unloading on one exchange.
So at least by this measure, this drop wasn’t because “there were no buyers.” Rather, large aggressive sell orders kept dominating, while truly aggressive spot buying hasn’t returned yet.
BTC has now rebounded from 61,950 to around 64,300, but futures open interest (OI) is still declining. This looks more like a sideways recovery than a return of capital to the market.
So for now, I wouldn’t call this rebound a reversal. The real signs of a shift will be:
1️⃣ Spot net buying starts to show up consistently
2️⃣ Futures OI starts rising again
No guessing institutions or whales, and no talking about OTC or split orders.
Just spot market orders of ≥$1 million over the past 7 days: 👇
- Binance: $336 million in aggressive buys, $374 million in aggressive sells, net sells of $37.65 million
- Coinbase: $185 million in aggressive buys, $230 million in aggressive sells, net sells of $44.65 million
- OKX: $112 million in aggressive buys, $80.43 million in aggressive sells, net buys of $31.13 million
- Kraken: $63.14 million in aggressive buys, $108 million in aggressive sells, net sells of $45.29 million
Across the four platforms, net selling totaled nearly $100 million, and the selling pressure was spread out—not driven by a single whale unloading on one exchange.
So at least by this measure, this drop wasn’t because “there were no buyers.” Rather, large aggressive sell orders kept dominating, while truly aggressive spot buying hasn’t returned yet.
BTC has now rebounded from 61,950 to around 64,300, but futures open interest (OI) is still declining. This looks more like a sideways recovery than a return of capital to the market.
So for now, I wouldn’t call this rebound a reversal. The real signs of a shift will be:
1️⃣ Spot net buying starts to show up consistently
2️⃣ Futures OI starts rising again
171
·
--
$130 million in unrealized profits isn’t all—Abraxas has also pocketed $28 million in funding fees
🤩🤩
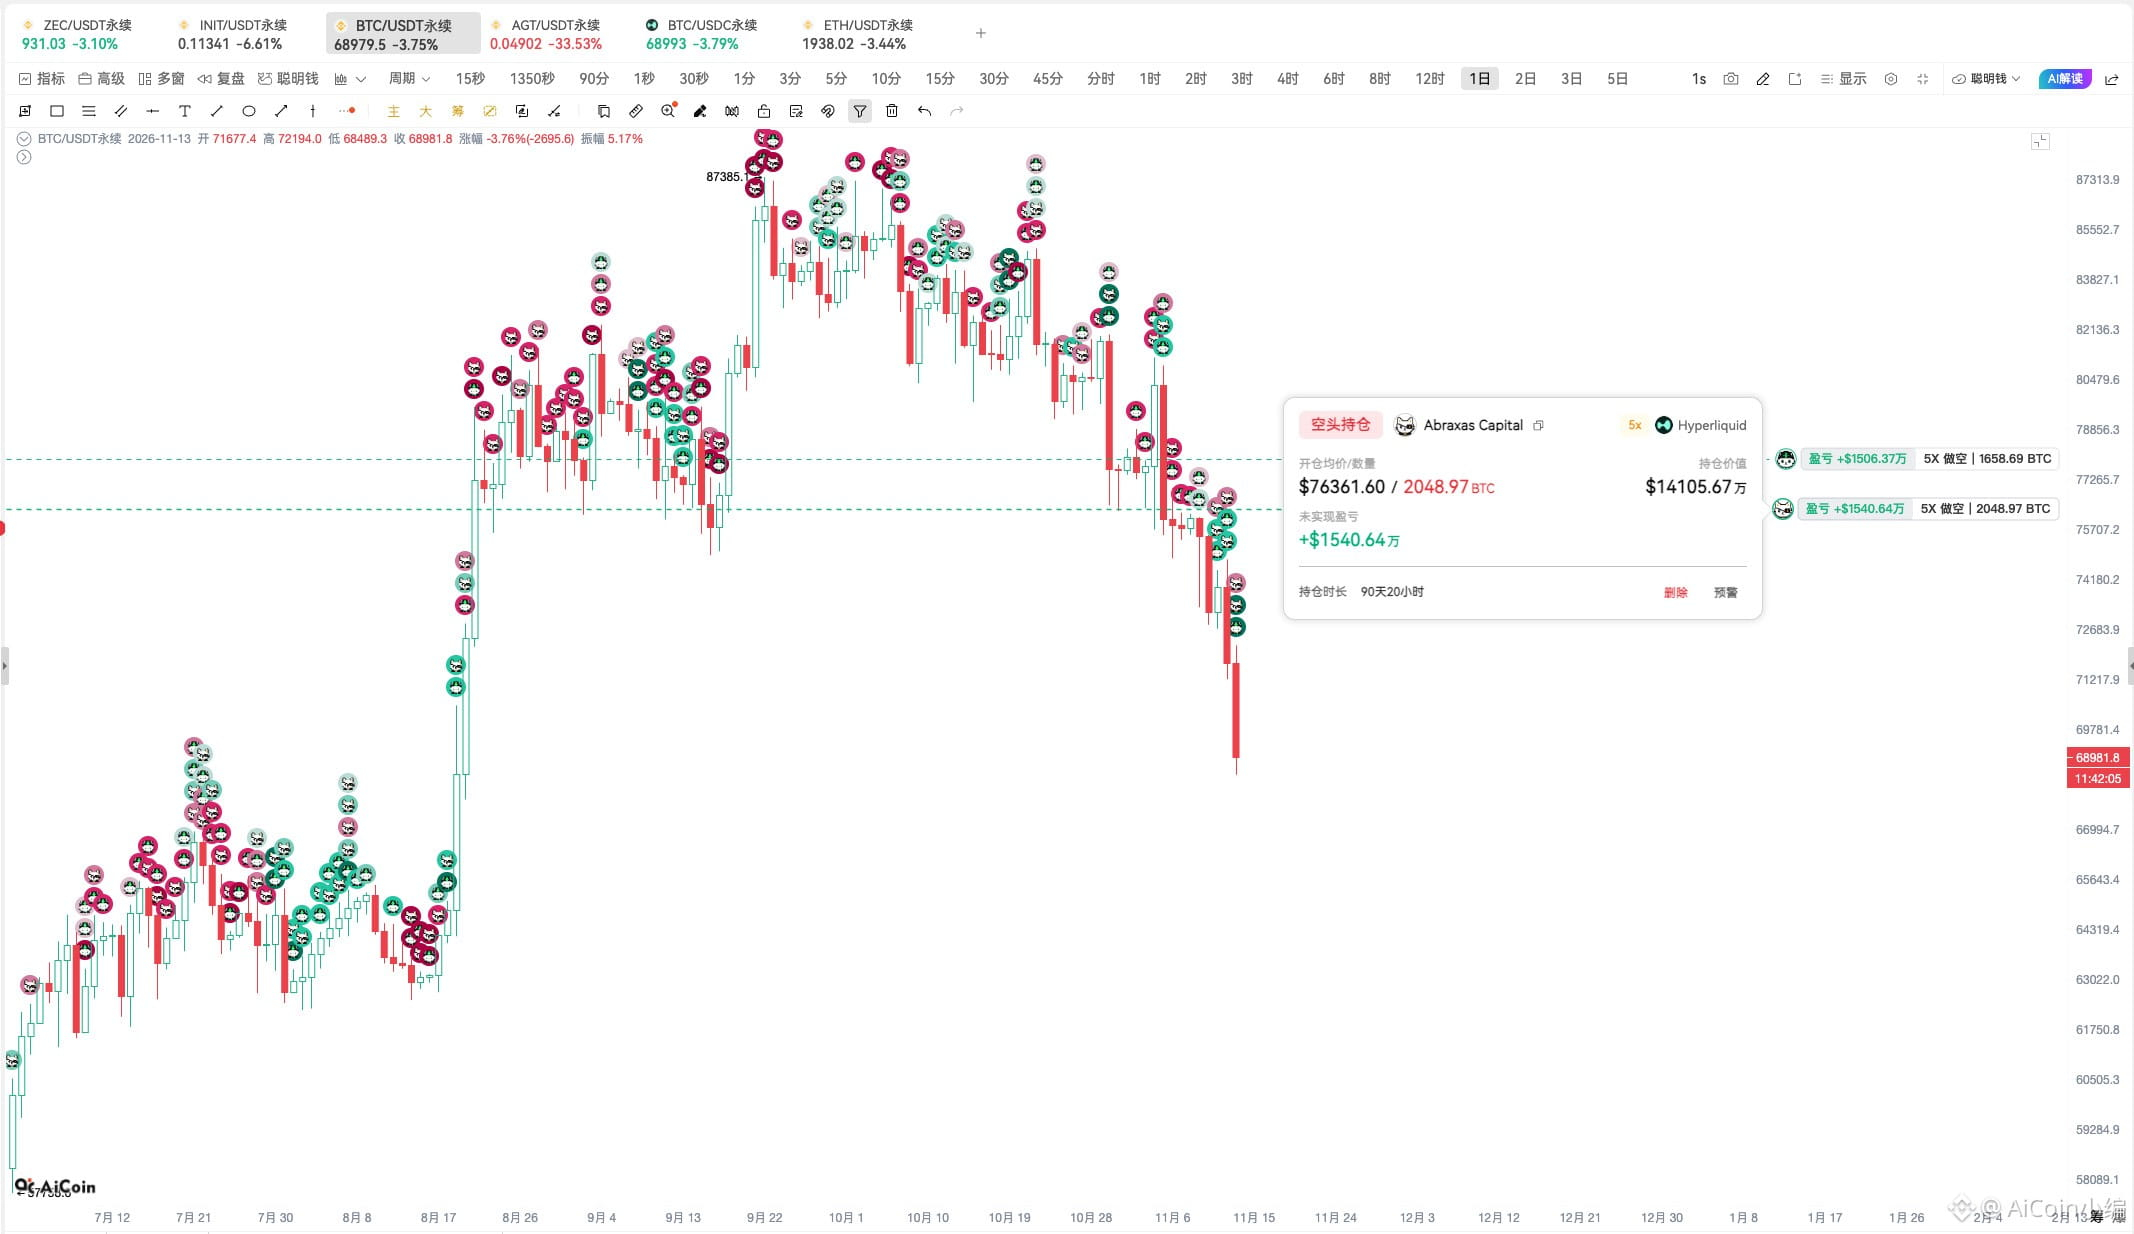
After BTC fell below $70,000, the short positions held by two addresses linked to hedge fund Abraxas Capital continued to grow more profitable. They now hold a combined short position worth about $697 million, with $130 million in unrealized profits.
A few key positions: 👇
- $BTC : short position of about $257 million, $28.93 million in unrealized profits, $7.51 million in funding fees
- HYPE: short position of about $108 million, $5.78 million in unrealized profits, $13.93 million in funding fees
- $ZEC : short position of about $80.1 million, $40.03 million in unrealized profits, $1.62 million in funding fees
- $ETH : a short position of about $64.35 million in a single address, $11.96 million in unrealized profits, $4.87 million in funding fees
Just these four positions have already generated $27.93 million in funding fees.
Most remarkable is HYPE, where funding fee income is already 2.4 times the current unrealized profit.
Abraxas is really having its cake and eating it too—making a killing…💵💵
$130 million in unrealized profits isn’t all—Abraxas has also pocketed $28 million in funding fees
🤩🤩
After BTC fell below $70,000, the short positions held by two addresses linked to hedge fund Abraxas Capital continued to grow more profitable. They now hold a combined short position worth about $697 million, with $130 million in unrealized profits.
A few key positions: 👇
- $BTC : short position of about $257 million, $28.93 million in unrealized profits, $7.51 million in funding fees
- HYPE: short position of about $108 million, $5.78 million in unrealized profits, $13.93 million in funding fees
- $ZEC : short position of about $80.1 million, $40.03 million in unrealized profits, $1.62 million in funding fees
- $ETH : a short position of about $64.35 million in a single address, $11.96 million in unrealized profits, $4.87 million in funding fees
Just these four positions have already generated $27.93 million in funding fees.
Most remarkable is HYPE, where funding fee income is already 2.4 times the current unrealized profit.
Abraxas is really having its cake and eating it too—making a killing…💵💵
🤩🤩
After BTC fell below $70,000, the short positions held by two addresses linked to hedge fund Abraxas Capital continued to grow more profitable. They now hold a combined short position worth about $697 million, with $130 million in unrealized profits.
A few key positions: 👇
- $BTC : short position of about $257 million, $28.93 million in unrealized profits, $7.51 million in funding fees
- HYPE: short position of about $108 million, $5.78 million in unrealized profits, $13.93 million in funding fees
- $ZEC : short position of about $80.1 million, $40.03 million in unrealized profits, $1.62 million in funding fees
- $ETH : a short position of about $64.35 million in a single address, $11.96 million in unrealized profits, $4.87 million in funding fees
Just these four positions have already generated $27.93 million in funding fees.
Most remarkable is HYPE, where funding fee income is already 2.4 times the current unrealized profit.
Abraxas is really having its cake and eating it too—making a killing…💵💵
121
·
--
Sold near a local top in September, and now turned around and borrowed $22 million to scoop up $ETH ? 🤨
The on-chain whale 7 Siblings is back in action.
Over the past 10 hours, it spent $22 million to buy 10,792 ETH at an average price of $2,038.
The whale currently still holds:
💰 174,000 ETH
💸 $136 million in debt
🏦 Primarily collateralized on Aave + Spark
Its strategy has always been consistent: borrow money to add to its position during sharp dips, then sell some on the rebound to repay the debt.
Based on its current position, ETH would need to fall to around $1,180 for its Spark position to start approaching liquidation—about 43% below the current price.
Is this a buying spree too early, or did it nail a local bottom? Keep an eye on what it does next 👇
Address details: 0x28a55C4b4f9615FDE3CDAdDf6cc01FcF2E38A6b0
Sold near a local top in September, and now turned around and borrowed $22 million to scoop up $ETH ? 🤨
The on-chain whale 7 Siblings is back in action.
Over the past 10 hours, it spent $22 million to buy 10,792 ETH at an average price of $2,038.
The whale currently still holds:
💰 174,000 ETH
💸 $136 million in debt
🏦 Primarily collateralized on Aave + Spark
Its strategy has always been consistent: borrow money to add to its position during sharp dips, then sell some on the rebound to repay the debt.
Based on its current position, ETH would need to fall to around $1,180 for its Spark position to start approaching liquidation—about 43% below the current price.
Is this a buying spree too early, or did it nail a local bottom? Keep an eye on what it does next 👇
Address details: 0x28a55C4b4f9615FDE3CDAdDf6cc01FcF2E38A6b0
The on-chain whale 7 Siblings is back in action.
Over the past 10 hours, it spent $22 million to buy 10,792 ETH at an average price of $2,038.
The whale currently still holds:
💰 174,000 ETH
💸 $136 million in debt
🏦 Primarily collateralized on Aave + Spark
Its strategy has always been consistent: borrow money to add to its position during sharp dips, then sell some on the rebound to repay the debt.
Based on its current position, ETH would need to fall to around $1,180 for its Spark position to start approaching liquidation—about 43% below the current price.
Is this a buying spree too early, or did it nail a local bottom? Keep an eye on what it does next 👇
Address details: 0x28a55C4b4f9615FDE3CDAdDf6cc01FcF2E38A6b0
216
·
--
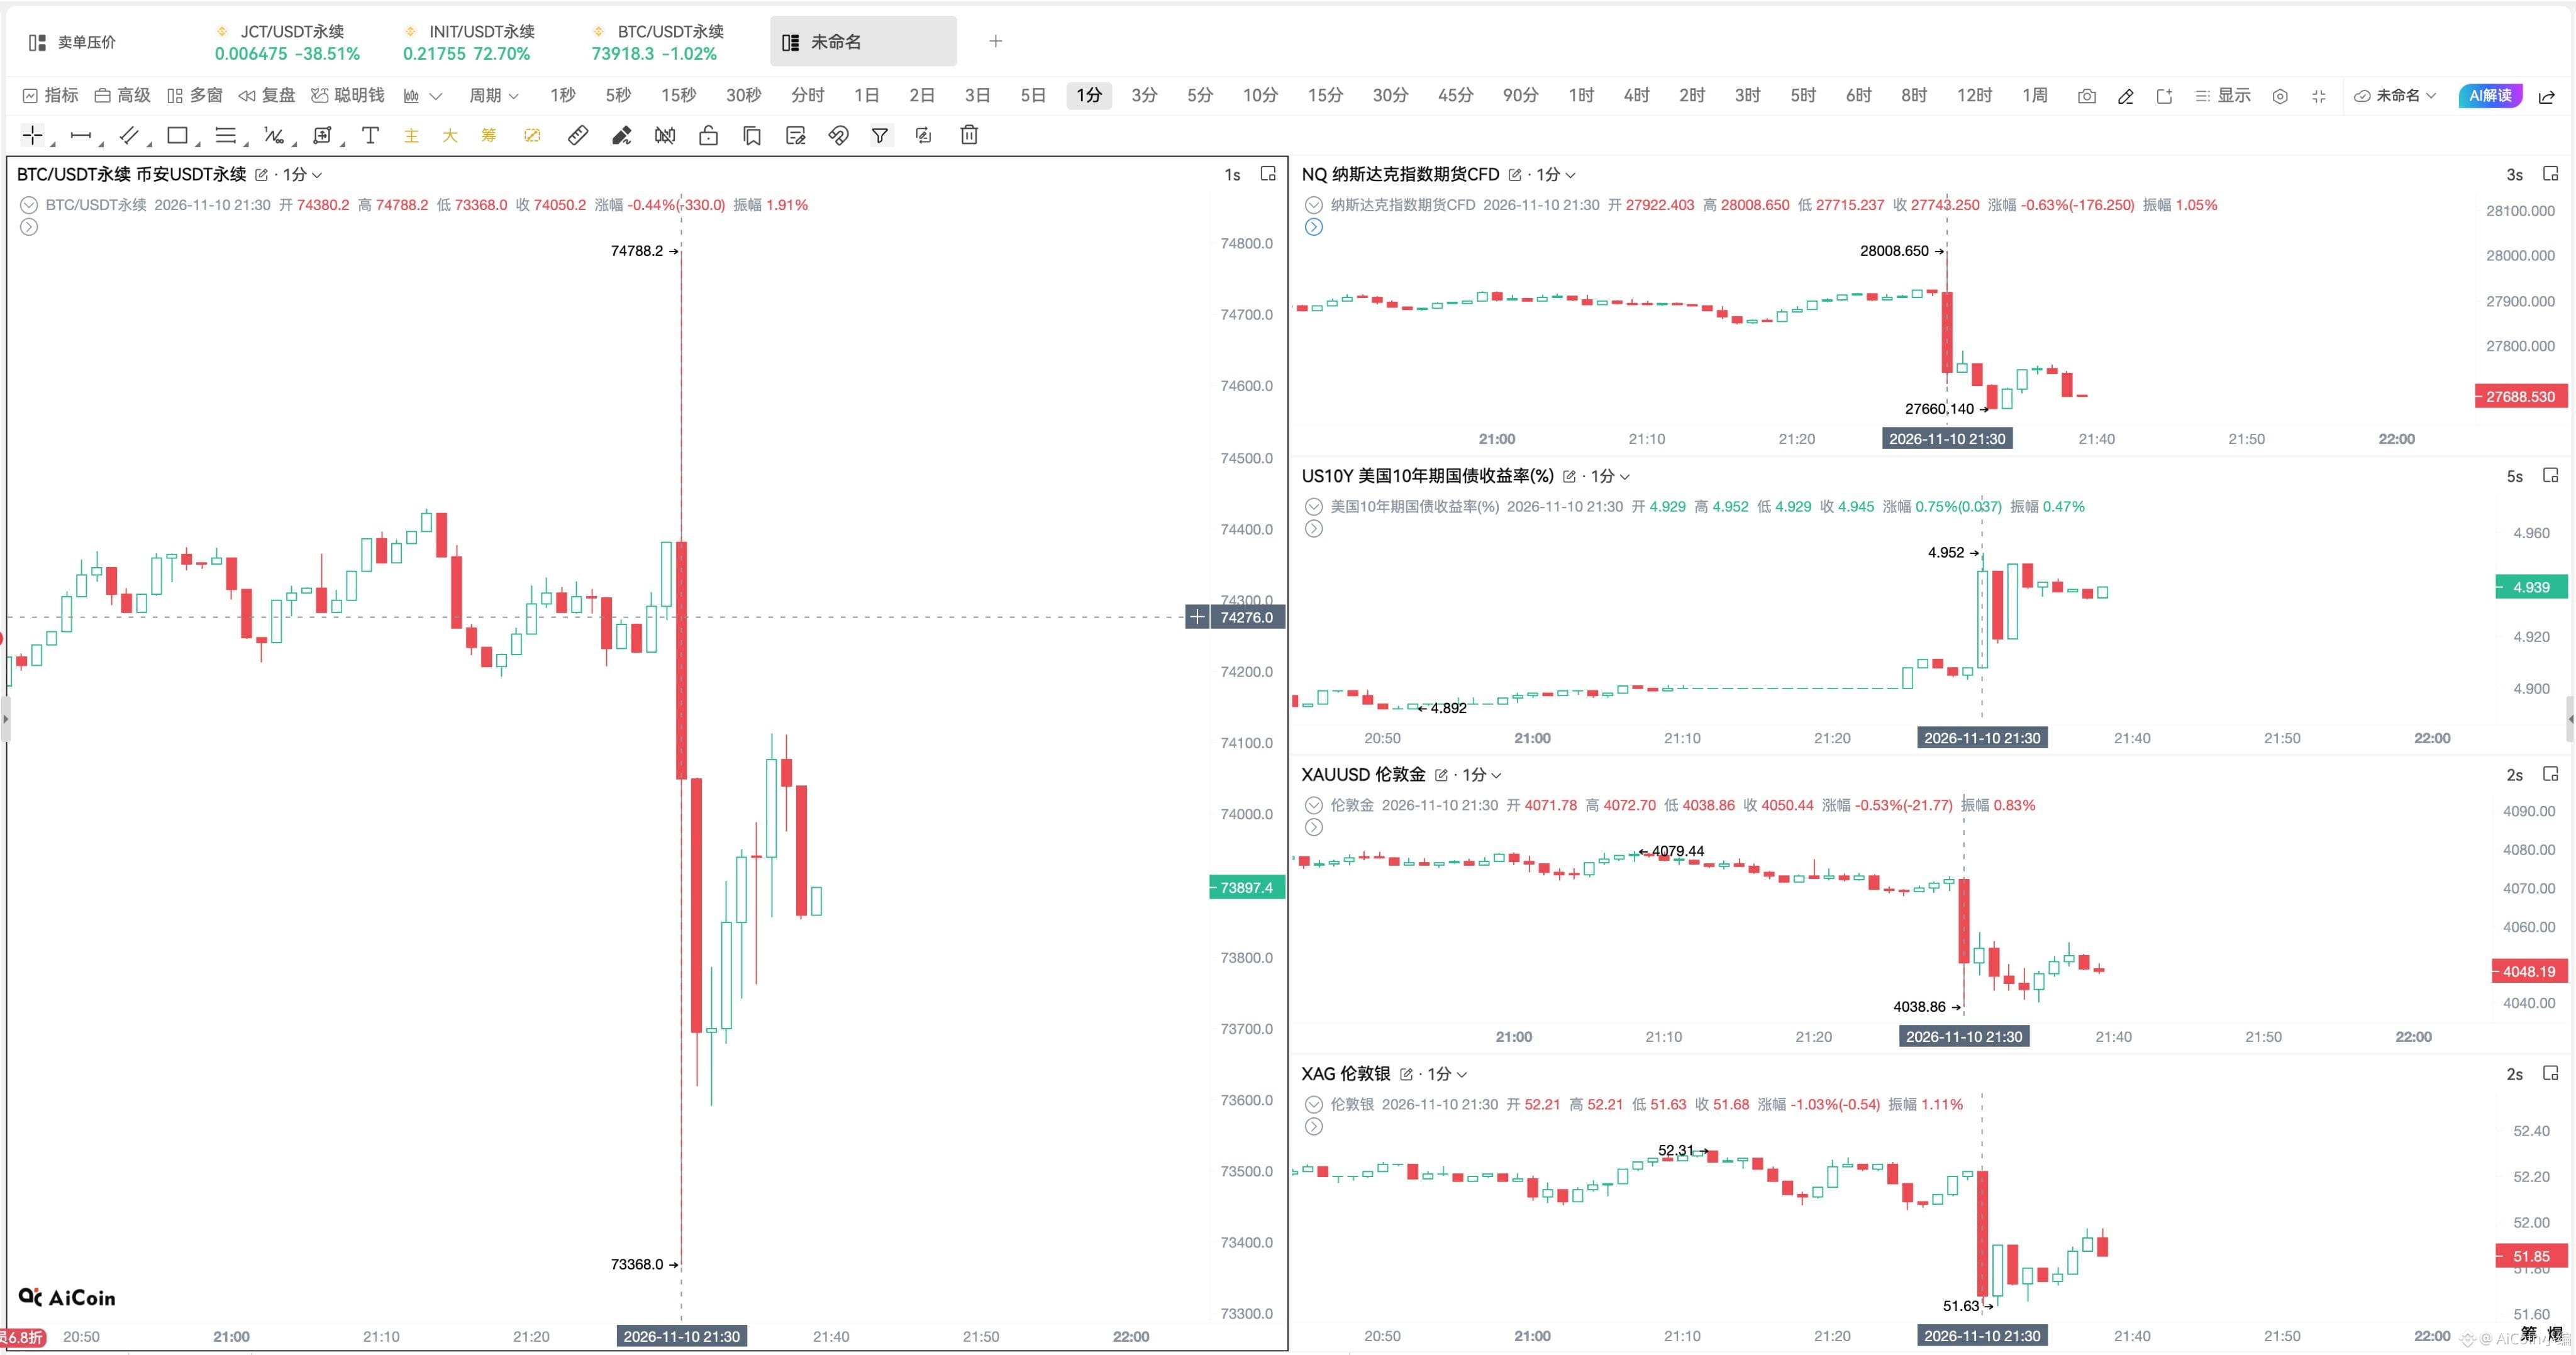
🔥CPI blew past expectations across the board! $BTC plunged straight down, falling below 74,000
U.S. October CPI and core CPI both came in higher than expected:
- CPI month-over-month: +0.4%, vs. +0.3% expected
- Core CPI: +0.3%, vs. +0.2% expected
Markets were sent into a tailspin:
🔻 BTC fell below the 74,000 mark
🔻 U.S. stock futures turned lower across the board
🔻 10-year Treasury yield surged to 4.95%
🔻 Gold and silver plunged, with silver down 1.1%
Rate cuts are completely off the table; markets are pricing in a 100% chance that the Fed will hike rates again in December~
#cpi #美联储何时降息?
🔥CPI blew past expectations across the board! $BTC plunged straight down, falling below 74,000
U.S. October CPI and core CPI both came in higher than expected:
- CPI month-over-month: +0.4%, vs. +0.3% expected
- Core CPI: +0.3%, vs. +0.2% expected
Markets were sent into a tailspin:
🔻 BTC fell below the 74,000 mark
🔻 U.S. stock futures turned lower across the board
🔻 10-year Treasury yield surged to 4.95%
🔻 Gold and silver plunged, with silver down 1.1%
Rate cuts are completely off the table; markets are pricing in a 100% chance that the Fed will hike rates again in December~
#cpi #美联储何时降息?
U.S. October CPI and core CPI both came in higher than expected:
- CPI month-over-month: +0.4%, vs. +0.3% expected
- Core CPI: +0.3%, vs. +0.2% expected
Markets were sent into a tailspin:
🔻 BTC fell below the 74,000 mark
🔻 U.S. stock futures turned lower across the board
🔻 10-year Treasury yield surged to 4.95%
🔻 Gold and silver plunged, with silver down 1.1%
Rate cuts are completely off the table; markets are pricing in a 100% chance that the Fed will hike rates again in December~
#cpi #美联储何时降息?
468
·
--
Bearish
Big sell orders are capping the price. I’ve seen this episode before 🤨
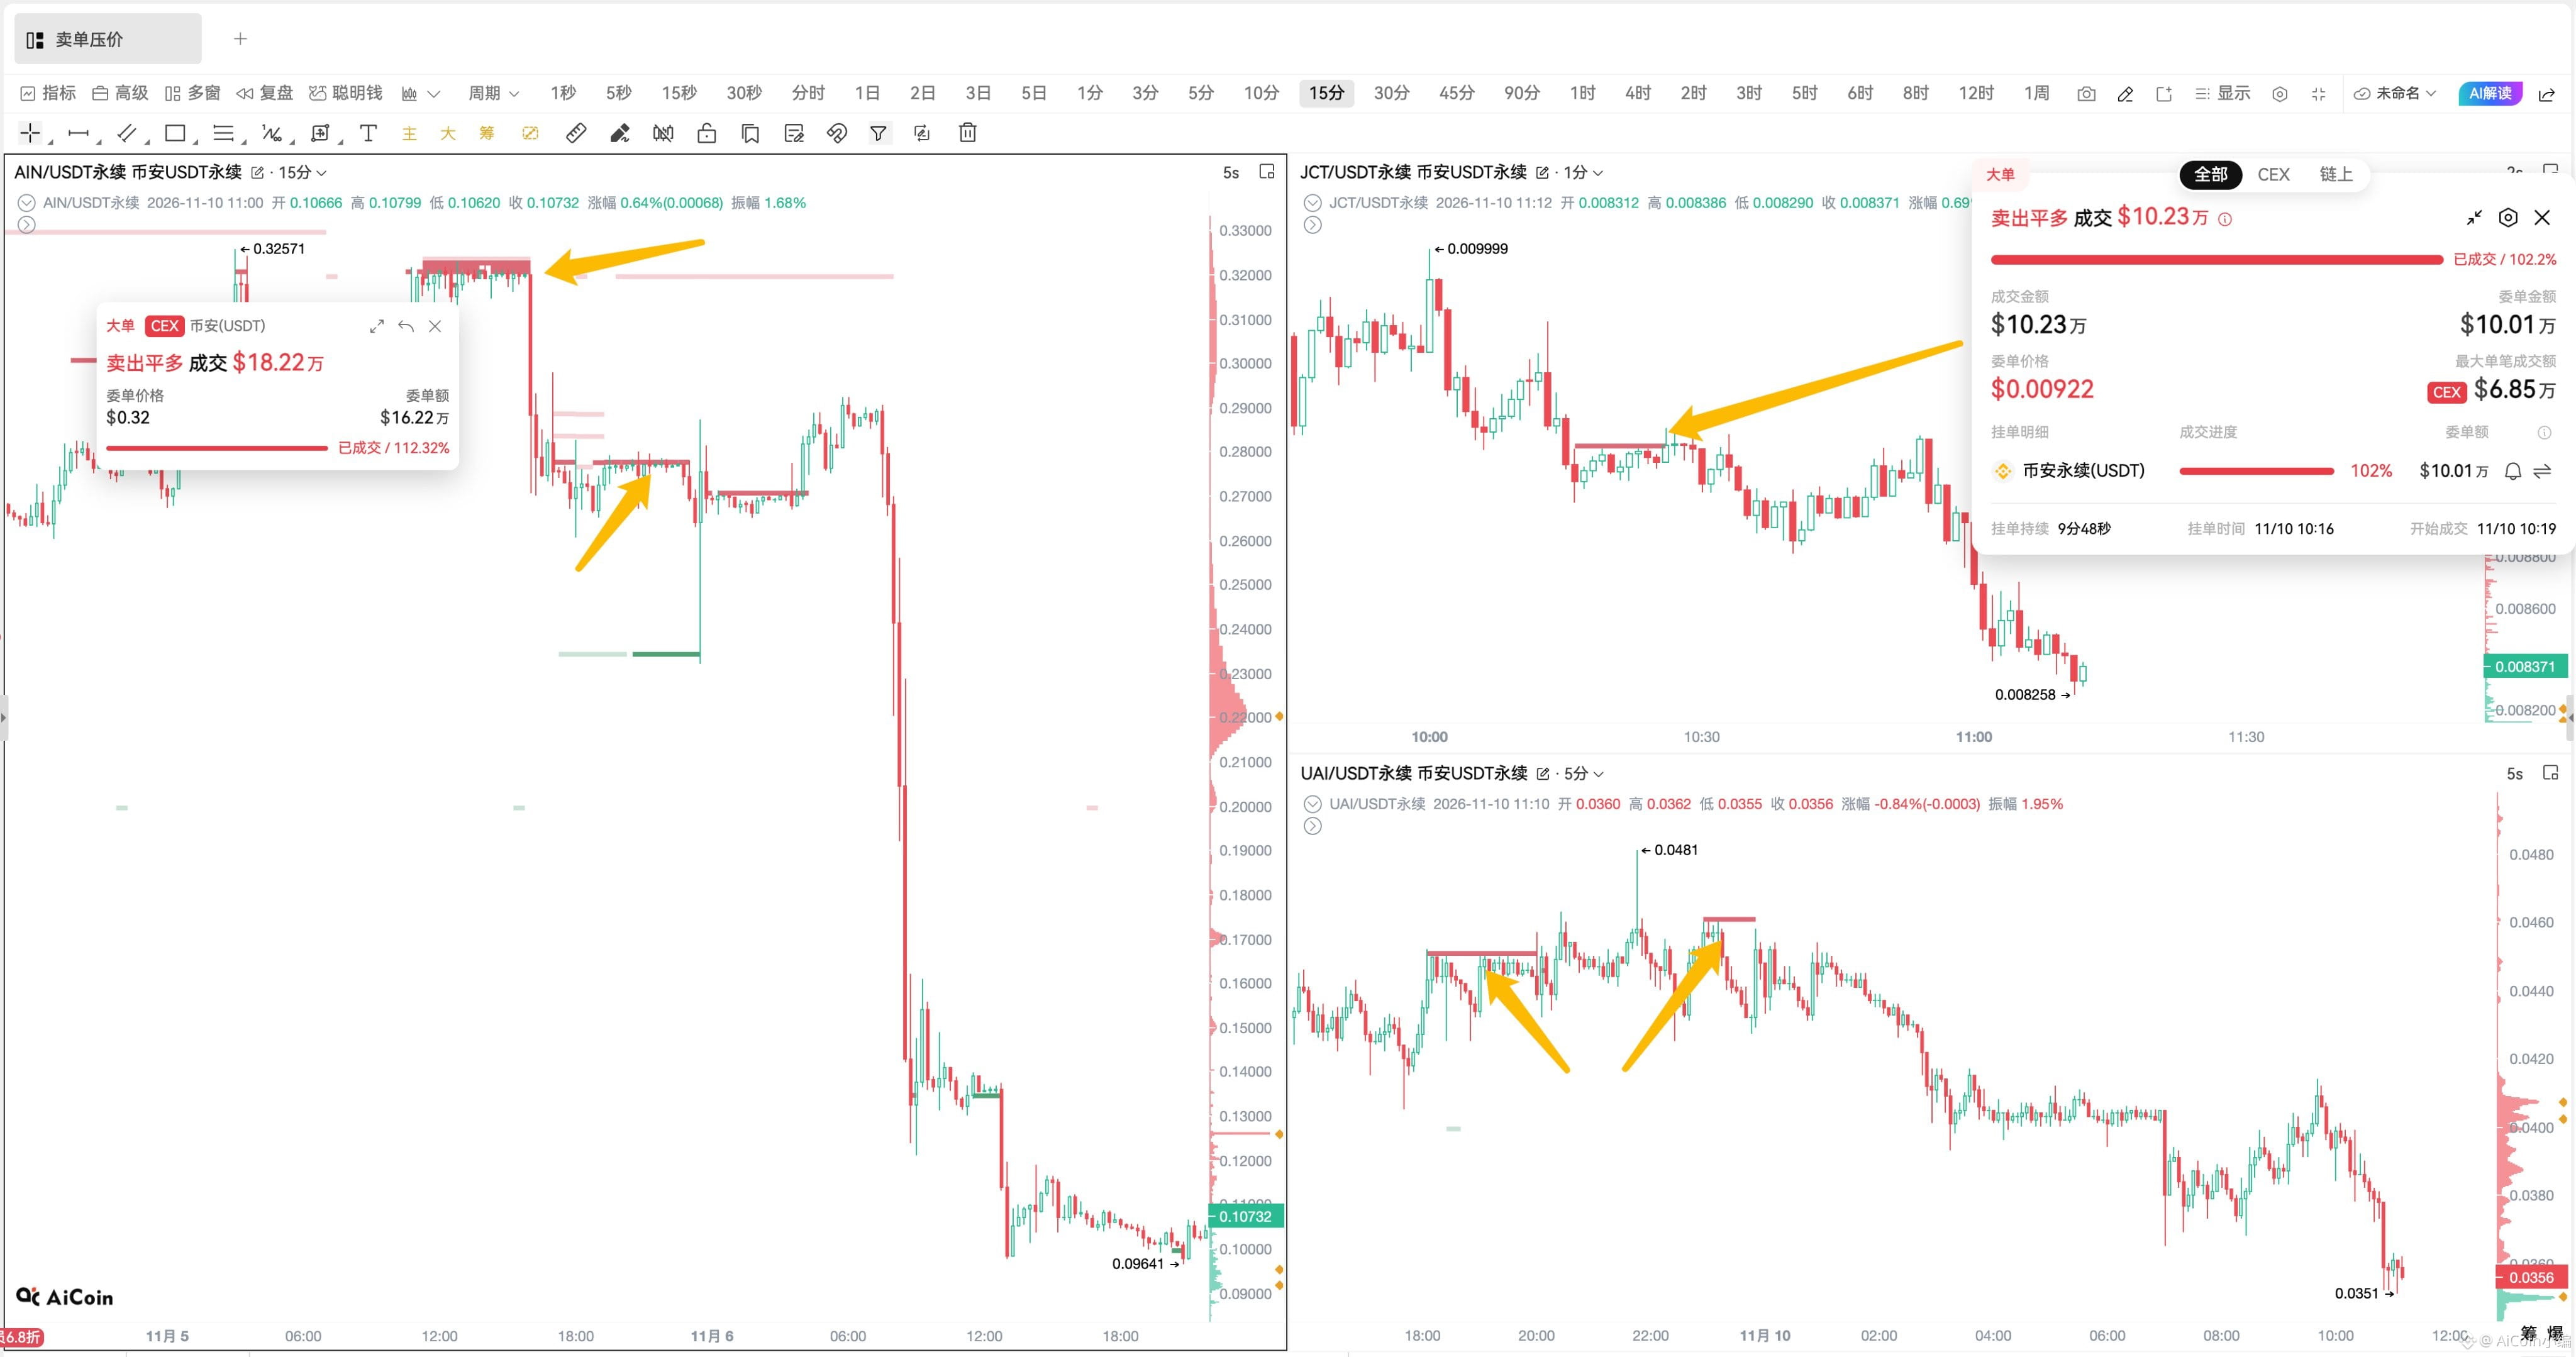
$UAI : Yesterday, around $780,000 worth of sell orders were placed at 0.045–0.046. About $150,000 was then filled, and the price kept getting pushed down from that range.
$JCT : Today, a large $100,000 long-position close appeared at 0.00922, and the price hit clear resistance when it bounced back to that level.
This looks all too familiar. Not long ago, $AIN was a classic case of large sell orders pushing the price down, pinning it firmly around 0.32 and shaking people out until they had no fight left—then the price was dumped, cut in half, and traders were taken for a ride.
When big orders are capping the price like this, is it the whales putting on an act to shake out traders, or are they really preparing to bail and drive the price down? 🤔
Big sell orders are capping the price. I’ve seen this episode before 🤨
$UAI : Yesterday, around $780,000 worth of sell orders were placed at 0.045–0.046. About $150,000 was then filled, and the price kept getting pushed down from that range.
$JCT : Today, a large $100,000 long-position close appeared at 0.00922, and the price hit clear resistance when it bounced back to that level.
This looks all too familiar. Not long ago, $AIN was a classic case of large sell orders pushing the price down, pinning it firmly around 0.32 and shaking people out until they had no fight left—then the price was dumped, cut in half, and traders were taken for a ride.
When big orders are capping the price like this, is it the whales putting on an act to shake out traders, or are they really preparing to bail and drive the price down? 🤔
$UAI : Yesterday, around $780,000 worth of sell orders were placed at 0.045–0.046. About $150,000 was then filled, and the price kept getting pushed down from that range.
$JCT : Today, a large $100,000 long-position close appeared at 0.00922, and the price hit clear resistance when it bounced back to that level.
This looks all too familiar. Not long ago, $AIN was a classic case of large sell orders pushing the price down, pinning it firmly around 0.32 and shaking people out until they had no fight left—then the price was dumped, cut in half, and traders were taken for a ride.
When big orders are capping the price like this, is it the whales putting on an act to shake out traders, or are they really preparing to bail and drive the price down? 🤔
4
·
--
What’s unraveling for Jensen Huang this time goes far beyond his “devoted husband” image 😅
If this were just about an affair in his private life, $NVDA wouldn’t be this sensitive.
What’s really spooking the market is the combination of several things:
- A national security investigation
- Chip export controls
- Congressional inquiries
What makes things worse is that Nvidia has just been through a round of AI valuation declines, and now there’s another risk that almost no one had priced in before—Jensen Huang himself.
When the CEO himself becomes a risk factor, the story changes…
#黄仁勋 #英伟达
What’s unraveling for Jensen Huang this time goes far beyond his “devoted husband” image 😅
If this were just about an affair in his private life, $NVDA wouldn’t be this sensitive.
What’s really spooking the market is the combination of several things:
- A national security investigation
- Chip export controls
- Congressional inquiries
What makes things worse is that Nvidia has just been through a round of AI valuation declines, and now there’s another risk that almost no one had priced in before—Jensen Huang himself.
When the CEO himself becomes a risk factor, the story changes…
#黄仁勋 #英伟达
If this were just about an affair in his private life, $NVDA wouldn’t be this sensitive.
What’s really spooking the market is the combination of several things:
- A national security investigation
- Chip export controls
- Congressional inquiries
What makes things worse is that Nvidia has just been through a round of AI valuation declines, and now there’s another risk that almost no one had priced in before—Jensen Huang himself.
When the CEO himself becomes a risk factor, the story changes…
#黄仁勋 #英伟达
96
·
--
Bearish
$JCT This move wiped out both longs and shorts 🤯
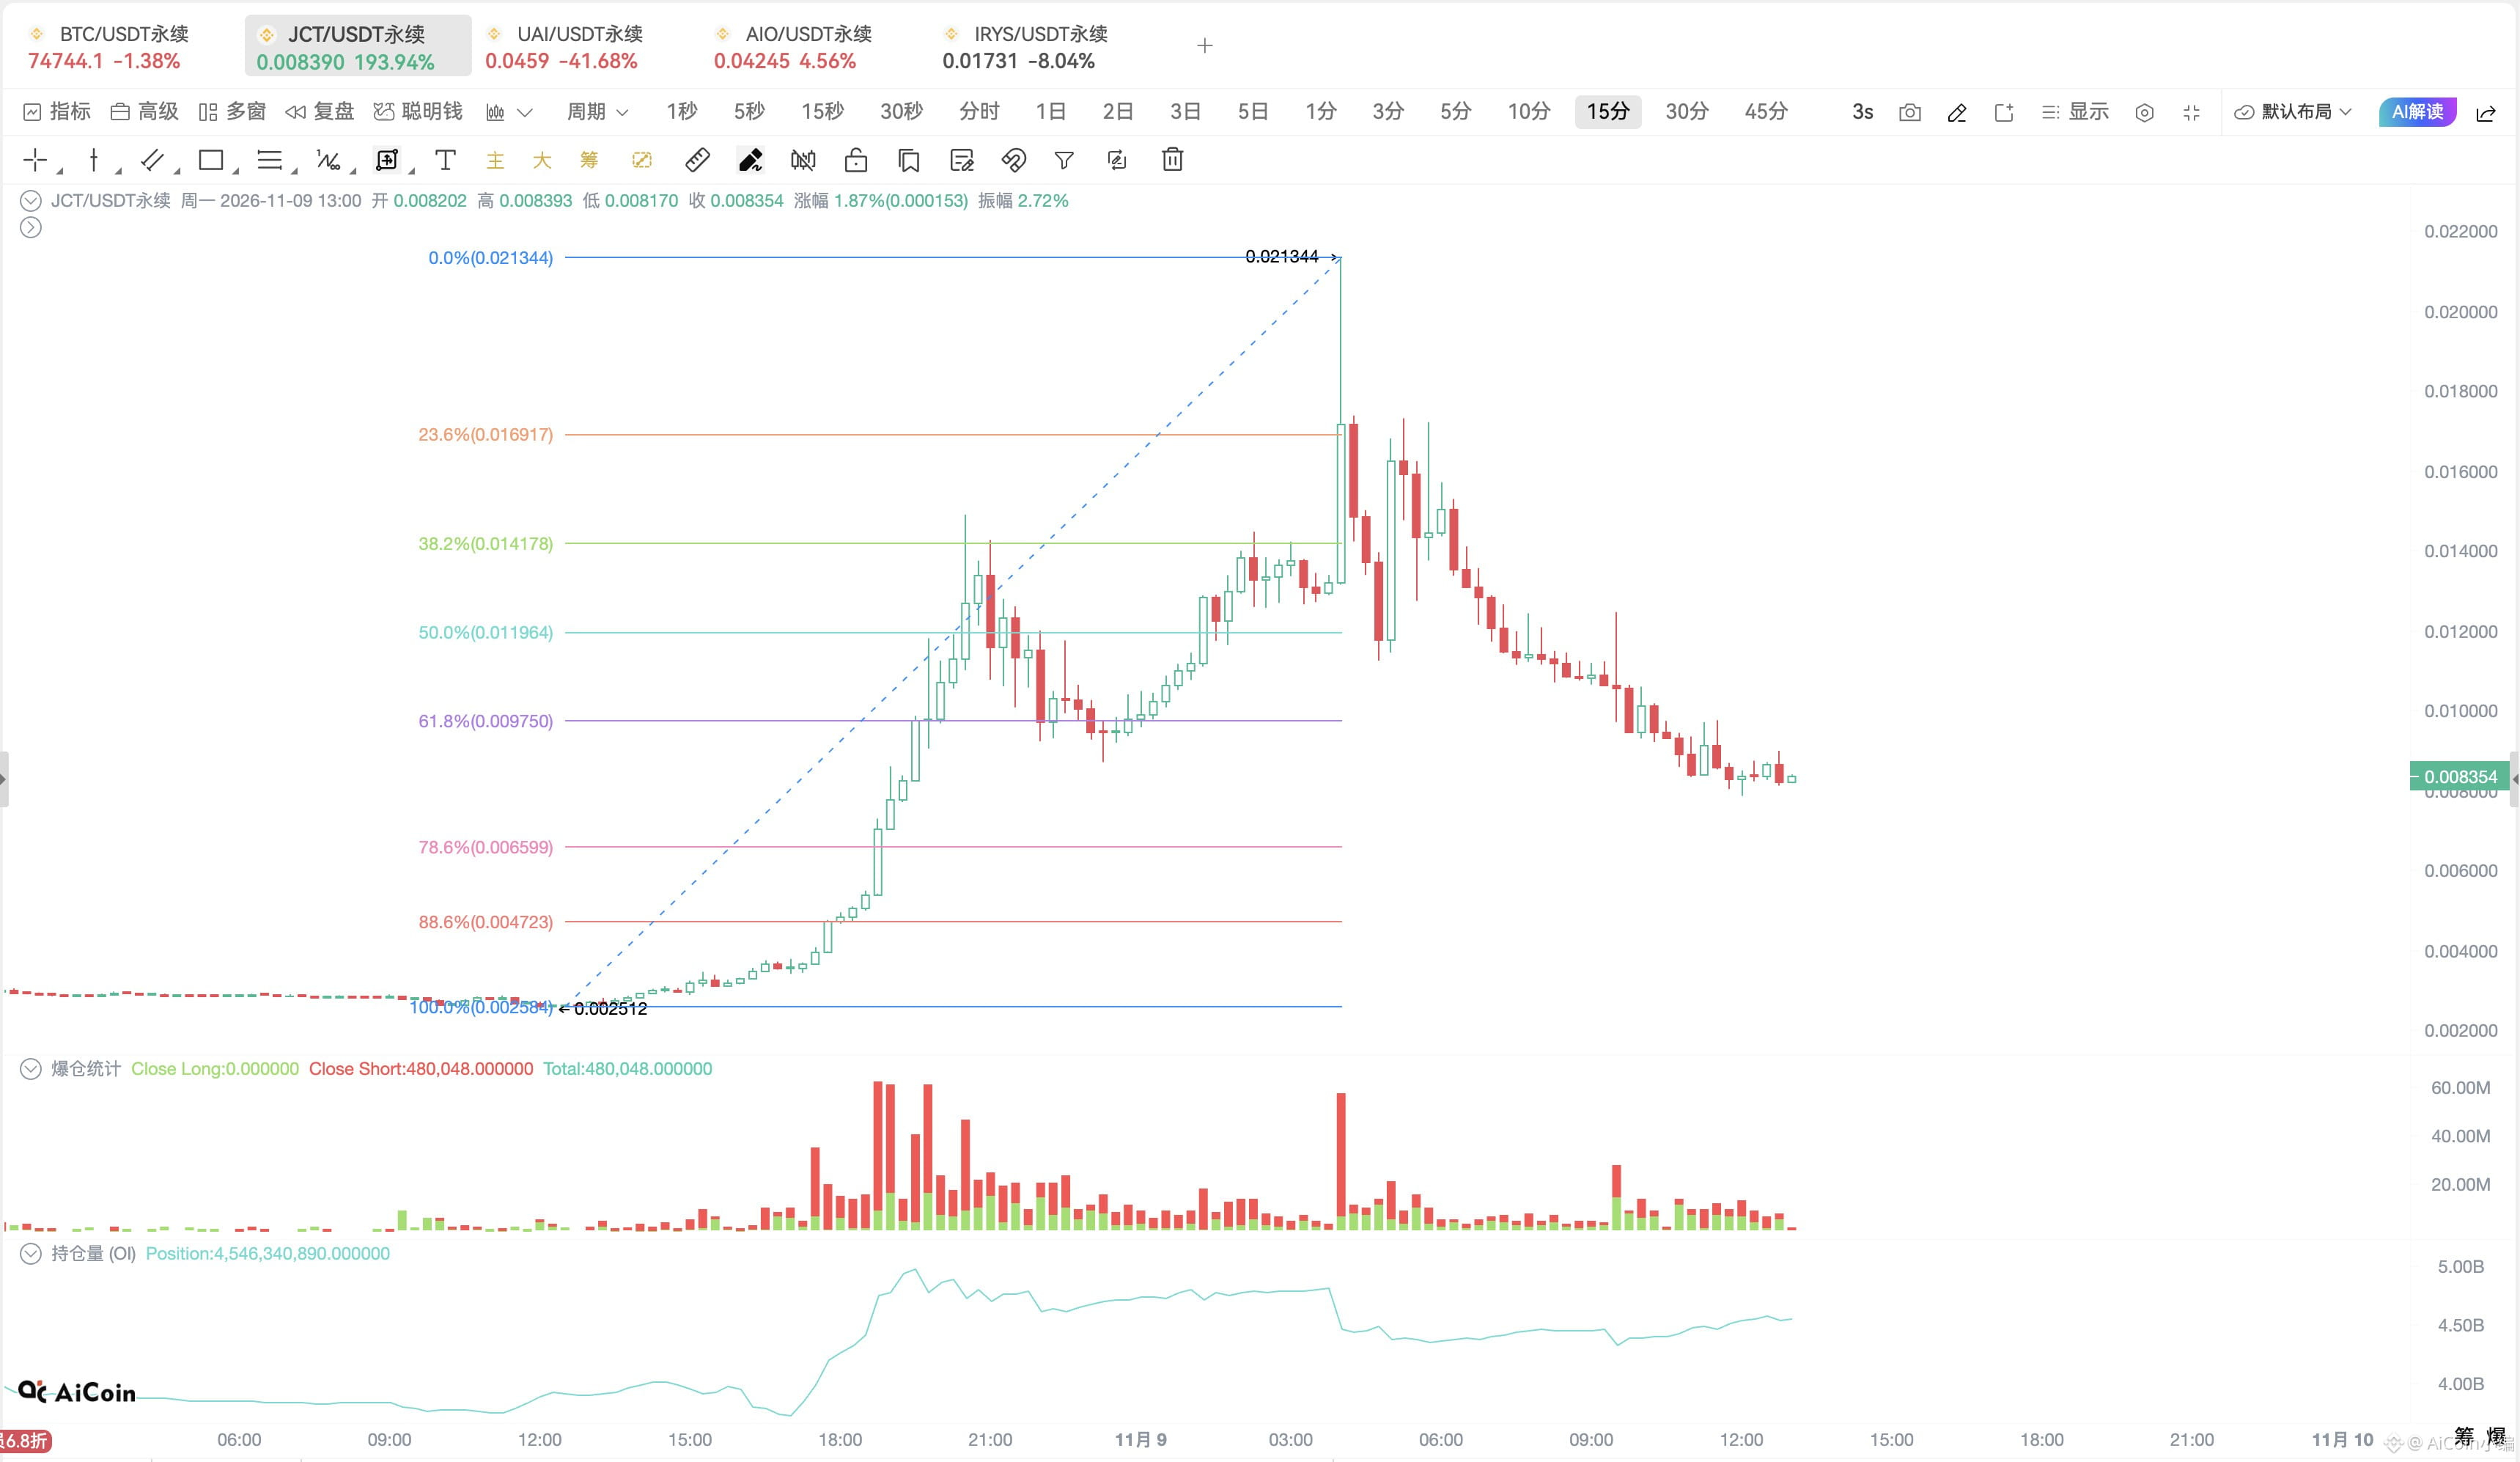
From a high of $0.0213, the price plunged all the way to around $0.008. It had surged 700%+ earlier, then promptly got cut in half.
Liquidations over the past 24 hours totaled nearly $22.5 million; $11.48 million were liquidated in just the past 12 hours, including $8.09 million in shorts and $3.39 million in longs.
Technically, the price has already fallen below the 50% ($0.01196) and 61.8% ($0.00975) retracement levels.
In the short term, the first thing to watch is whether it can reclaim $0.00975. If it can’t, keep an eye on the area around $0.00659 (78.6%) below.
P.S. The last one to have this kind of extreme roller-coaster ride was $IRYS , which is now down 96%+ from its high 😅
$JCT This move wiped out both longs and shorts 🤯
From a high of $0.0213, the price plunged all the way to around $0.008. It had surged 700%+ earlier, then promptly got cut in half.
Liquidations over the past 24 hours totaled nearly $22.5 million; $11.48 million were liquidated in just the past 12 hours, including $8.09 million in shorts and $3.39 million in longs.
Technically, the price has already fallen below the 50% ($0.01196) and 61.8% ($0.00975) retracement levels.
In the short term, the first thing to watch is whether it can reclaim $0.00975. If it can’t, keep an eye on the area around $0.00659 (78.6%) below.
P.S. The last one to have this kind of extreme roller-coaster ride was $IRYS , which is now down 96%+ from its high 😅
From a high of $0.0213, the price plunged all the way to around $0.008. It had surged 700%+ earlier, then promptly got cut in half.
Liquidations over the past 24 hours totaled nearly $22.5 million; $11.48 million were liquidated in just the past 12 hours, including $8.09 million in shorts and $3.39 million in longs.
Technically, the price has already fallen below the 50% ($0.01196) and 61.8% ($0.00975) retracement levels.
In the short term, the first thing to watch is whether it can reclaim $0.00975. If it can’t, keep an eye on the area around $0.00659 (78.6%) below.
P.S. The last one to have this kind of extreme roller-coaster ride was $IRYS , which is now down 96%+ from its high 😅
1
835
·
--
The first half of July hasn’t even passed, and $BTC 、$ETH have already turned in a solid performance!
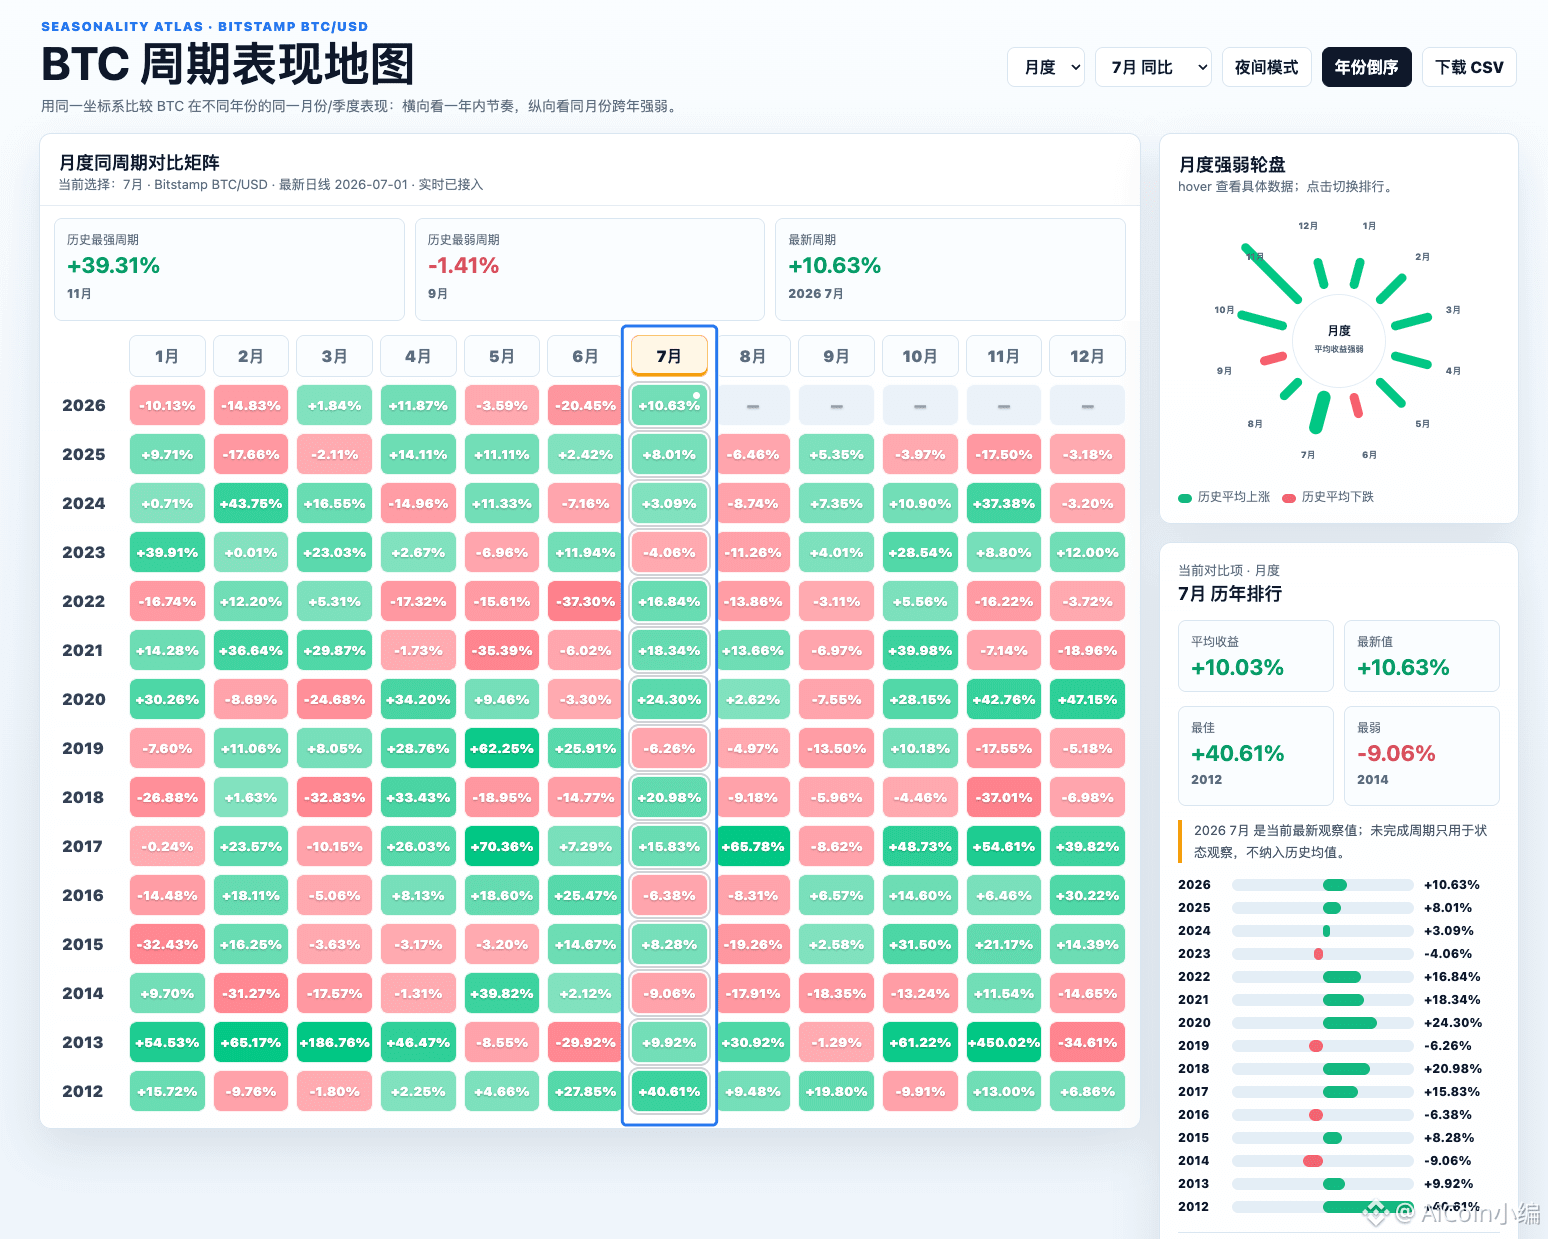
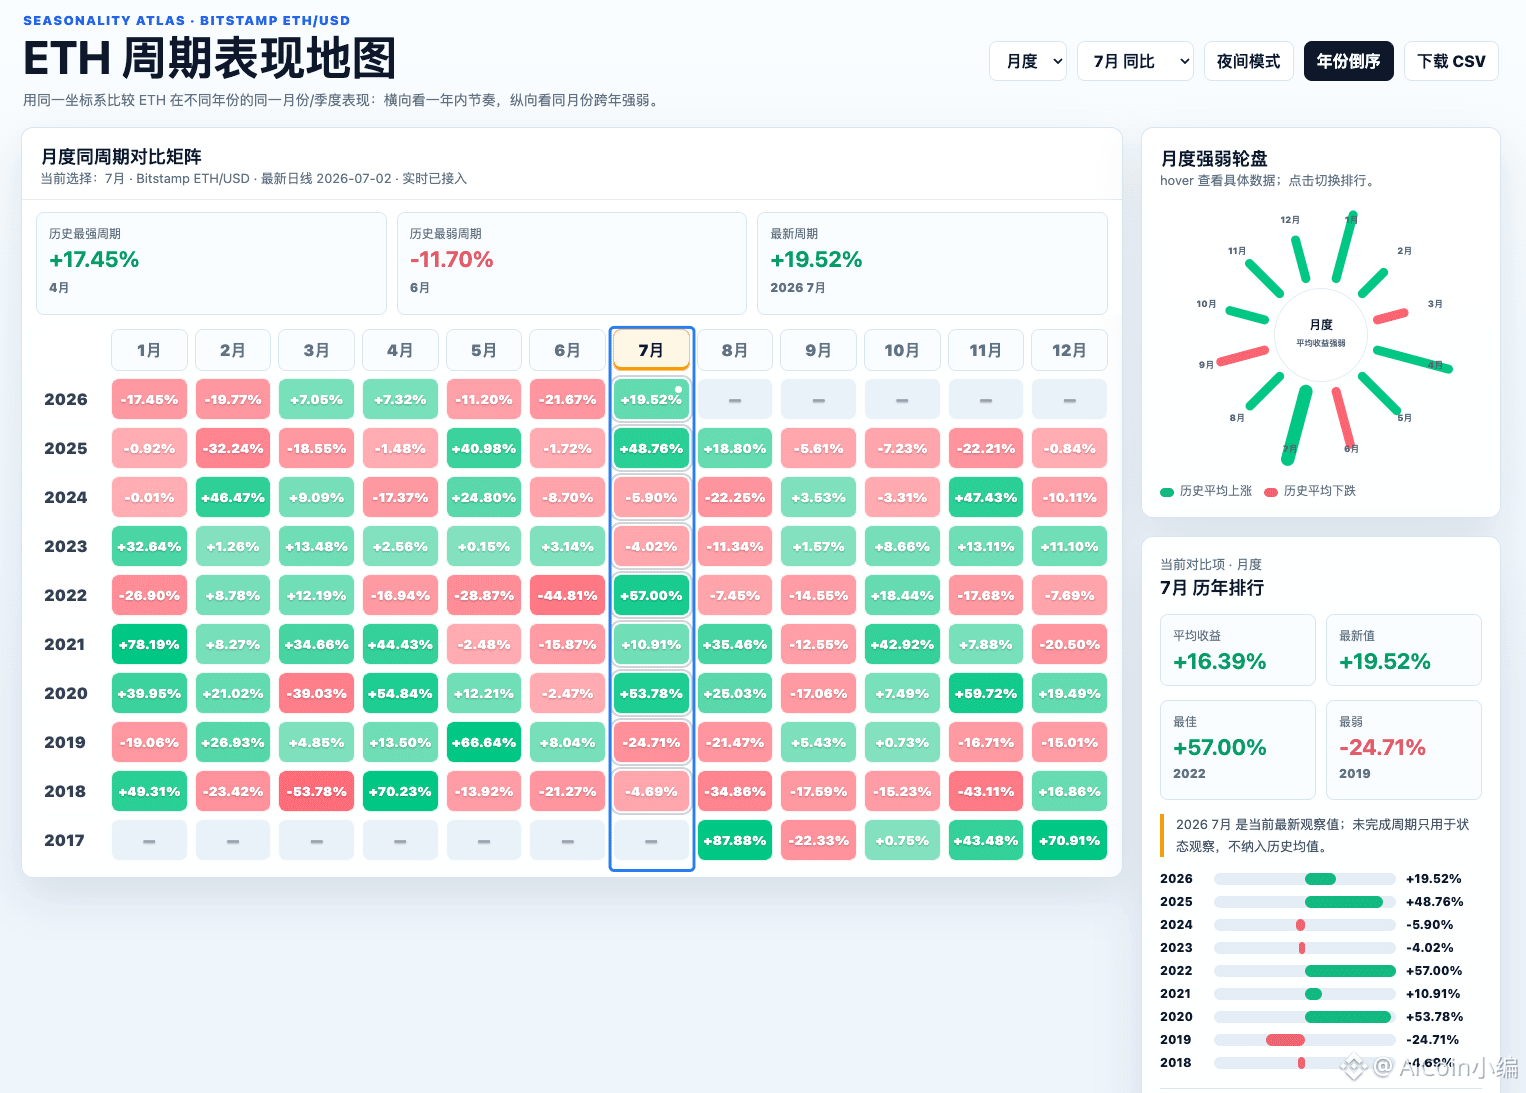
🗺️From the cycle performance map:
BTC is up +10.54% so far in July, compared with the historical average July return of +10.03%;
ETH is stronger, up +19.42% so far in July, compared with the historical average July return of +16.39%.
📍Behind this are several main threads converging:
- ETF inflows returning, with institutional buying stepping in to provide support again;
- Institutional “whales” went on a rampage buying at June’s low levels—27万+ BTC;
- Stablecoins, on-chain finance, and tokenization narratives are heating up, with ETH showing stronger elasticity;
- Easing inflation + more dovish Fed expectations, helping risk appetite rebound;
- Historically, July itself is one of the months when BTC and ETH have tended to perform well.
History won’t simply repeat, but the cycle and liquidity are aligning ~
The first half of July hasn’t even passed, and $BTC 、$ETH have already turned in a solid performance!
🗺️From the cycle performance map:
BTC is up +10.54% so far in July, compared with the historical average July return of +10.03%;
ETH is stronger, up +19.42% so far in July, compared with the historical average July return of +16.39%.
📍Behind this are several main threads converging:
- ETF inflows returning, with institutional buying stepping in to provide support again;
- Institutional “whales” went on a rampage buying at June’s low levels—27万+ BTC;
- Stablecoins, on-chain finance, and tokenization narratives are heating up, with ETH showing stronger elasticity;
- Easing inflation + more dovish Fed expectations, helping risk appetite rebound;
- Historically, July itself is one of the months when BTC and ETH have tended to perform well.
History won’t simply repeat, but the cycle and liquidity are aligning ~
🗺️From the cycle performance map:
BTC is up +10.54% so far in July, compared with the historical average July return of +10.03%;
ETH is stronger, up +19.42% so far in July, compared with the historical average July return of +16.39%.
📍Behind this are several main threads converging:
- ETF inflows returning, with institutional buying stepping in to provide support again;
- Institutional “whales” went on a rampage buying at June’s low levels—27万+ BTC;
- Stablecoins, on-chain finance, and tokenization narratives are heating up, with ETH showing stronger elasticity;
- Easing inflation + more dovish Fed expectations, helping risk appetite rebound;
- Historically, July itself is one of the months when BTC and ETH have tended to perform well.
History won’t simply repeat, but the cycle and liquidity are aligning ~
114
·
--
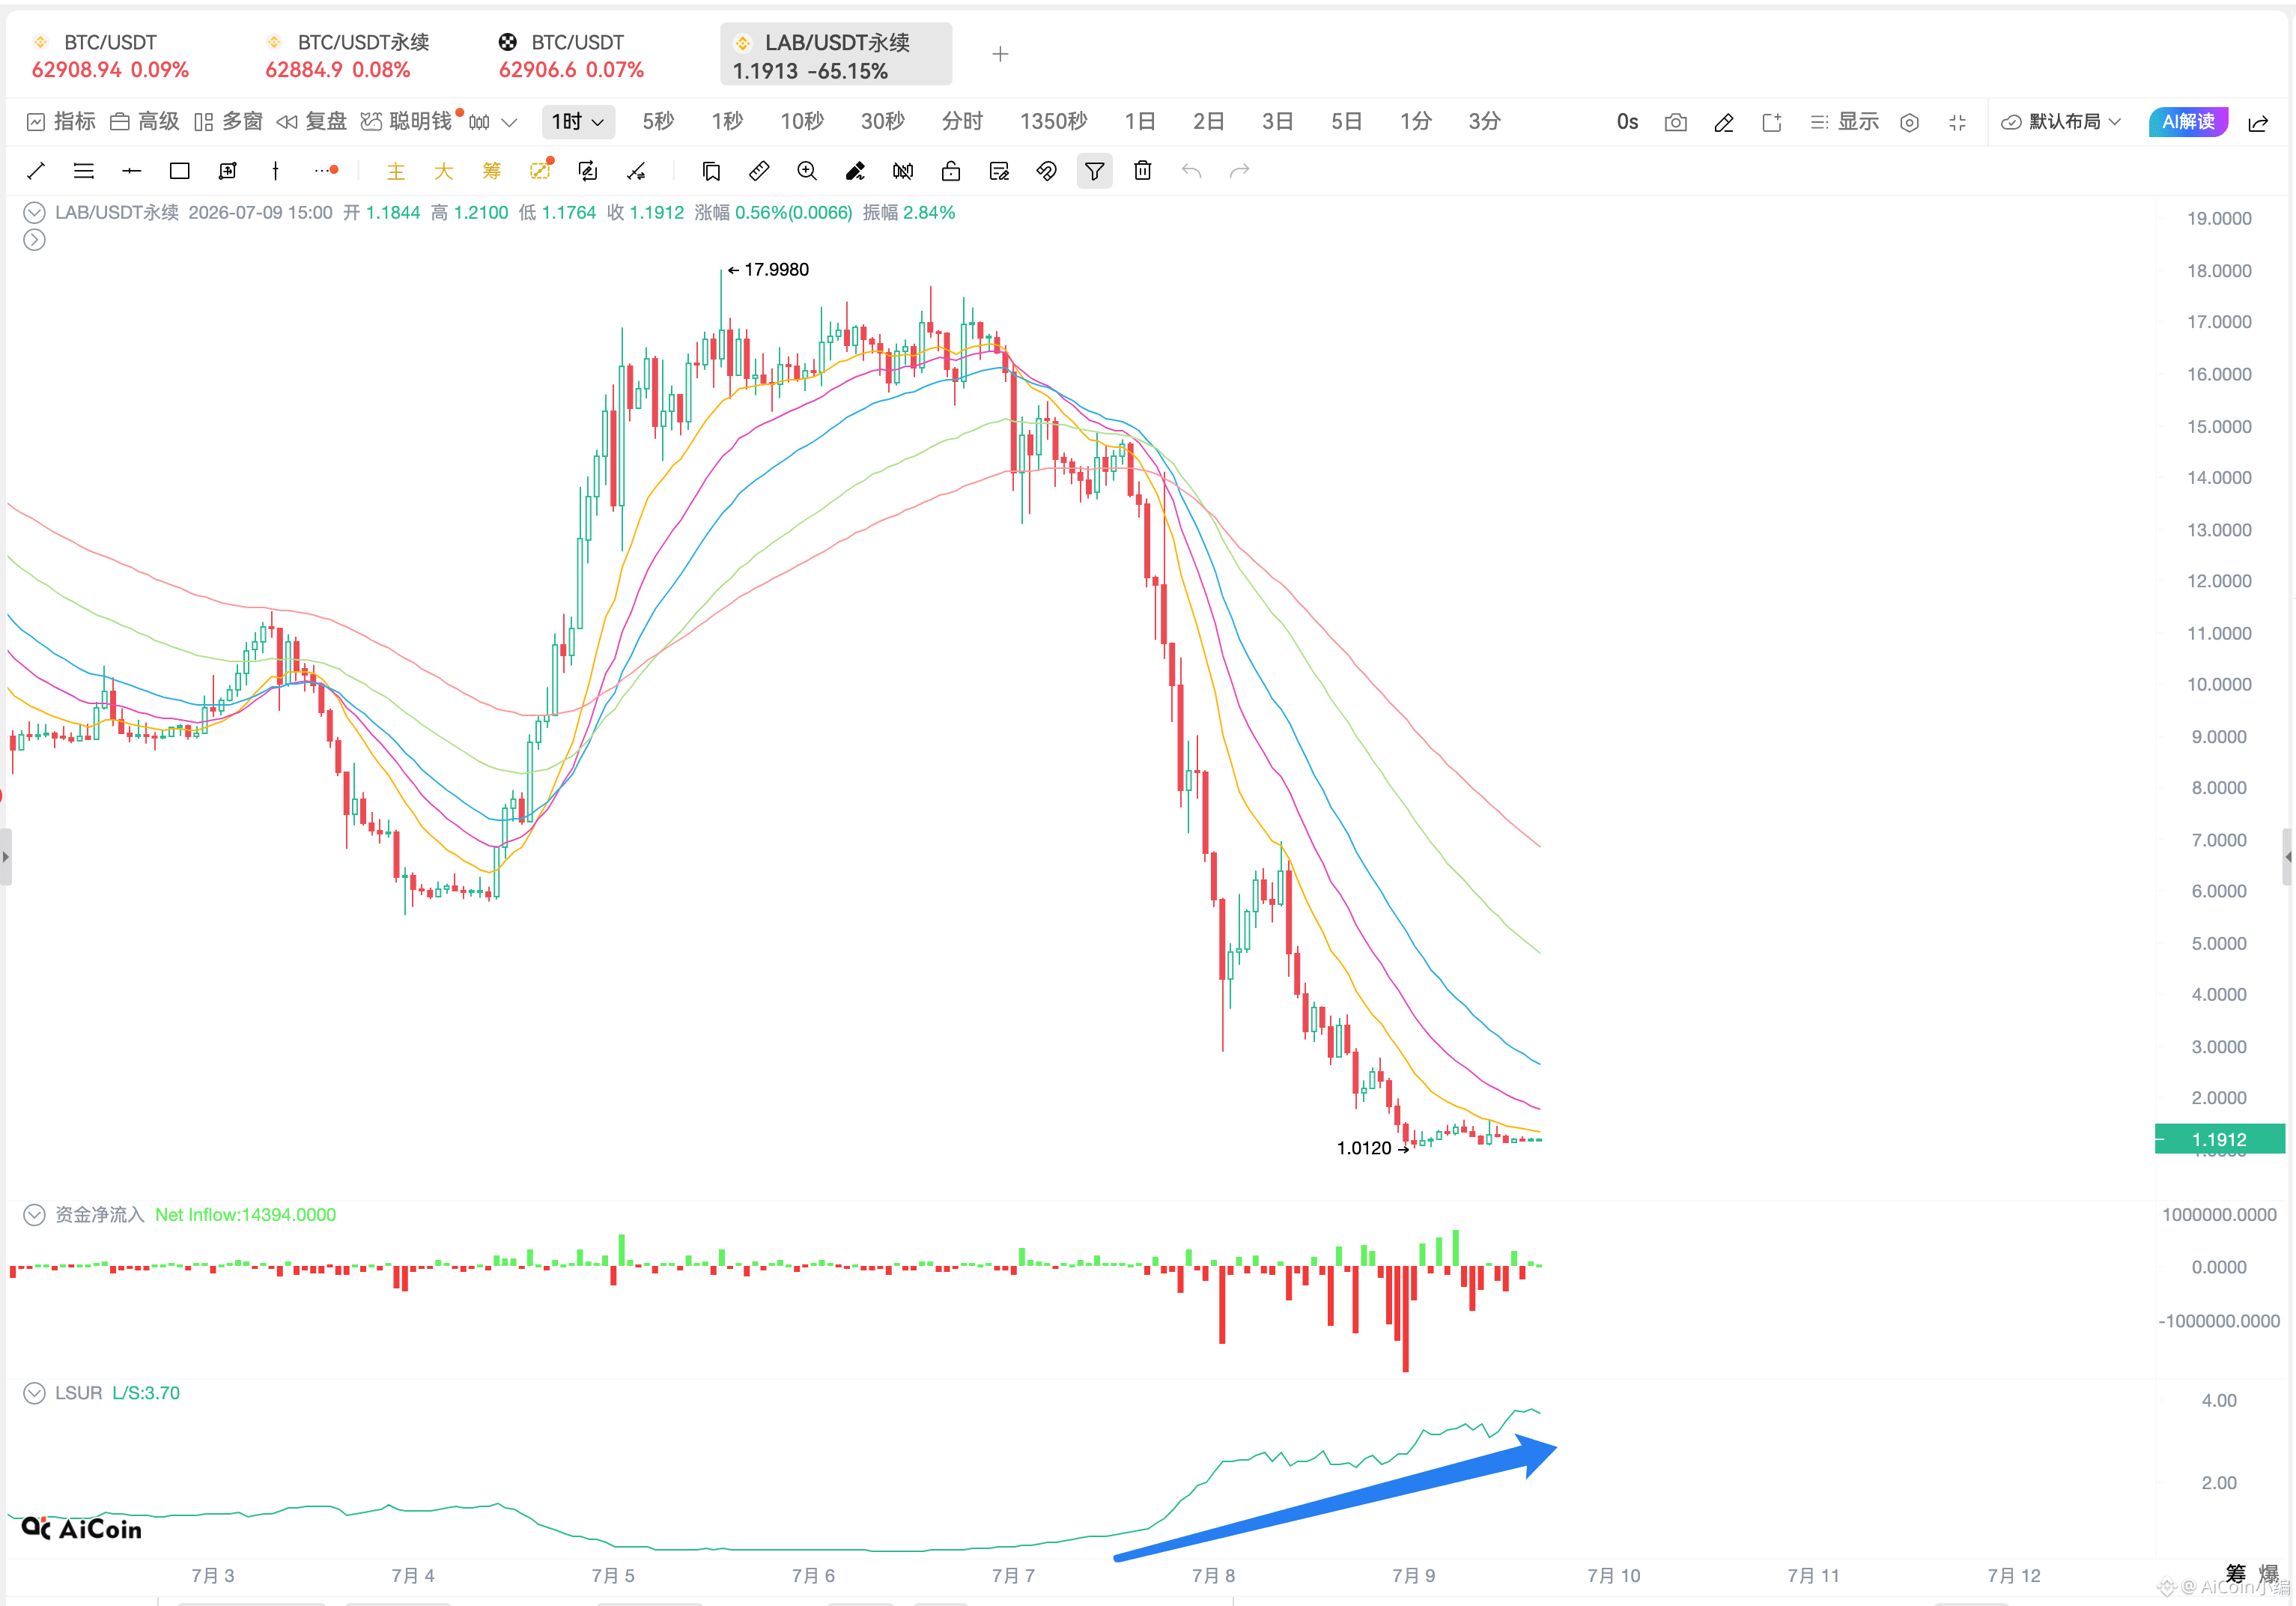
Buy the more it falls? $LAB long/short position ratio (LSUR) has jumped to 3.6+—are so many people going long?
Buy the more it falls? $LAB long/short position ratio (LSUR) has jumped to 3.6+—are so many people going long?
353
·
--
From the footprint chart, $BTC ’s passive sell orders are still in control of the short-term pricing power…🫠
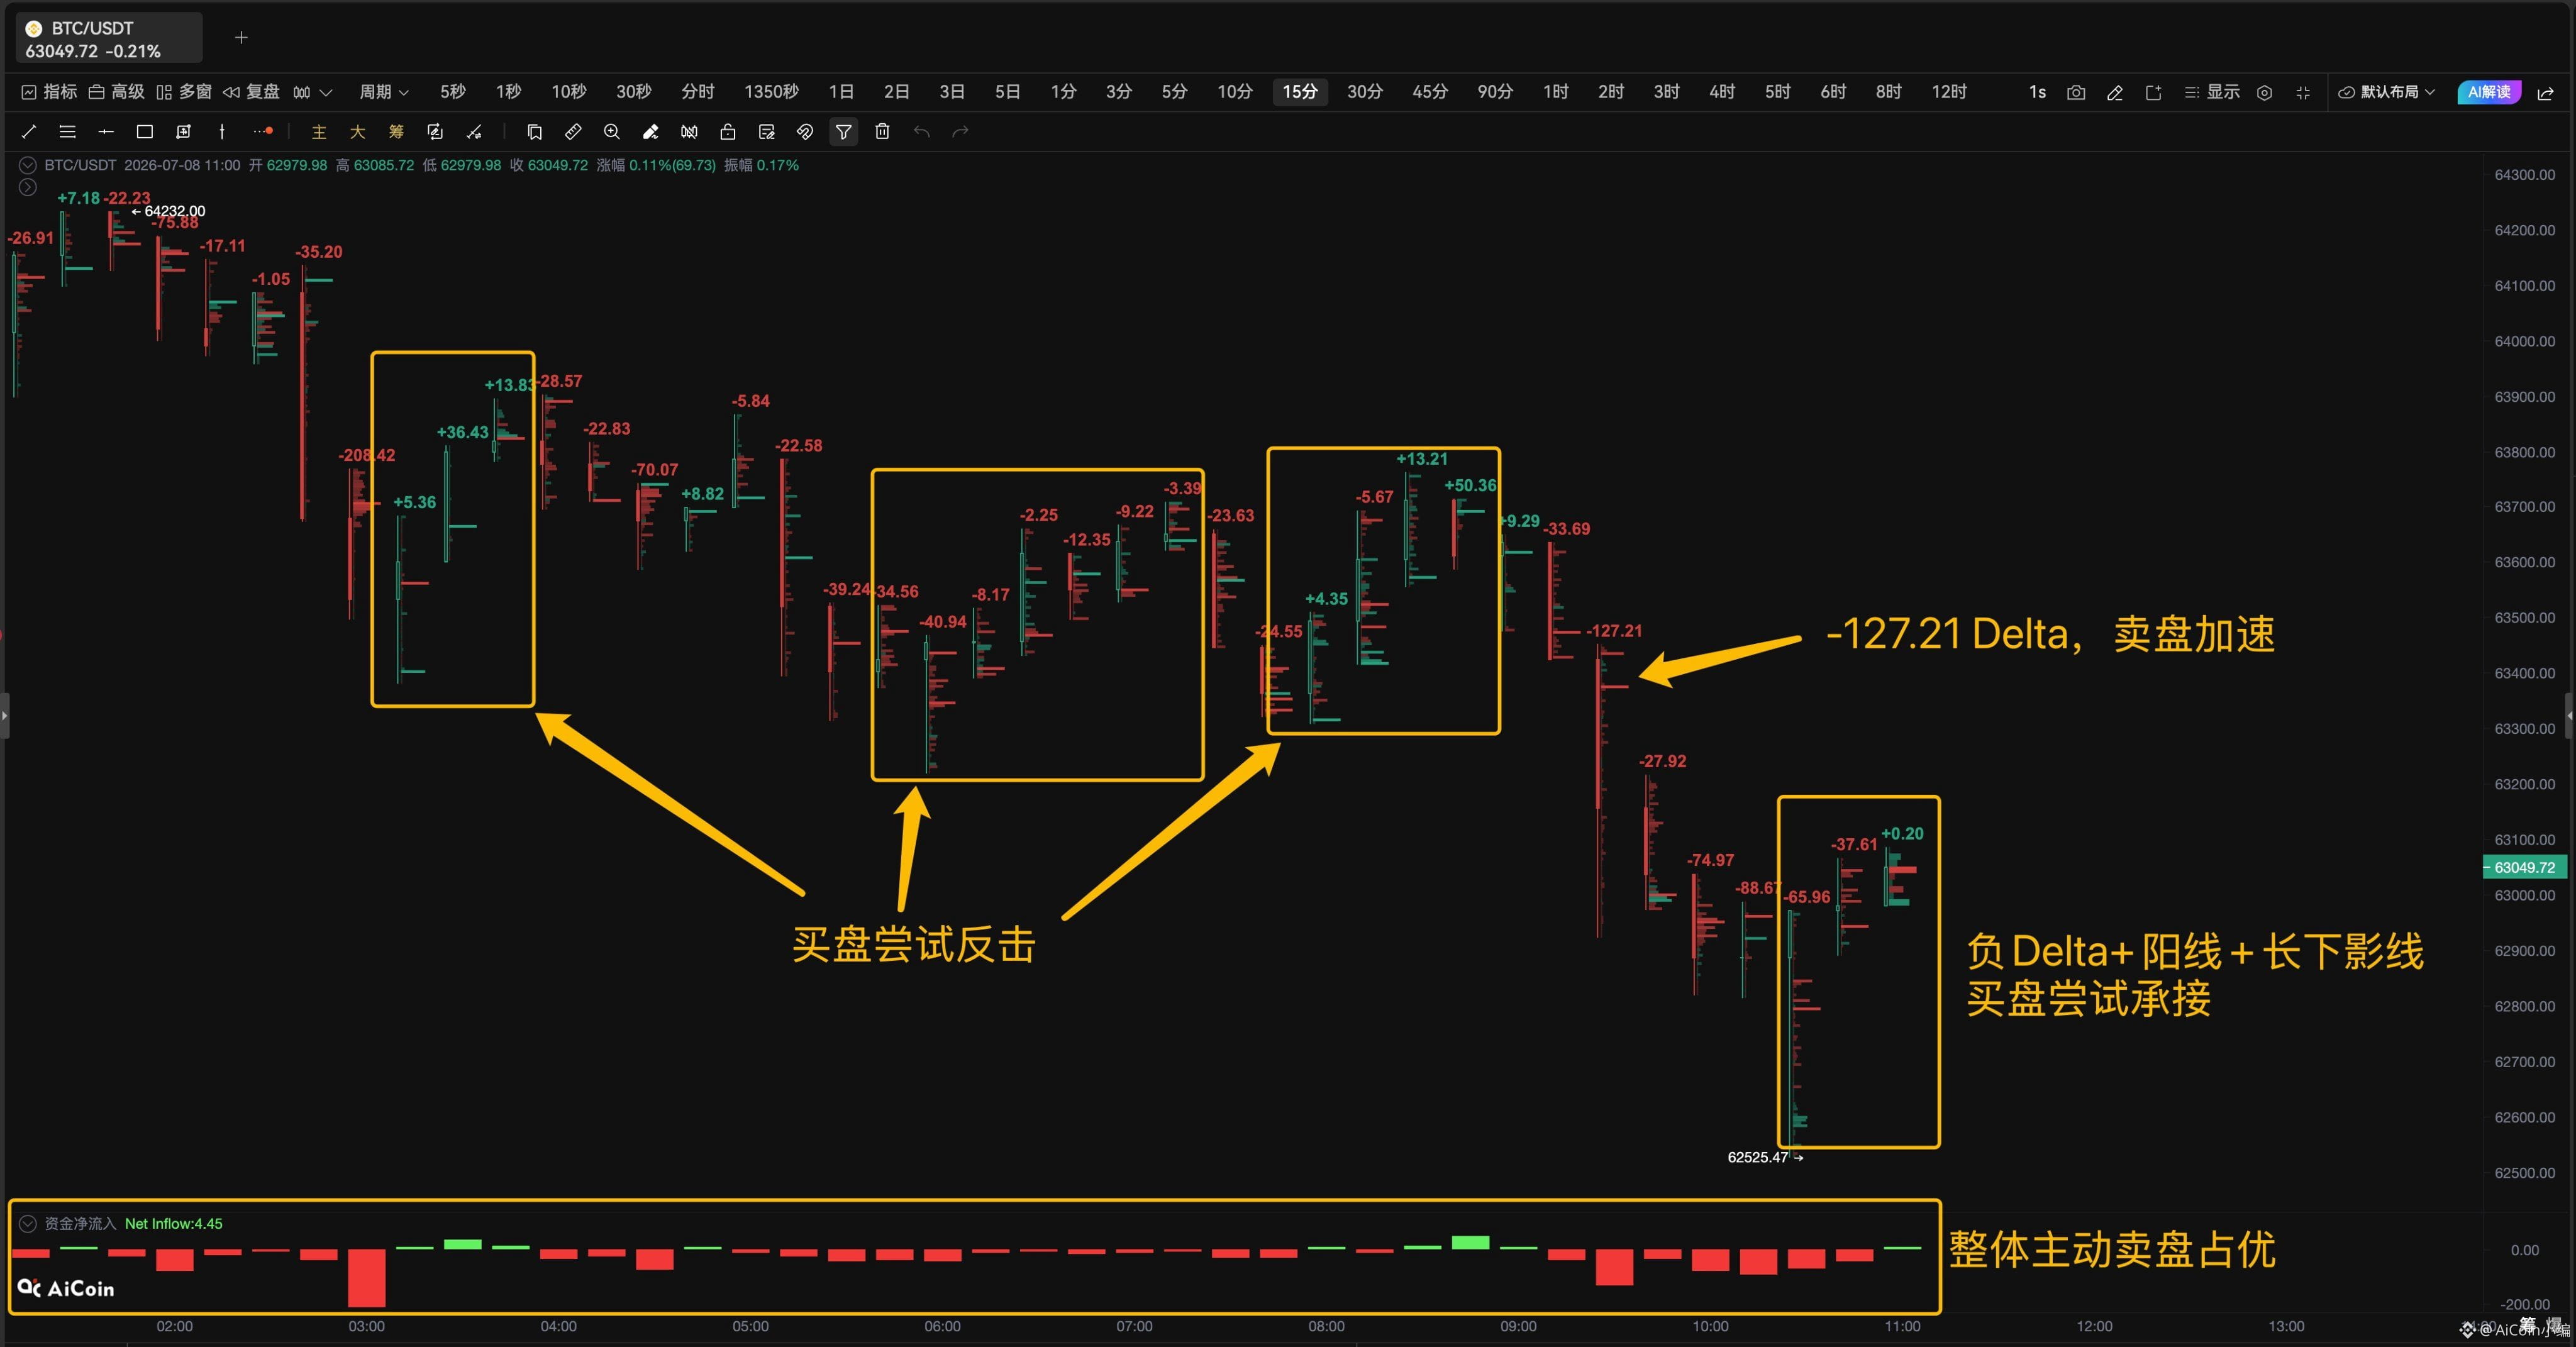
Starting around dawn, the BTC price slid all the way down from above $64K to around $62.5K. During this period, multiple K-lines had Delta persistently negative: -75.88, -208.42, -127.21, -74.97……
This indicates that active sell orders remain dominant, with sellers leading the price discovery.
Most importantly, the -127.21 Delta candle at 09:30 shows a rapid breakdown—this is clearly a seller-acceleration segment.
Although the current price, around $62,525, is showing a long lower wick and a small bullish candle, it suggests that bids are starting to pick up at the lows.
But the issue is: this buying strength is still too weak.
Compared with the earlier dozens or even hundreds of levels of negative Delta, this bid strength isn’t enough. For now, it can only be considered a brief pause in selling after sell pressure is released—not a true re-take of control by the bulls.
Next, focus on observing:
1. Whether the price can move back above $63,000~$63,200;
2. Whether subsequent positive Delta can be amplified (bids counterattacking) and pull the price back up from the downward range.
If that can’t happen, this low-level bid-support area at $62,525 may still be tested again.👀
From the footprint chart, $BTC ’s passive sell orders are still in control of the short-term pricing power…🫠
Starting around dawn, the BTC price slid all the way down from above $64K to around $62.5K. During this period, multiple K-lines had Delta persistently negative: -75.88, -208.42, -127.21, -74.97……
This indicates that active sell orders remain dominant, with sellers leading the price discovery.
Most importantly, the -127.21 Delta candle at 09:30 shows a rapid breakdown—this is clearly a seller-acceleration segment.
Although the current price, around $62,525, is showing a long lower wick and a small bullish candle, it suggests that bids are starting to pick up at the lows.
But the issue is: this buying strength is still too weak.
Compared with the earlier dozens or even hundreds of levels of negative Delta, this bid strength isn’t enough. For now, it can only be considered a brief pause in selling after sell pressure is released—not a true re-take of control by the bulls.
Next, focus on observing:
1. Whether the price can move back above $63,000~$63,200;
2. Whether subsequent positive Delta can be amplified (bids counterattacking) and pull the price back up from the downward range.
If that can’t happen, this low-level bid-support area at $62,525 may still be tested again.👀
Starting around dawn, the BTC price slid all the way down from above $64K to around $62.5K. During this period, multiple K-lines had Delta persistently negative: -75.88, -208.42, -127.21, -74.97……
This indicates that active sell orders remain dominant, with sellers leading the price discovery.
Most importantly, the -127.21 Delta candle at 09:30 shows a rapid breakdown—this is clearly a seller-acceleration segment.
Although the current price, around $62,525, is showing a long lower wick and a small bullish candle, it suggests that bids are starting to pick up at the lows.
But the issue is: this buying strength is still too weak.
Compared with the earlier dozens or even hundreds of levels of negative Delta, this bid strength isn’t enough. For now, it can only be considered a brief pause in selling after sell pressure is released—not a true re-take of control by the bulls.
Next, focus on observing:
1. Whether the price can move back above $63,000~$63,200;
2. Whether subsequent positive Delta can be amplified (bids counterattacking) and pull the price back up from the downward range.
If that can’t happen, this low-level bid-support area at $62,525 may still be tested again.👀
181
·
--
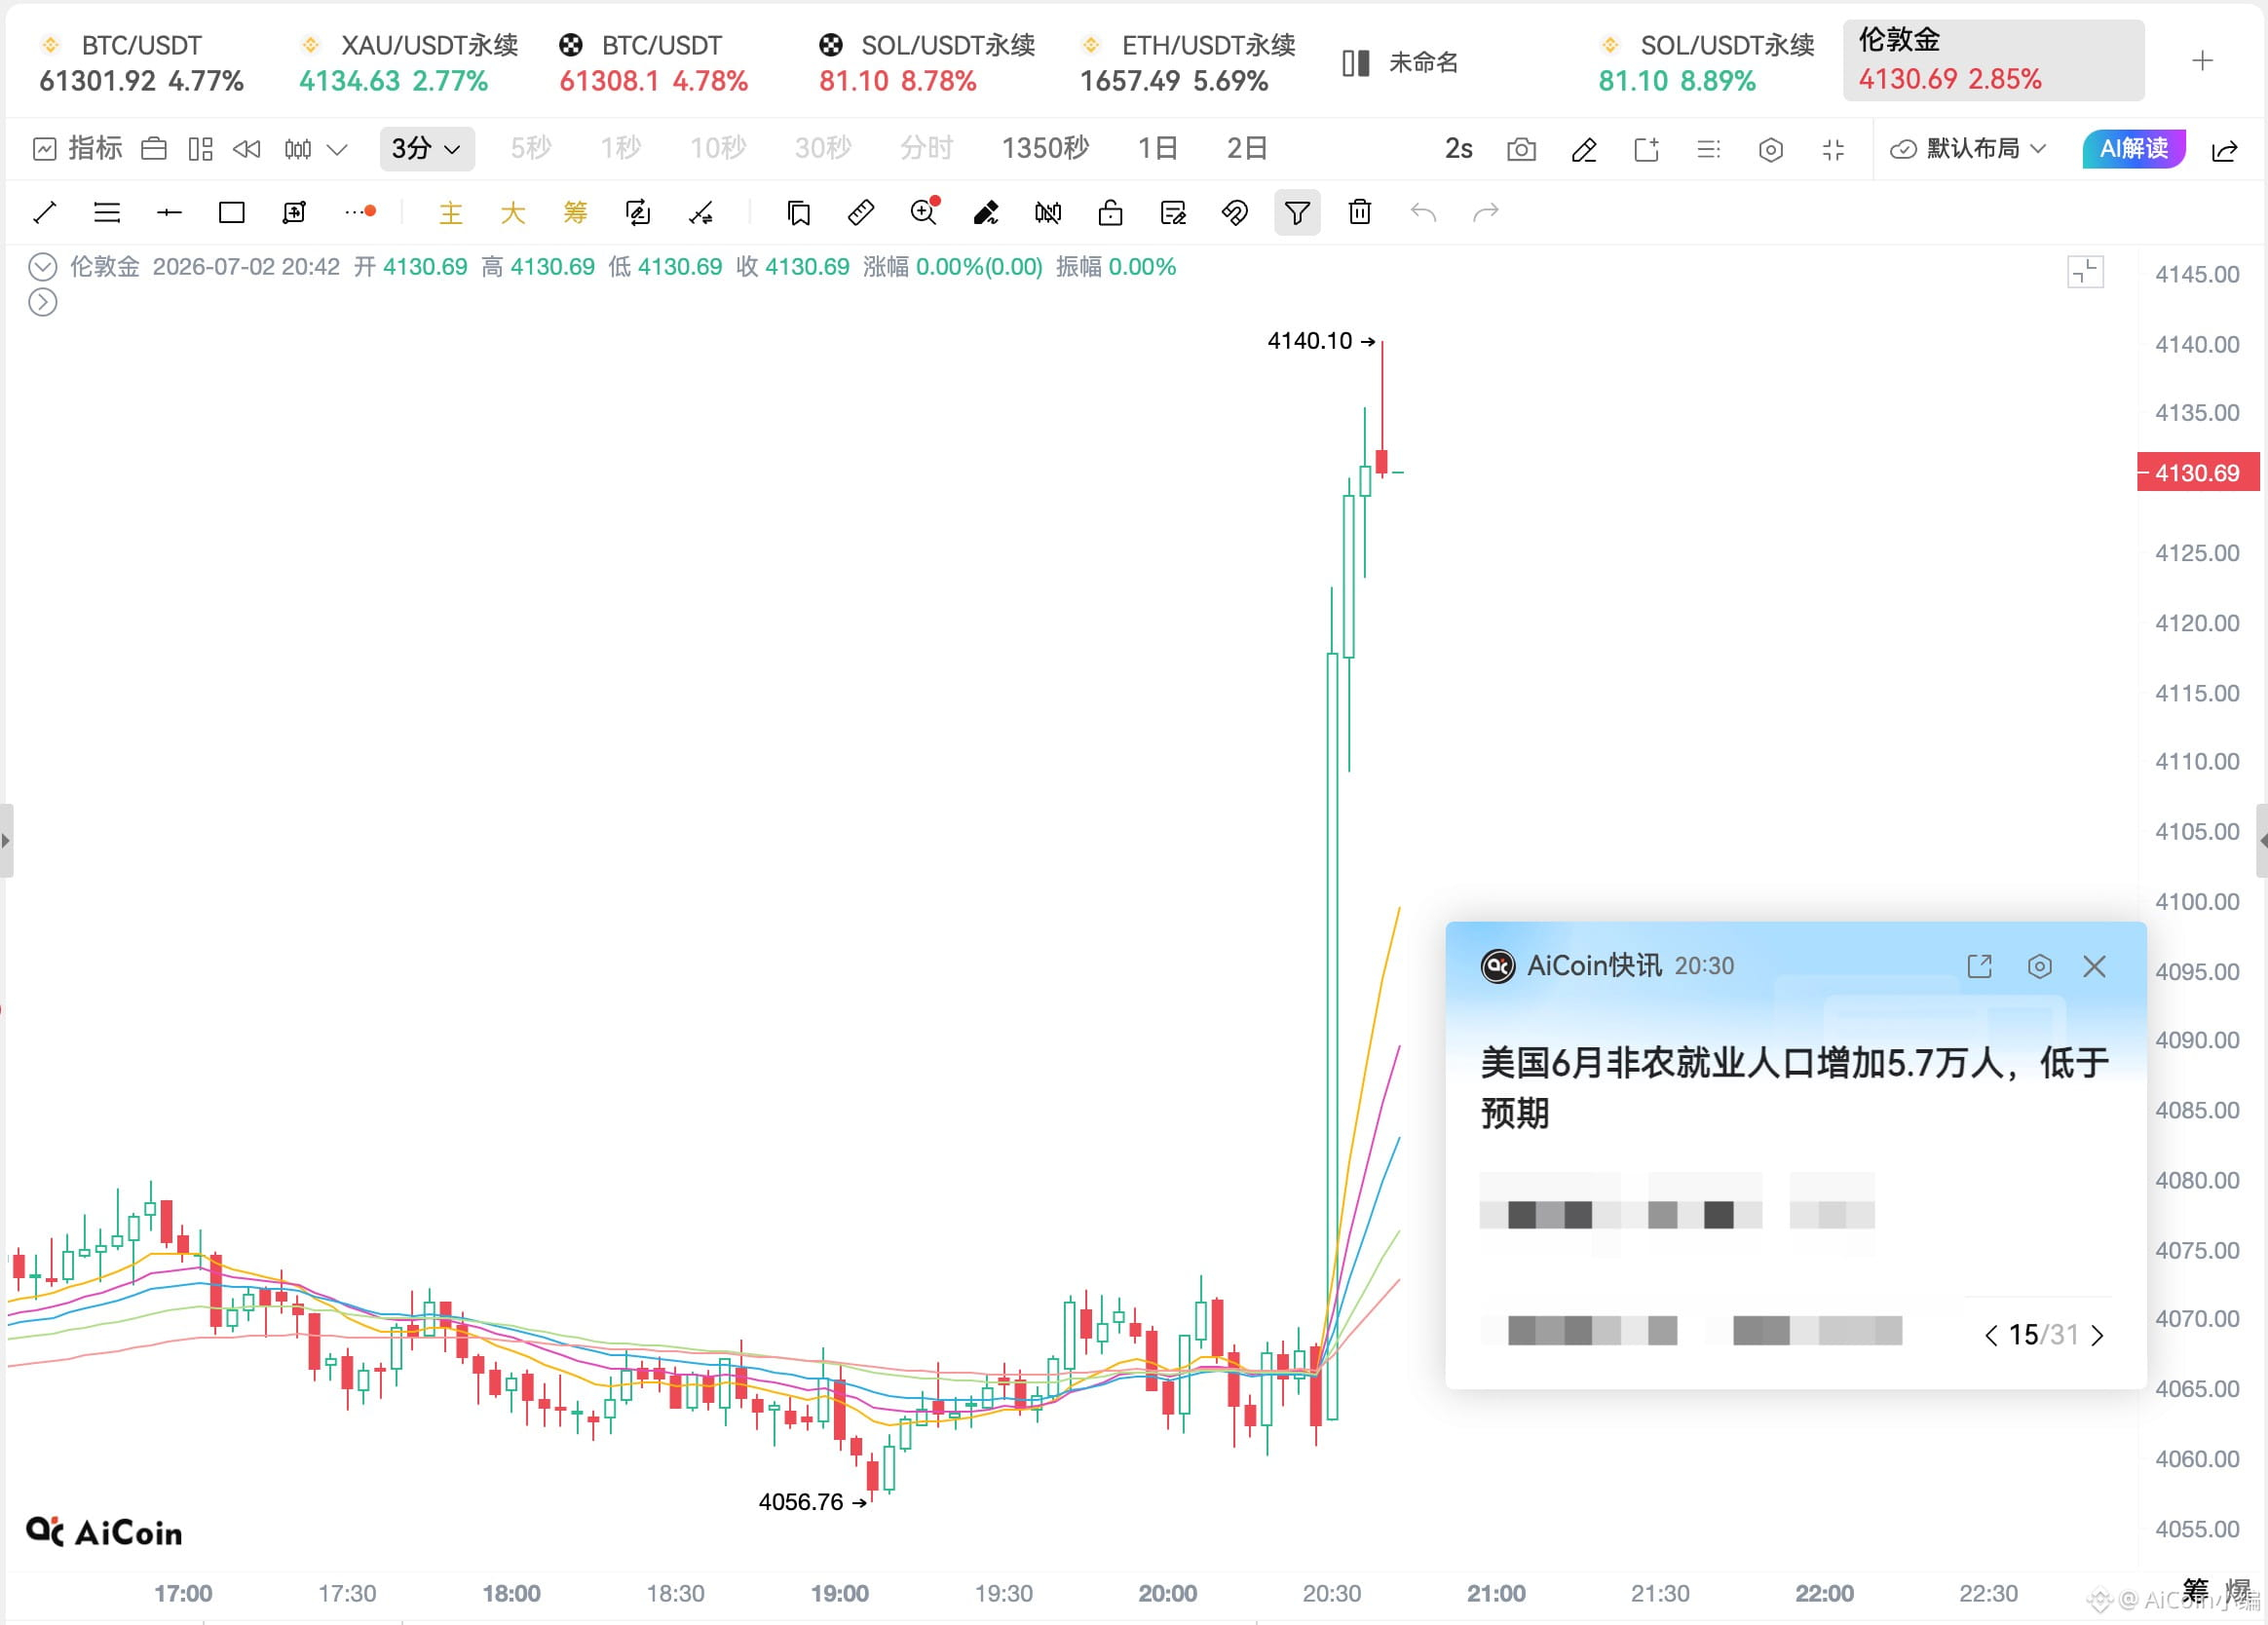
Big news! In June, U.S. nonfarm payrolls added only 57,000 jobs, far below expectations, but the unemployment rate unexpectedly fell to 4.2%.
The labor market is cooling rapidly, and companies are clearly being much more cautious about hiring.
So what happened? Spot gold surged more than 1.8% straight up, breaking through to over $4,140 per ounce! 💰
Weak data = stronger expectations for rate cuts. This wave of safe-haven demand plus easing momentum is hitting exceptionally hard. Gold bulls are celebrating, and Wall Street now has to reprice the Fed’s path again.
The bad news is that for gold, it’s always good news—but for $BTC , it may not be…
$XAU
{future}(XAUUSDT)
Big news! In June, U.S. nonfarm payrolls added only 57,000 jobs, far below expectations, but the unemployment rate unexpectedly fell to 4.2%.
The labor market is cooling rapidly, and companies are clearly being much more cautious about hiring.
So what happened? Spot gold surged more than 1.8% straight up, breaking through to over $4,140 per ounce! 💰
Weak data = stronger expectations for rate cuts. This wave of safe-haven demand plus easing momentum is hitting exceptionally hard. Gold bulls are celebrating, and Wall Street now has to reprice the Fed’s path again.
The bad news is that for gold, it’s always good news—but for $BTC , it may not be…
$XAU
The labor market is cooling rapidly, and companies are clearly being much more cautious about hiring.
So what happened? Spot gold surged more than 1.8% straight up, breaking through to over $4,140 per ounce! 💰
Weak data = stronger expectations for rate cuts. This wave of safe-haven demand plus easing momentum is hitting exceptionally hard. Gold bulls are celebrating, and Wall Street now has to reprice the Fed’s path again.
The bad news is that for gold, it’s always good news—but for $BTC , it may not be…
$XAU
95
Log in to explore more content
Join global crypto users on Binance Square
⚡️ Get latest and useful information about crypto.
💬 Trusted by the world’s largest crypto exchange.
👍 Discover real insights from verified creators.
Email / Phone number
Trending Topics
AnthropicToDebutAfter$83IPOPricing
15,333 views
147 Discussing
Stock Futures Hold Near Flat as Anthropic Prices IPO at $83 Ahead of Debut
Binance News
·8 Likes
·7.6k views
BTCRemainsUnderPressureAfterHawkishFOMCMinutes
57,463 views
1,220 Discussing
NvidiaBoardReportedlySplitOverHuang’sReturn
19,065 views
590 Discussing