
Luisa_H13
126 Posts

Luisa_H13
19 Following
53 Followers
185 Liked
Posts
The RSI has experienced a significant decline, although in the short term the trend continues to reflect bullish momentum. Taking profits could shake this trend and will mark a correction in the coming days, reaching levels again between $88–$90.
What do you think 👇🏼👇🏼
What do you think 👇🏼👇🏼
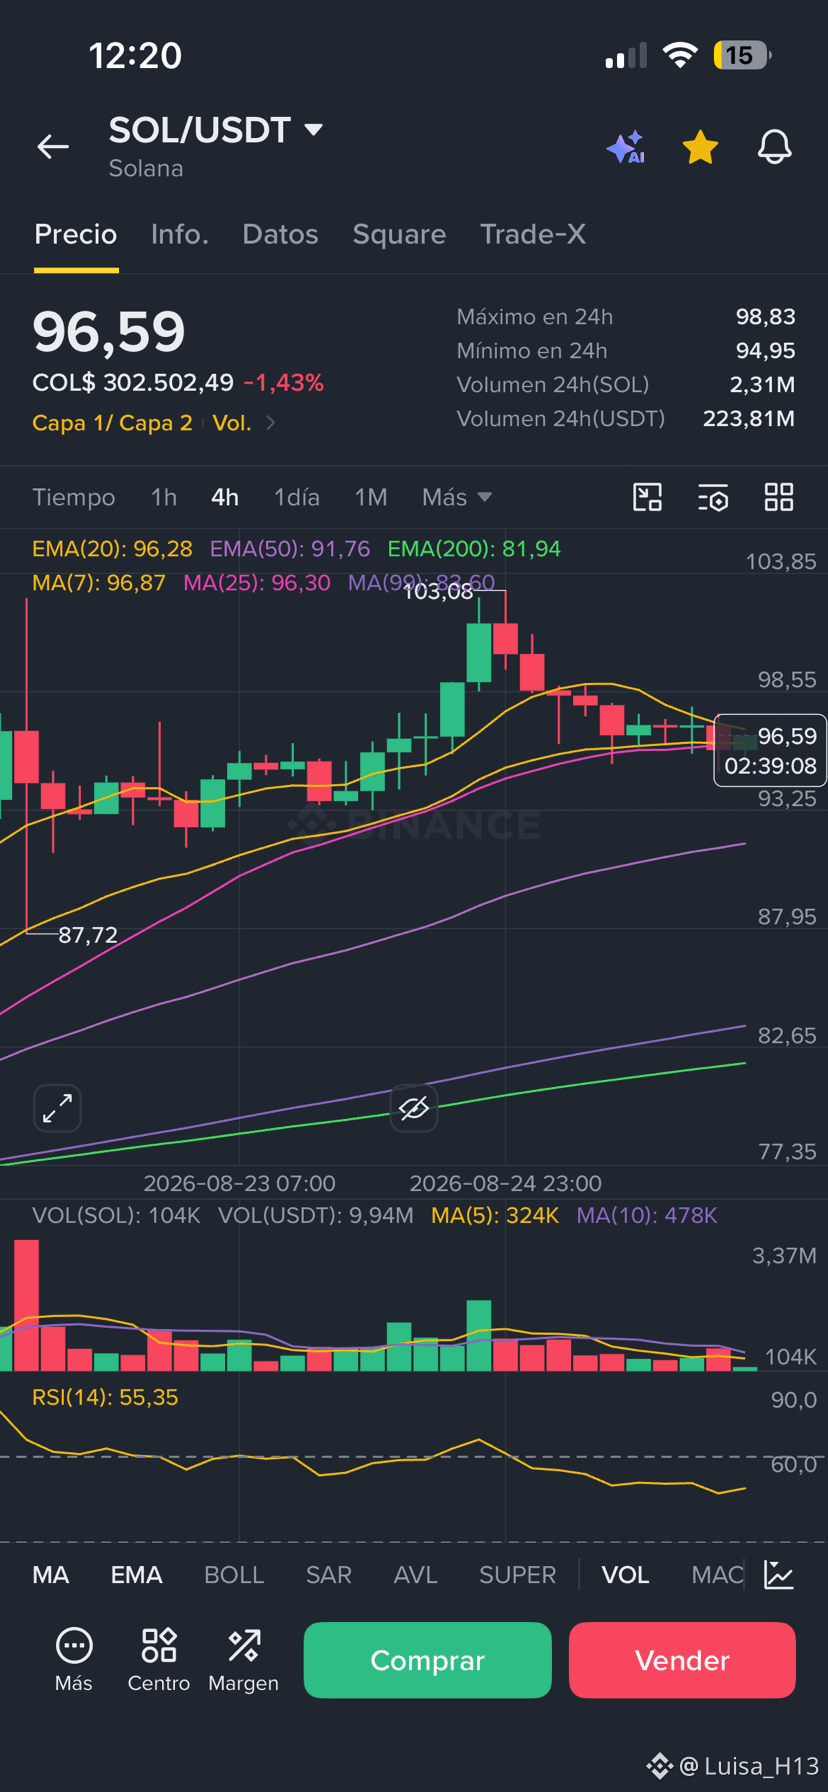
📊 SOL/USDT | Technical Analysis 4H
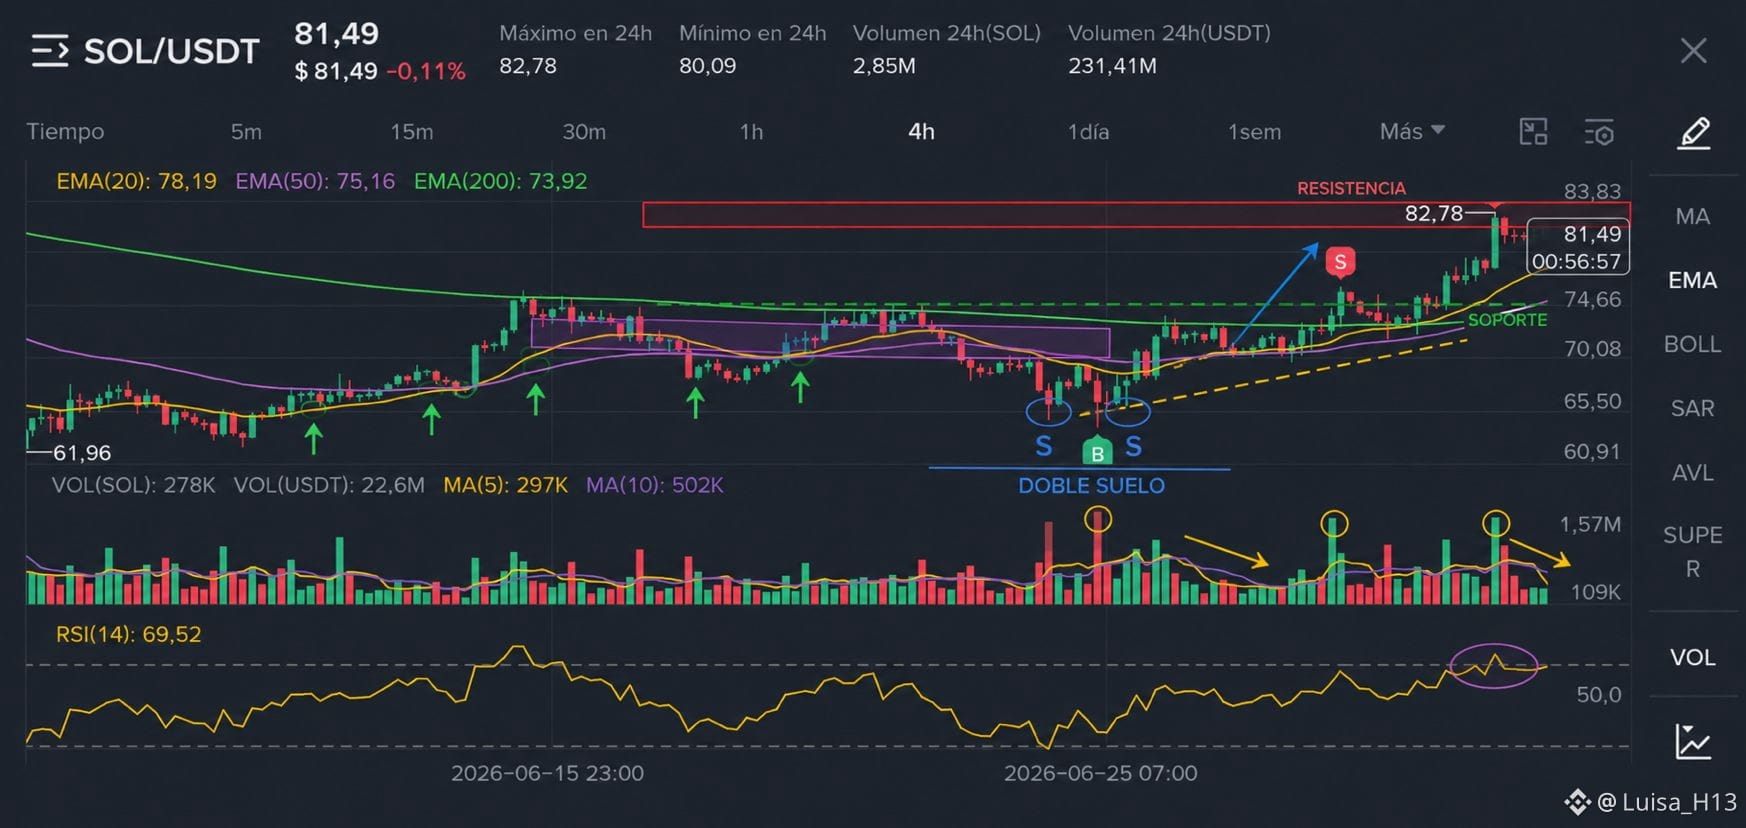
SOL maintains a clearly bullish structure with a sequence of higher highs and higher lows.
On the chart, several technical signals stand out:
✅ Double bottom with bullish confirmation.
✅ Consecutive bounces off the EMA20, acting as dynamic support.
✅ Breakout above a prior resistance with an increase in volume.
✅ Consolidation just below a key resistance, which could be anticipating a major move.
Currently, the 82.78–83.83 USD zone is the level the market needs to break above to confirm the continuation of the uptrend. As long as the price remains above the EMA20, the technical bias continues to favor buyers.
For now, I don’t see clear signs of a trend reversal; the behavior is more consistent with a pause within a bullish structure than with exhaustion of the move.
📌 Key levels to watch:
* Support: 78.20 USD (EMA20).
* Resistance: 82.78–83.83 USD.
* A breakout with volume could pave the way toward the next target zone.
Do you think SOL will break the resistance on this attempt, or will we see a pullback first to grab liquidity?
$SOL #SolanaStrong #BinanceSquareTalks
SOL maintains a clearly bullish structure with a sequence of higher highs and higher lows.
On the chart, several technical signals stand out:
✅ Double bottom with bullish confirmation.
✅ Consecutive bounces off the EMA20, acting as dynamic support.
✅ Breakout above a prior resistance with an increase in volume.
✅ Consolidation just below a key resistance, which could be anticipating a major move.
Currently, the 82.78–83.83 USD zone is the level the market needs to break above to confirm the continuation of the uptrend. As long as the price remains above the EMA20, the technical bias continues to favor buyers.
For now, I don’t see clear signs of a trend reversal; the behavior is more consistent with a pause within a bullish structure than with exhaustion of the move.
📌 Key levels to watch:
* Support: 78.20 USD (EMA20).
* Resistance: 82.78–83.83 USD.
* A breakout with volume could pave the way toward the next target zone.
Do you think SOL will break the resistance on this attempt, or will we see a pullback first to grab liquidity?
$SOL #SolanaStrong #BinanceSquareTalks
Do you think $SOL will hit 95 USD again?
I'm all ears 👇🏼👇🏼
I'm all ears 👇🏼👇🏼
No, volverá a 55 usd
40%
Si, con cortas correcciones
60%
40 votes • Voting closed
📊 SOL/USDT 4H | Technical Analysis
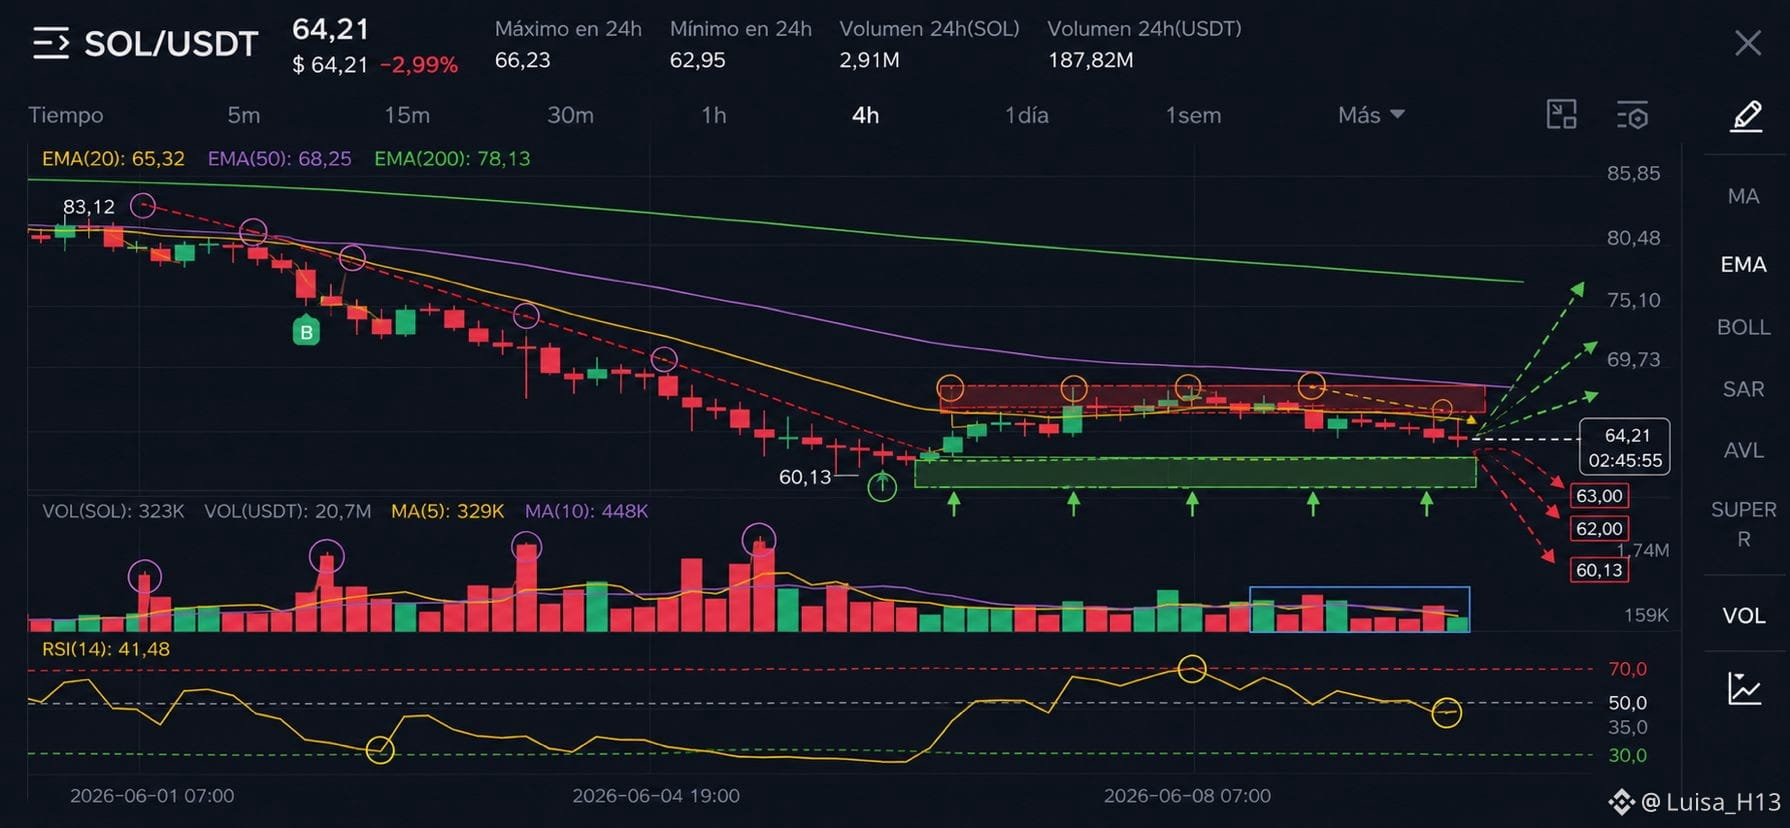
🔹 The main trend remains bearish, but the price found solid support at 60.13 USD.
🔹 After the bounce, SOL entered a consolidation phase between 60 and 66 USD, showing a loss of selling pressure.
🔹 The key area to break is between 65.3 and 66.5 USD, where several recent rejections and the EMA 20 align.
🔹 The RSI (41) has exited oversold territory, but it hasn't confirmed a trend reversal yet.
🎯 Bullish scenario: break above 66.5 USD → targets at 68, 70, and 73 USD.
⚠️ Bearish scenario: drop below 63 USD → potential return to 62-60 USD.
For now, the market seems to be building a base. The next breakout will likely define the movement for the upcoming days. 🚀📈
$SOL #BİNANCE #TradingCommunity #TechnicalAnalysis #SOLUSDT
🔹 The main trend remains bearish, but the price found solid support at 60.13 USD.
🔹 After the bounce, SOL entered a consolidation phase between 60 and 66 USD, showing a loss of selling pressure.
🔹 The key area to break is between 65.3 and 66.5 USD, where several recent rejections and the EMA 20 align.
🔹 The RSI (41) has exited oversold territory, but it hasn't confirmed a trend reversal yet.
🎯 Bullish scenario: break above 66.5 USD → targets at 68, 70, and 73 USD.
⚠️ Bearish scenario: drop below 63 USD → potential return to 62-60 USD.
For now, the market seems to be building a base. The next breakout will likely define the movement for the upcoming days. 🚀📈
$SOL #BİNANCE #TradingCommunity #TechnicalAnalysis #SOLUSDT
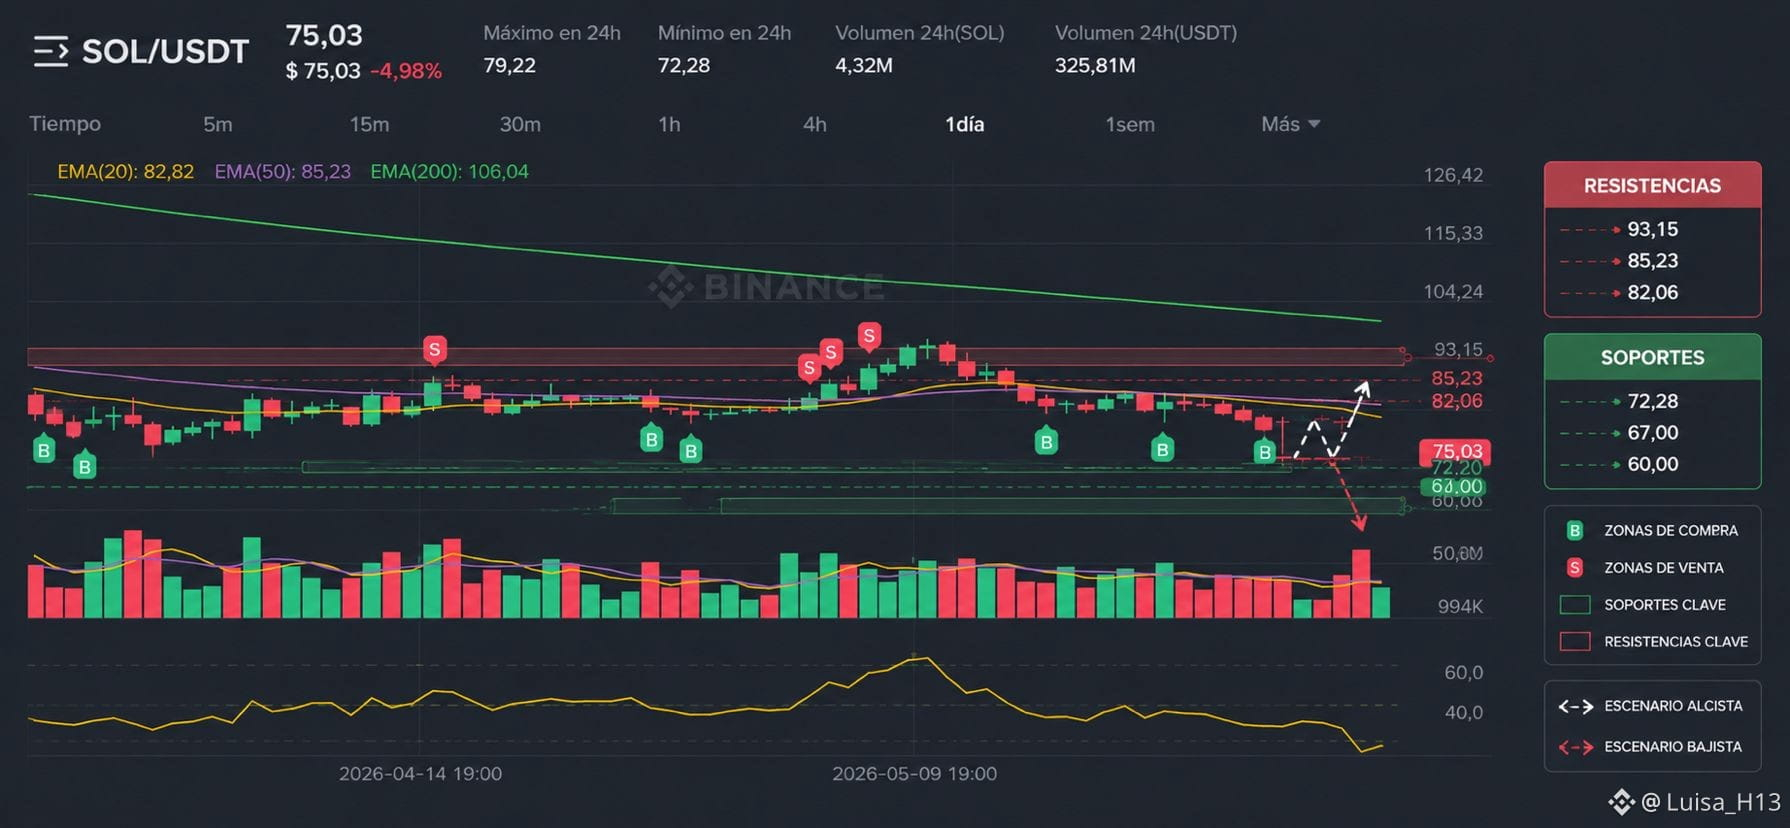
$SOL is trying to build a floor at 72-75 USD.
I still don't see a trend reversal signal, but I do see a zone where sellers are starting to run out of steam.
As long as 72 USD doesn’t break, the odds favor a bounce towards 76-80 USD before an immediate drop to 67 USD.
Do you think it will take a while for sol to get back to 80 USD?
I still don't see a trend reversal signal, but I do see a zone where sellers are starting to run out of steam.
As long as 72 USD doesn’t break, the odds favor a bounce towards 76-80 USD before an immediate drop to 67 USD.
Do you think it will take a while for sol to get back to 80 USD?
🚨 UPDATE $SOL 🚨
The market is sending clear signals, and few are catching on 👀
I bought SOL in the 84 - 88 USD range
We've already taken some partial profits 💰
But here’s the crucial part👇
📊 While many are selling out of fear…
Those who understand the cycle are stacking up.
My plan now:
✅ Let part of the position ride
✅ Re-enter on dips
✅ Don’t chase the price
💡 Remember:
The money isn’t in guessing…
It’s in having a plan and executing it.
📌 Question:
Are you buying, shorting, or waiting? 👇
The market is sending clear signals, and few are catching on 👀
I bought SOL in the 84 - 88 USD range
We've already taken some partial profits 💰
But here’s the crucial part👇
📊 While many are selling out of fear…
Those who understand the cycle are stacking up.
My plan now:
✅ Let part of the position ride
✅ Re-enter on dips
✅ Don’t chase the price
💡 Remember:
The money isn’t in guessing…
It’s in having a plan and executing it.
📌 Question:
Are you buying, shorting, or waiting? 👇
Log in to explore more content