
领鹰计划
149 Posts

领鹰计划
Report
Block User
以行情事实阐述观点
交易是一门手艺,是需要学习的。
以Wyckoff周期作为基础,用道氏理论选择结构入场
个人习惯做突破信号,一般选择在第三买点入场:
1、先确认当前的结构
2、给予结构做行情推演,后续观察行情是否能按照推演走
3、行情成功按照推演路径走,入场做好止损
4、持仓需要关键事件记录;出现弱势即可离场

TRX Holder
Frequent Trader
7.3 Years
7 Following
366 Followers
212 Liked
Posts
All
Quotes
·
--
Bullish
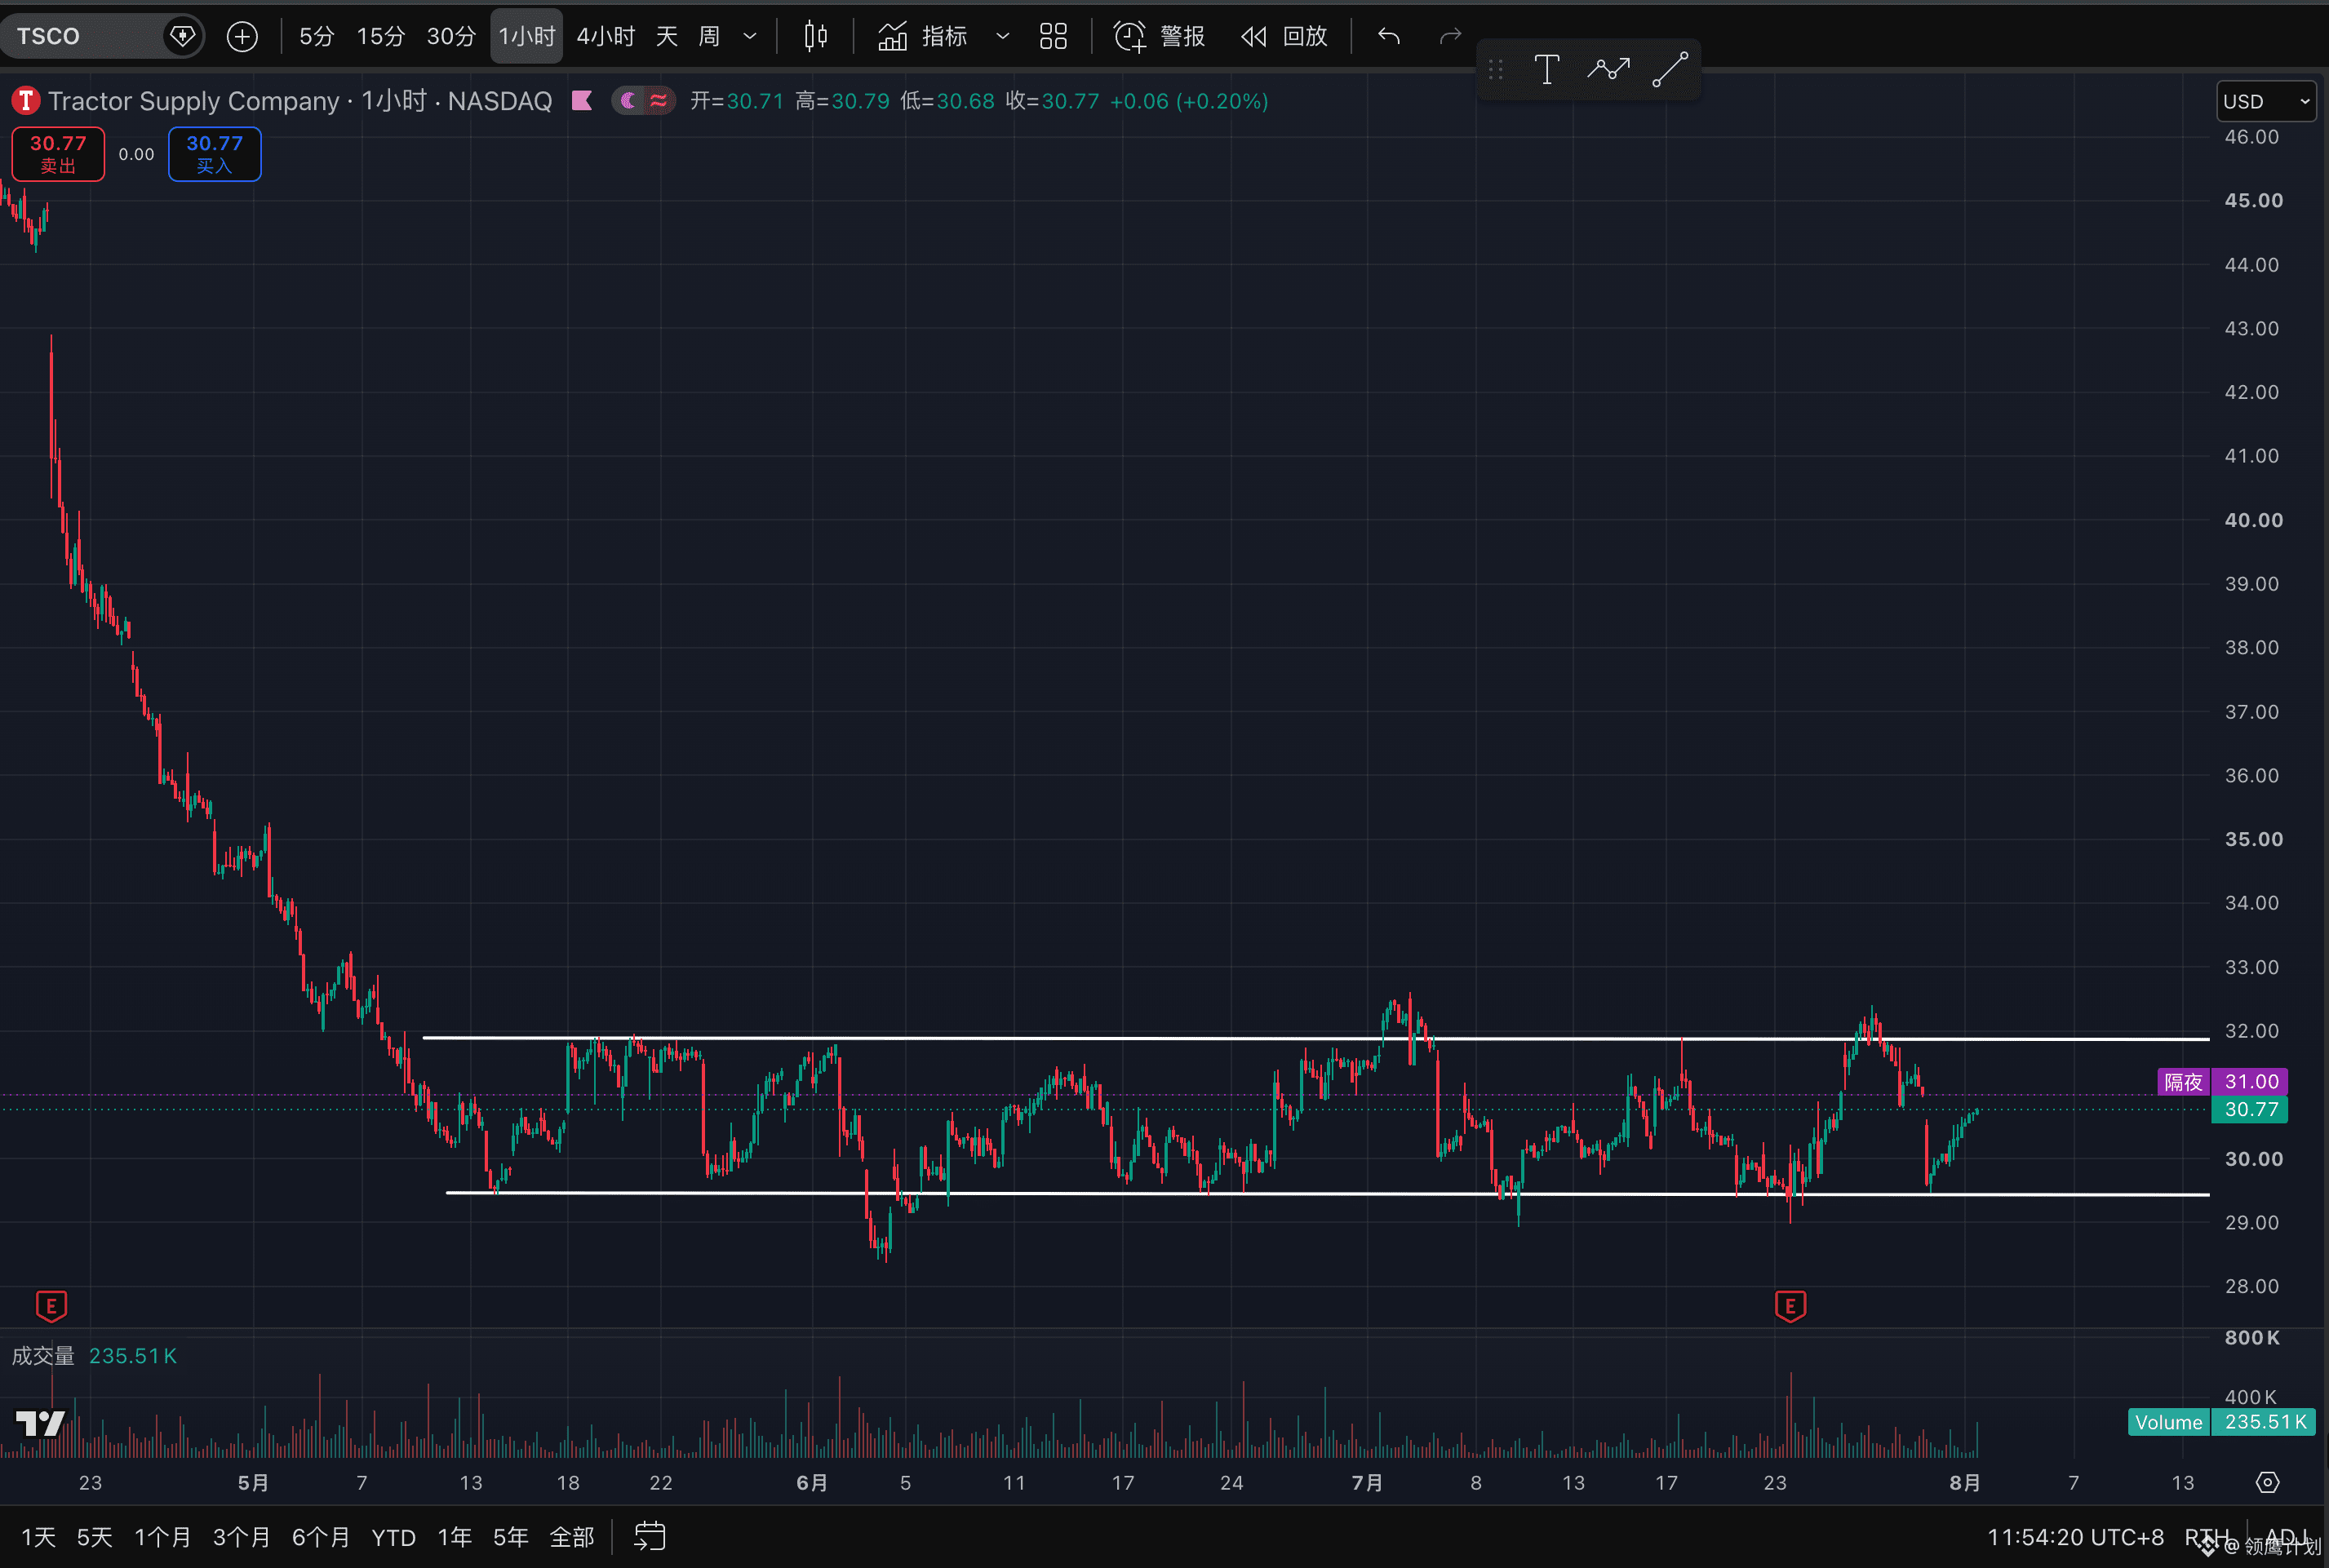
$TSCO.US Completed base building. Waiting for a breakout
The earnings report has also passed safely; both the pressure levels and support levels are performing quite well
Currently the volatility is a bit high. The box width of 7% is a little too large. If we break through directly, it’s still not a good time to get involved
We can wait a bit longer for consolidation, then look for a breakout driven by momentum
#领鹰计划 #美股超话
{stock_us}(TSCO.US)
$TSCO.US Completed base building. Waiting for a breakout
The earnings report has also passed safely; both the pressure levels and support levels are performing quite well
Currently the volatility is a bit high. The box width of 7% is a little too large. If we break through directly, it’s still not a good time to get involved
We can wait a bit longer for consolidation, then look for a breakout driven by momentum
#领鹰计划 #美股超话
The earnings report has also passed safely; both the pressure levels and support levels are performing quite well
Currently the volatility is a bit high. The box width of 7% is a little too large. If we break through directly, it’s still not a good time to get involved
We can wait a bit longer for consolidation, then look for a breakout driven by momentum
#领鹰计划 #美股超话
132
·
--
Bullish
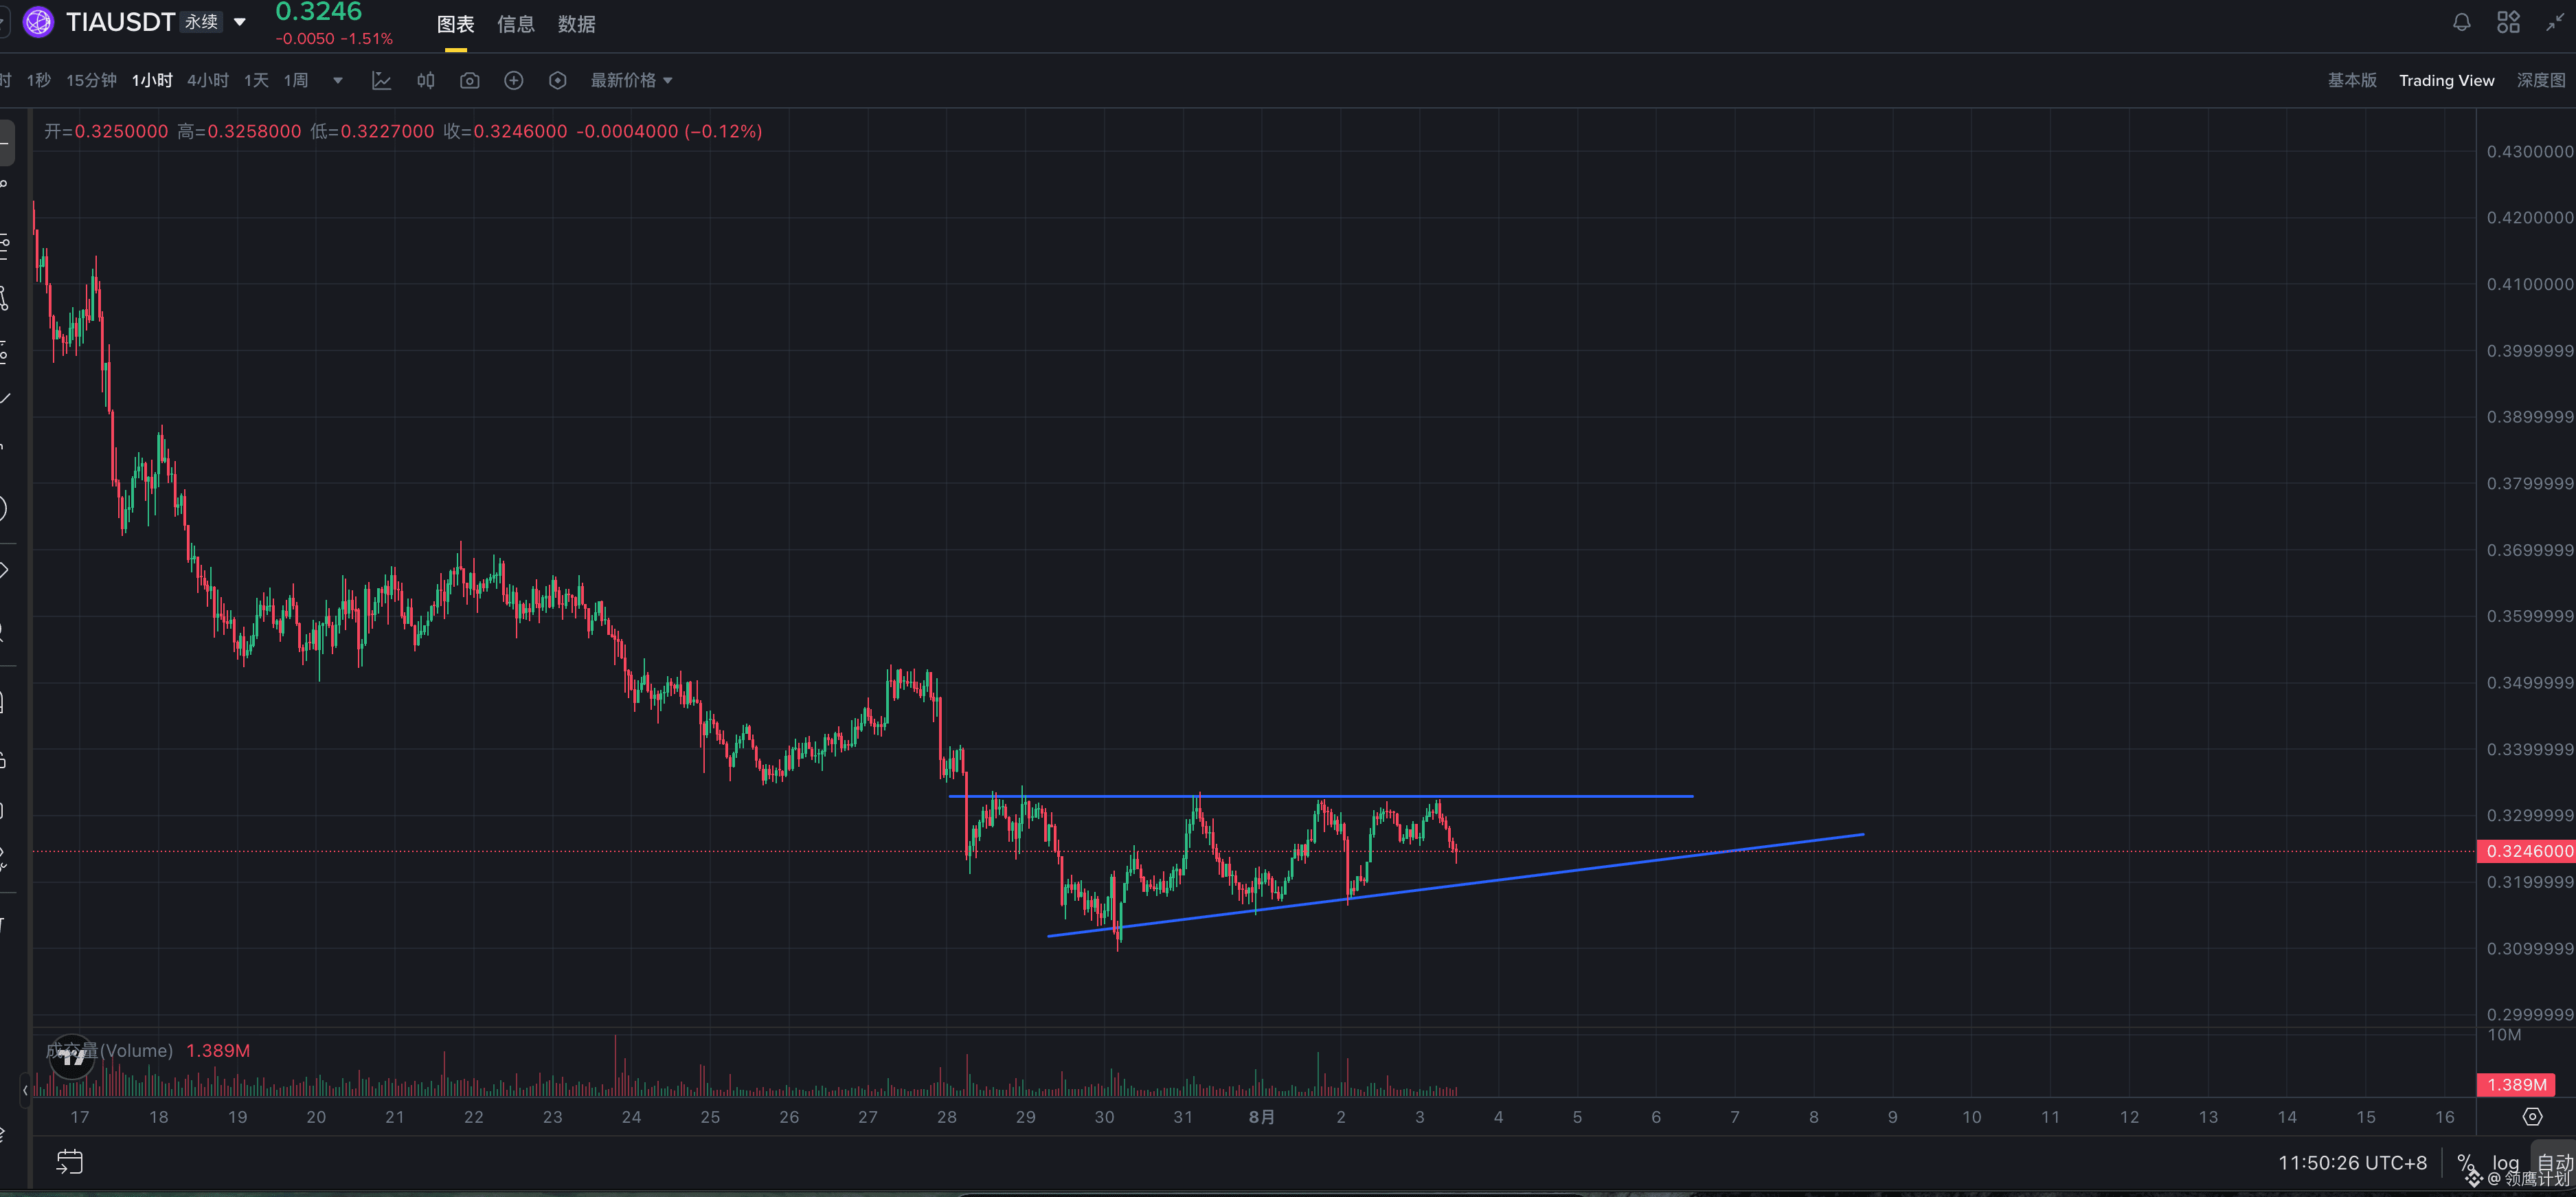
$TIA The base building is basically complete; waiting for convergence.
The pressure level has been tested multiple times, and the volatility is also showing a converging trend.
You can start paying attention to this breakout signal and set an alert.
If it breaks down below the lower trendline, then we need to observe how the overall box (range) structure adjusts.
If it continues to converge and then breaks out again, and there are no major flaws, you can try entering with 1R.
#领鹰计划 #交易员
{future}(TIAUSDT)
$TIA The base building is basically complete; waiting for convergence.
The pressure level has been tested multiple times, and the volatility is also showing a converging trend.
You can start paying attention to this breakout signal and set an alert.
If it breaks down below the lower trendline, then we need to observe how the overall box (range) structure adjusts.
If it continues to converge and then breaks out again, and there are no major flaws, you can try entering with 1R.
#领鹰计划 #交易员
The pressure level has been tested multiple times, and the volatility is also showing a converging trend.
You can start paying attention to this breakout signal and set an alert.
If it breaks down below the lower trendline, then we need to observe how the overall box (range) structure adjusts.
If it continues to converge and then breaks out again, and there are no major flaws, you can try entering with 1R.
#领鹰计划 #交易员
129
·
--
Bullish
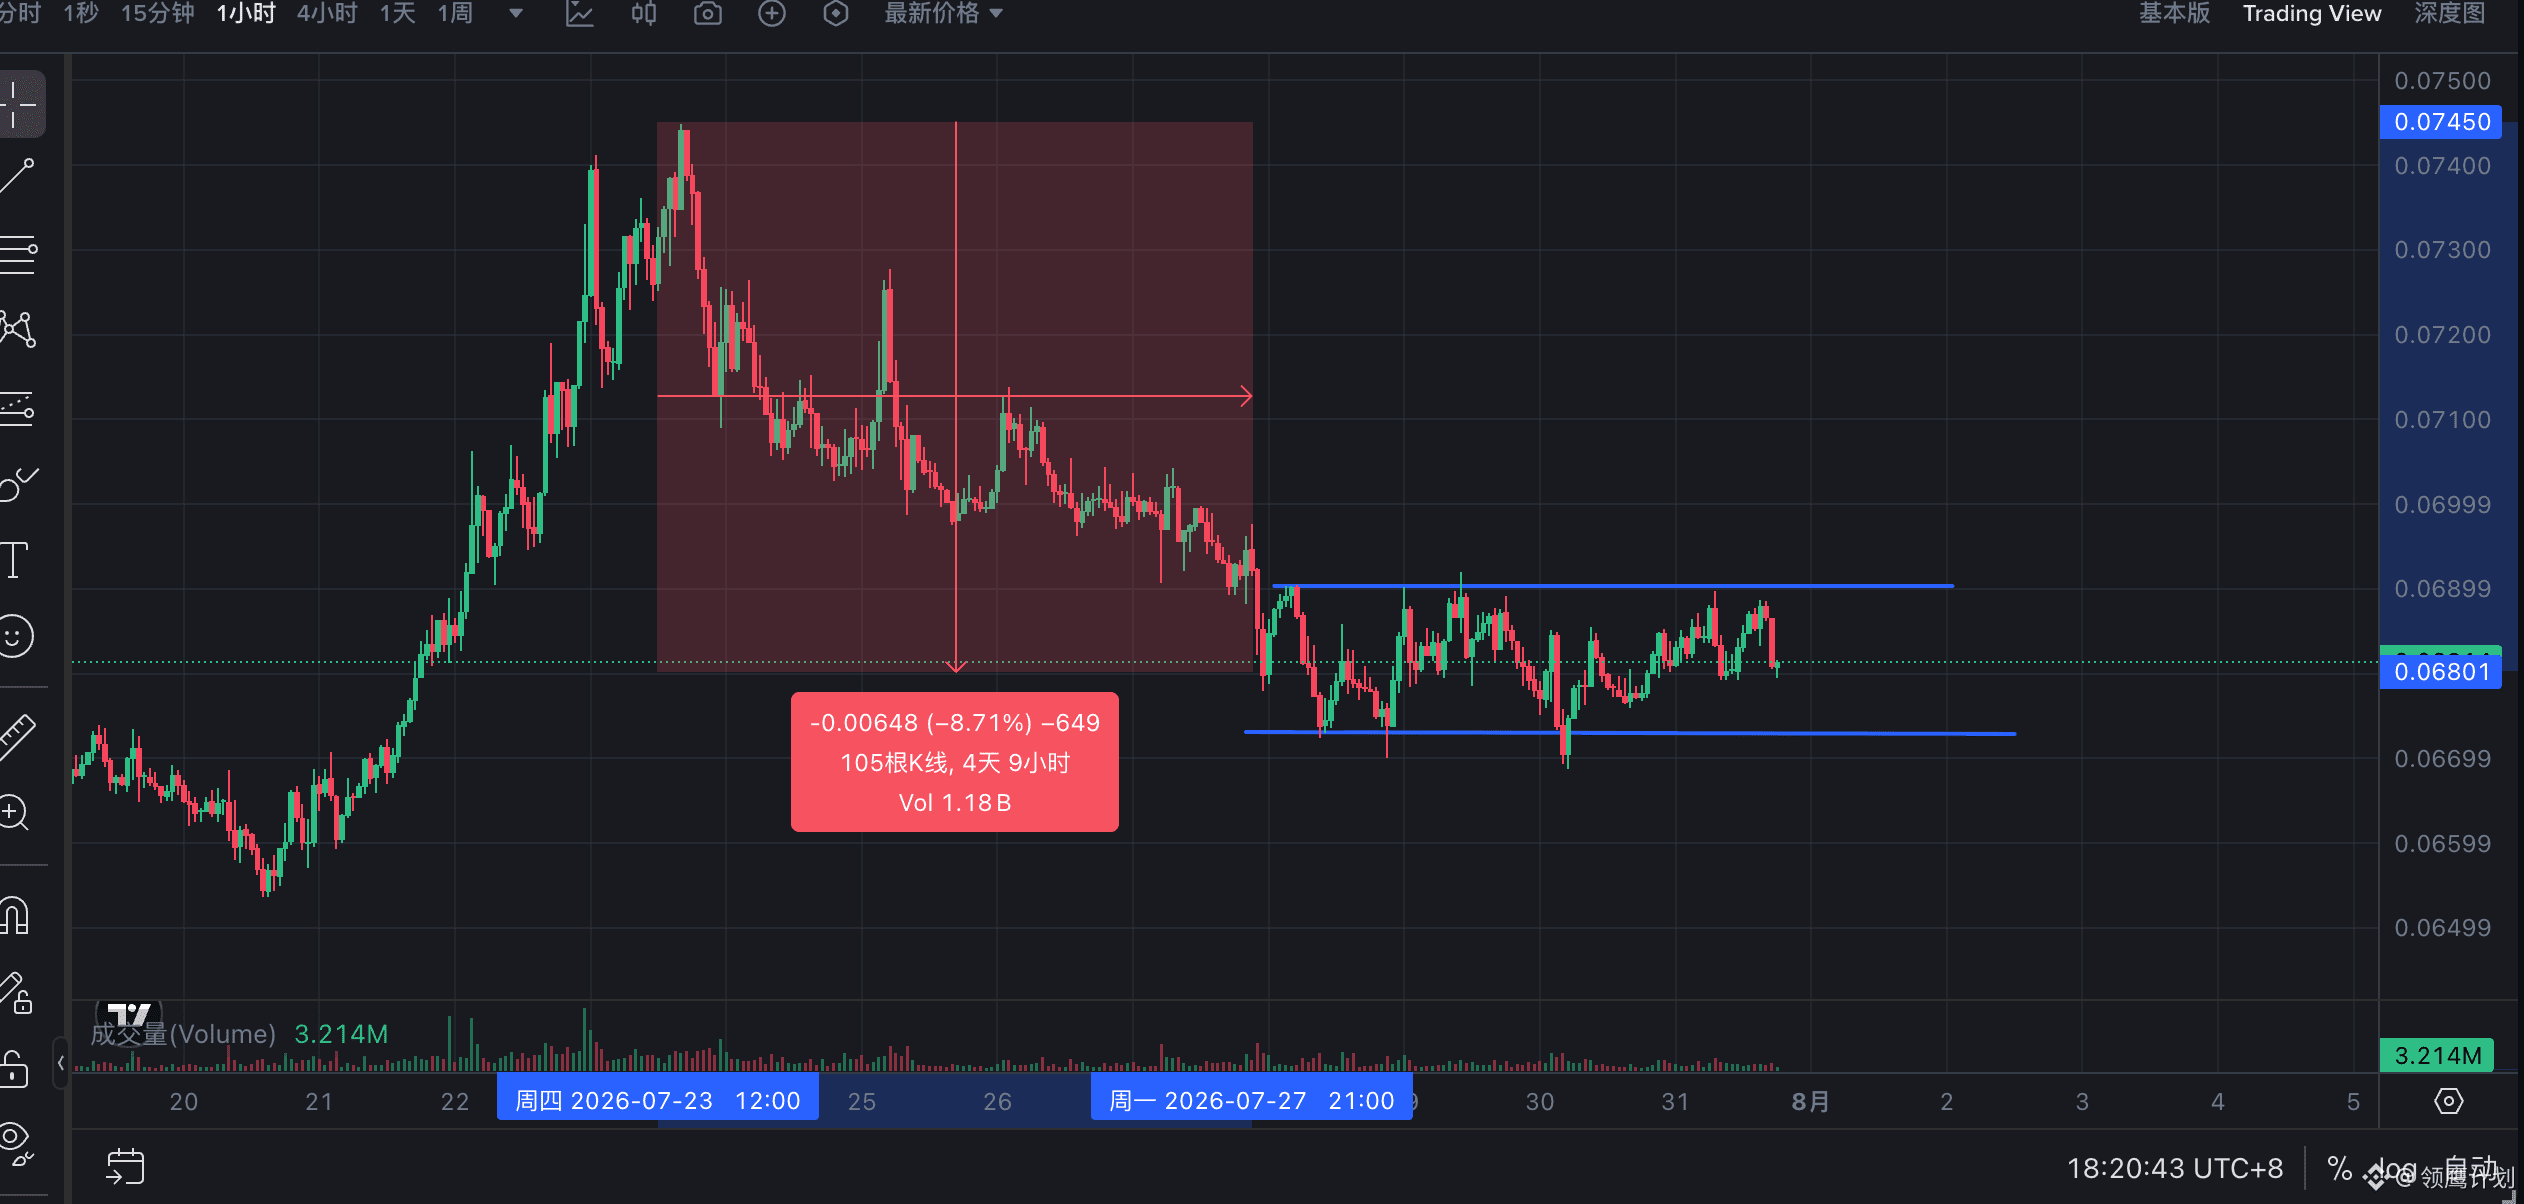
$HBAR waiting for consolidation breakout
The whole box structure has taken shape initially, and volatility has started to decline
It still falls short a bit compared with the scale of the prior sell-off. If it can consolidate a bit more, that would be even better
The overall range of the box is a little over 3%, and what matters most is momentum performance
Set a price alert above, and decide whether to participate based on momentum
#领鹰计划 #交易员 #突破
{future}(HBARUSDT)
$HBAR waiting for consolidation breakout
The whole box structure has taken shape initially, and volatility has started to decline
It still falls short a bit compared with the scale of the prior sell-off. If it can consolidate a bit more, that would be even better
The overall range of the box is a little over 3%, and what matters most is momentum performance
Set a price alert above, and decide whether to participate based on momentum
#领鹰计划 #交易员 #突破
The whole box structure has taken shape initially, and volatility has started to decline
It still falls short a bit compared with the scale of the prior sell-off. If it can consolidate a bit more, that would be even better
The overall range of the box is a little over 3%, and what matters most is momentum performance
Set a price alert above, and decide whether to participate based on momentum
#领鹰计划 #交易员 #突破
162
·
--
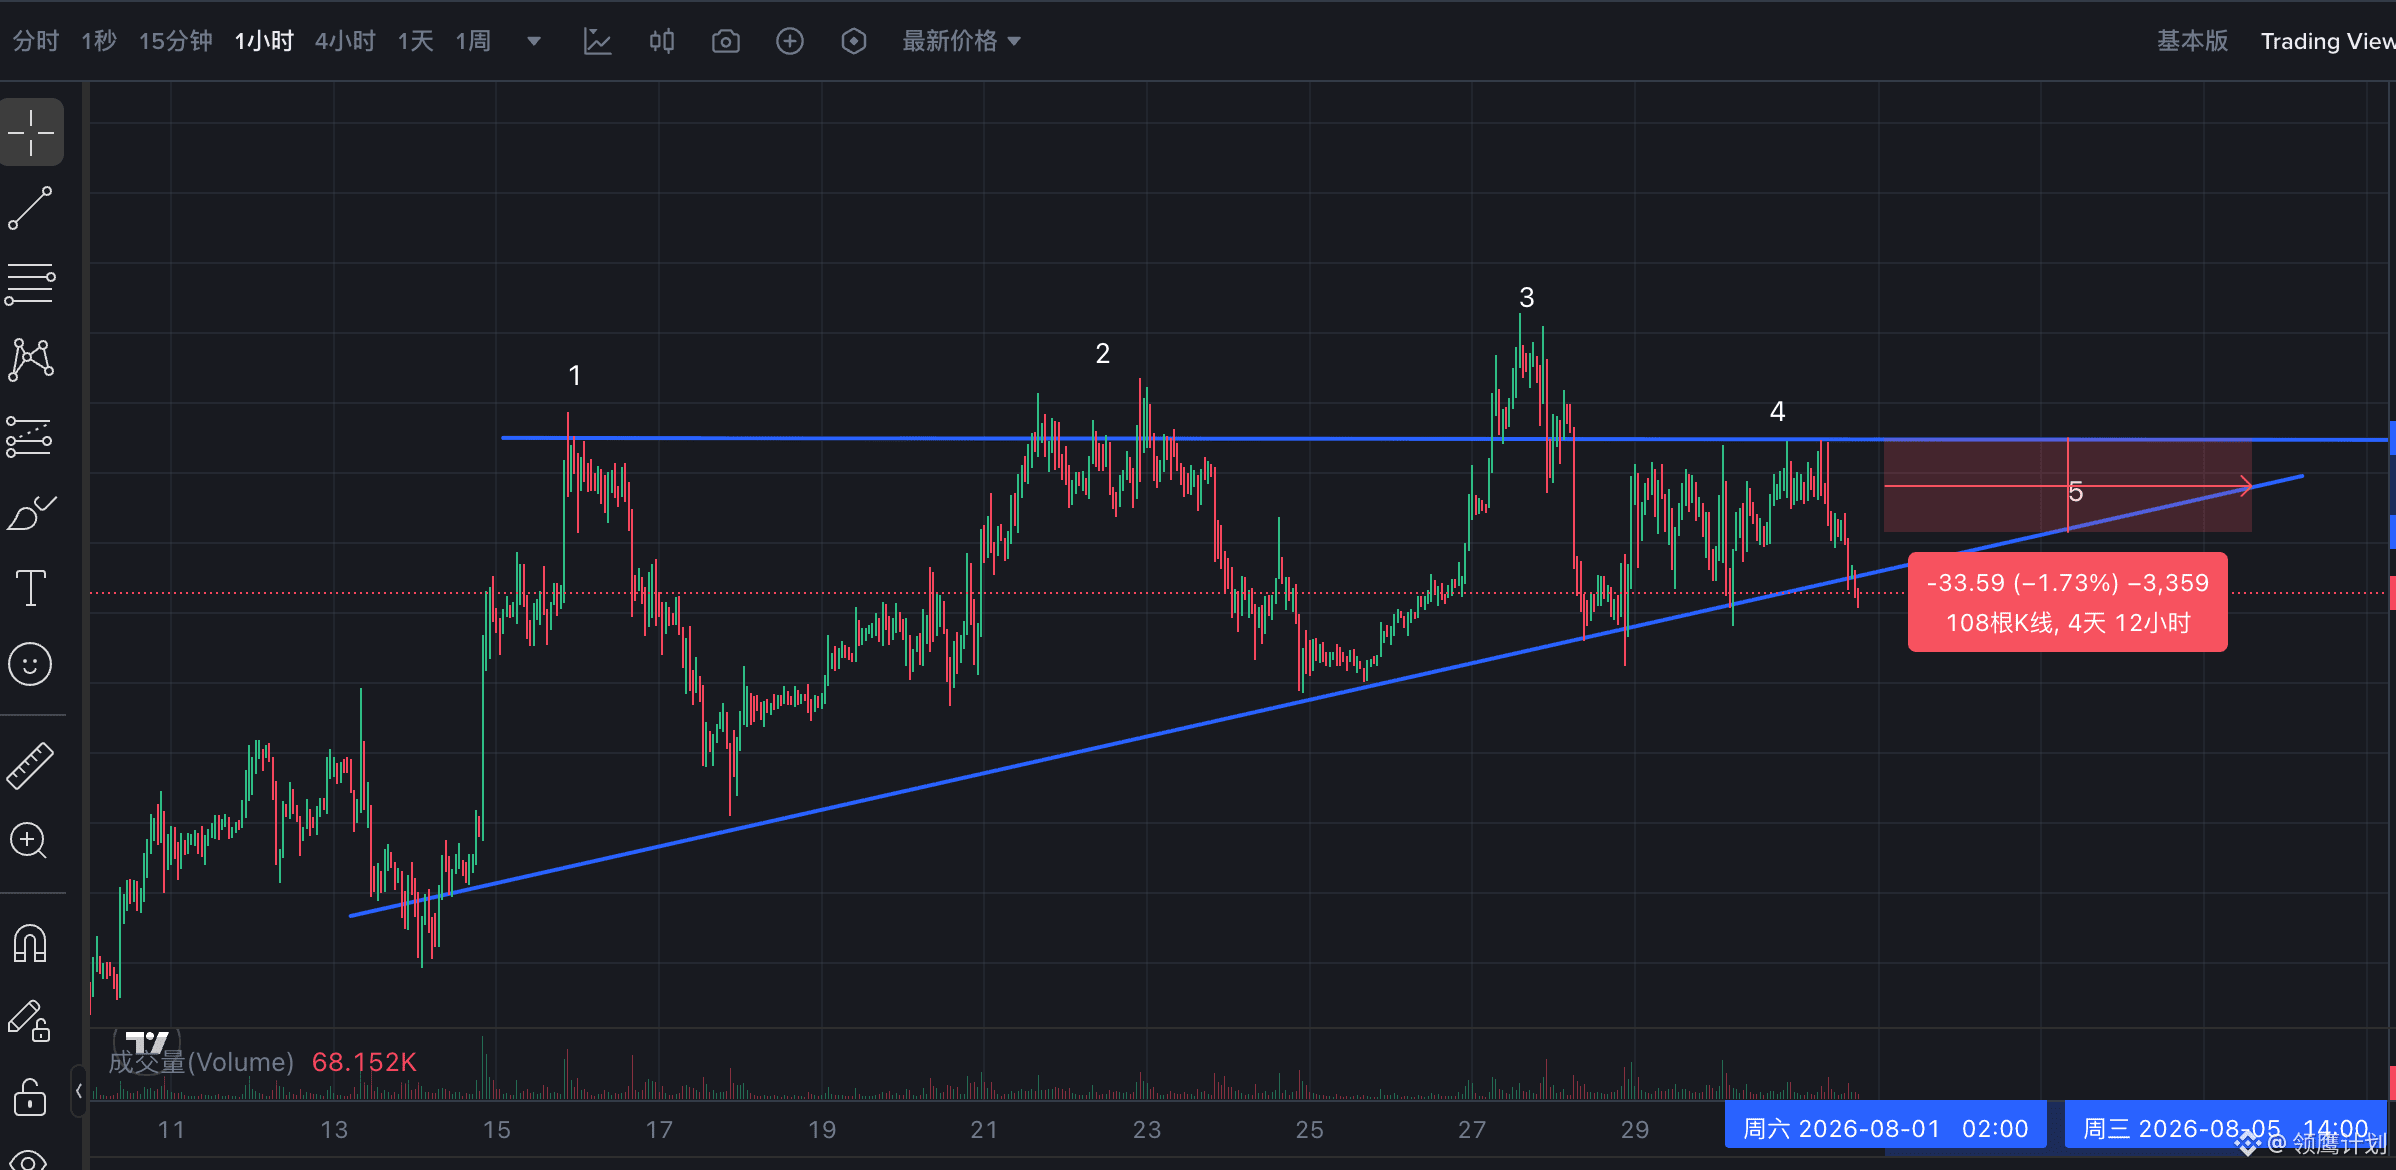
$ETH In the late stage of a triangle convergence
The overall situation at the major pressure level is quite good
The test at position 3 was not very good—it formed a small structure and lost a lot of points
If 4 has been tested multiple times below the pressure level, that’s a good piece of information
If the price directly takes off, beyond position 3, we need to look at how the convergence was behaving before takeoff
If it can continue converging at position 5, then that’s still a good signal—at that time, whether to participate will be decided based on momentum
#领鹰计划 #交易员 #突破
{future}(ETHUSDT)
$ETH In the late stage of a triangle convergence
The overall situation at the major pressure level is quite good
The test at position 3 was not very good—it formed a small structure and lost a lot of points
If 4 has been tested multiple times below the pressure level, that’s a good piece of information
If the price directly takes off, beyond position 3, we need to look at how the convergence was behaving before takeoff
If it can continue converging at position 5, then that’s still a good signal—at that time, whether to participate will be decided based on momentum
#领鹰计划 #交易员 #突破
The overall situation at the major pressure level is quite good
The test at position 3 was not very good—it formed a small structure and lost a lot of points
If 4 has been tested multiple times below the pressure level, that’s a good piece of information
If the price directly takes off, beyond position 3, we need to look at how the convergence was behaving before takeoff
If it can continue converging at position 5, then that’s still a good signal—at that time, whether to participate will be decided based on momentum
#领鹰计划 #交易员 #突破
323
·
--
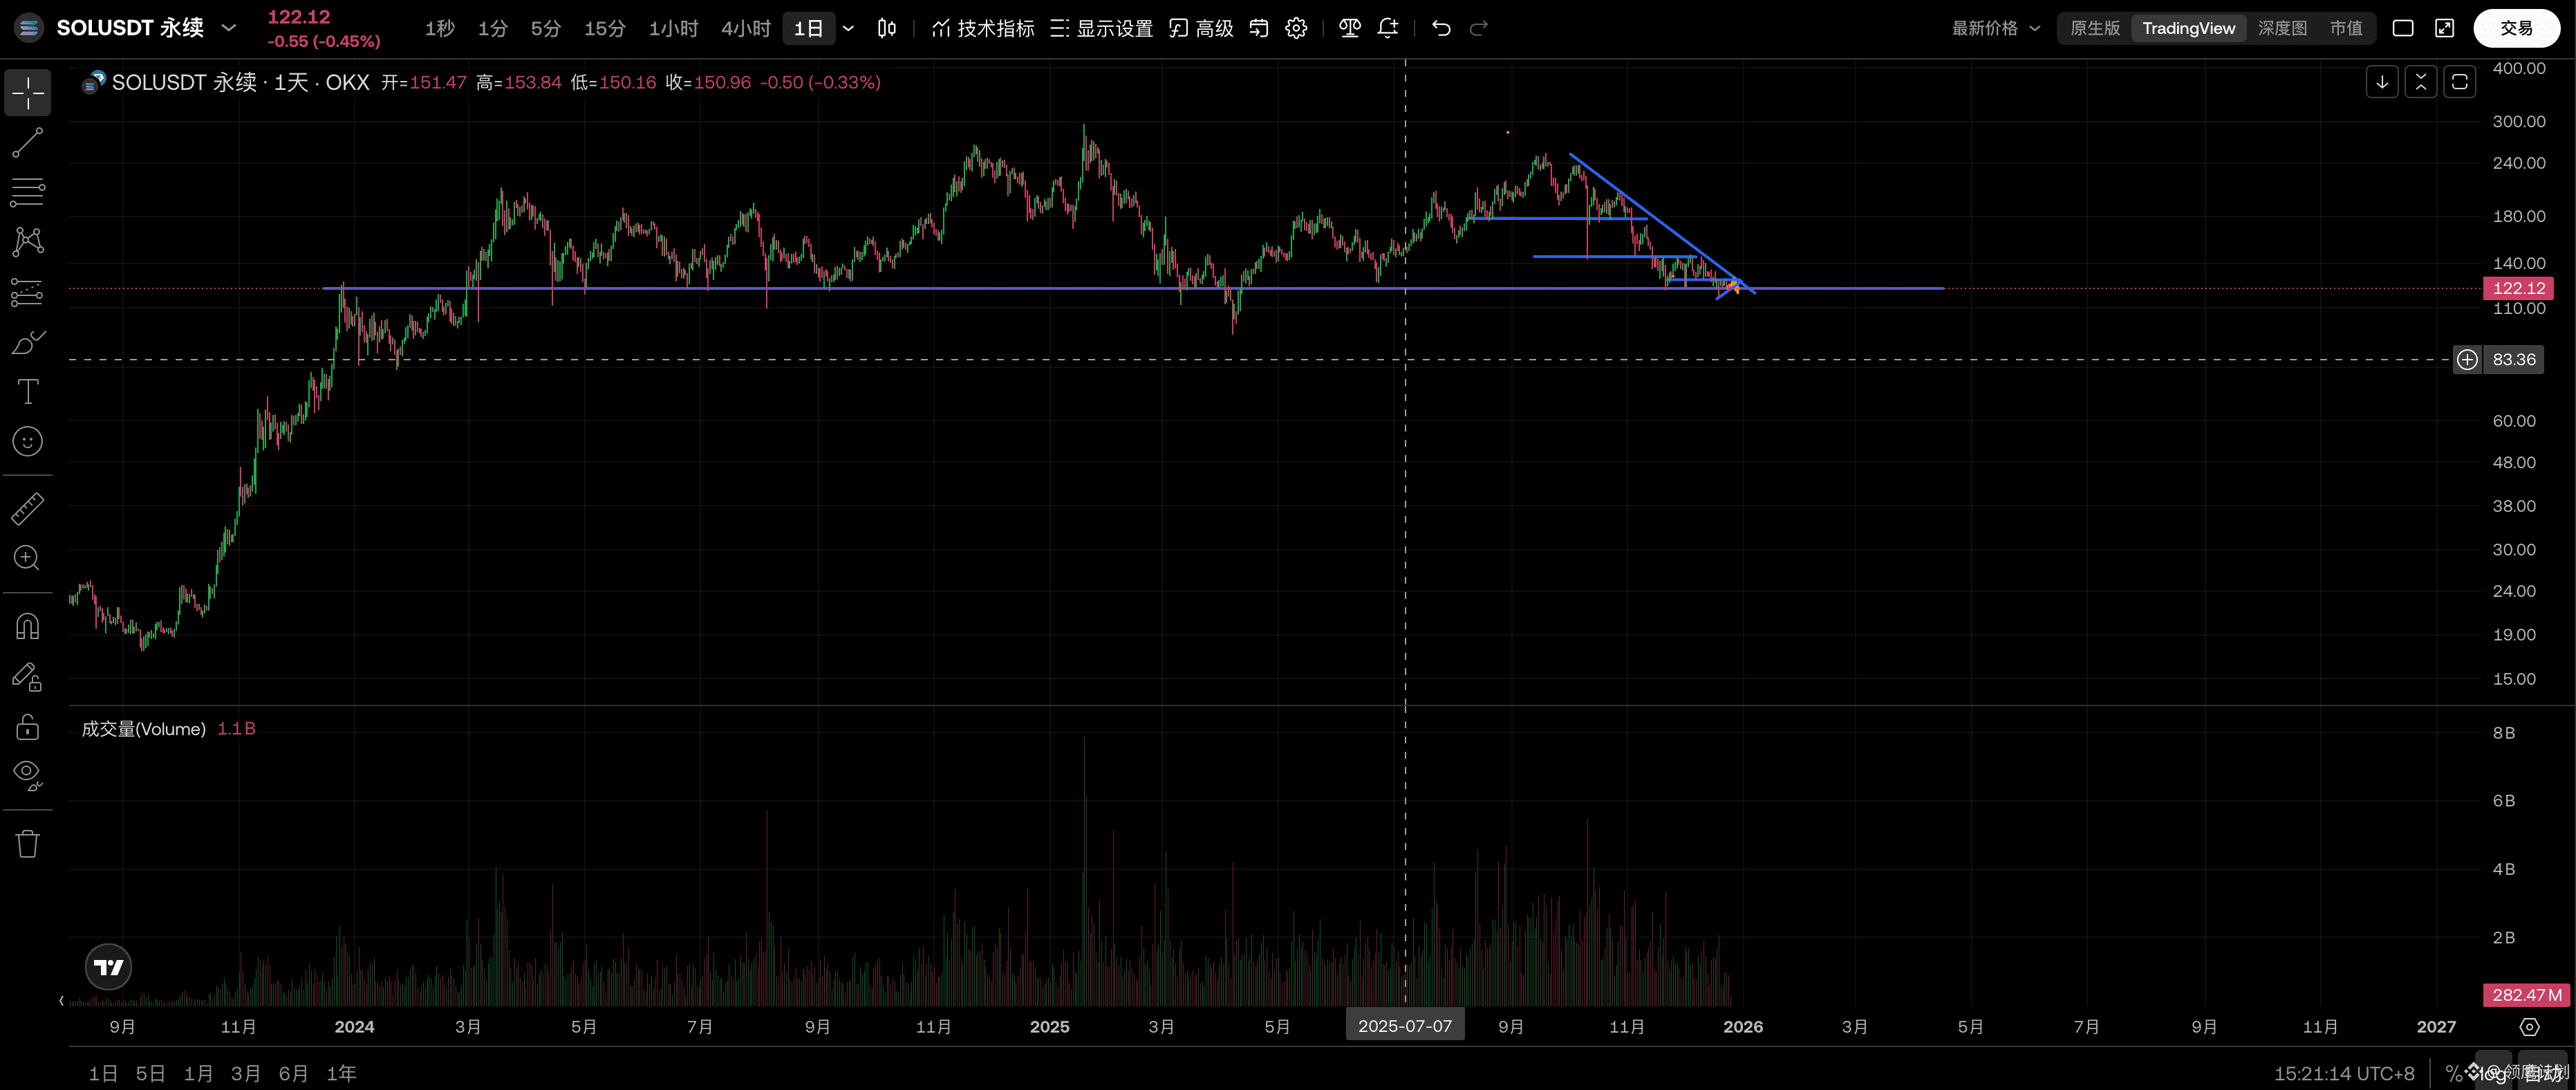
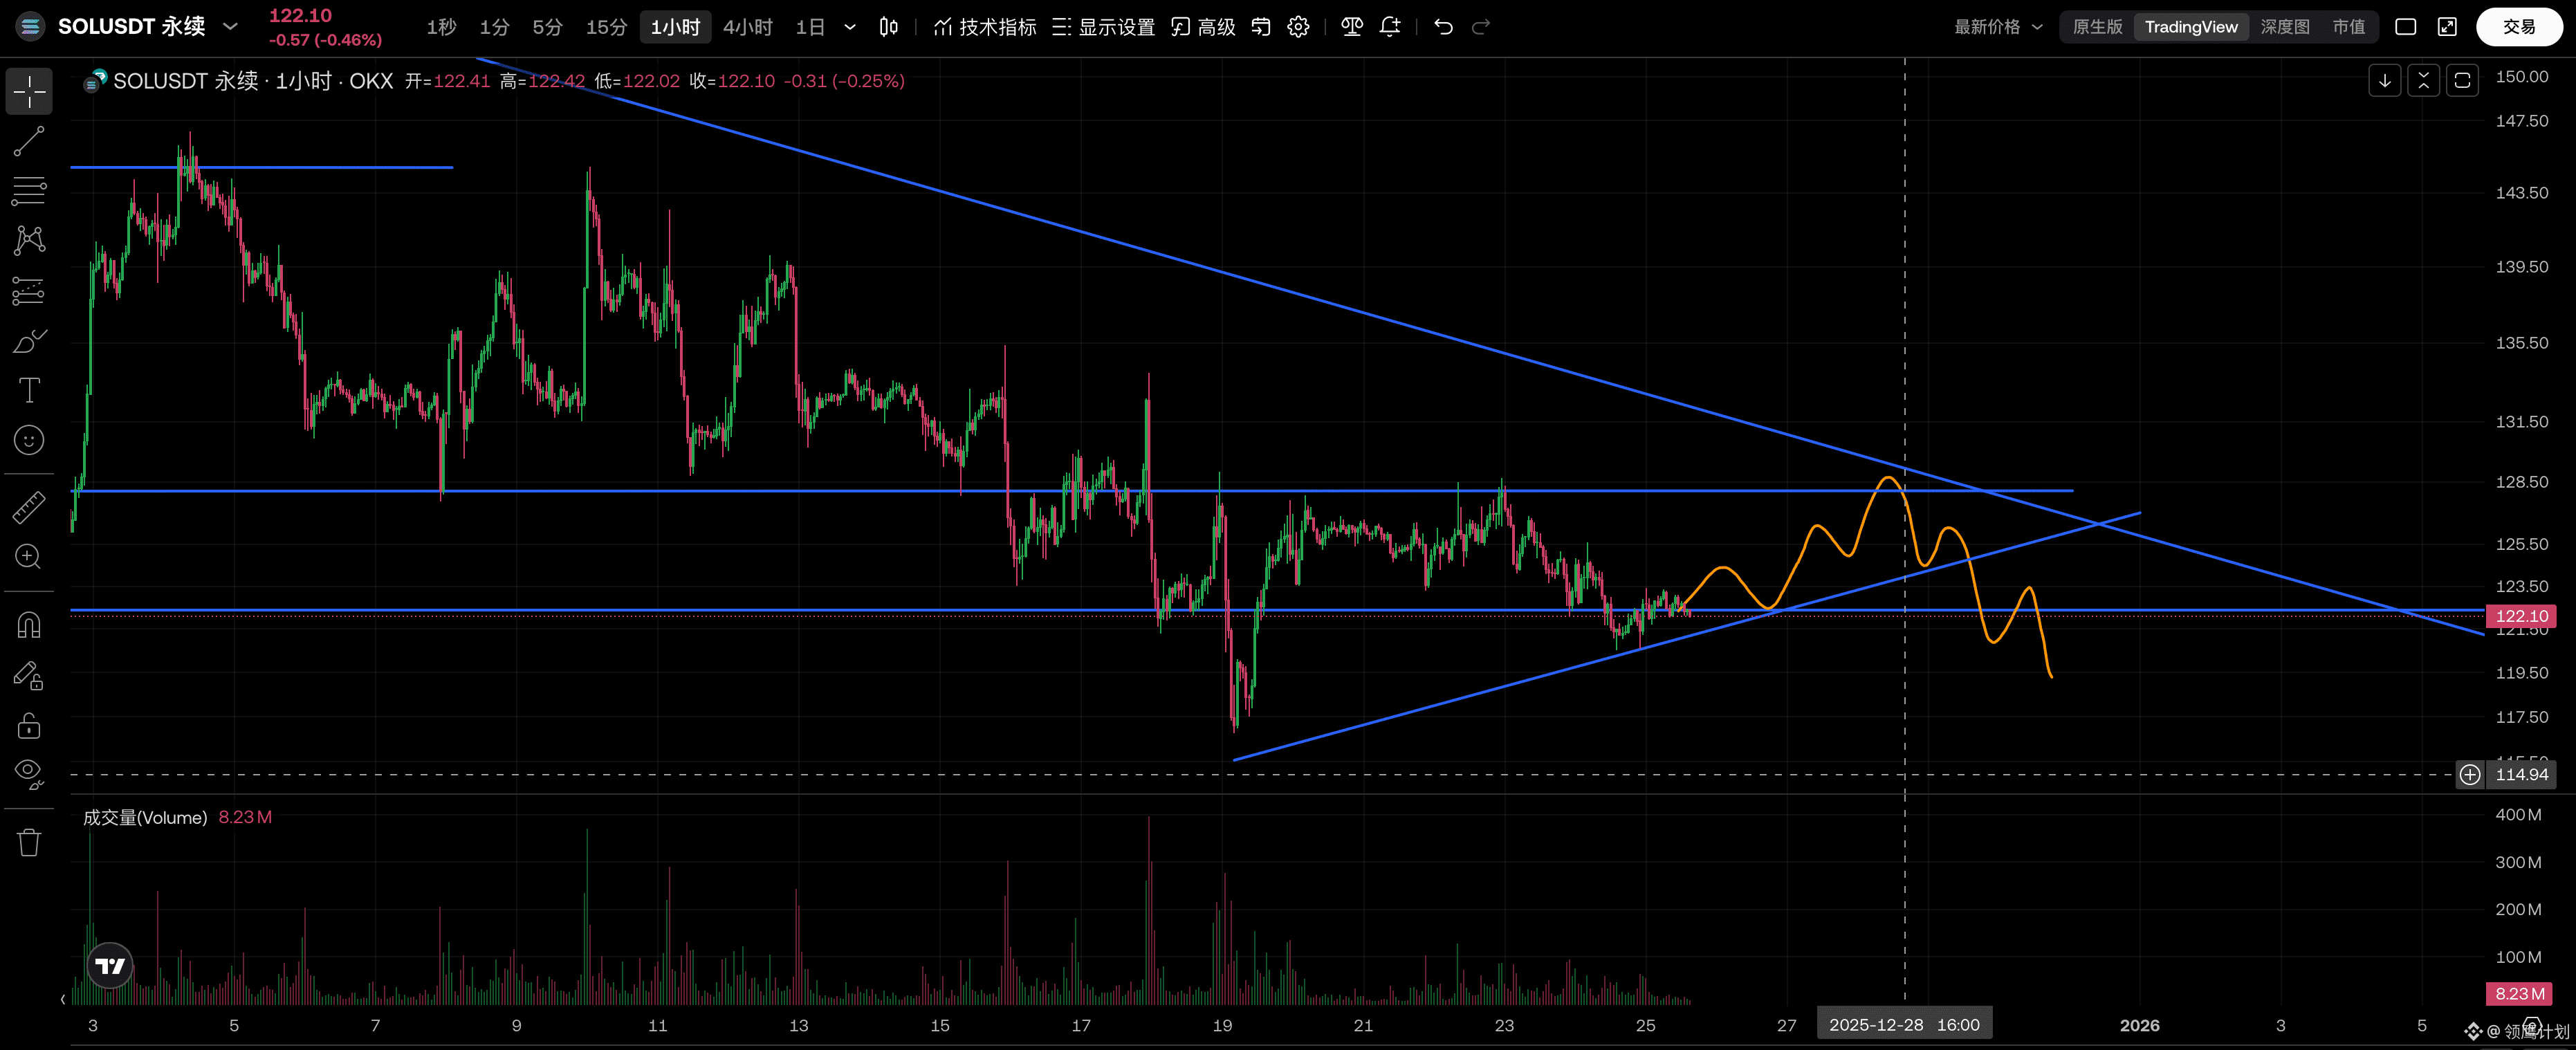
Opportunity at the support level of $SOL
The support level of 120 on the daily chart has been tested multiple times
The downtrend line is nearing its end
The market has also been oscillating in this range for a long time
If the price can test the upper resistance level again, combined with the downtrend line, and is still pushed down, one can consider entering for a short position
#交易员 #领鹰计划
{future}(SOLUSDT)
Opportunity at the support level of $SOL
The support level of 120 on the daily chart has been tested multiple times
The downtrend line is nearing its end
The market has also been oscillating in this range for a long time
If the price can test the upper resistance level again, combined with the downtrend line, and is still pushed down, one can consider entering for a short position
#交易员 #领鹰计划
The support level of 120 on the daily chart has been tested multiple times
The downtrend line is nearing its end
The market has also been oscillating in this range for a long time
If the price can test the upper resistance level again, combined with the downtrend line, and is still pushed down, one can consider entering for a short position
#交易员 #领鹰计划
687
·
--
Bullish
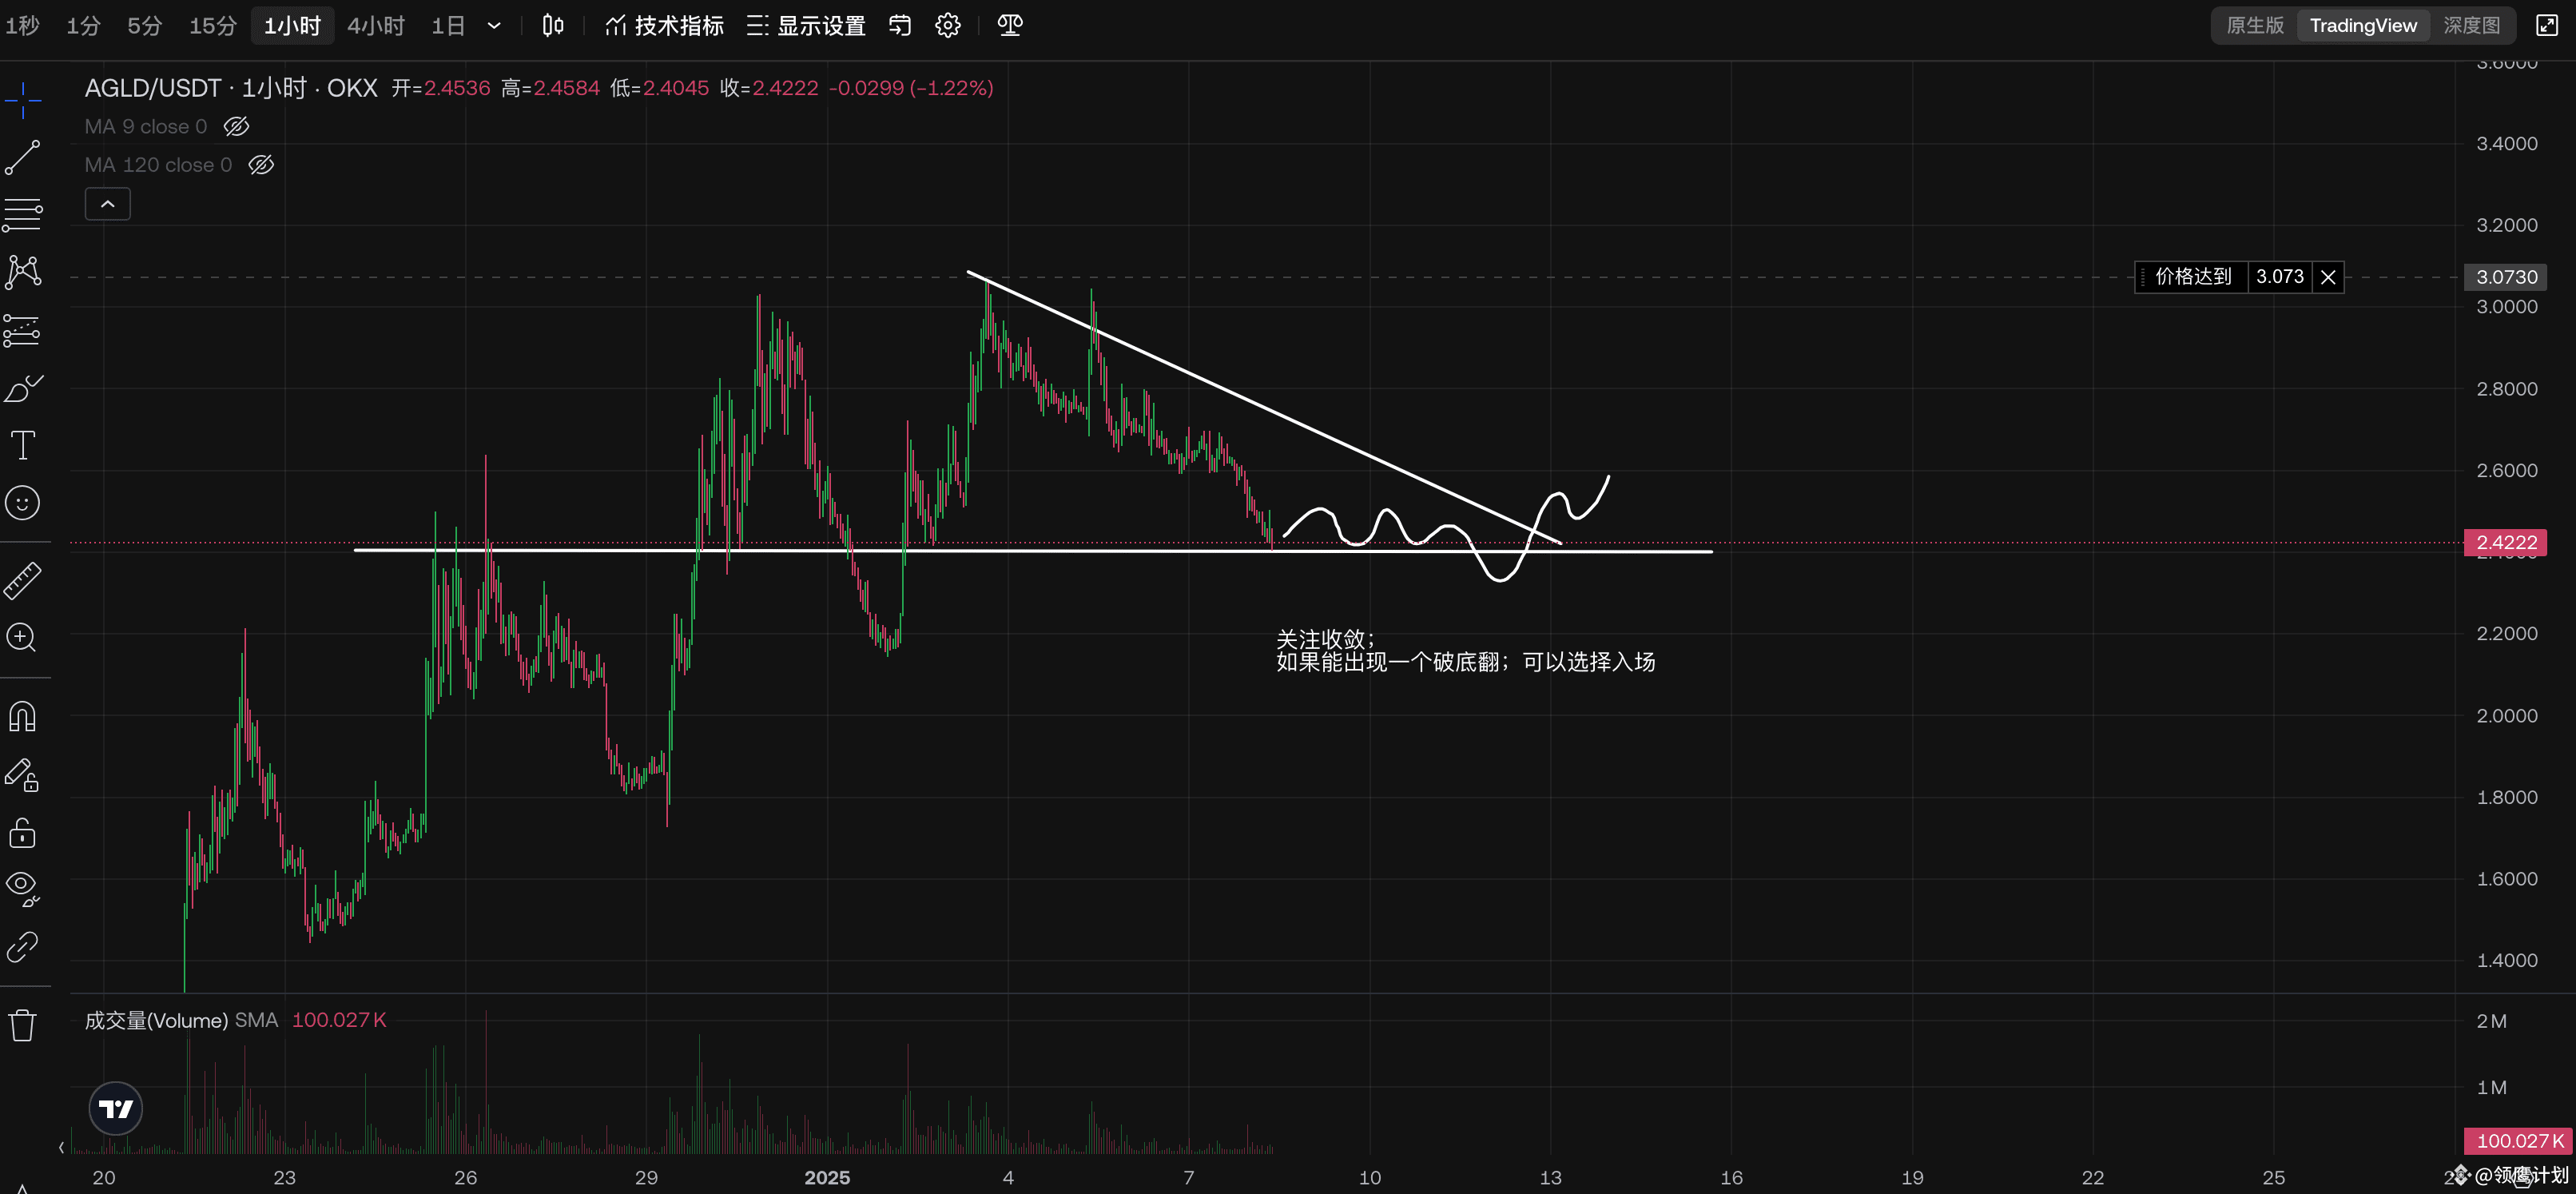
$AGLD Strong Stock Control Convergence Signal
This decline did not show a massive bearish candle, indicating that the 'dog庄' is reluctant to sell shares and is just testing the support line
You can pay attention to the subsequent convergence signals
{spot}(AGLDUSDT)
#领鹰计划
$AGLD Strong Stock Control Convergence Signal
This decline did not show a massive bearish candle, indicating that the 'dog庄' is reluctant to sell shares and is just testing the support line
You can pay attention to the subsequent convergence signals
#领鹰计划
This decline did not show a massive bearish candle, indicating that the 'dog庄' is reluctant to sell shares and is just testing the support line
You can pay attention to the subsequent convergence signals
#领鹰计划
10
1
2
2.9k
·
--
Bullish
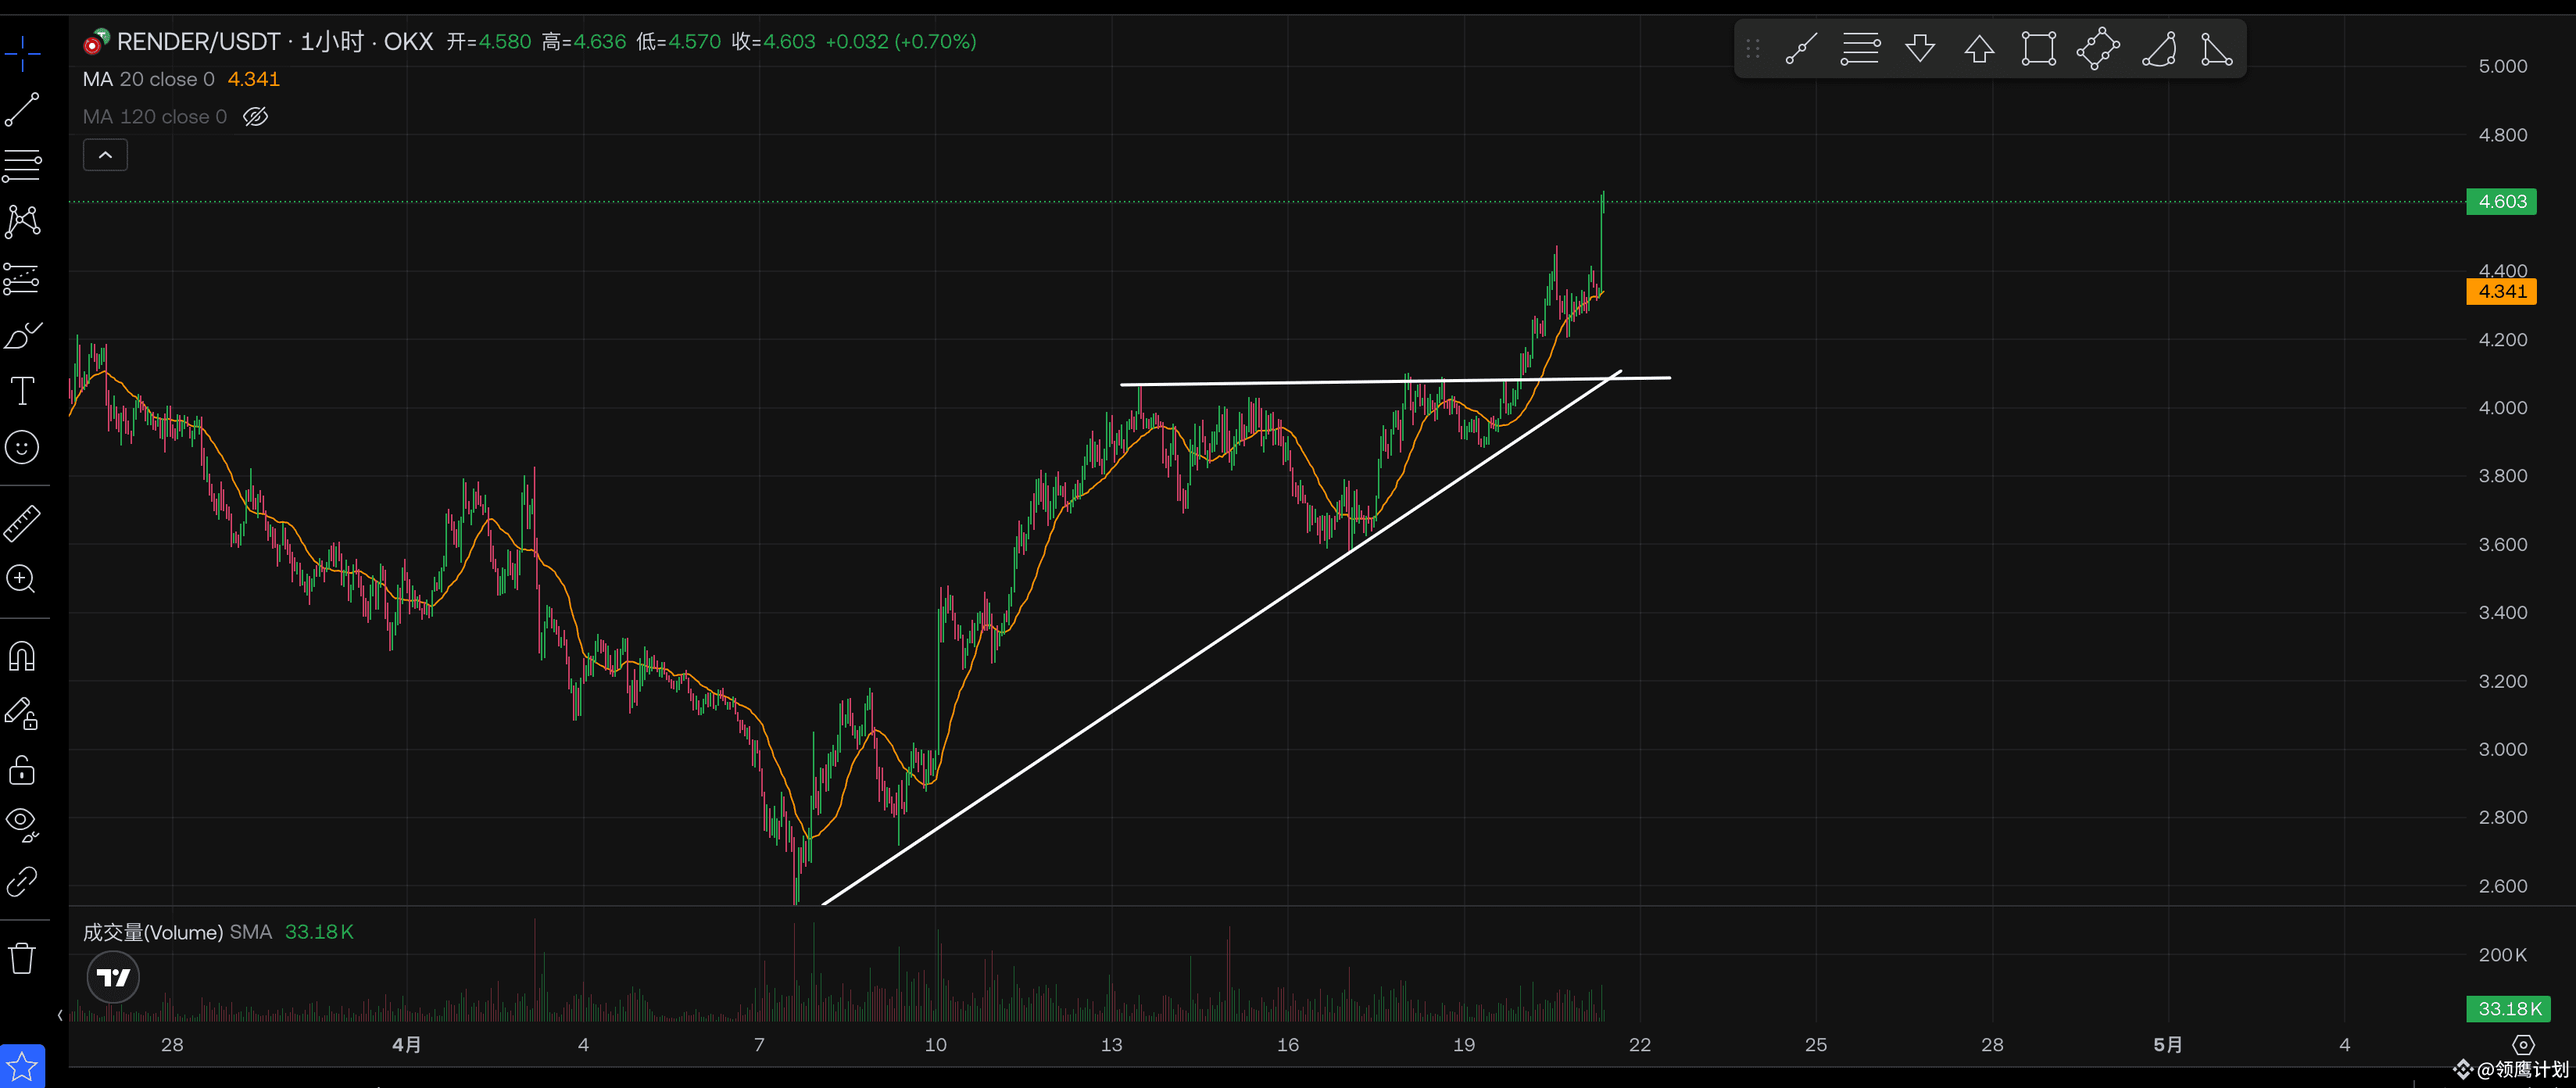
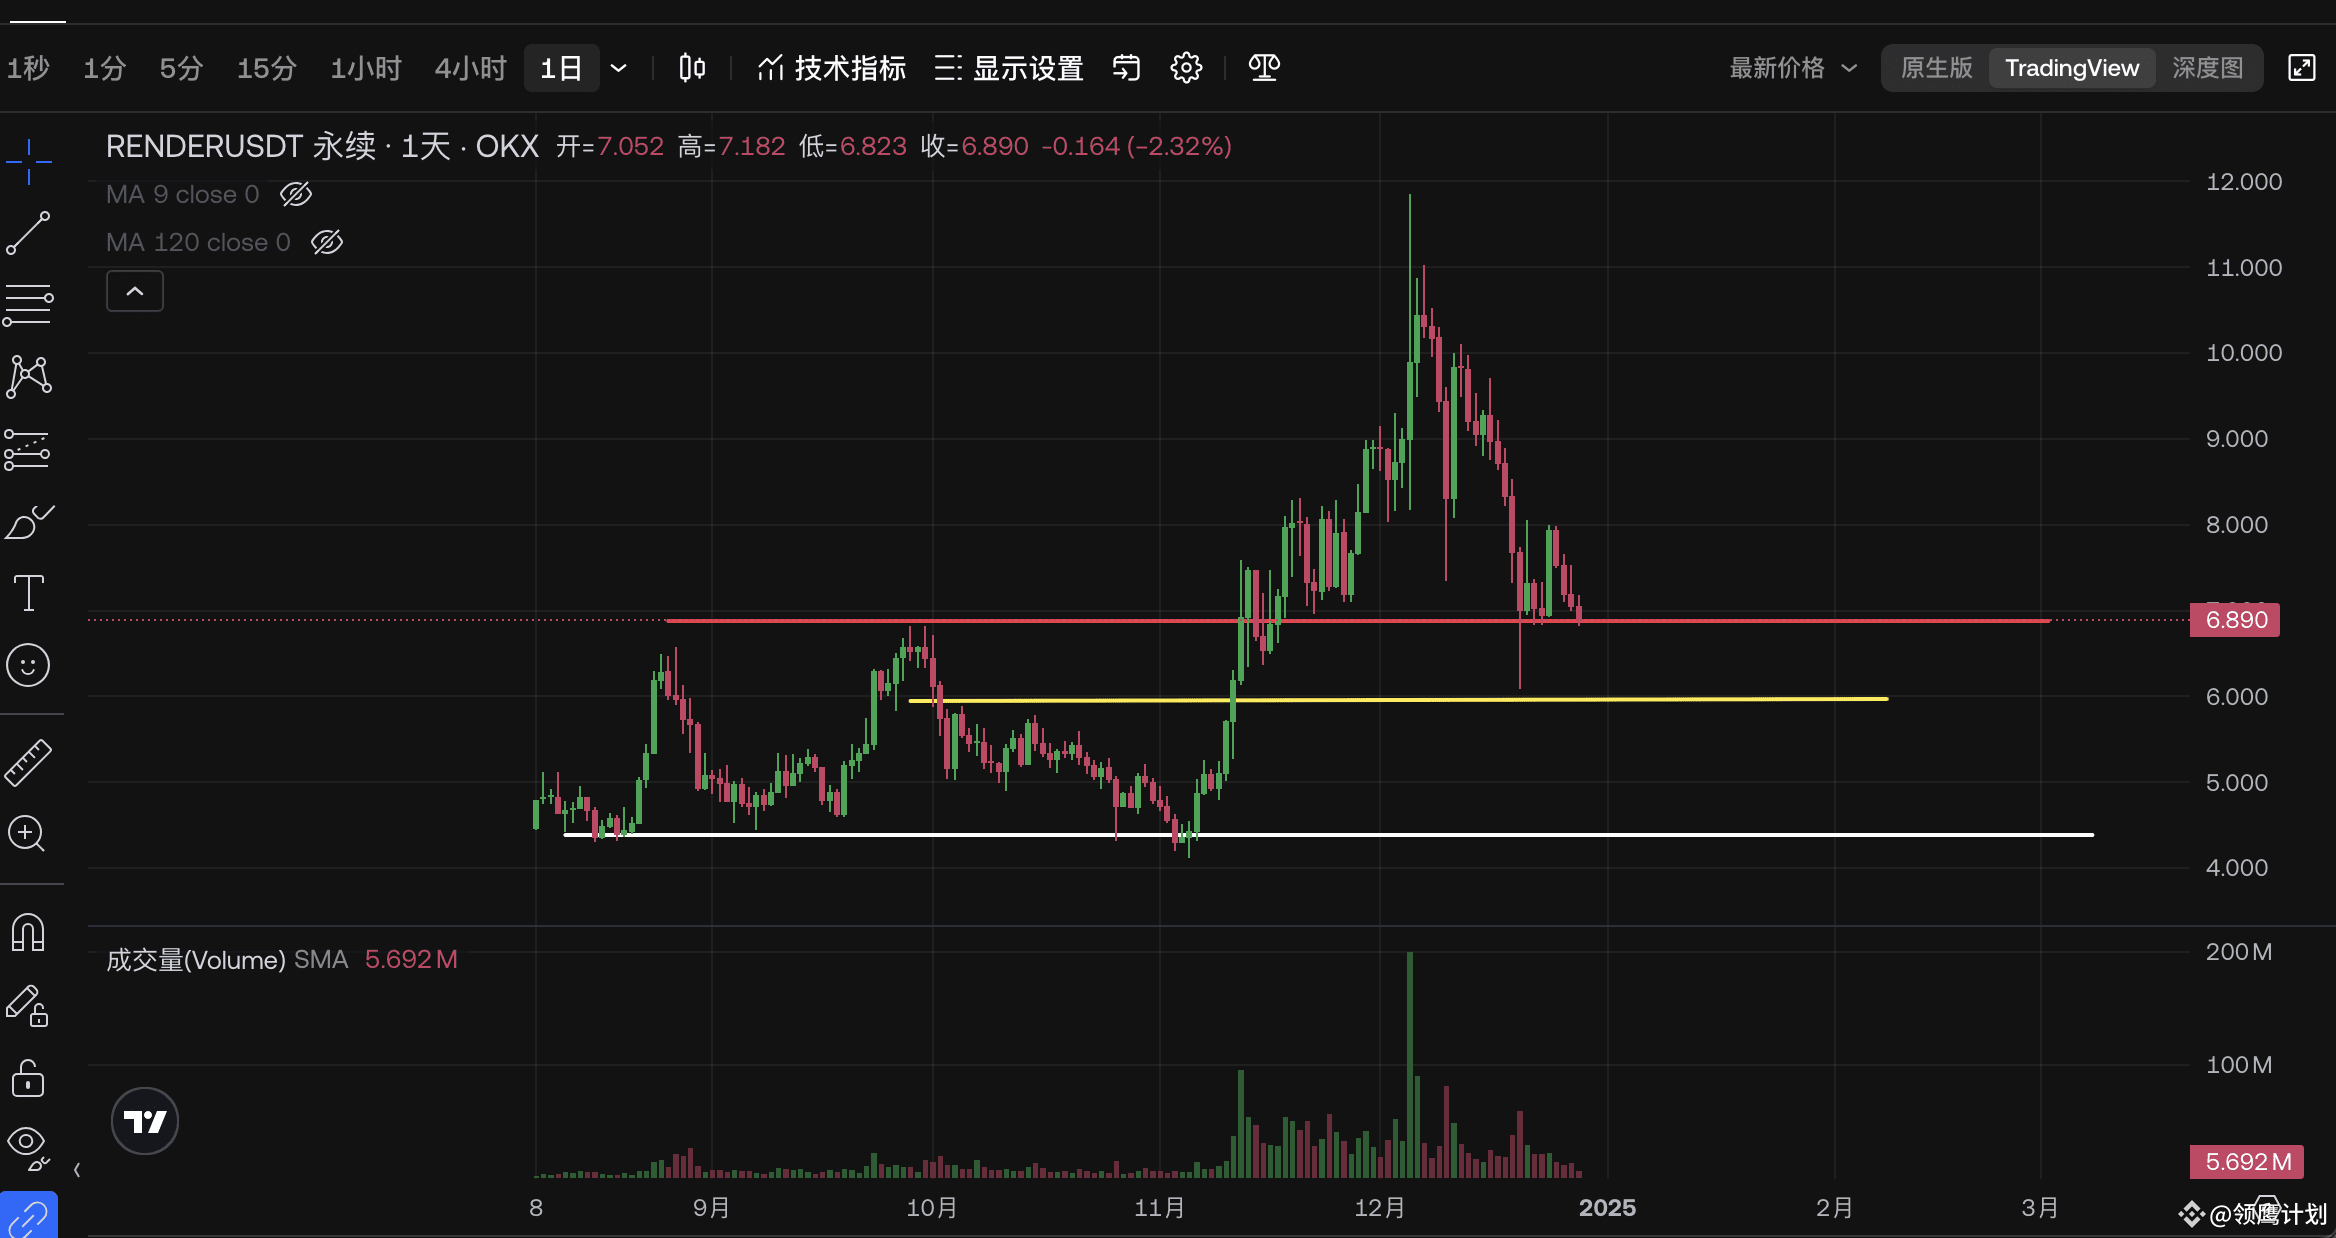
$RENDER Pullback to Key Level Ambush Layout
On the daily level, the price is shrinking back to the upper boundary of the previous box structure; this is a key support level;
My ambush plan is to enter a position at this level, and if it continues to drop, I will add to the position at 6 dollars.
Both of these levels are also key positions in the Fibonacci.
If the price continues to fall and breaks below the bottom white line at 4 dollars, then I will have to admit defeat and stop loss.
{spot}(RENDERUSDT)
#领鹰计划
$RENDER Pullback to Key Level Ambush Layout
On the daily level, the price is shrinking back to the upper boundary of the previous box structure; this is a key support level;
My ambush plan is to enter a position at this level, and if it continues to drop, I will add to the position at 6 dollars.
Both of these levels are also key positions in the Fibonacci.
If the price continues to fall and breaks below the bottom white line at 4 dollars, then I will have to admit defeat and stop loss.
#领鹰计划
On the daily level, the price is shrinking back to the upper boundary of the previous box structure; this is a key support level;
My ambush plan is to enter a position at this level, and if it continues to drop, I will add to the position at 6 dollars.
Both of these levels are also key positions in the Fibonacci.
If the price continues to fall and breaks below the bottom white line at 4 dollars, then I will have to admit defeat and stop loss.
#领鹰计划
221
·
--
Bullish
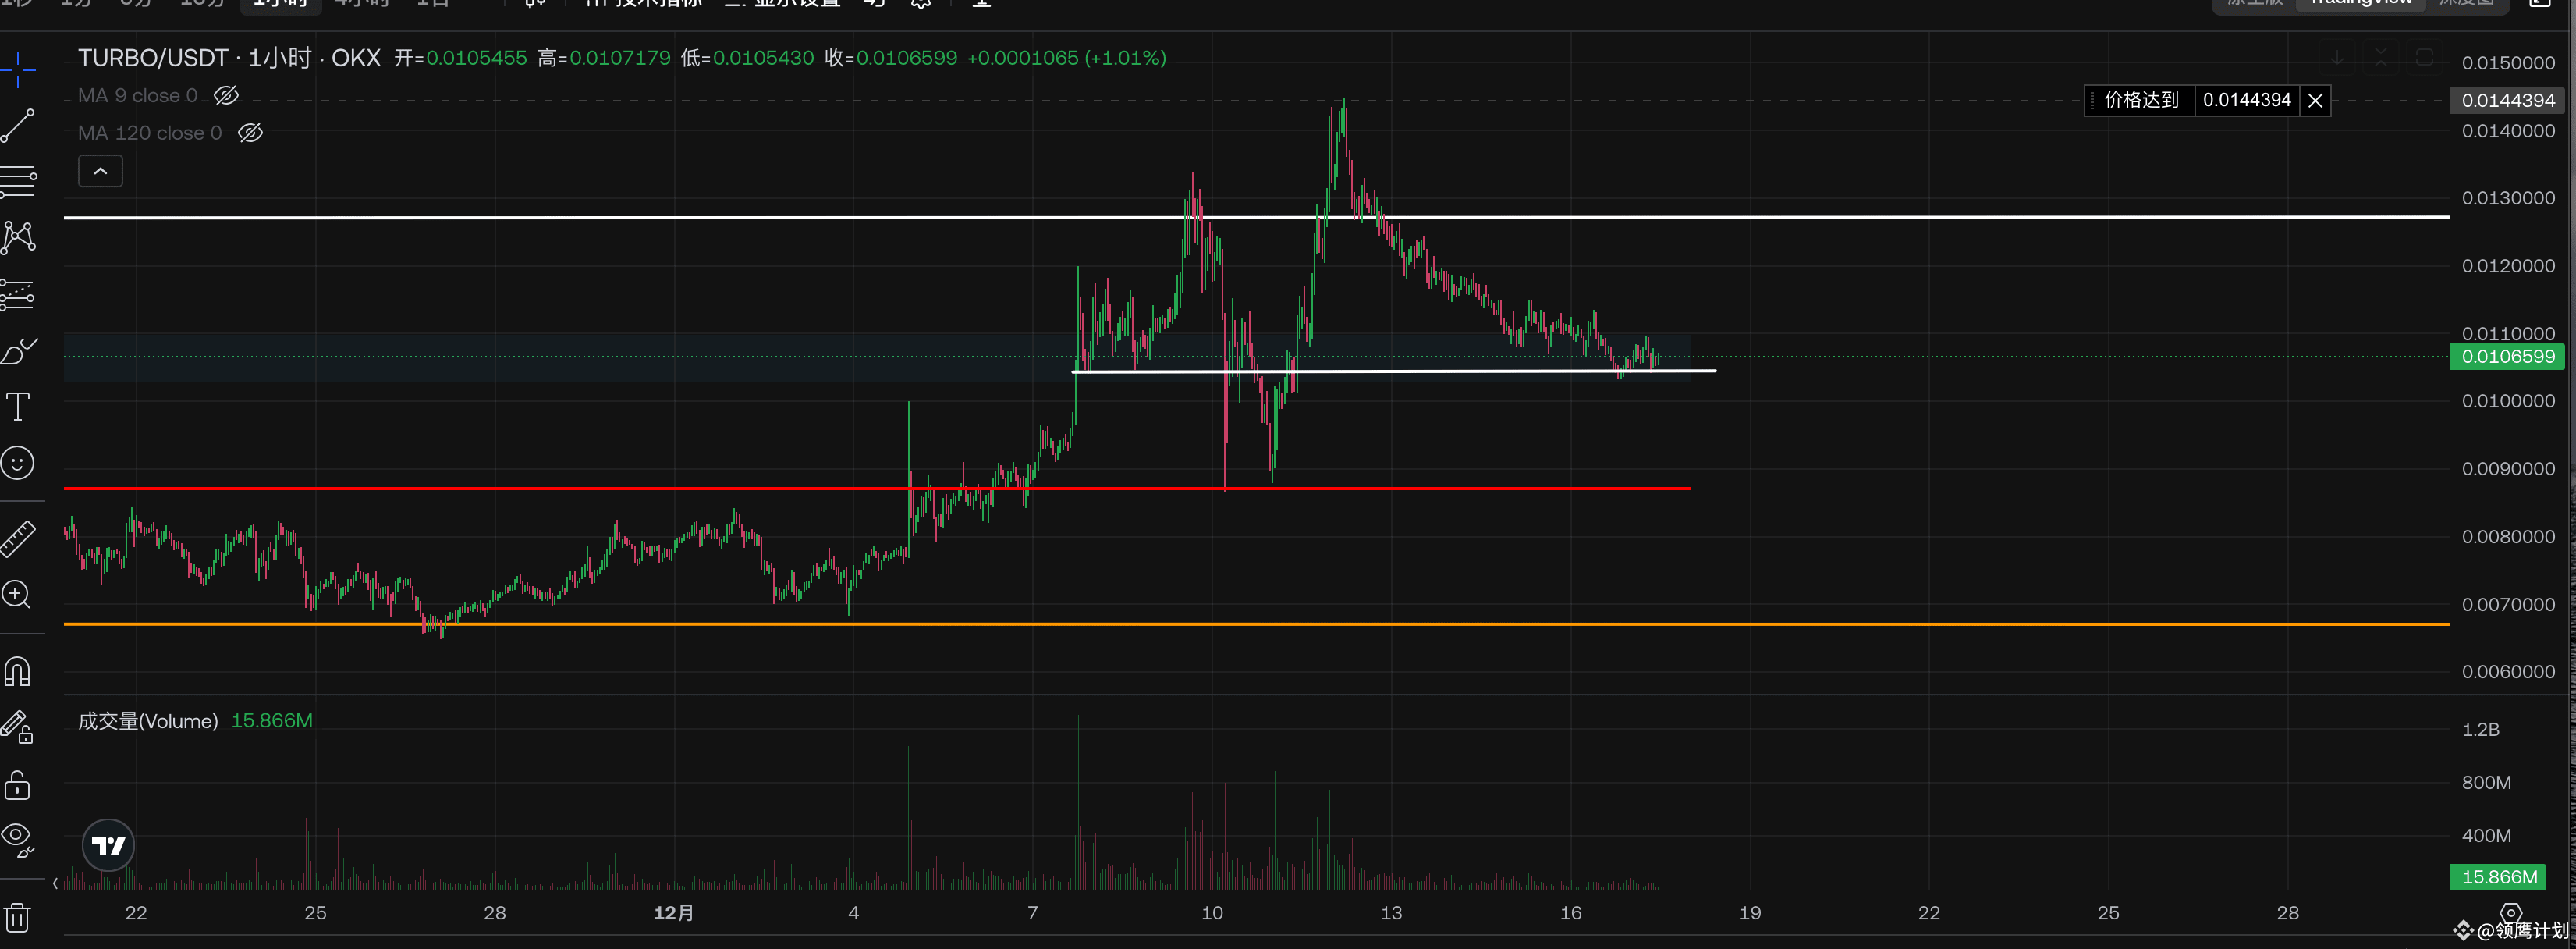
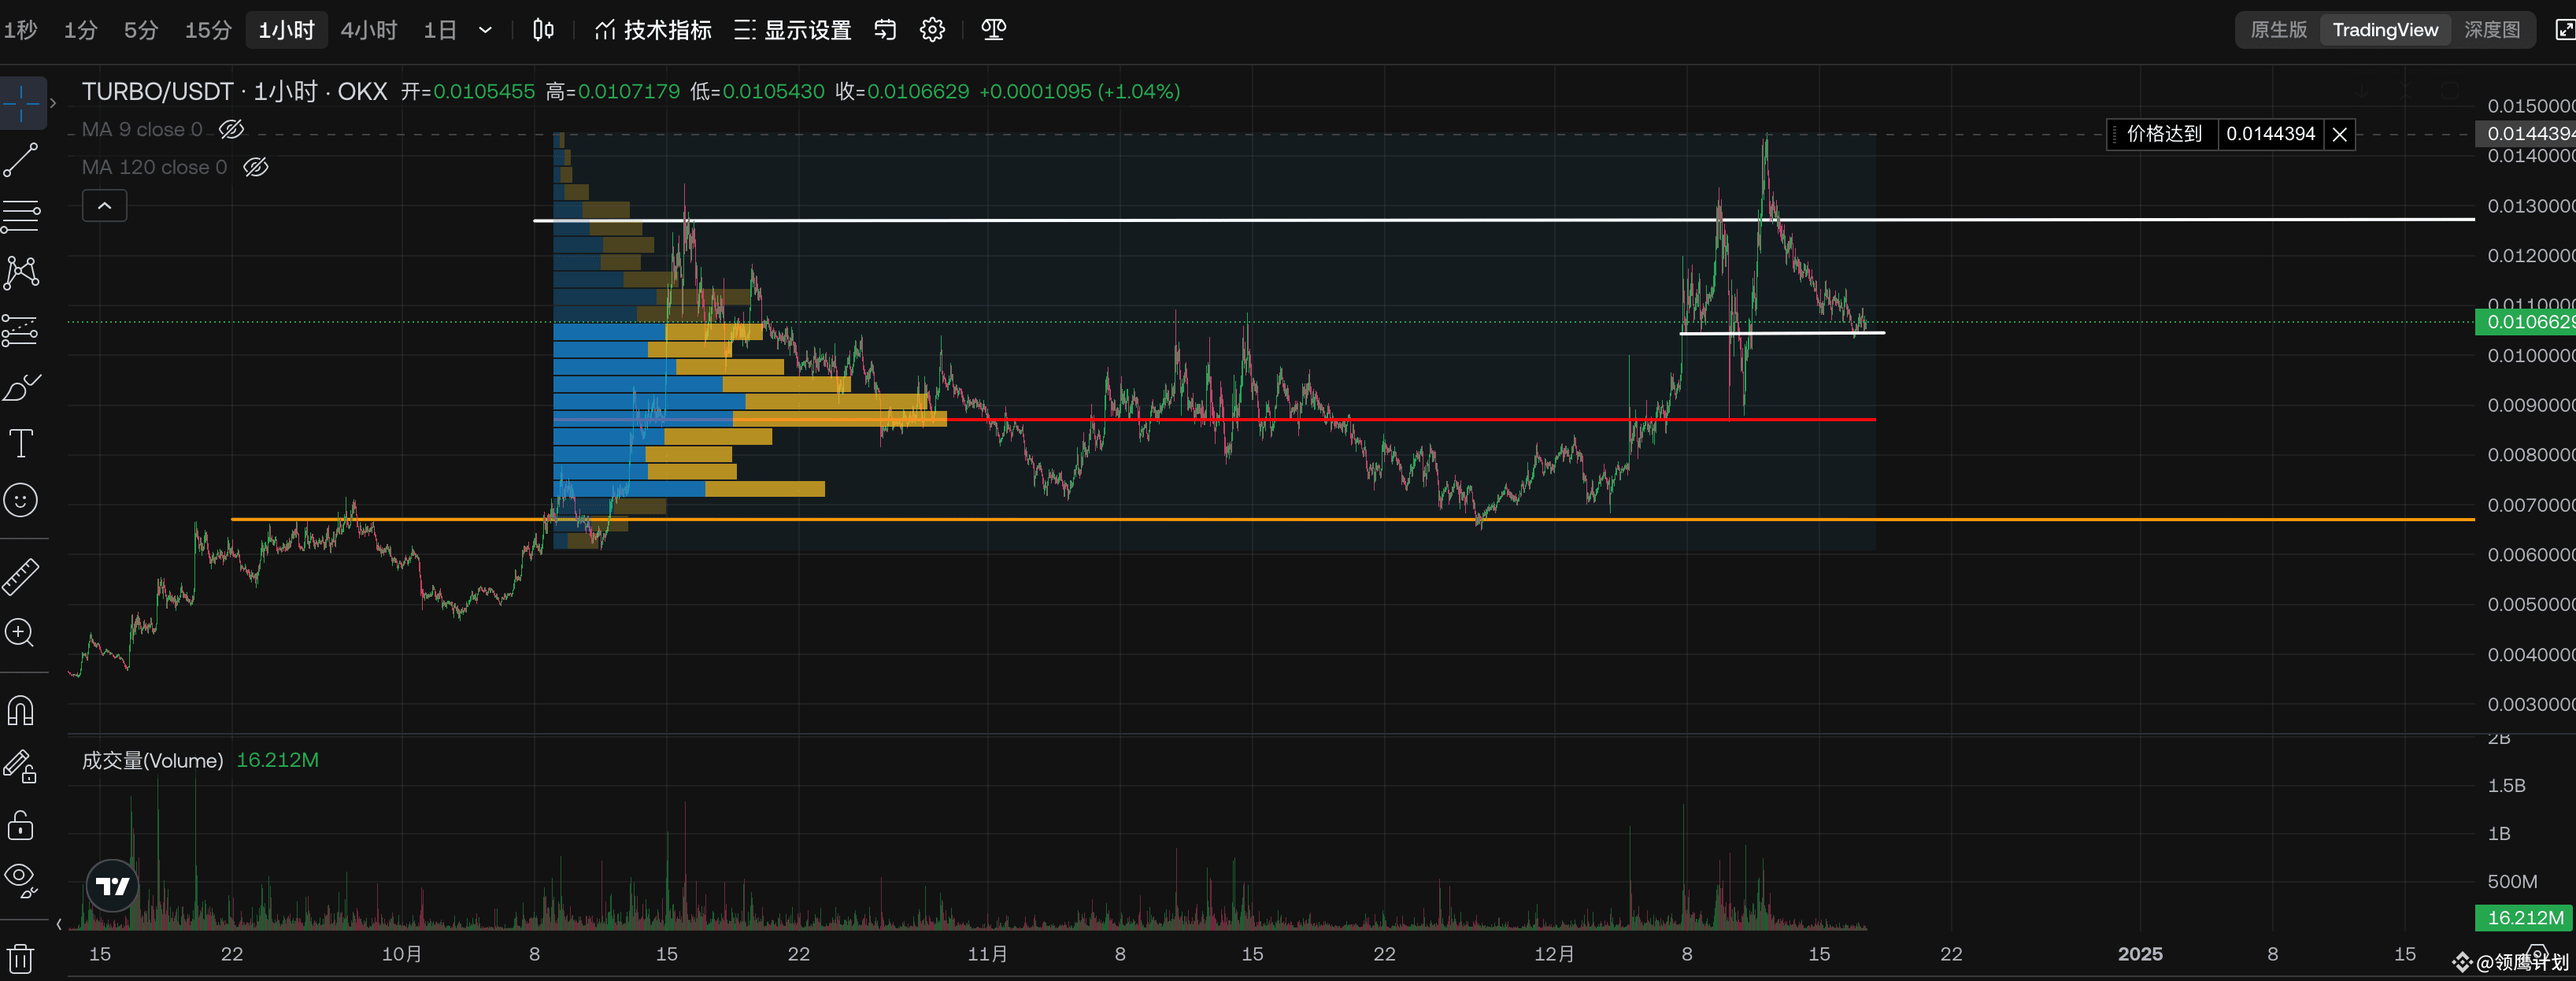
$TURBO volume contraction; make a plan
After the last crash, the structure has repaired and started to contract and pull back, currently pulling back to the middle position;
There has been no significant participation; it is highly likely that this is a one-time drop, just waiting to see the actions of the main force at this position, we just need to prepare our response plan.
The red position at the bottom is the area with the most concentrated trading volume in this structure; this position has also undergone two tests previously, showing strong buying volume.
1. No more pullbacks, directly increase volume and start moving up; in this case, make a top breakthrough.
2. Test downwards again, likely to succeed at the bottom support level, and then after the second test, move upwards; the situation can be a second test, or place orders at the bottom and wait for execution.
3. Break through this key support level, once again entering the washout period; in this case, adjust the stop loss, if not stopping the loss, then just put it aside and not watch, it will take a long time to repair the structure.
#领鹰计划
{spot}(TURBOUSDT)
$TURBO volume contraction; make a plan
After the last crash, the structure has repaired and started to contract and pull back, currently pulling back to the middle position;
There has been no significant participation; it is highly likely that this is a one-time drop, just waiting to see the actions of the main force at this position, we just need to prepare our response plan.
The red position at the bottom is the area with the most concentrated trading volume in this structure; this position has also undergone two tests previously, showing strong buying volume.
1. No more pullbacks, directly increase volume and start moving up; in this case, make a top breakthrough.
2. Test downwards again, likely to succeed at the bottom support level, and then after the second test, move upwards; the situation can be a second test, or place orders at the bottom and wait for execution.
3. Break through this key support level, once again entering the washout period; in this case, adjust the stop loss, if not stopping the loss, then just put it aside and not watch, it will take a long time to repair the structure.
#领鹰计划
After the last crash, the structure has repaired and started to contract and pull back, currently pulling back to the middle position;
There has been no significant participation; it is highly likely that this is a one-time drop, just waiting to see the actions of the main force at this position, we just need to prepare our response plan.
The red position at the bottom is the area with the most concentrated trading volume in this structure; this position has also undergone two tests previously, showing strong buying volume.
1. No more pullbacks, directly increase volume and start moving up; in this case, make a top breakthrough.
2. Test downwards again, likely to succeed at the bottom support level, and then after the second test, move upwards; the situation can be a second test, or place orders at the bottom and wait for execution.
3. Break through this key support level, once again entering the washout period; in this case, adjust the stop loss, if not stopping the loss, then just put it aside and not watch, it will take a long time to repair the structure.
#领鹰计划
1
1.1k
·
--
Bullish
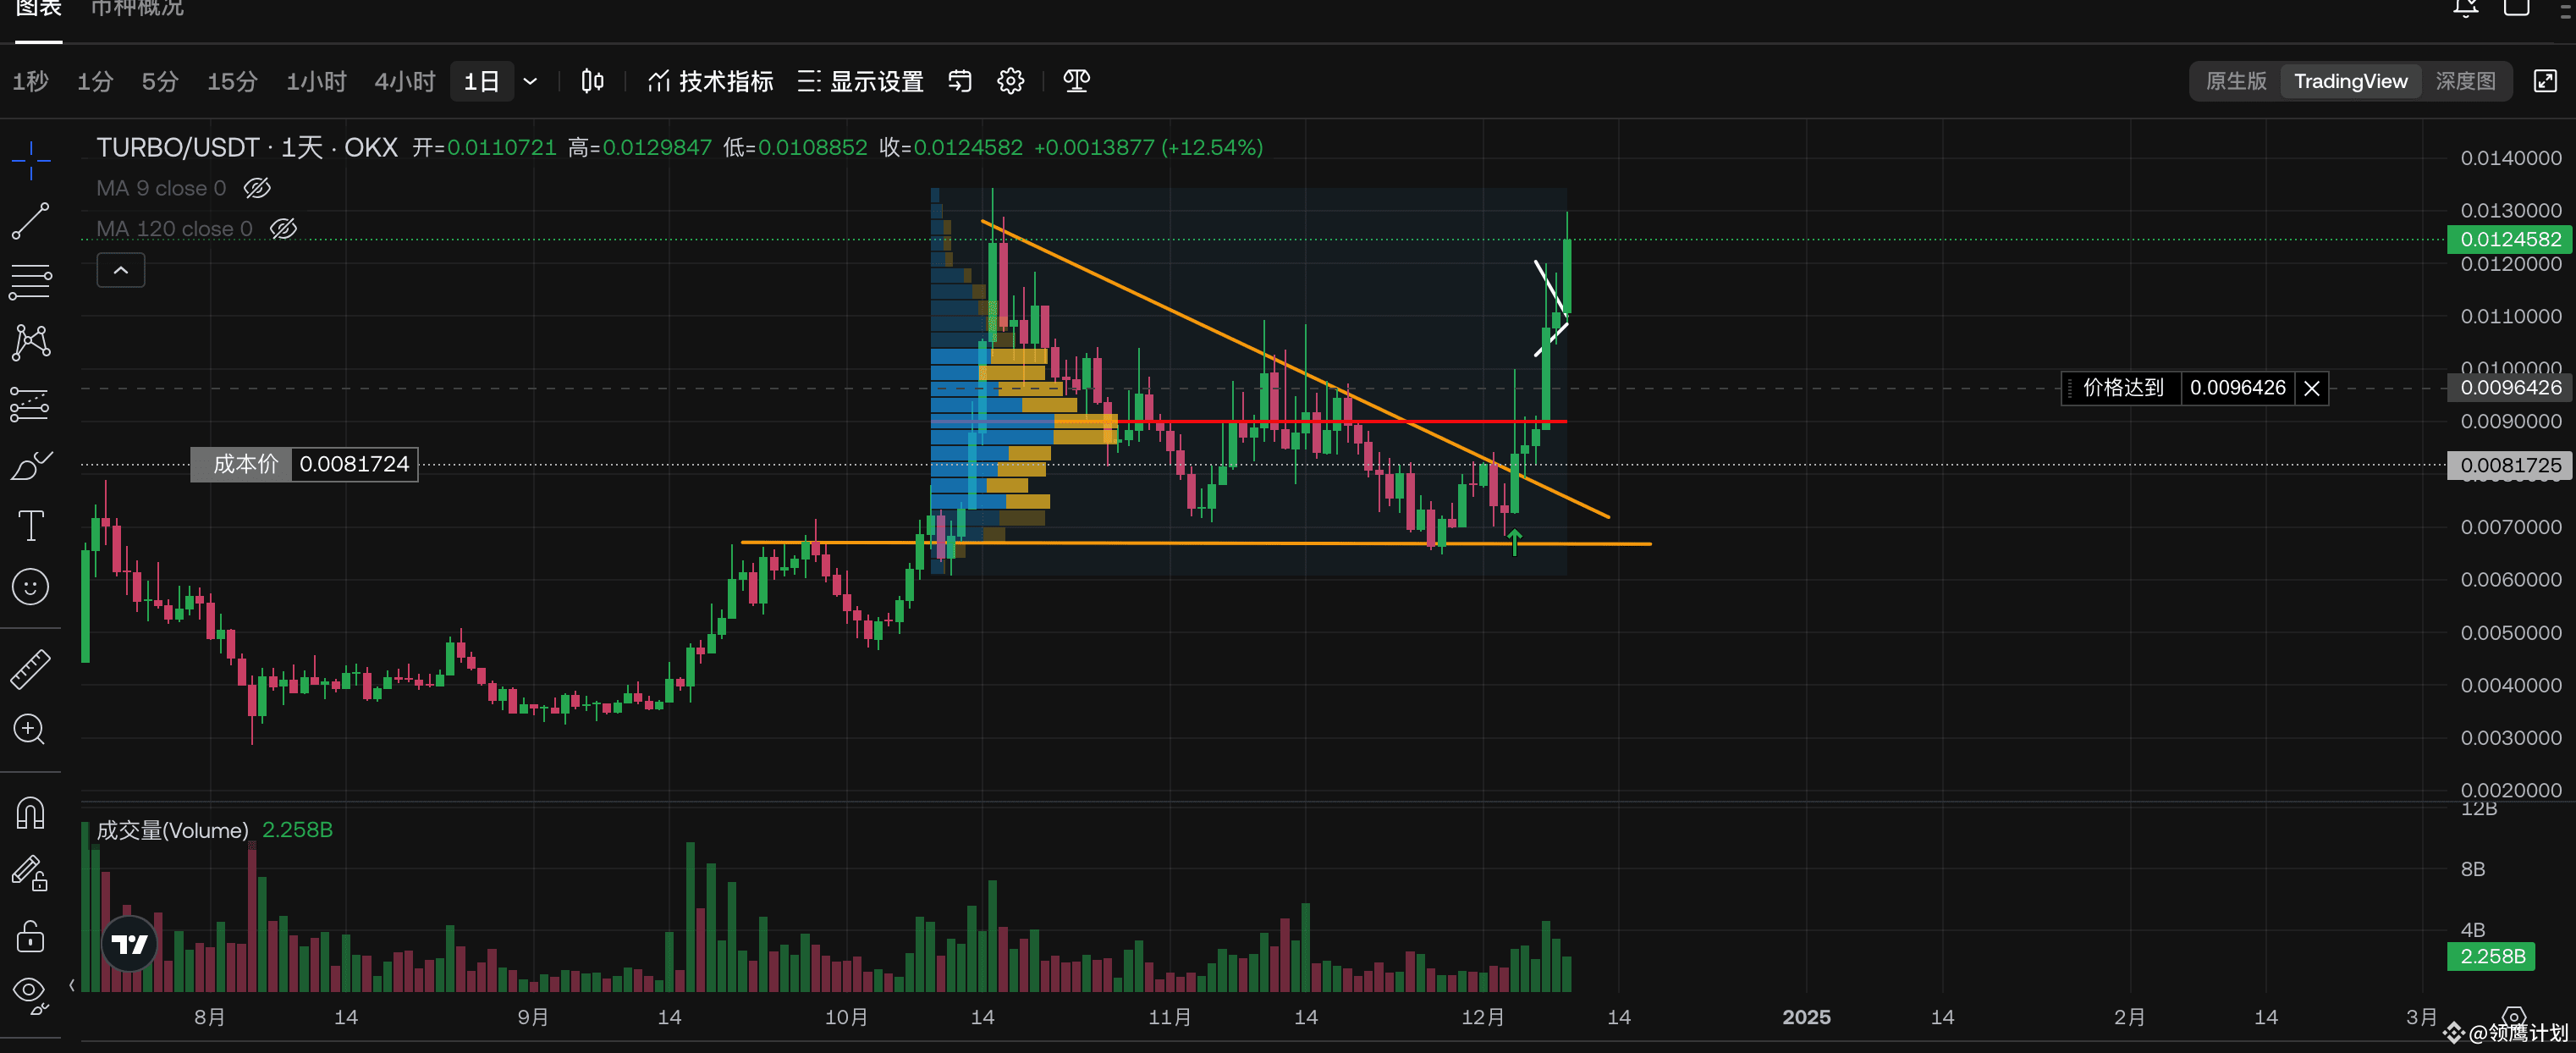
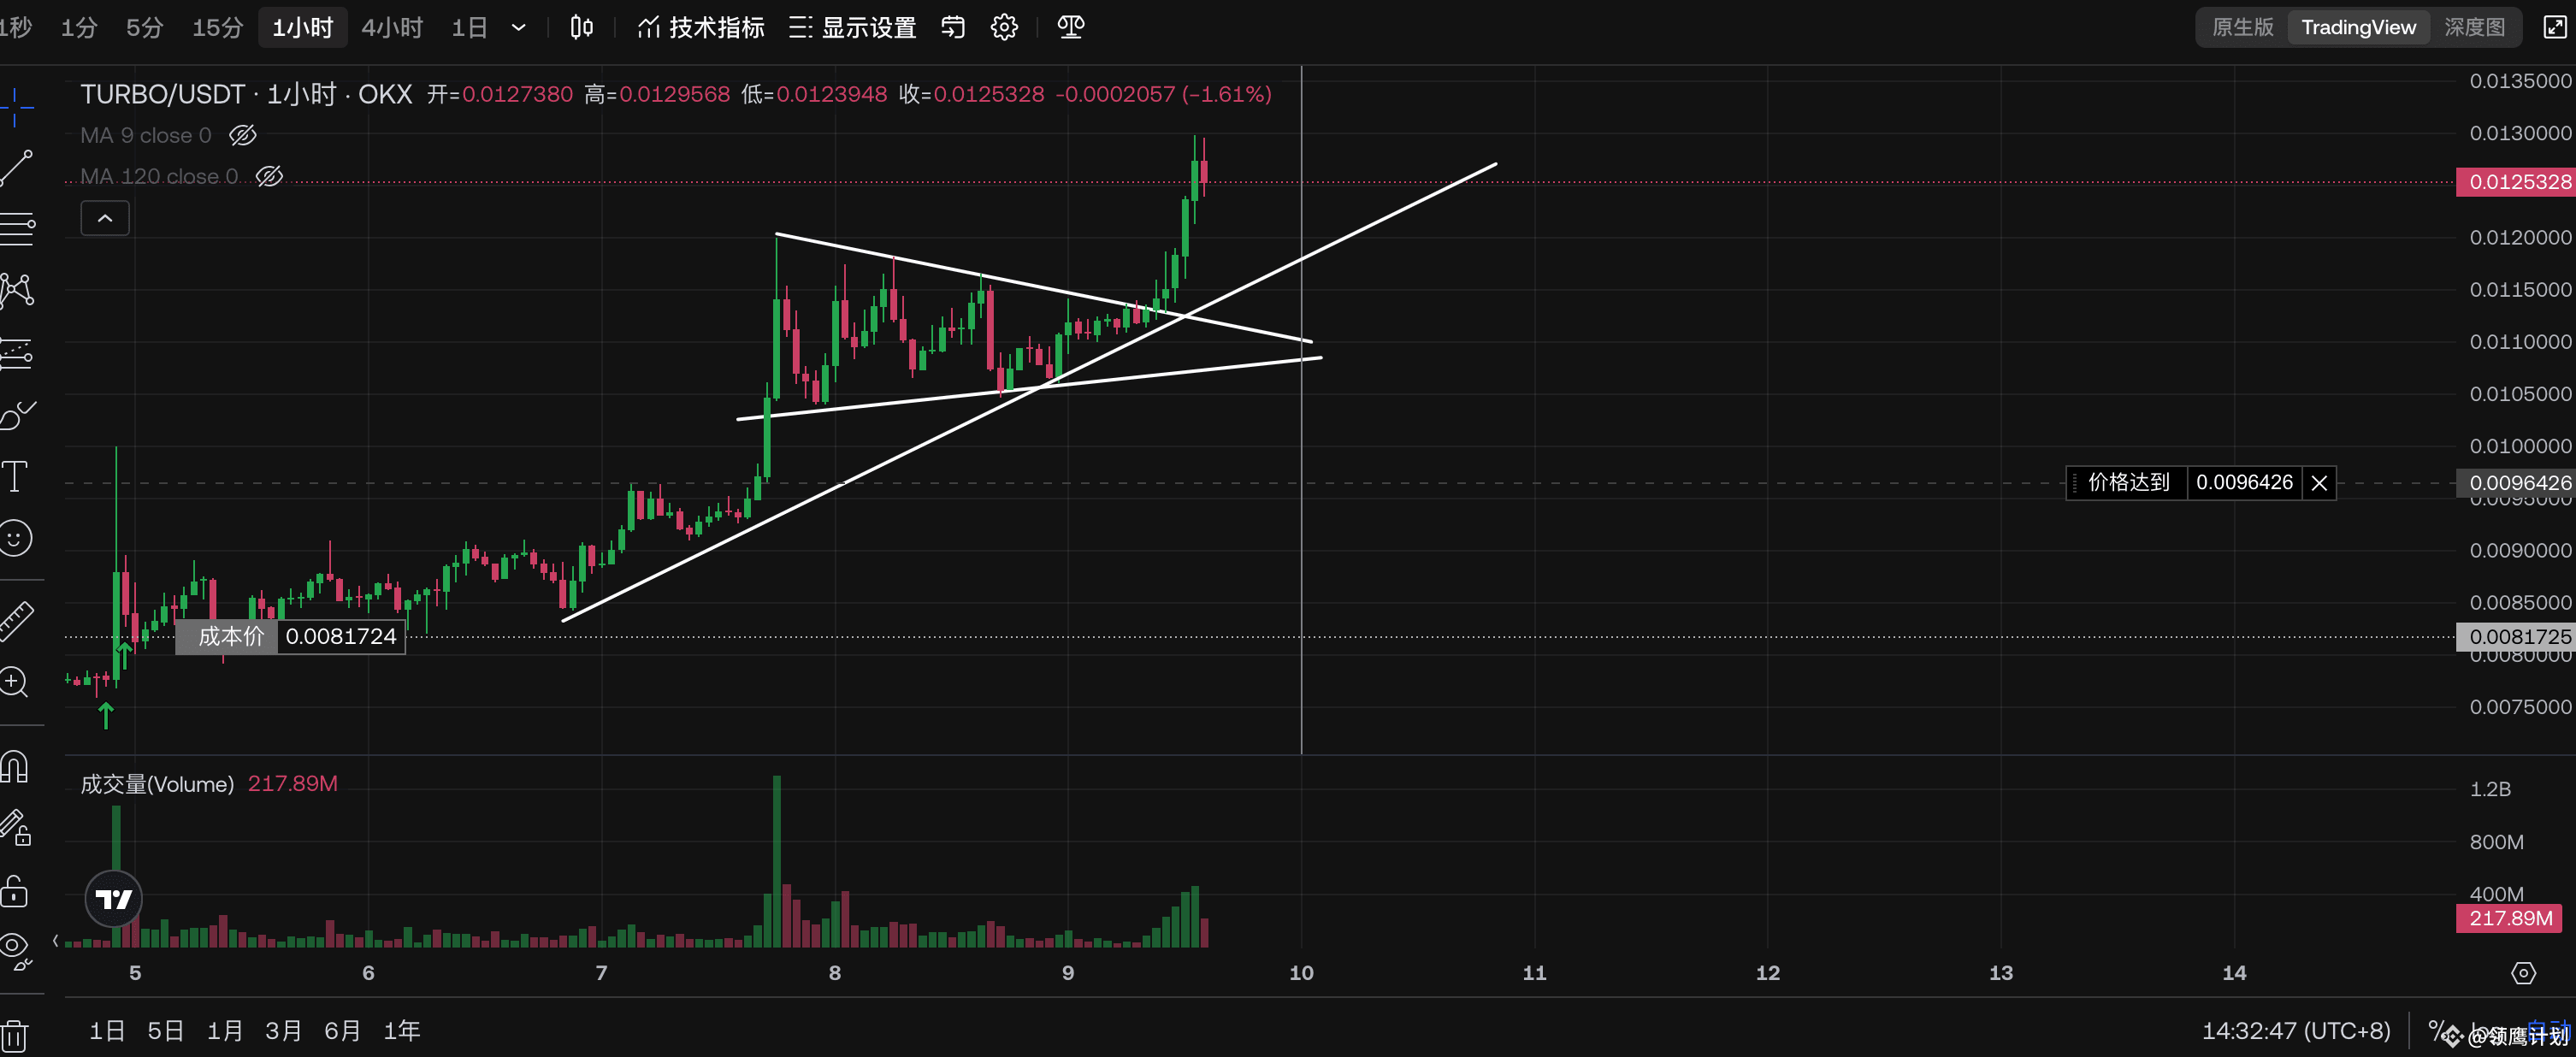
$TURBO Structural breakthrough, pay attention to the signal
The daily level triangle convergence has been broken, and the signal mentioned this time is the 1h level breakthrough signal
The daily line has been converging for a long time;
SOL Shanzhai Season He Tested
The old public chain exploded and it is converging
But its convergence test is very healthy, and it has always been testing the accumulation of funds at the previous support level
I bought the spot when I saw the bottom second test was successful last time
The hourly level triangle convergence has been broken and started to step back; enter the range, and start to make an entry deduction plan
1. The volume breakthrough is successful
2. Step back:
1) Step back to form a new platform; the new platform needs to have a volatility convergence action
2) Step back to the position of the upper shadow line; the pin test is better, and it also needs to form a small platform support to receive the supply
3) Step back to the trend line, if the trend line is broken, then this opportunity will be abandoned
What we are looking forward to are the above three situations. If there is no retracement, then this opportunity will be abandoned;
3. New momentum breakthrough; based on the position of the previous retracement, enter the market based on the strength of the breakthrough. Under normal circumstances, the entry stop loss is placed below the second retracement platform to improve efficiency
{future}(TURBOUSDT)
#领鹰计划
$TURBO Structural breakthrough, pay attention to the signal
The daily level triangle convergence has been broken, and the signal mentioned this time is the 1h level breakthrough signal
The daily line has been converging for a long time;
SOL Shanzhai Season He Tested
The old public chain exploded and it is converging
But its convergence test is very healthy, and it has always been testing the accumulation of funds at the previous support level
I bought the spot when I saw the bottom second test was successful last time
The hourly level triangle convergence has been broken and started to step back; enter the range, and start to make an entry deduction plan
1. The volume breakthrough is successful
2. Step back:
1) Step back to form a new platform; the new platform needs to have a volatility convergence action
2) Step back to the position of the upper shadow line; the pin test is better, and it also needs to form a small platform support to receive the supply
3) Step back to the trend line, if the trend line is broken, then this opportunity will be abandoned
What we are looking forward to are the above three situations. If there is no retracement, then this opportunity will be abandoned;
3. New momentum breakthrough; based on the position of the previous retracement, enter the market based on the strength of the breakthrough. Under normal circumstances, the entry stop loss is placed below the second retracement platform to improve efficiency
#领鹰计划
The daily level triangle convergence has been broken, and the signal mentioned this time is the 1h level breakthrough signal
The daily line has been converging for a long time;
SOL Shanzhai Season He Tested
The old public chain exploded and it is converging
But its convergence test is very healthy, and it has always been testing the accumulation of funds at the previous support level
I bought the spot when I saw the bottom second test was successful last time
The hourly level triangle convergence has been broken and started to step back; enter the range, and start to make an entry deduction plan
1. The volume breakthrough is successful
2. Step back:
1) Step back to form a new platform; the new platform needs to have a volatility convergence action
2) Step back to the position of the upper shadow line; the pin test is better, and it also needs to form a small platform support to receive the supply
3) Step back to the trend line, if the trend line is broken, then this opportunity will be abandoned
What we are looking forward to are the above three situations. If there is no retracement, then this opportunity will be abandoned;
3. New momentum breakthrough; based on the position of the previous retracement, enter the market based on the strength of the breakthrough. Under normal circumstances, the entry stop loss is placed below the second retracement platform to improve efficiency
#领鹰计划
2
1
5
4.3k
·
--
Bullish
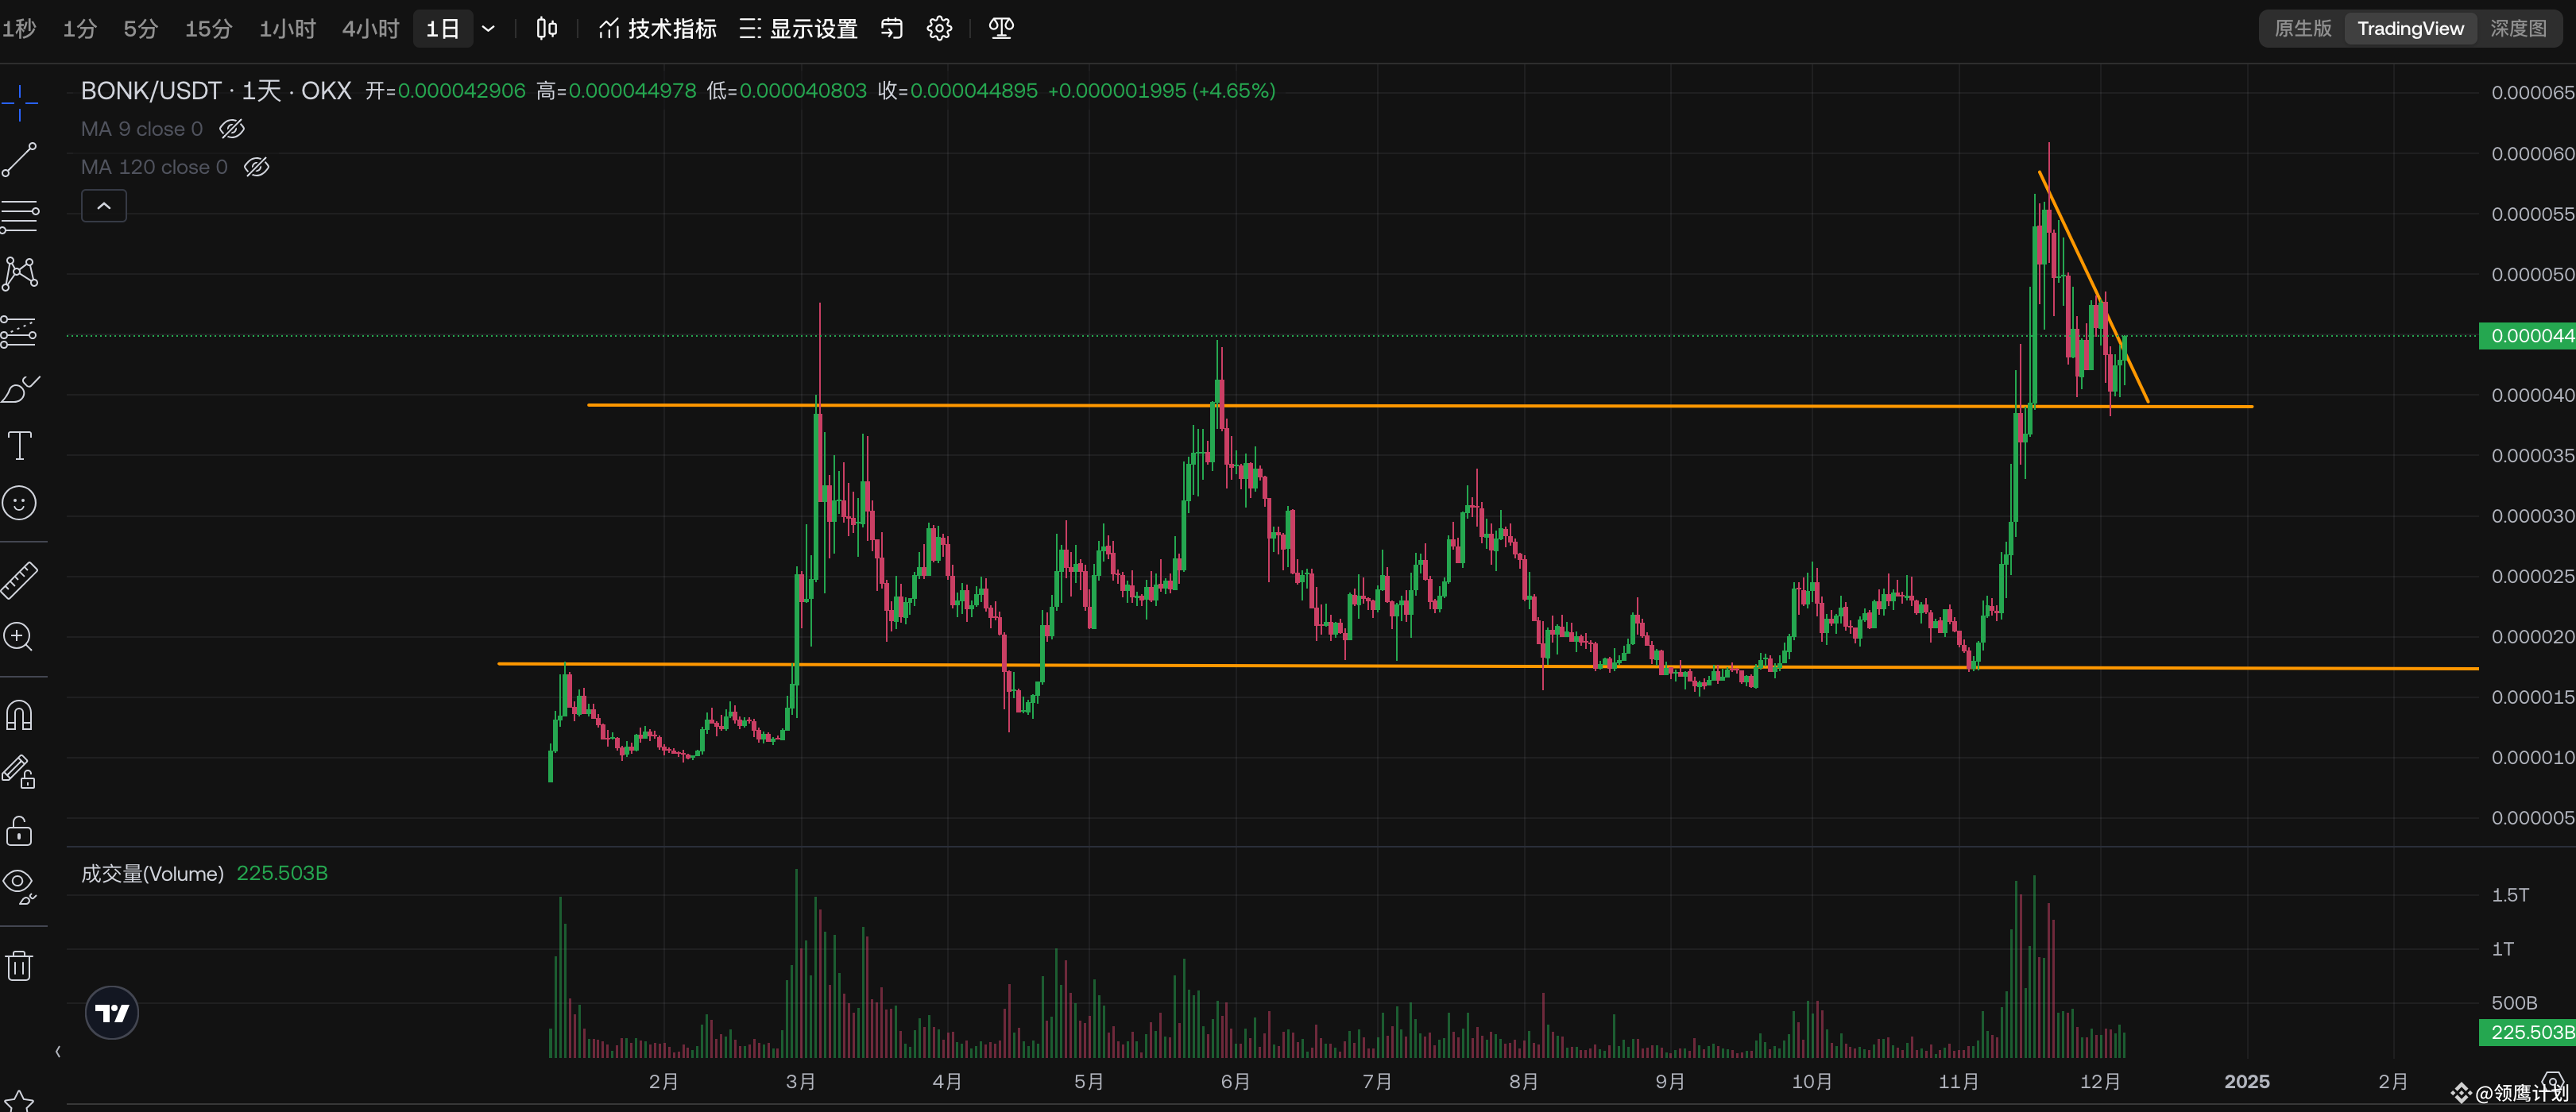
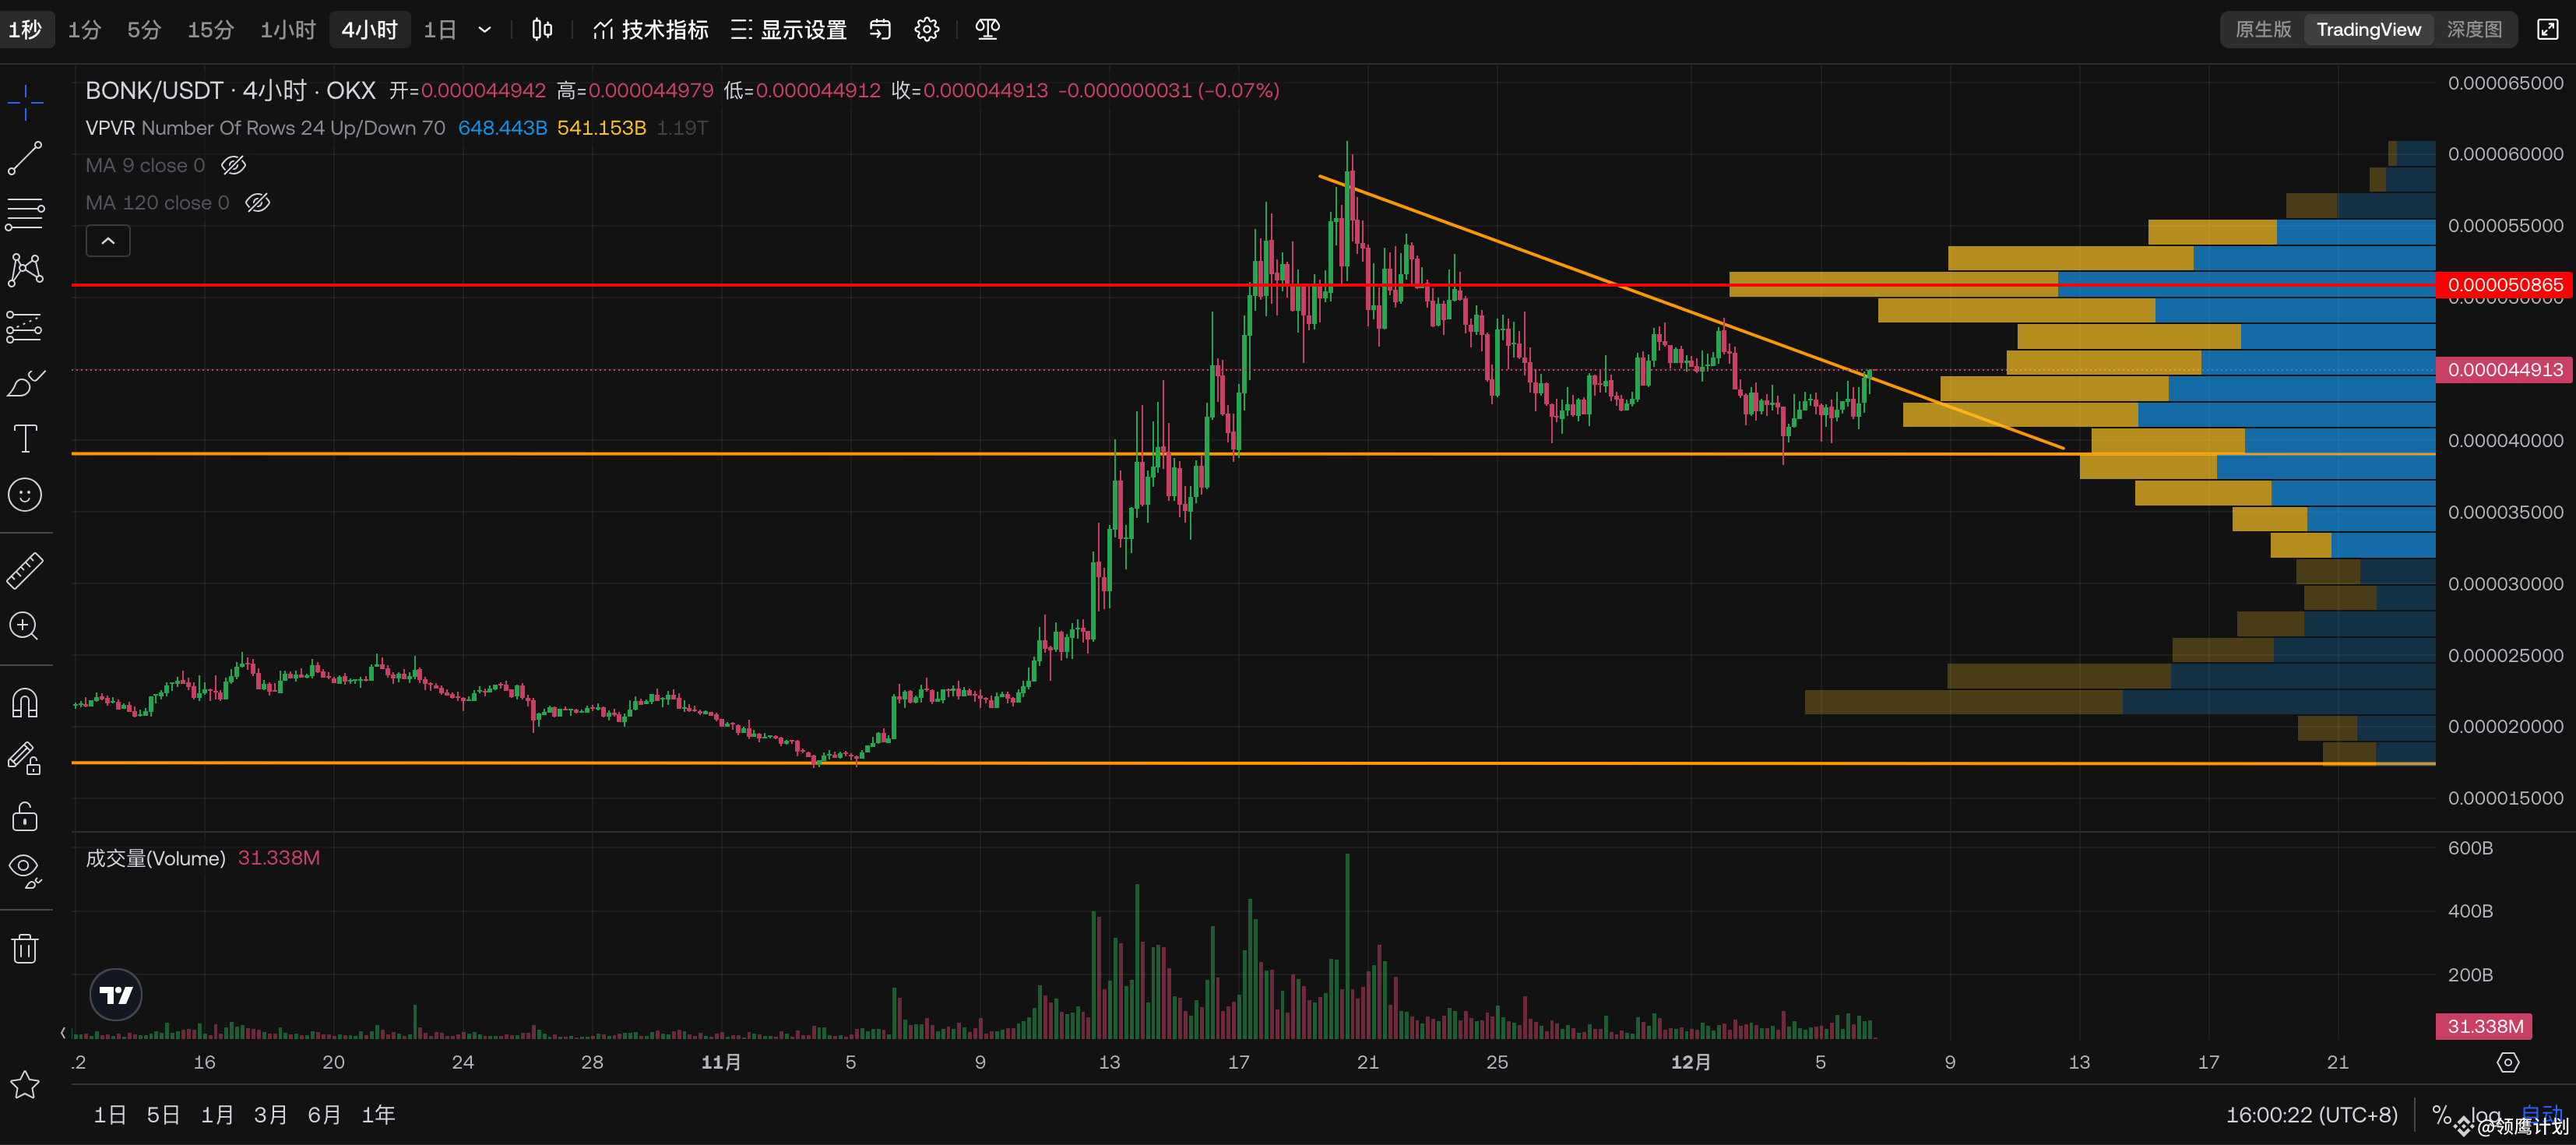
$BONK Retreat and converge, pay attention to breakthrough
The daily level retreated to the upper support level this time; very healthy, and the volume is not converging
What’s a bit bad is that the main volume is accumulated at the top position above. If this volume accumulates in the middle, this double breakthrough is a good signal
The bottom is slowly getting too high. If there is another second test later, but the low point is still rising, it can be arranged
But be mentally prepared for the pressure above
{spot}(BONKUSDT)
#领鹰计划
$BONK Retreat and converge, pay attention to breakthrough
The daily level retreated to the upper support level this time; very healthy, and the volume is not converging
What’s a bit bad is that the main volume is accumulated at the top position above. If this volume accumulates in the middle, this double breakthrough is a good signal
The bottom is slowly getting too high. If there is another second test later, but the low point is still rising, it can be arranged
But be mentally prepared for the pressure above
#领鹰计划
The daily level retreated to the upper support level this time; very healthy, and the volume is not converging
What’s a bit bad is that the main volume is accumulated at the top position above. If this volume accumulates in the middle, this double breakthrough is a good signal
The bottom is slowly getting too high. If there is another second test later, but the low point is still rising, it can be arranged
But be mentally prepared for the pressure above
#领鹰计划
2
851
·
--
Bullish
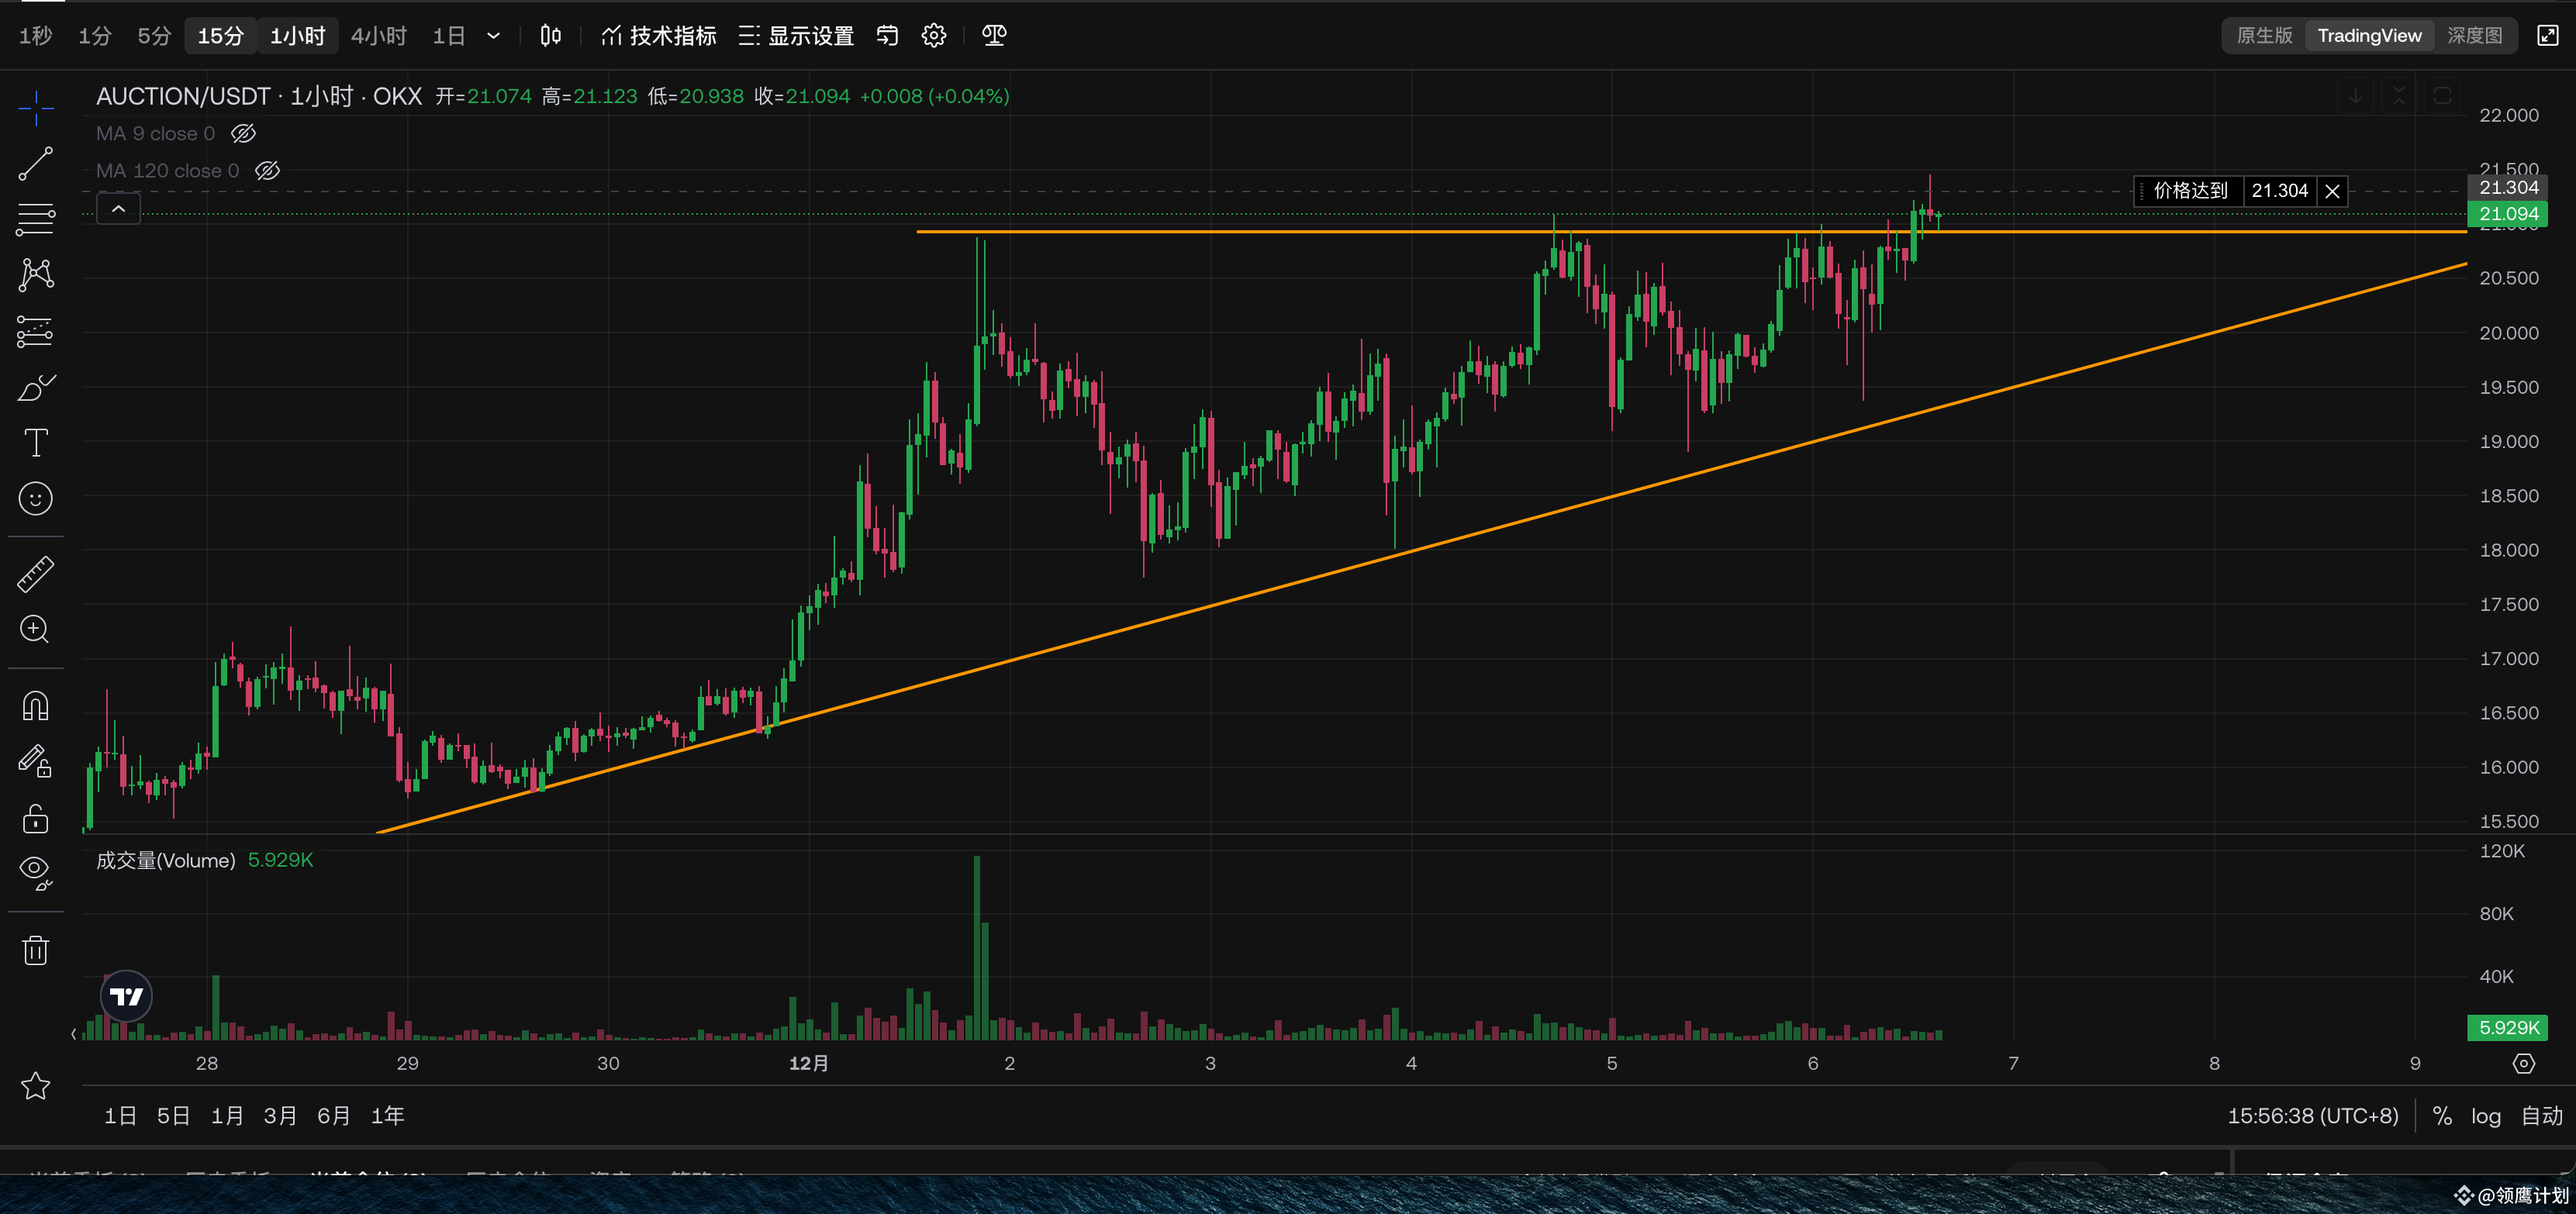
$AUCTION Top Convergence Attention Signal
Hourly level convergence structure; Expecting a breakout with volume
There are resistance levels above at the daily level; Need to pay attention;
It’s better to wait for strong signals to appear before making moves
$AUCTION
{spot}(AUCTIONUSDT)
#领鹰计划
$AUCTION Top Convergence Attention Signal
Hourly level convergence structure; Expecting a breakout with volume
There are resistance levels above at the daily level; Need to pay attention;
It’s better to wait for strong signals to appear before making moves
$AUCTION
#领鹰计划
Hourly level convergence structure; Expecting a breakout with volume
There are resistance levels above at the daily level; Need to pay attention;
It’s better to wait for strong signals to appear before making moves
$AUCTION
#领鹰计划
1
788
·
--
Bullish
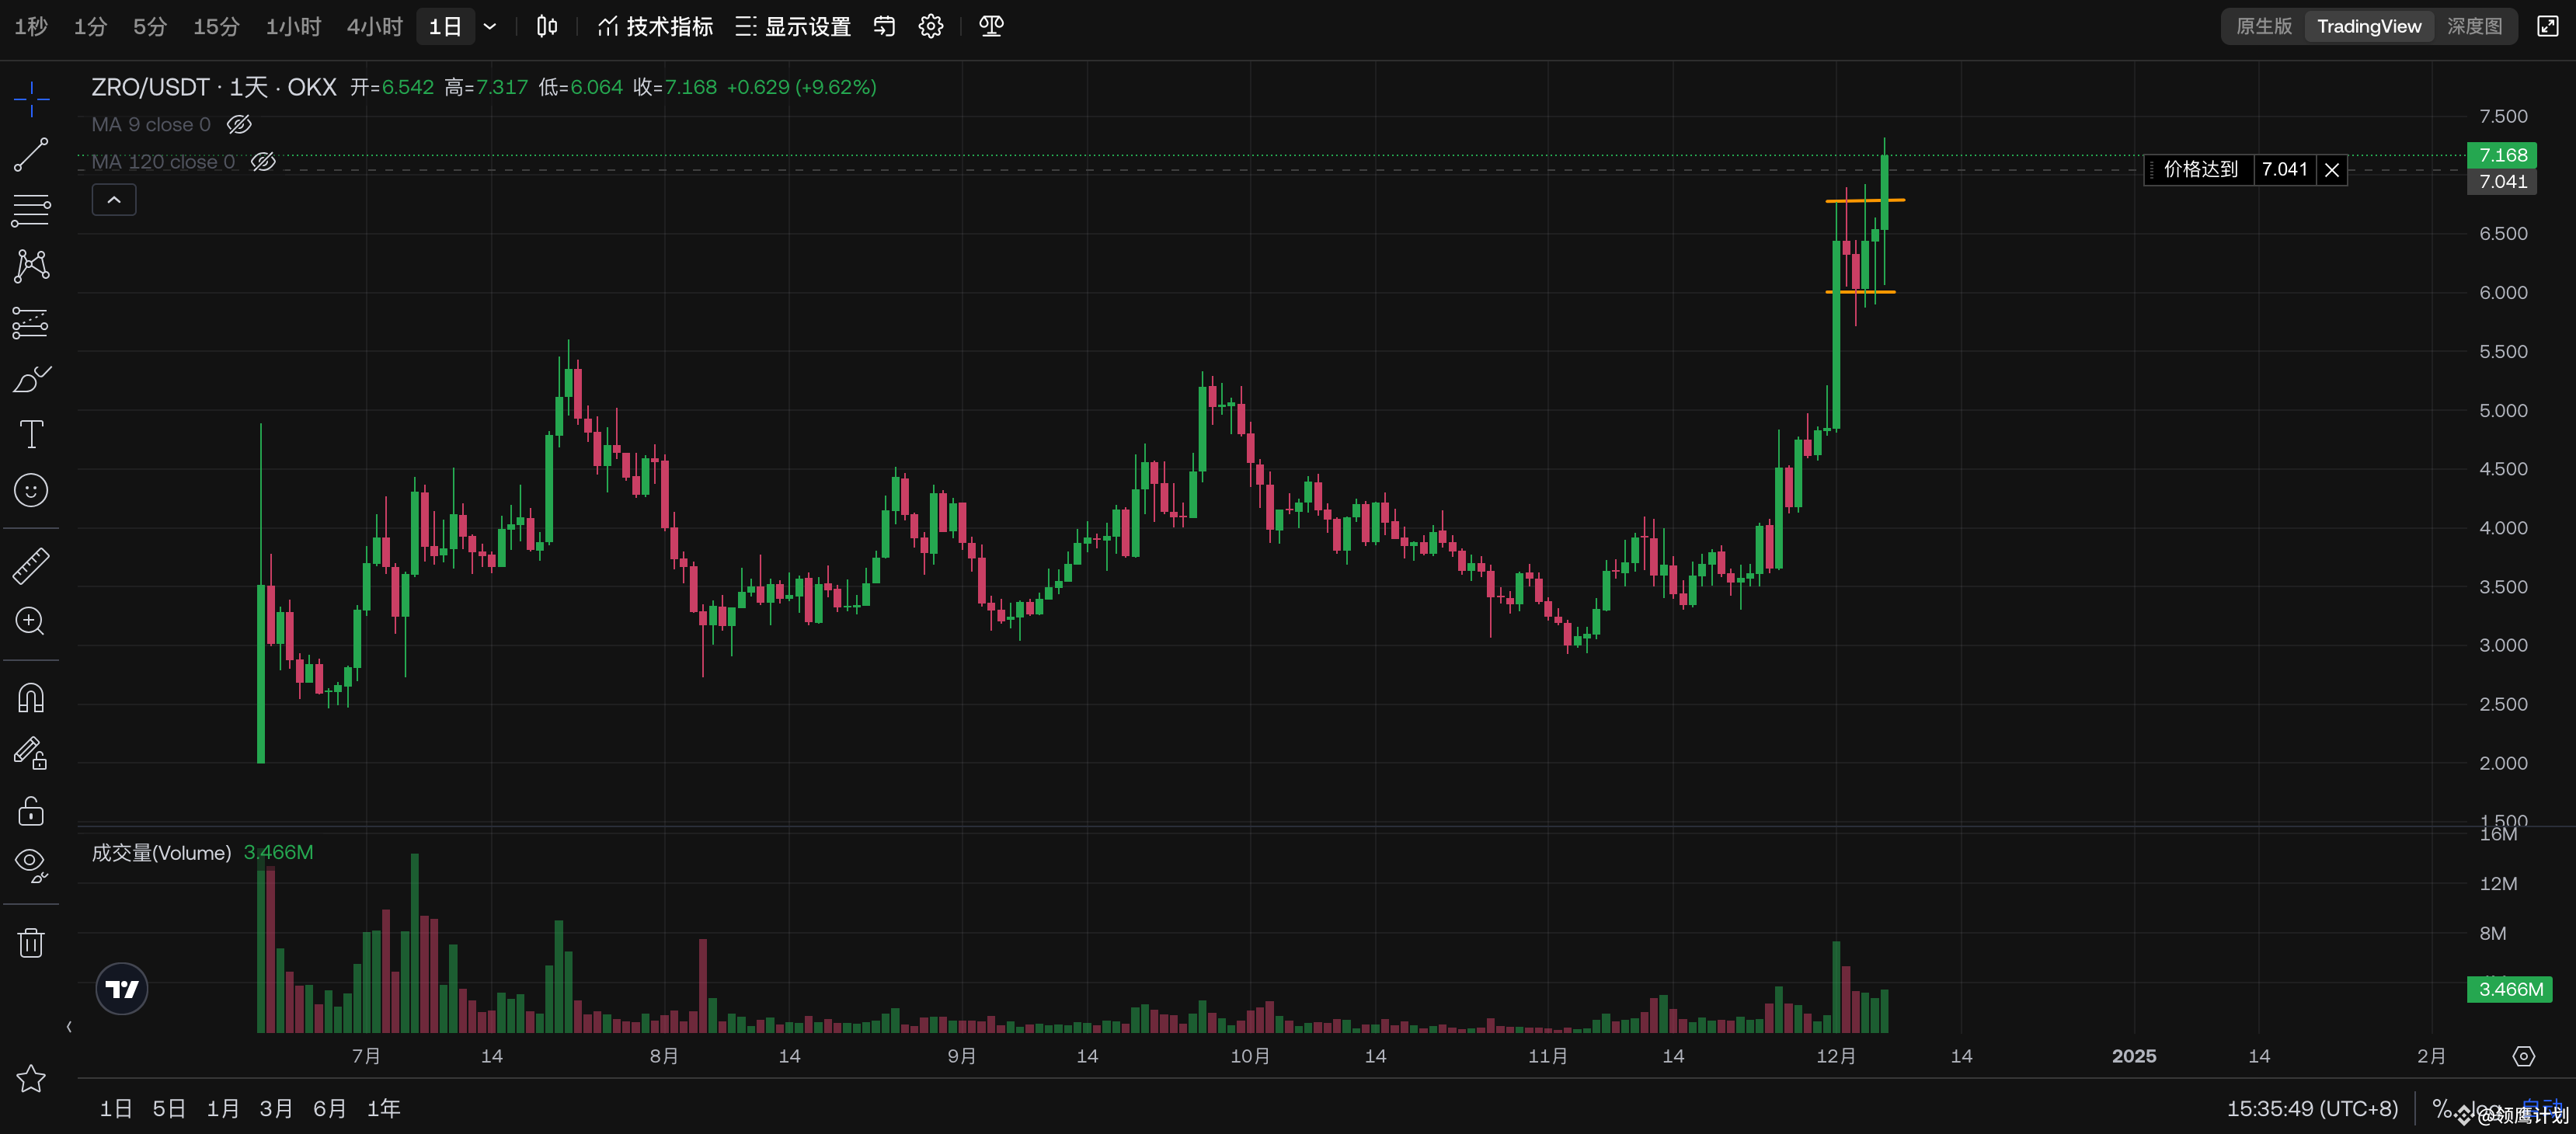
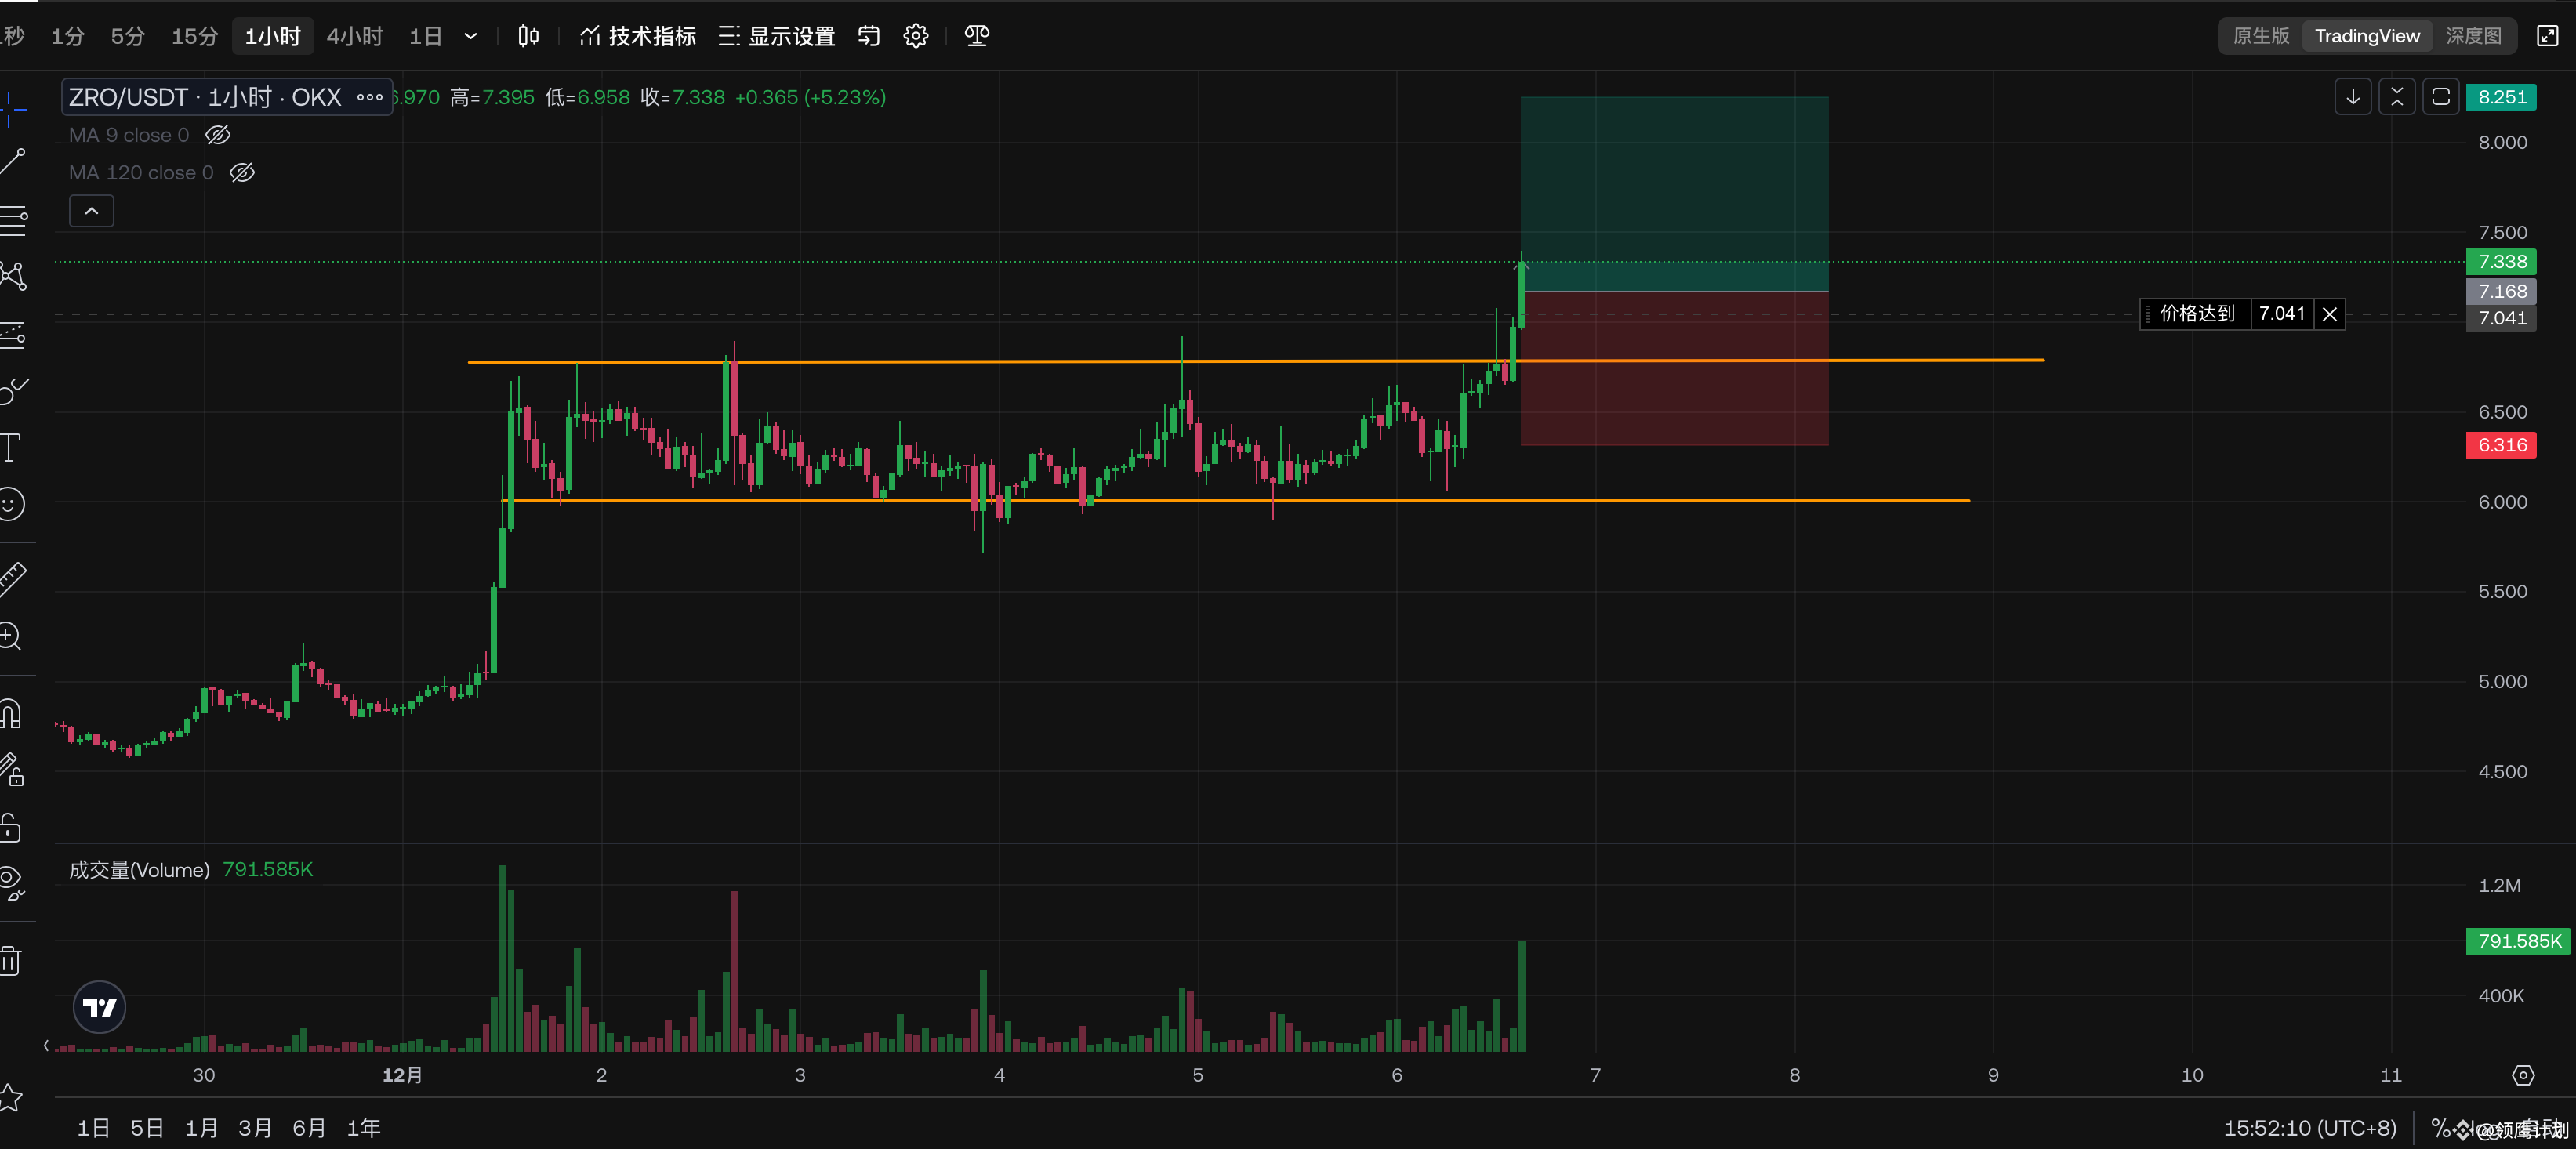
$ZRO Breakout Box Attention Signal
Daily level, this has already made a new high, there are no resistance levels, and it has infinite possibilities (this is the same situation as zk)
1h level, box breakout, and the volume is continuously increasing, which is a good signal.
My current position is fully loaded 😅 if it can pull back to the upper boundary again, with reduced volume pullback, I still need to adjust the funds for entry; I personally think this coin's trend is a bit stronger than zk, zk's breakout volume is not as good as his
$ZRO
{spot}(ZROUSDT)
#领鹰计划
$ZRO Breakout Box Attention Signal
Daily level, this has already made a new high, there are no resistance levels, and it has infinite possibilities (this is the same situation as zk)
1h level, box breakout, and the volume is continuously increasing, which is a good signal.
My current position is fully loaded 😅 if it can pull back to the upper boundary again, with reduced volume pullback, I still need to adjust the funds for entry; I personally think this coin's trend is a bit stronger than zk, zk's breakout volume is not as good as his
$ZRO
#领鹰计划
Daily level, this has already made a new high, there are no resistance levels, and it has infinite possibilities (this is the same situation as zk)
1h level, box breakout, and the volume is continuously increasing, which is a good signal.
My current position is fully loaded 😅 if it can pull back to the upper boundary again, with reduced volume pullback, I still need to adjust the funds for entry; I personally think this coin's trend is a bit stronger than zk, zk's breakout volume is not as good as his
$ZRO
#领鹰计划
1
1.1k
·
--
Bullish
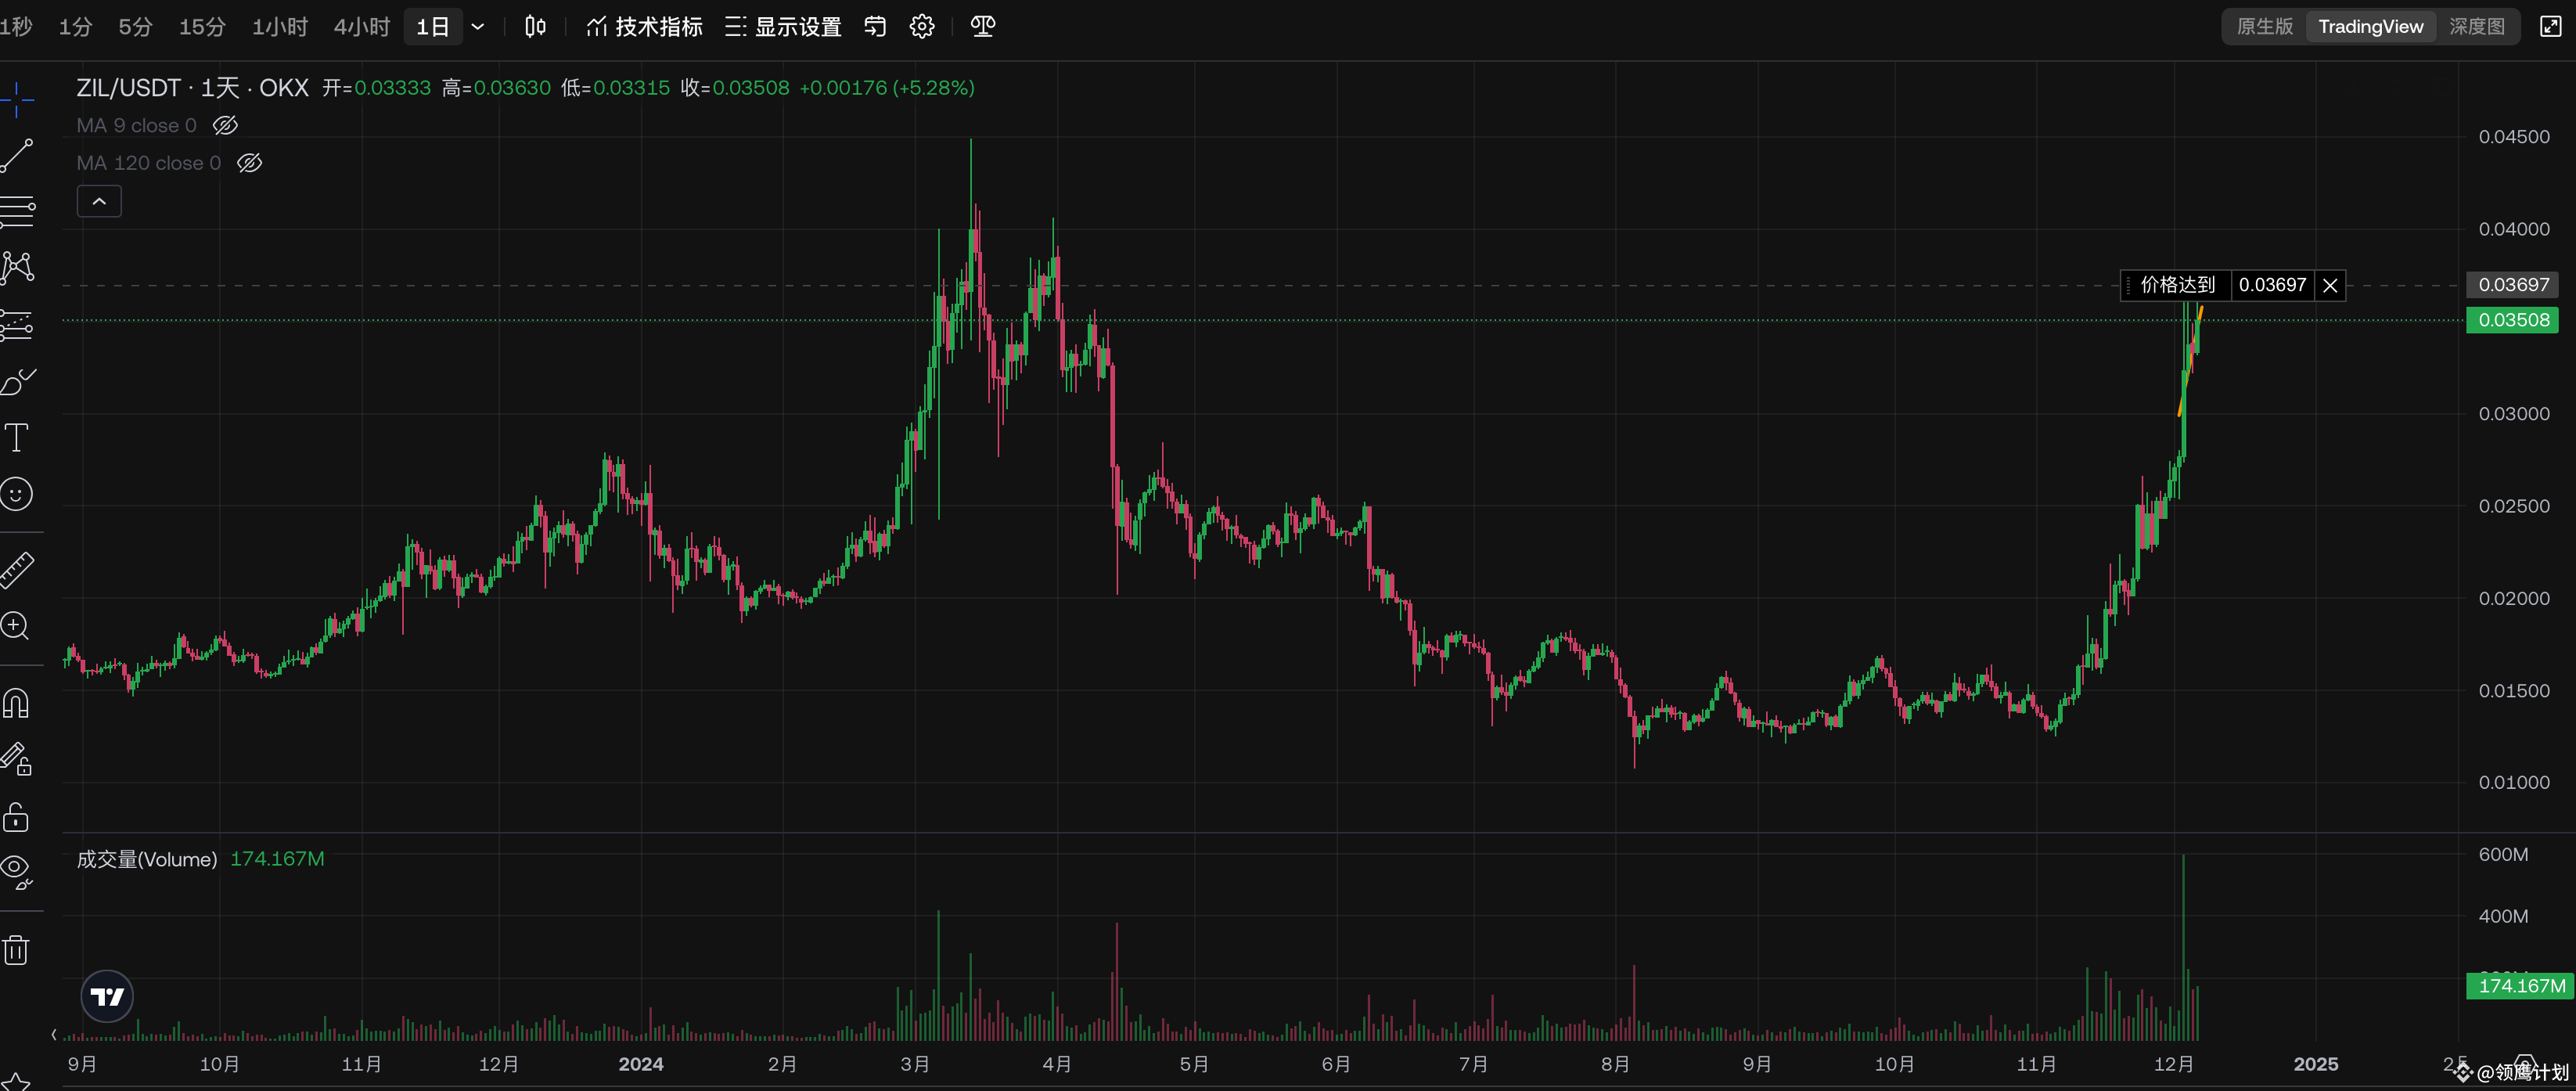
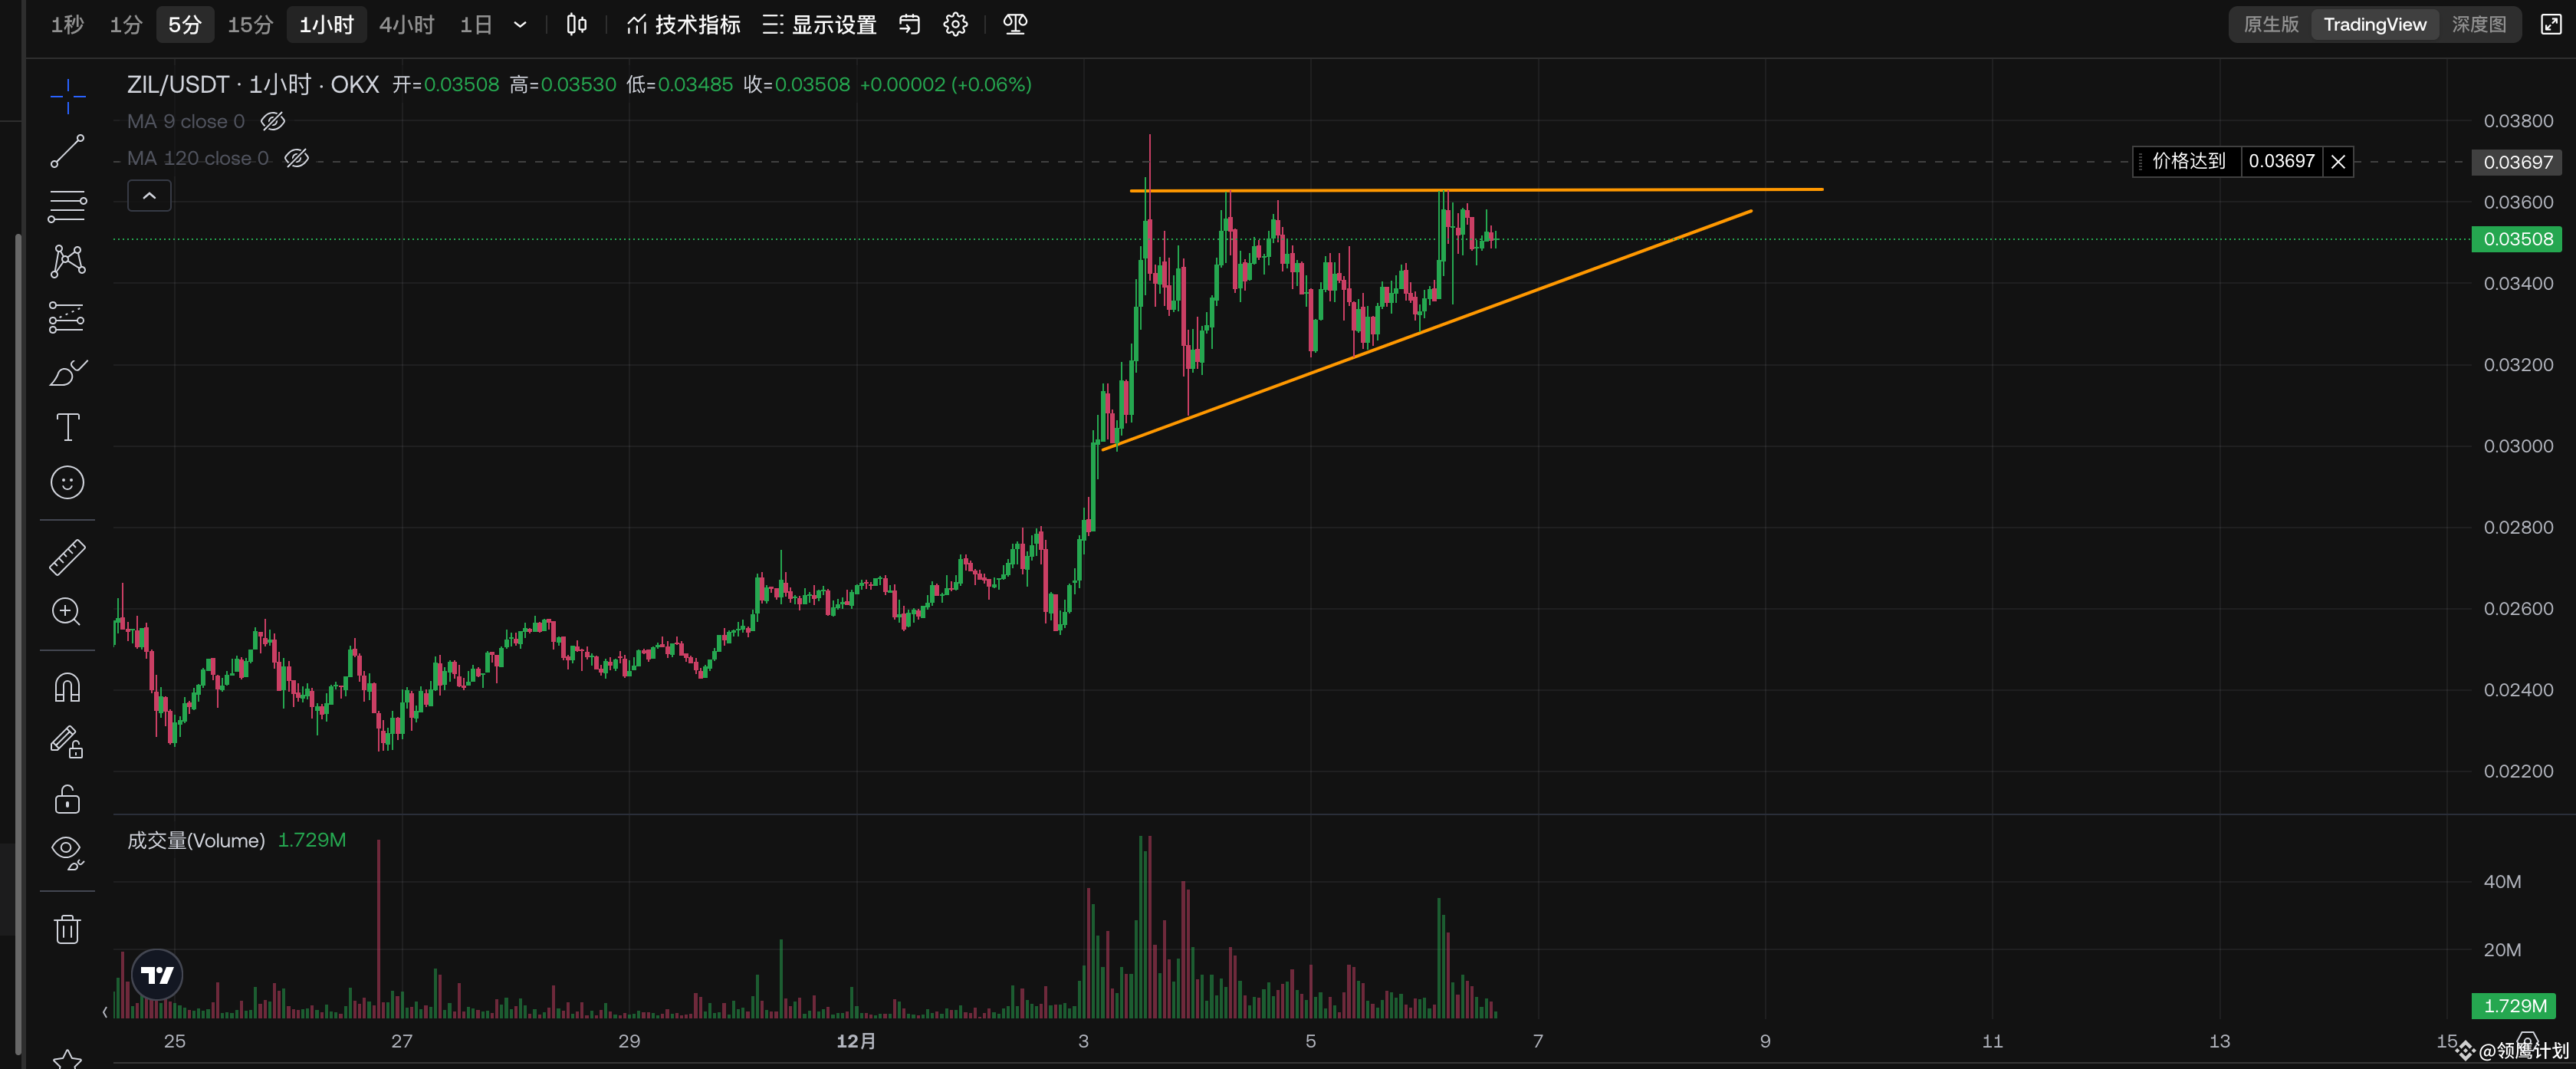
$ZIL Top Convergence Attention Breakthrough
Looking at the daily level, there is a resistance level ahead, and the space is not too large; however, at the 1-hour level, it has indeed started to converge, with volume and price coordination; we can pay attention to the subsequent breakthroughs.
In terms of space, this convergence structure is still a bit lacking, continuing to converge for a week or so for more tests, and then breaking out with increased volume would be a very good signal.
$ZIL
{spot}(ZILUSDT)
#领鹰计划
$ZIL Top Convergence Attention Breakthrough
Looking at the daily level, there is a resistance level ahead, and the space is not too large; however, at the 1-hour level, it has indeed started to converge, with volume and price coordination; we can pay attention to the subsequent breakthroughs.
In terms of space, this convergence structure is still a bit lacking, continuing to converge for a week or so for more tests, and then breaking out with increased volume would be a very good signal.
$ZIL
#领鹰计划
Looking at the daily level, there is a resistance level ahead, and the space is not too large; however, at the 1-hour level, it has indeed started to converge, with volume and price coordination; we can pay attention to the subsequent breakthroughs.
In terms of space, this convergence structure is still a bit lacking, continuing to converge for a week or so for more tests, and then breaking out with increased volume would be a very good signal.
$ZIL
#领鹰计划
1
1
973
·
--
Bullish
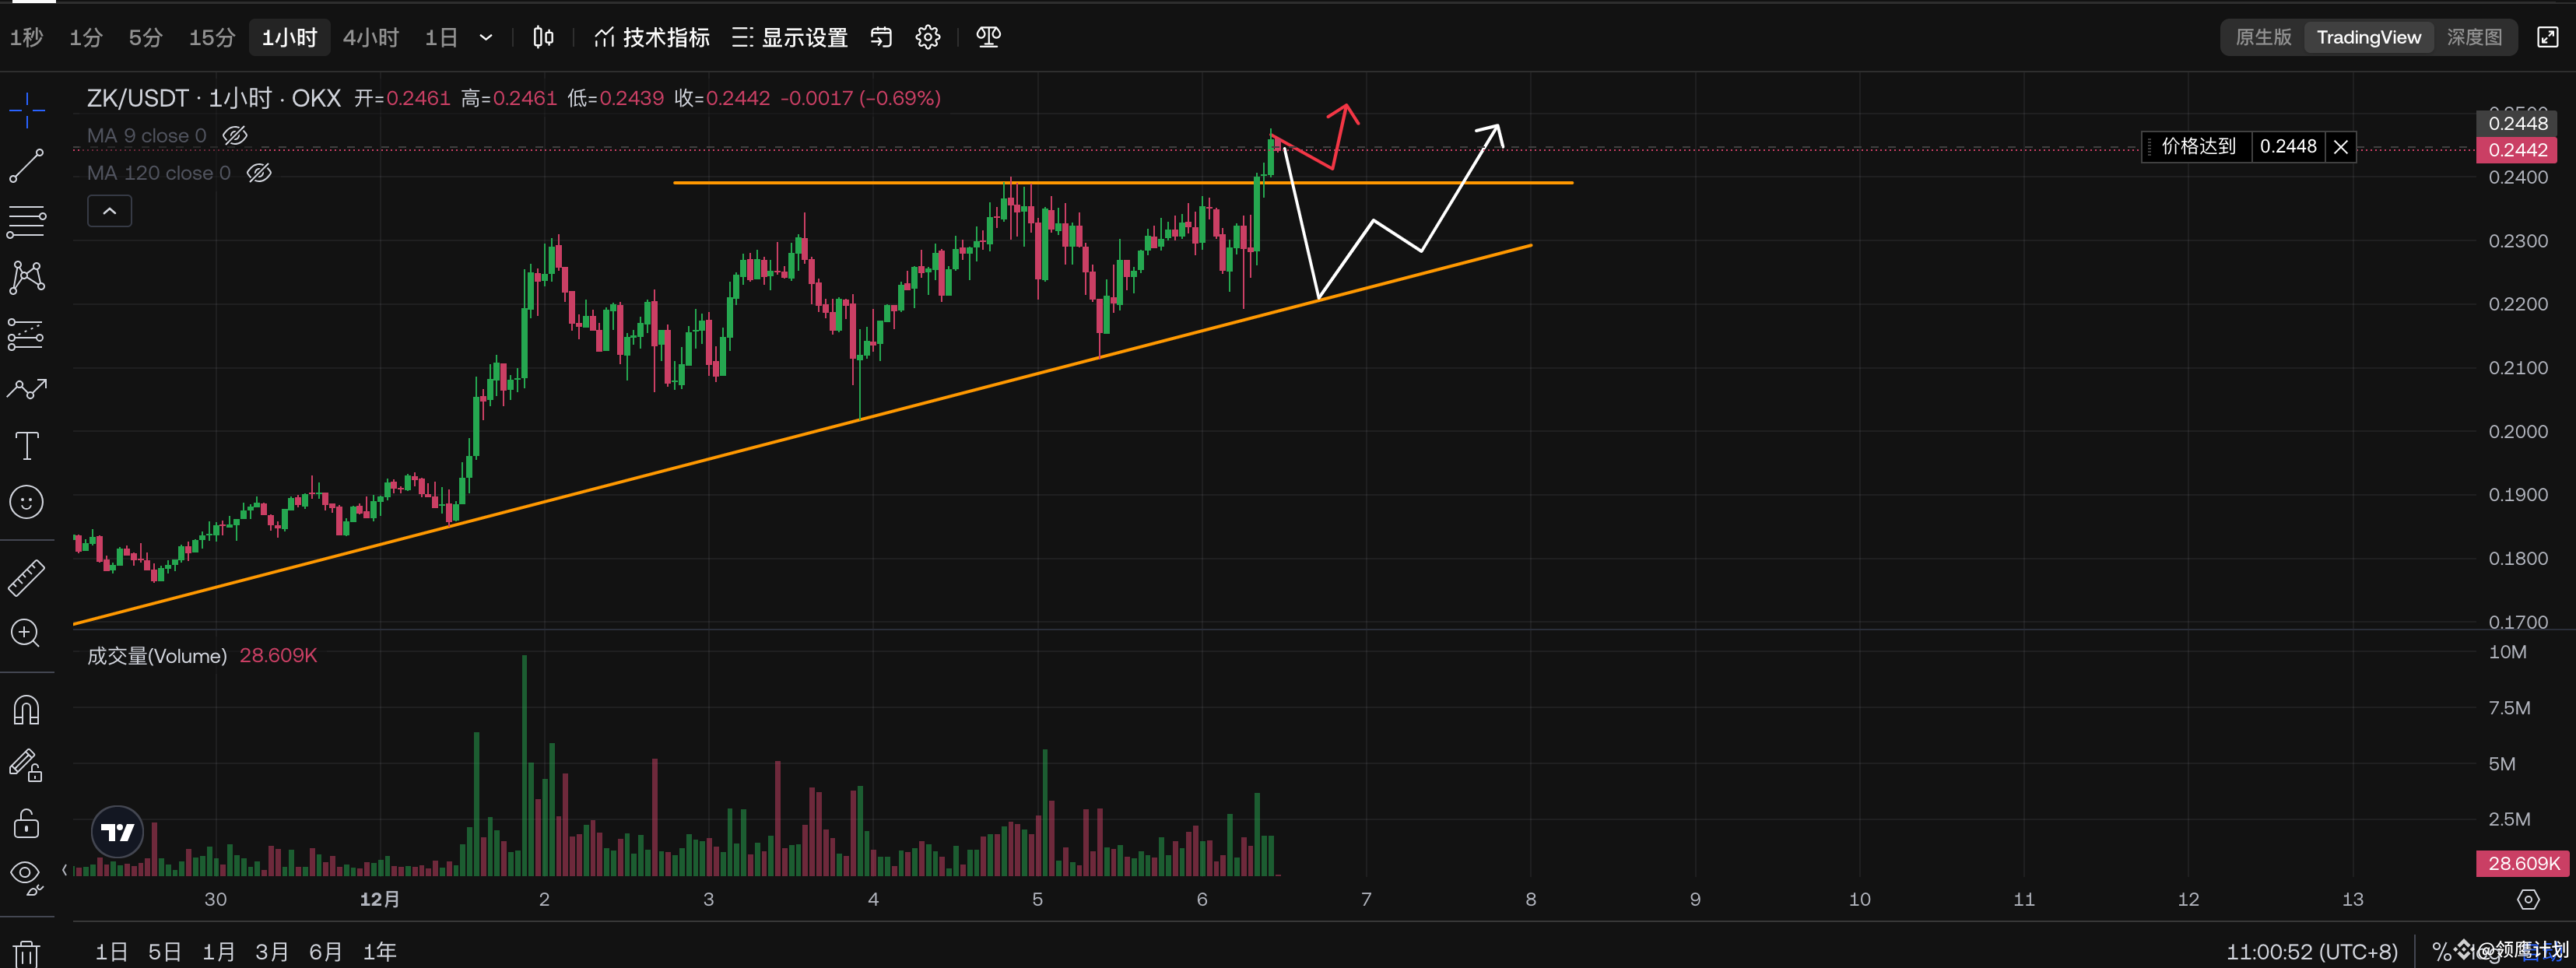
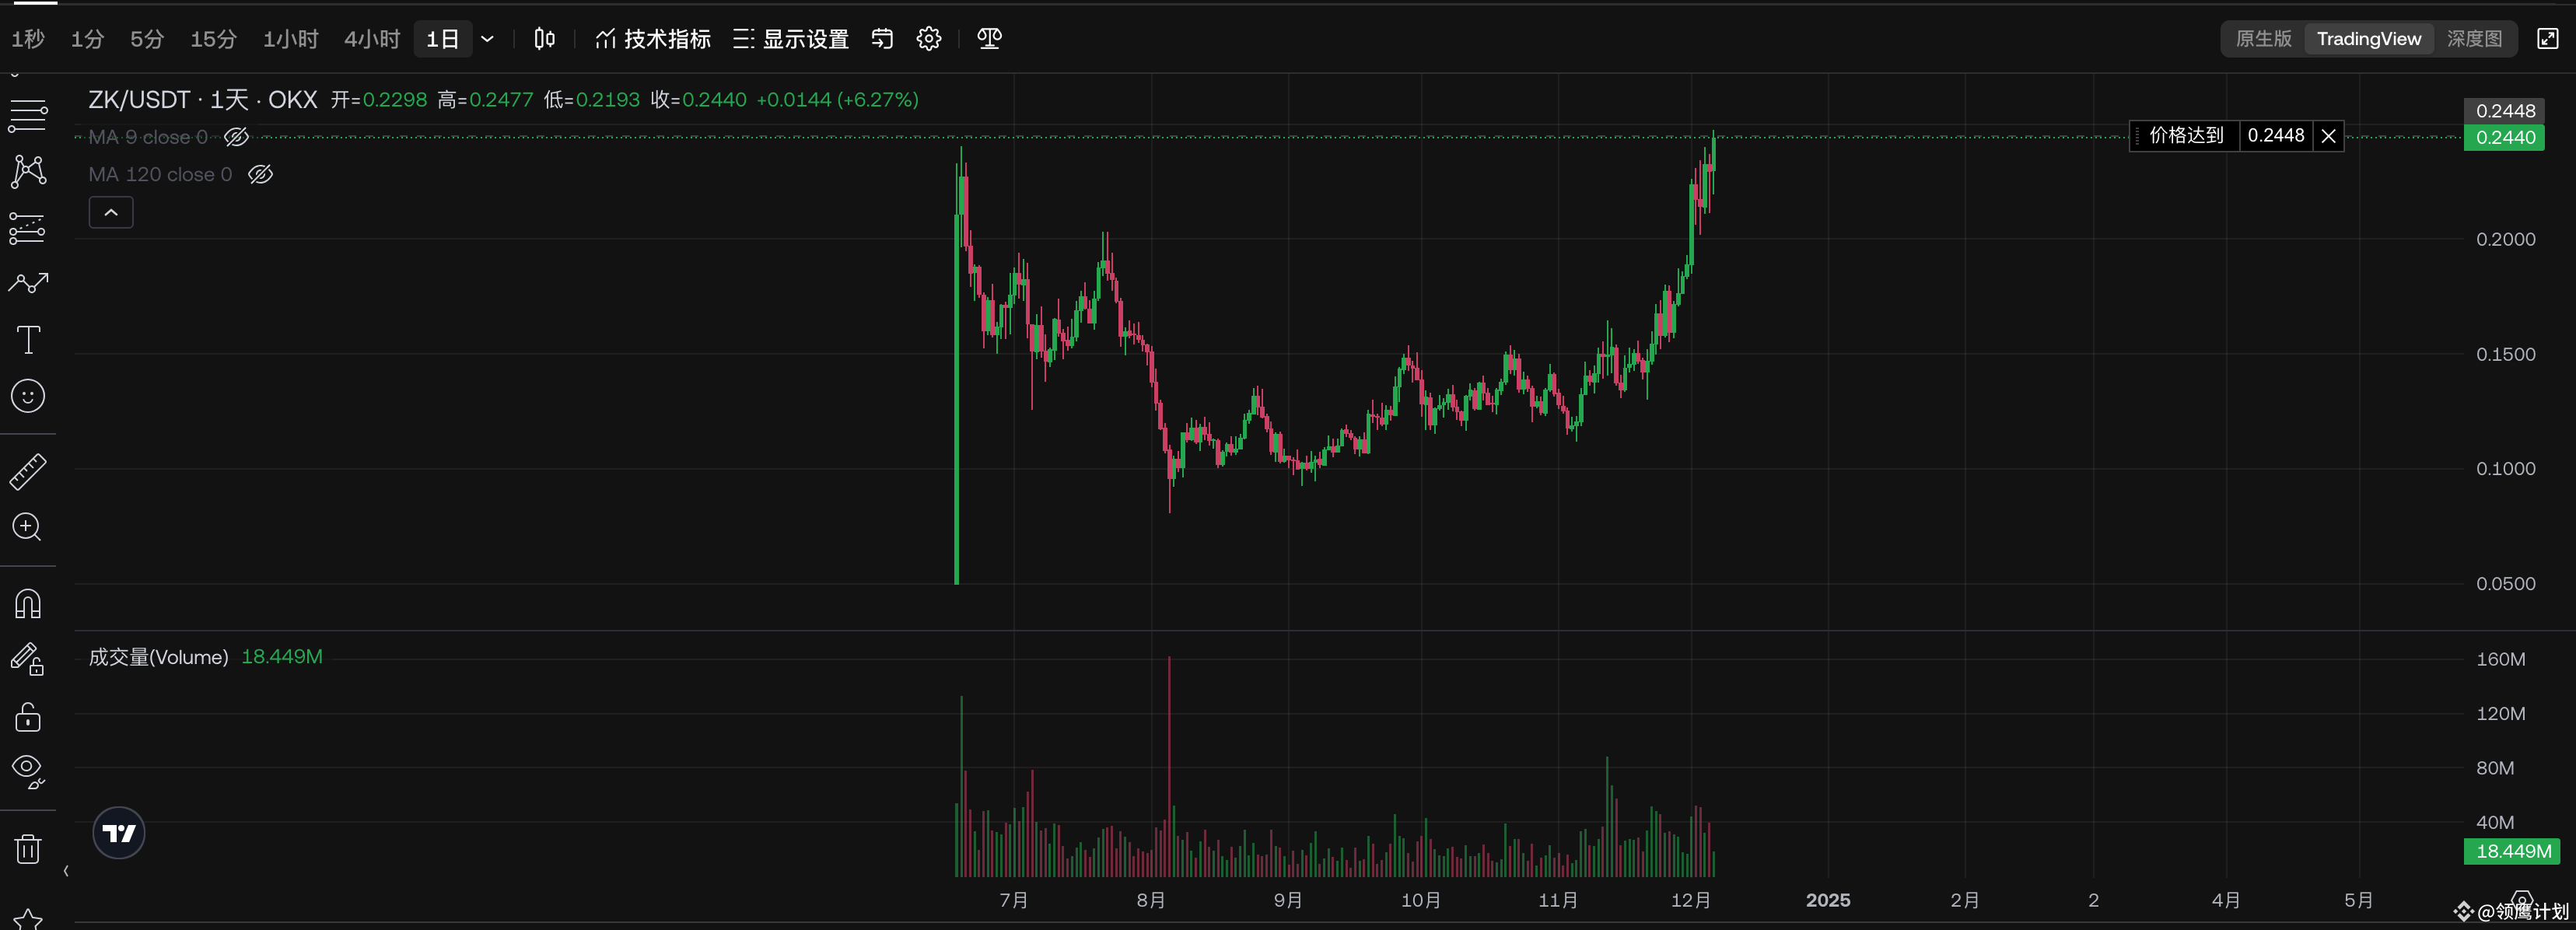
$ZK Top Breakthrough Attention Signal
Daily level zk has reached the previous high position, there is no resistance above
The 1h level is a right-angle converging triangle, currently it has broken the resistance
Because this breakthrough did not have much volume; to prevent false breakouts; wait for the third buying point, stronger momentum is needed;
$ZK
{spot}(ZKUSDT)
#领鹰计划
$ZK Top Breakthrough Attention Signal
Daily level zk has reached the previous high position, there is no resistance above
The 1h level is a right-angle converging triangle, currently it has broken the resistance
Because this breakthrough did not have much volume; to prevent false breakouts; wait for the third buying point, stronger momentum is needed;
$ZK
#领鹰计划
Daily level zk has reached the previous high position, there is no resistance above
The 1h level is a right-angle converging triangle, currently it has broken the resistance
Because this breakthrough did not have much volume; to prevent false breakouts; wait for the third buying point, stronger momentum is needed;
$ZK
#领鹰计划
1
2
5.3k
·
--
Bullish
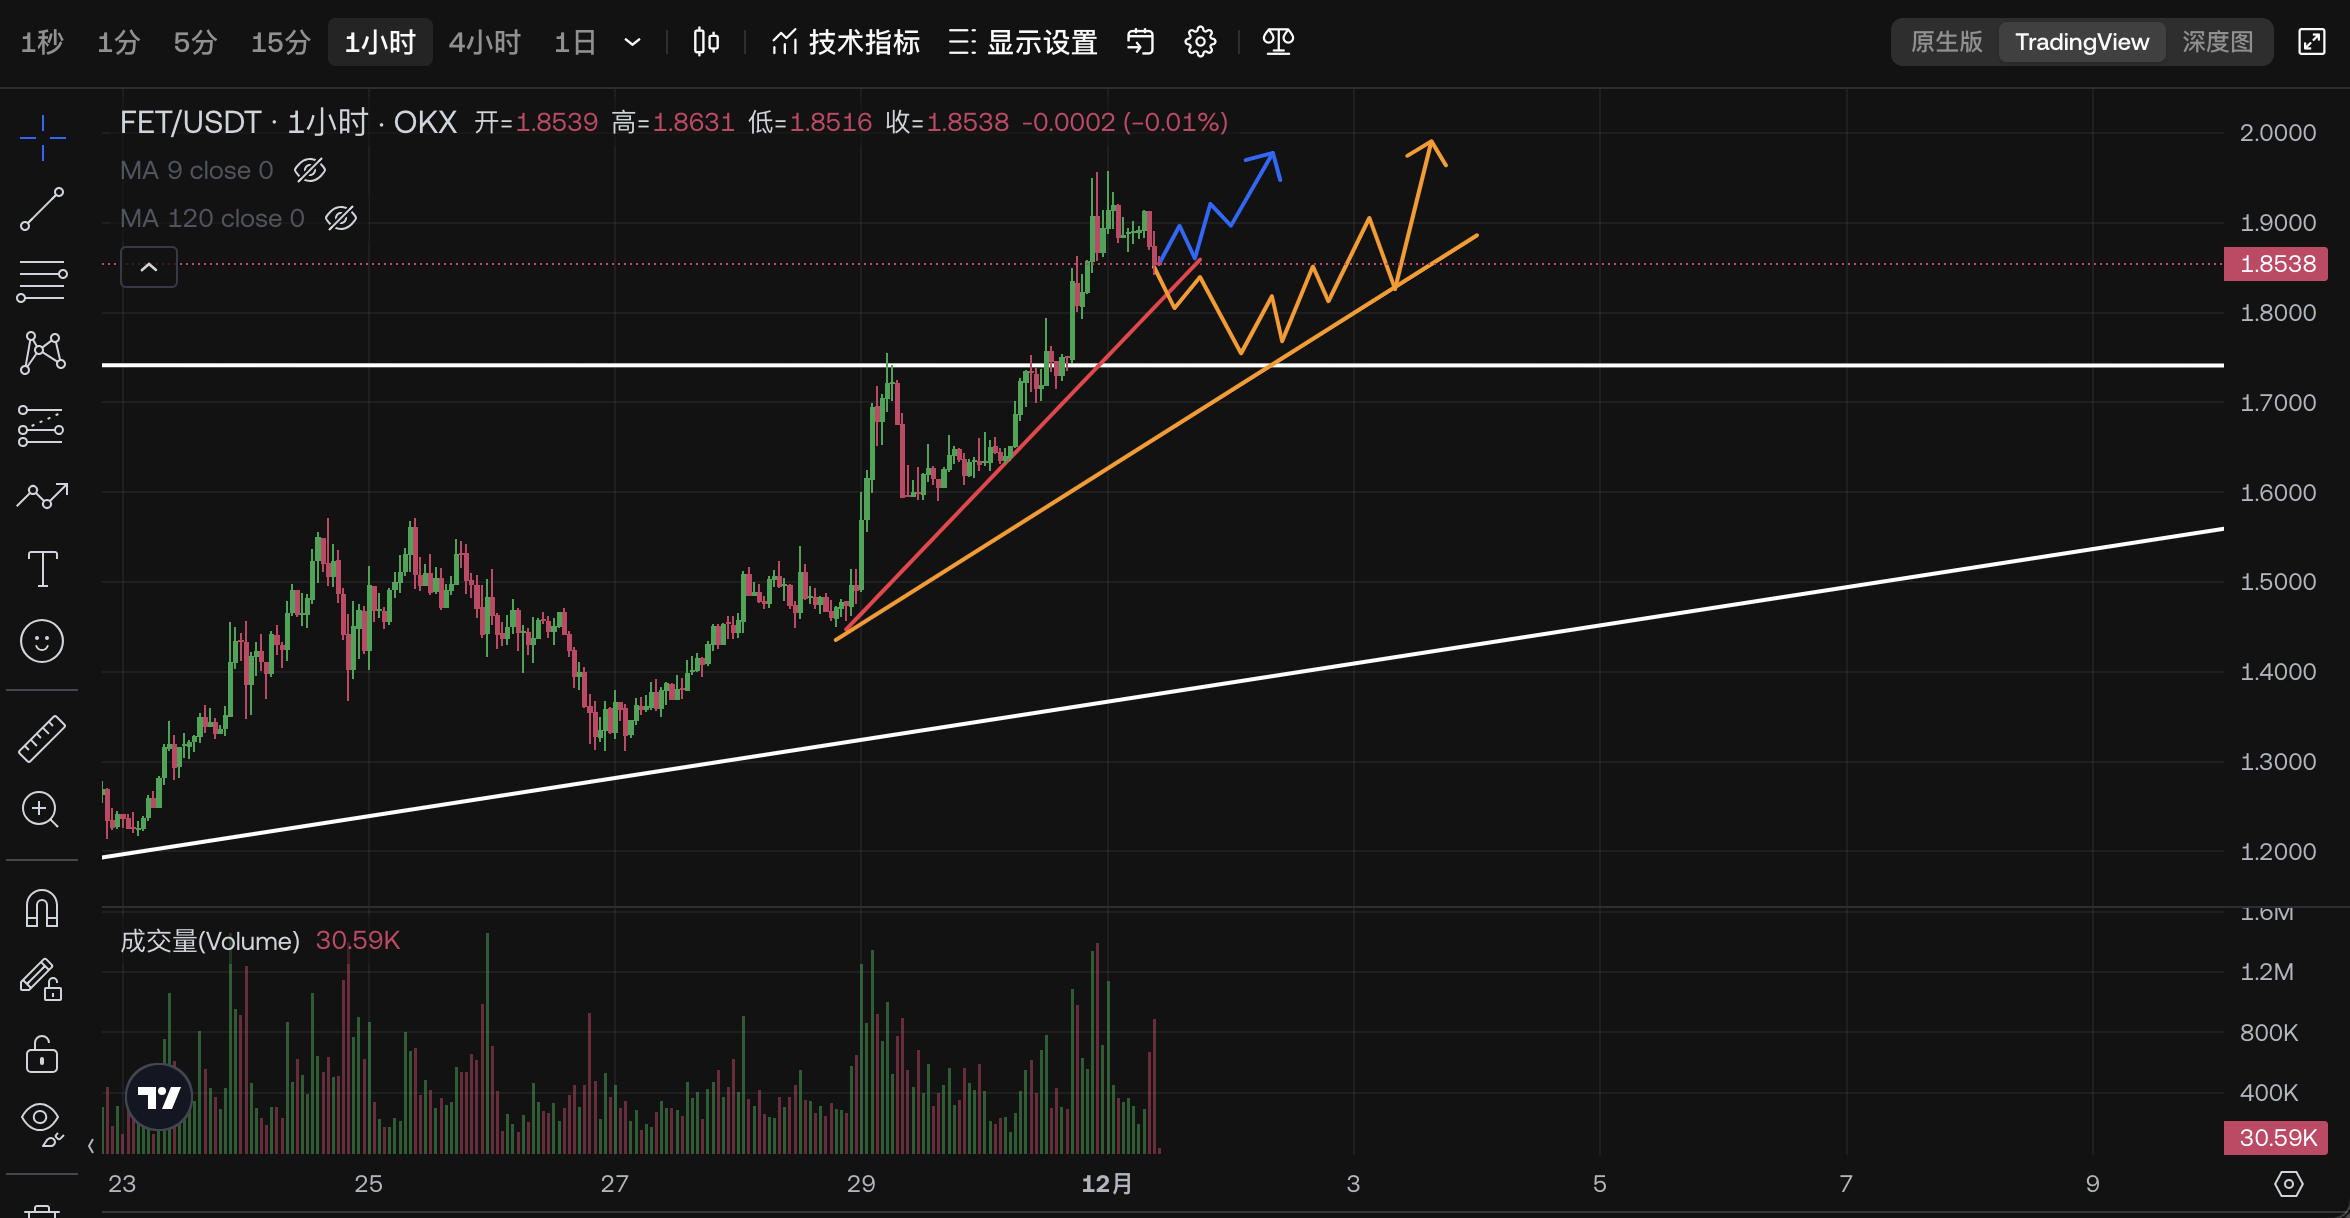
$FET adjusted and then broke through. Pay attention to the entry signal. This wave of retracement confirmation is perfect. It retraced with reduced volume. After testing at the support level and trend line, it quickly pulled back. The top pressure level was also tested successfully. This time it stood on 1.95 again, which is a good signal. This trend is also very consistent with my deduction plan. Wait for the 1h Kline to close. If the volume is not bad, I will enter the market. The current time is just the beginning of a Kline, and the information is not enough to enter the market directly. $FET {spot}(FETUSDT) #领鹰计划
$FET adjusted and then broke through. Pay attention to the entry signal. This wave of retracement confirmation is perfect. It retraced with reduced volume. After testing at the support level and trend line, it quickly pulled back. The top pressure level was also tested successfully. This time it stood on 1.95 again, which is a good signal. This trend is also very consistent with my deduction plan. Wait for the 1h Kline to close. If the volume is not bad, I will enter the market. The current time is just the beginning of a Kline, and the information is not enough to enter the market directly. $FET #领鹰计划
领鹰计划
·
--
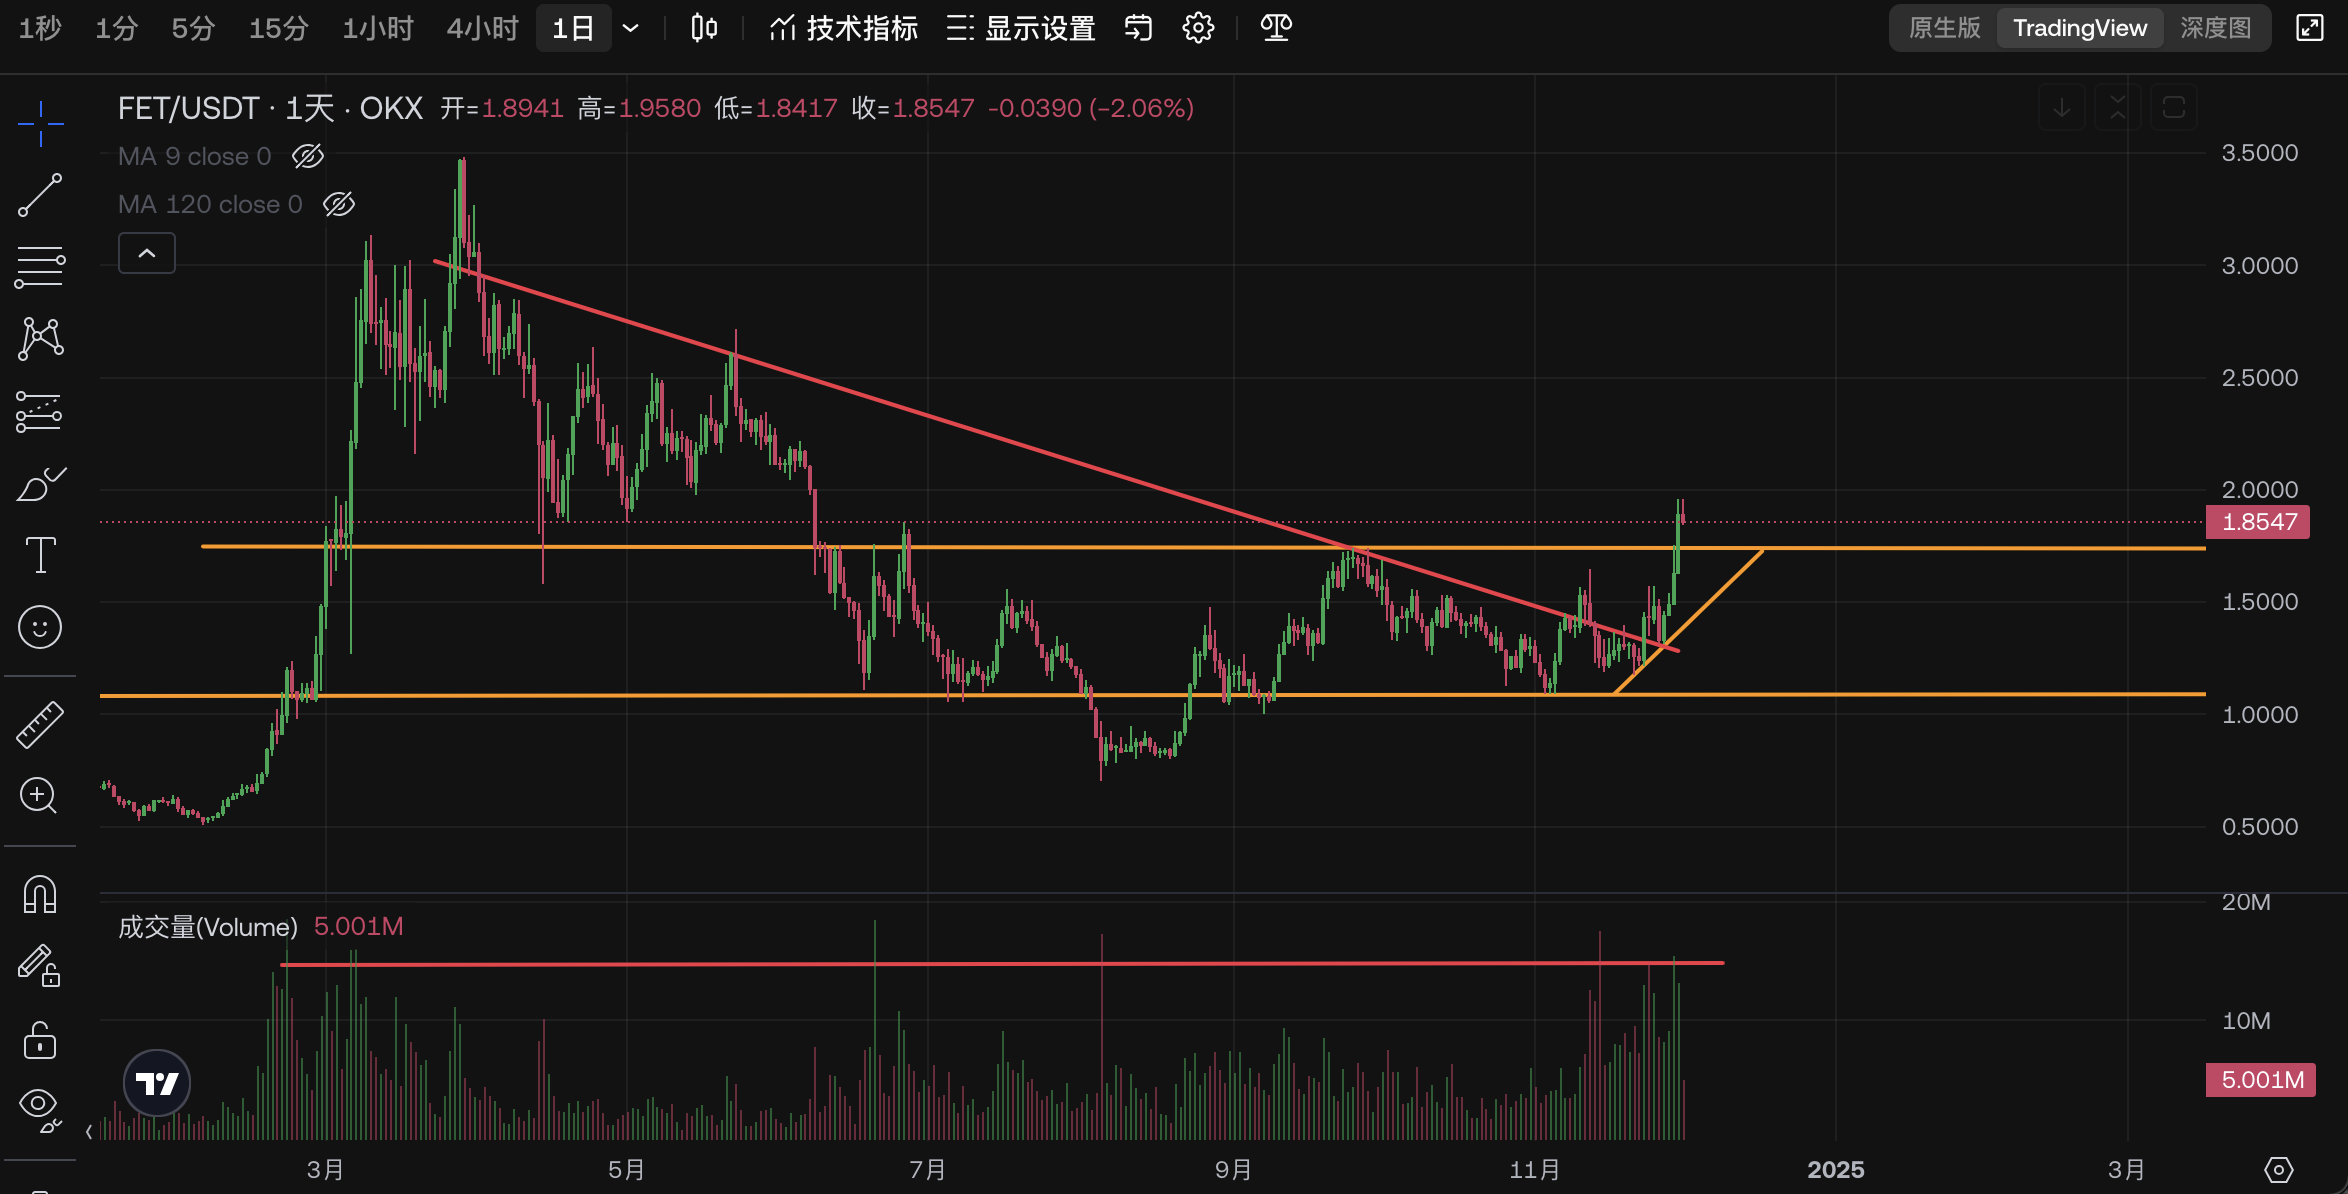
Bullish$FET breakthrough successful; attention signal
After repeated washing near 1.4, the volume has been continuously accumulating; the main force has finally completed the test. The combination of volume and price has broken this oscillation range; from a triangular convergence breakthrough to a box breakthrough;
The structure is already in place, and the next market evolution will combine with your own signals: enter at the 1h level; need to form a small intermediary structure again
1) Price oscillates and adjusts, without breaking the current trend line; wait until the price breaks the previous high point to enter
2) Deep pullback; but does not break the upper boundary of the box; at the same time, during the pullback process, there cannot be a situation where the low points keep getting lower
My plan is to only enter when these two situations occur; for other situations, continue to wait
$FET
#领鹰计划
After repeated washing near 1.4, the volume has been continuously accumulating; the main force has finally completed the test. The combination of volume and price has broken this oscillation range; from a triangular convergence breakthrough to a box breakthrough;
The structure is already in place, and the next market evolution will combine with your own signals: enter at the 1h level; need to form a small intermediary structure again
1) Price oscillates and adjusts, without breaking the current trend line; wait until the price breaks the previous high point to enter
2) Deep pullback; but does not break the upper boundary of the box; at the same time, during the pullback process, there cannot be a situation where the low points keep getting lower
My plan is to only enter when these two situations occur; for other situations, continue to wait
$FET
#领鹰计划
1
2.2k
Log in to explore more content
Join global crypto users on Binance Square
⚡️ Get latest and useful information about crypto.
💬 Trusted by the world’s largest crypto exchange.
👍 Discover real insights from verified creators.
Email / Phone number
Trending Topics
USContinuingJoblessClaims1.774M
207 views
41 Discussing
US Continuing Jobless Claims hit 1.774M — and crypto traders should pay attention.
📉 A rise in continuing jobless claims suggests more Americans are staying unemployed for longer. That can reinforce concerns about a cooling labor market—potentially increasing expectations for easier monetary policy, but also raising recession-risk headlines.
For crypto, the reaction can be mixed:
Risk-on angle: Softer labor data may support hopes of looser liquidity conditions.
Risk-off angle: If growth fears intensify, traders may reduce exposure to volatile assets first.
Key takeaway: Watch how $BTC , the U.S. dollar, Treasury yields, and equity futures react together—not the headline alone.
Macro data can shift sentiment quickly, but one report does not define the trend. Volatility may rise around follow-up inflation and Fed signals.
#USContinuingJoblessClaims1.774M
#cryptomarket #CryptoNewss
Marilee Martell a0k
·0 Likes
·13 views
USAugustPPIYoYRisesTo5.4%
232 views
36 Discussing
AppleDebutsFoldablePhone
55,259 views
1,081 Discussing