
Leo524
757 Posts

Leo524
Report
Block User
👉Leo524 👈
Trade With Confidence ✔

DOT Holder
High-Frequency Trader
3.5 Years
1 Following
1.5K+ Followers
4.6K+ Liked
Posts
All
Quotes
Videos
PINNED
·
--
One week. One big milestone 📈💚
Proud of the progress we’ve made with LEO524. Seeing the account grow by 111%+ over the past week is a great feeling.
Every move comes with lessons, and every result reminds me why patience, discipline, and consistency matter.
Grateful for the journey. More work ahead, and we keep moving forward. 🚀
#CryptoTrading. g #tradingjourney #Leo524 #BinanceSquare #EarningsSeason
One week. One big milestone 📈💚
Proud of the progress we’ve made with LEO524. Seeing the account grow by 111%+ over the past week is a great feeling.
Every move comes with lessons, and every result reminds me why patience, discipline, and consistency matter.
Grateful for the journey. More work ahead, and we keep moving forward. 🚀
#CryptoTrading. g #tradingjourney #Leo524 #BinanceSquare #EarningsSeason
Proud of the progress we’ve made with LEO524. Seeing the account grow by 111%+ over the past week is a great feeling.
Every move comes with lessons, and every result reminds me why patience, discipline, and consistency matter.
Grateful for the journey. More work ahead, and we keep moving forward. 🚀
#CryptoTrading. g #tradingjourney #Leo524 #BinanceSquare #EarningsSeason
16
18
3.8k
·
--
Bearish
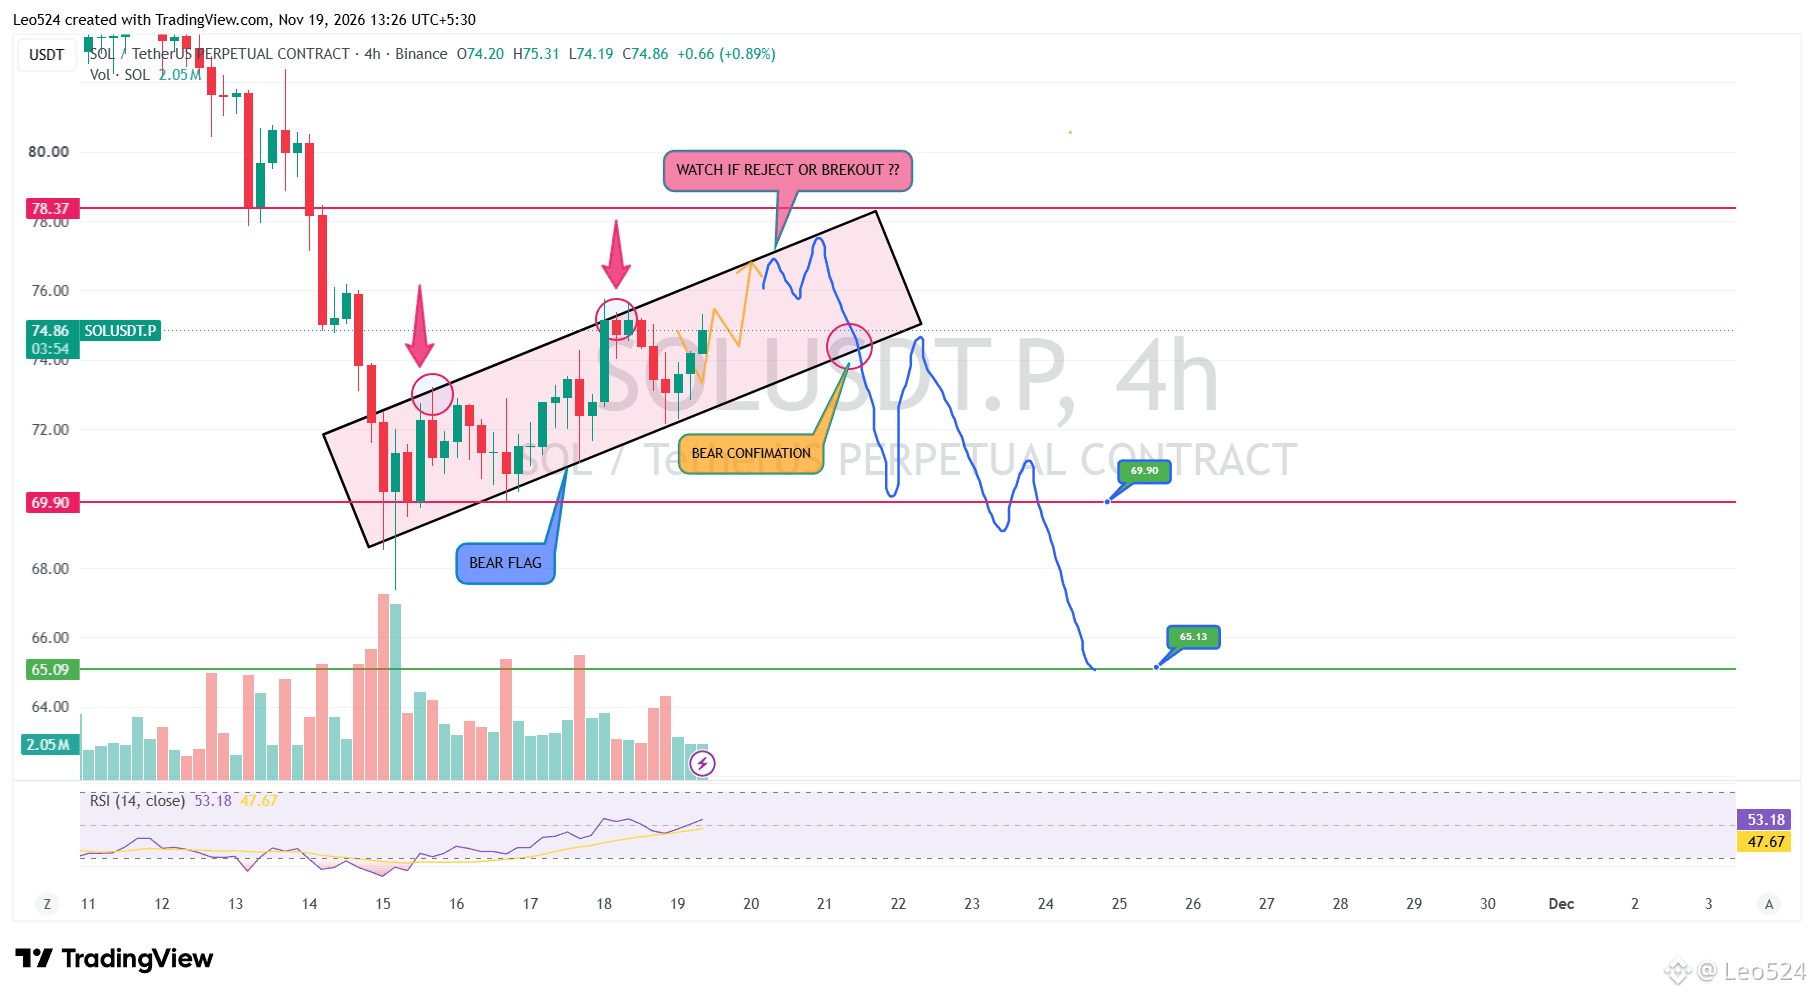
$SOL IS BUILDING A BEAR FLAG. ANOTHER LEG DOWN LOADING? 📉
Solana has already experienced a sharp sell-off, with sellers clearly dominating the market. Since then, price has been recovering slowly inside an ascending channel on the 4H chart.
This looks like a classic Bear Flag formation, where the market pauses and retraces before potentially continuing in the direction of the previous trend.
I'm watching the upper side of this structure closely. If price reaches the resistance area and gets rejected, followed by a strong bearish breakdown of the channel, that could be the confirmation I'm waiting for to enter a short position.
My downside target is around $65, with $69.90 being an important level to watch along the way. For now, I'm waiting for price action to confirm the next move. 🔥
{spot}(SOLUSDT)
$SOL IS BUILDING A BEAR FLAG. ANOTHER LEG DOWN LOADING? 📉
Solana has already experienced a sharp sell-off, with sellers clearly dominating the market. Since then, price has been recovering slowly inside an ascending channel on the 4H chart.
This looks like a classic Bear Flag formation, where the market pauses and retraces before potentially continuing in the direction of the previous trend.
I'm watching the upper side of this structure closely. If price reaches the resistance area and gets rejected, followed by a strong bearish breakdown of the channel, that could be the confirmation I'm waiting for to enter a short position.
My downside target is around $65, with $69.90 being an important level to watch along the way. For now, I'm waiting for price action to confirm the next move. 🔥
Solana has already experienced a sharp sell-off, with sellers clearly dominating the market. Since then, price has been recovering slowly inside an ascending channel on the 4H chart.
This looks like a classic Bear Flag formation, where the market pauses and retraces before potentially continuing in the direction of the previous trend.
I'm watching the upper side of this structure closely. If price reaches the resistance area and gets rejected, followed by a strong bearish breakdown of the channel, that could be the confirmation I'm waiting for to enter a short position.
My downside target is around $65, with $69.90 being an important level to watch along the way. For now, I'm waiting for price action to confirm the next move. 🔥
5
3
8
8.9k

·
--
$BTC I'm Not Looking for Longs Here !
BTC is still trading below the major downtrend line, and I'm not interested in opening long positions at the current level. My focus is on a possible relief bounce towards the red supply zone. If price reaches that area and shows a clear rejection, I'll consider opening a short position as a swing trade.
If the rejection plays out, BTC could see another major move down, with $56K–$57K as my next downside target. The bearish idea becomes invalid if BTC breaks above $81.1K. Until then, I'm waiting for the right setup rather than forcing a long entry.
$BTC I'm Not Looking for Longs Here !
BTC is still trading below the major downtrend line, and I'm not interested in opening long positions at the current level. My focus is on a possible relief bounce towards the red supply zone. If price reaches that area and shows a clear rejection, I'll consider opening a short position as a swing trade.
If the rejection plays out, BTC could see another major move down, with $56K–$57K as my next downside target. The bearish idea becomes invalid if BTC breaks above $81.1K. Until then, I'm waiting for the right setup rather than forcing a long entry.
BTC is still trading below the major downtrend line, and I'm not interested in opening long positions at the current level. My focus is on a possible relief bounce towards the red supply zone. If price reaches that area and shows a clear rejection, I'll consider opening a short position as a swing trade.
If the rejection plays out, BTC could see another major move down, with $56K–$57K as my next downside target. The bearish idea becomes invalid if BTC breaks above $81.1K. Until then, I'm waiting for the right setup rather than forcing a long entry.
5
130
17.2k
·
--
Bullish
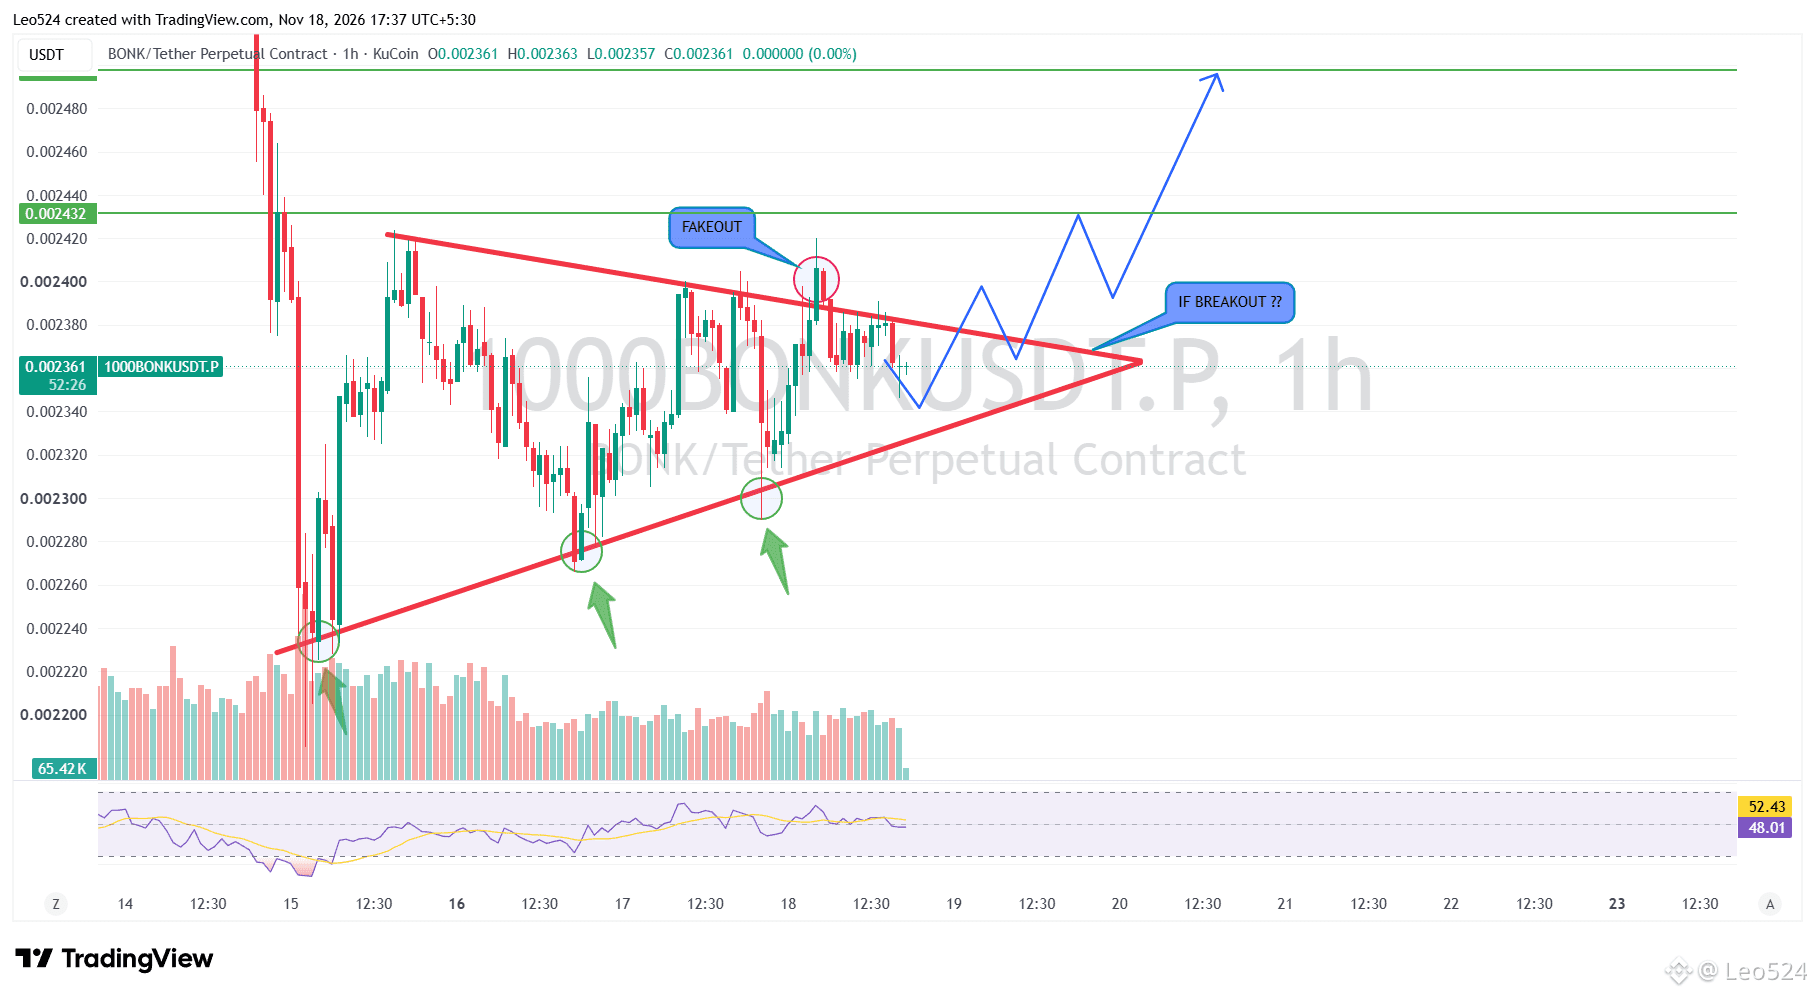
$BONK BIG MOVE COMING? 👀
BONK is forming a Symmetrical Wedge on the 1H chart, with higher lows and lower highs squeezing price into a tighter range. We already saw one breakout attempt, but it turned into a fakeout, bringing price back inside the pattern.
A confirmed breakout above the upper trendline could trigger a bullish move towards the next resistance zones. However, a breakdown below the lower trendline could open the door for further downside. The next confirmed move will be important!
{spot}(BONKUSDT)
$BONK BIG MOVE COMING? 👀
BONK is forming a Symmetrical Wedge on the 1H chart, with higher lows and lower highs squeezing price into a tighter range. We already saw one breakout attempt, but it turned into a fakeout, bringing price back inside the pattern.
A confirmed breakout above the upper trendline could trigger a bullish move towards the next resistance zones. However, a breakdown below the lower trendline could open the door for further downside. The next confirmed move will be important!
BONK is forming a Symmetrical Wedge on the 1H chart, with higher lows and lower highs squeezing price into a tighter range. We already saw one breakout attempt, but it turned into a fakeout, bringing price back inside the pattern.
A confirmed breakout above the upper trendline could trigger a bullish move towards the next resistance zones. However, a breakdown below the lower trendline could open the door for further downside. The next confirmed move will be important!
1
1.3k
·
--
Bullish
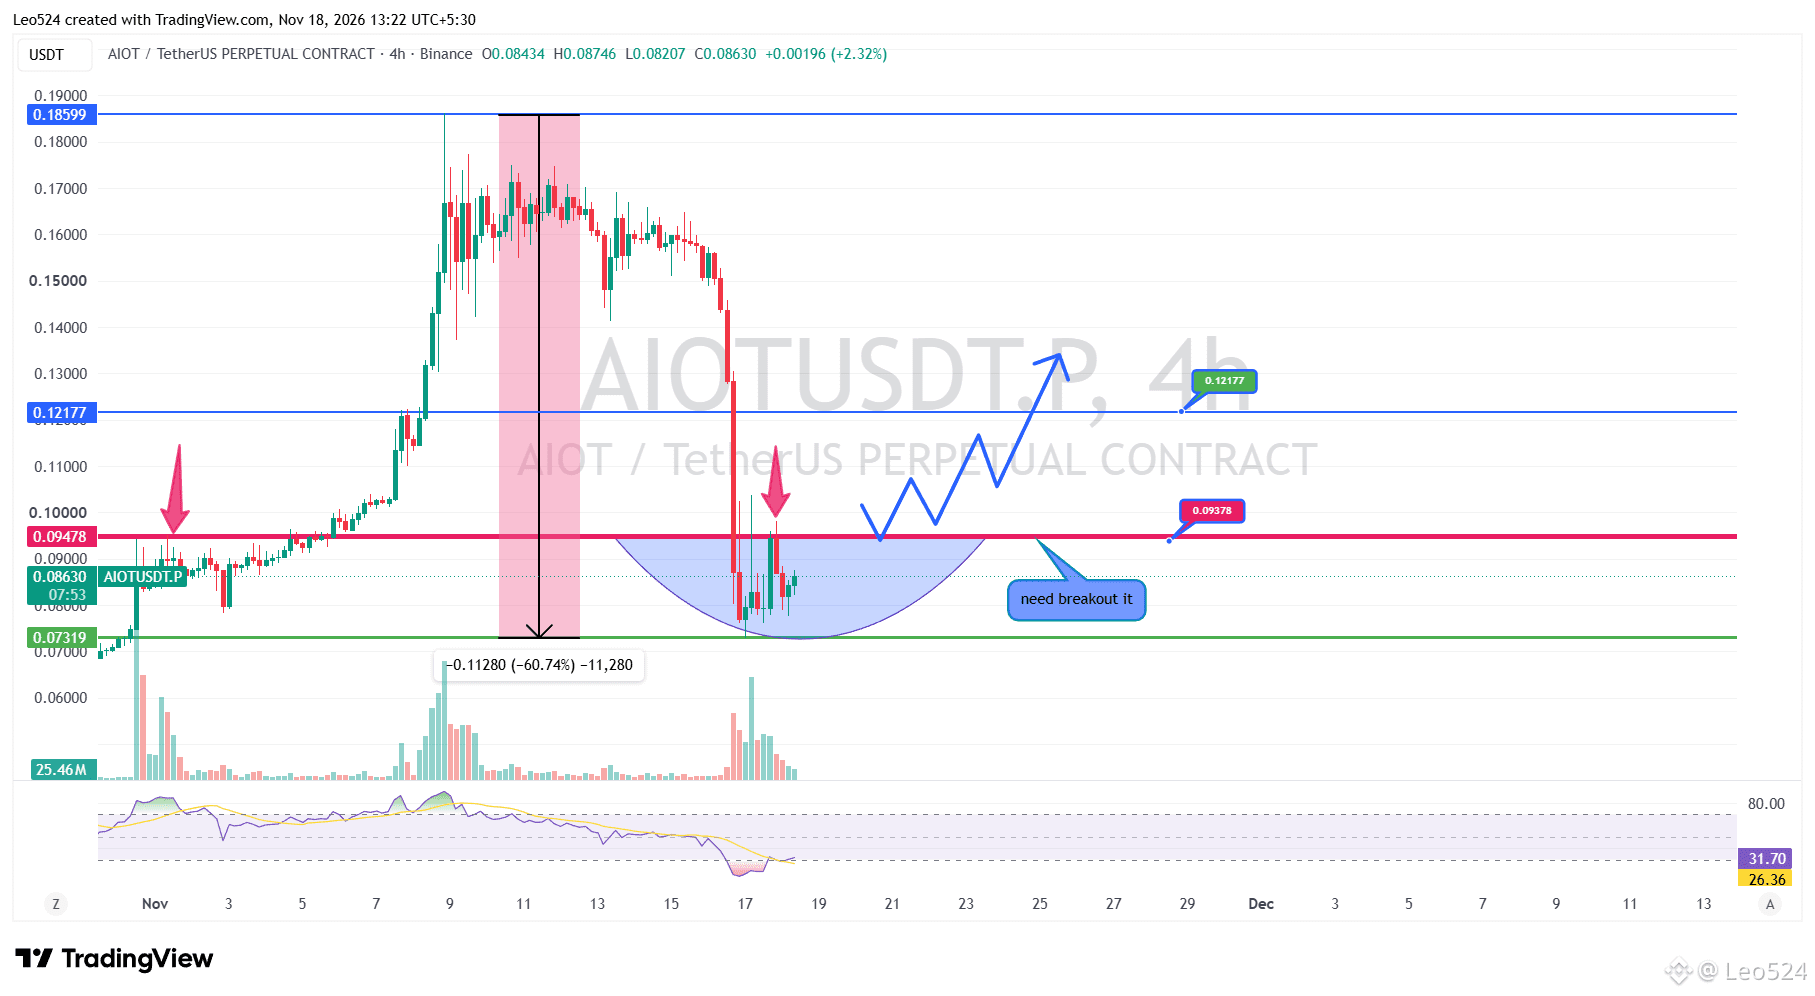
$AIOT Massive Dump Is Over. Is a Strong Recovery Next ..?
AIOT experienced a massive pump from the $0.07 area towards $0.18, followed by a sharp correction of nearly 60%. However, price is now showing signs of a possible recovery after reacting strongly around the $0.073 support zone. The recent bullish rejection is interesting, as buyers are starting to defend this area. Price is also attempting to form a rounded bottom structure on the 4H chart.
But there is one important level to watch: $0.09478 (red resistance zone). For the bullish recovery to gain strength, AIOT needs a strong bullish candle to break and close above this resistance. Without that breakout, another rejection is still possible. If buyers successfully reclaim this level, the next important upside area is around $0.12177. For now, the breakout confirmation is what matters most.
{future}(AIOTUSDT)
$AIOT Massive Dump Is Over. Is a Strong Recovery Next ..?
AIOT experienced a massive pump from the $0.07 area towards $0.18, followed by a sharp correction of nearly 60%. However, price is now showing signs of a possible recovery after reacting strongly around the $0.073 support zone. The recent bullish rejection is interesting, as buyers are starting to defend this area. Price is also attempting to form a rounded bottom structure on the 4H chart.
But there is one important level to watch: $0.09478 (red resistance zone). For the bullish recovery to gain strength, AIOT needs a strong bullish candle to break and close above this resistance. Without that breakout, another rejection is still possible. If buyers successfully reclaim this level, the next important upside area is around $0.12177. For now, the breakout confirmation is what matters most.
AIOT experienced a massive pump from the $0.07 area towards $0.18, followed by a sharp correction of nearly 60%. However, price is now showing signs of a possible recovery after reacting strongly around the $0.073 support zone. The recent bullish rejection is interesting, as buyers are starting to defend this area. Price is also attempting to form a rounded bottom structure on the 4H chart.
But there is one important level to watch: $0.09478 (red resistance zone). For the bullish recovery to gain strength, AIOT needs a strong bullish candle to break and close above this resistance. Without that breakout, another rejection is still possible. If buyers successfully reclaim this level, the next important upside area is around $0.12177. For now, the breakout confirmation is what matters most.
2
937

·
--
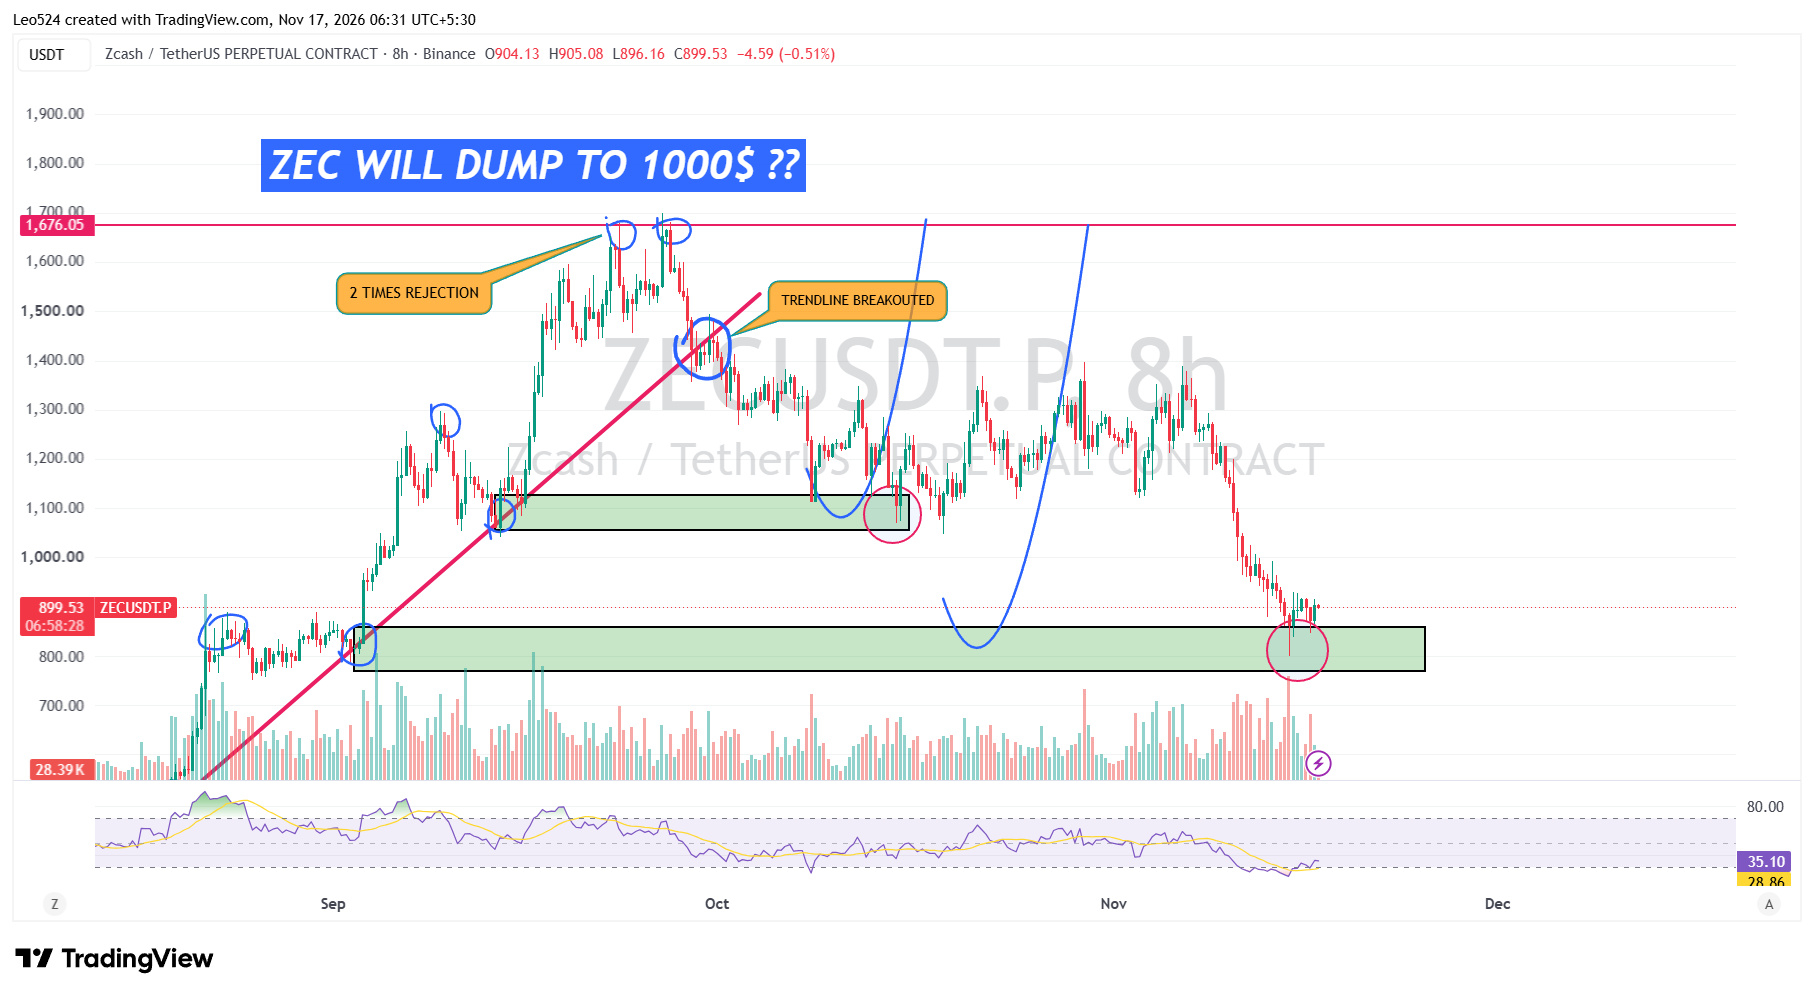
$ZEC – Watching the Second Support Zone Closely
As expected, $ZEC experienced a massive correction, dropping from around $1,300 to $800. Price is now consolidating near the second support zone I had previously marked on the chart.
However, a bullish reversal is still not confirmed. The key thing to watch now is whether buyers can defend this support and push price higher. Pay close attention to how price reacts here, as a breakdown or a successful hold could determine the next major move.
Stay focused on this level. Confirmation is still needed before considering a bullish reversal.
{spot}(ZECUSDT)
$ZEC – Watching the Second Support Zone Closely
As expected, $ZEC experienced a massive correction, dropping from around $1,300 to $800. Price is now consolidating near the second support zone I had previously marked on the chart.
However, a bullish reversal is still not confirmed. The key thing to watch now is whether buyers can defend this support and push price higher. Pay close attention to how price reacts here, as a breakdown or a successful hold could determine the next major move.
Stay focused on this level. Confirmation is still needed before considering a bullish reversal.
As expected, $ZEC experienced a massive correction, dropping from around $1,300 to $800. Price is now consolidating near the second support zone I had previously marked on the chart.
However, a bullish reversal is still not confirmed. The key thing to watch now is whether buyers can defend this support and push price higher. Pay close attention to how price reacts here, as a breakdown or a successful hold could determine the next major move.
Stay focused on this level. Confirmation is still needed before considering a bullish reversal.
Leo524
·
--
$ZEC $1,000 Next? 👀
Guys, ZEC is looking pretty interesting here.
We’ve already seen 2 strong rejections around the $1,650 area, and now the main uptrend has been broken. Price is struggling to get back above that trendline.
On top of that, Zcash ETF just recorded its first weekly outflow — $93.6M. That adds some pressure to the setup.
I’m watching the $1,050–$1,130 zone closely. If that breaks, the next big support is around $770–$860.
If ZEC reclaims the broken trendline with strength, this whole bearish setup can change.
#ZcashETFPostsFirstWeeklyOutflow$93.6M #ZEC #Leo524
Guys, ZEC is looking pretty interesting here.
We’ve already seen 2 strong rejections around the $1,650 area, and now the main uptrend has been broken. Price is struggling to get back above that trendline.
On top of that, Zcash ETF just recorded its first weekly outflow — $93.6M. That adds some pressure to the setup.
I’m watching the $1,050–$1,130 zone closely. If that breaks, the next big support is around $770–$860.
If ZEC reclaims the broken trendline with strength, this whole bearish setup can change.
#ZcashETFPostsFirstWeeklyOutflow$93.6M #ZEC #Leo524
2
422

·
--
Bearish
$ETH am i right ..? 🔥
{spot}(ETHUSDT)
$ETH am i right ..? 🔥
Leo524
·
--
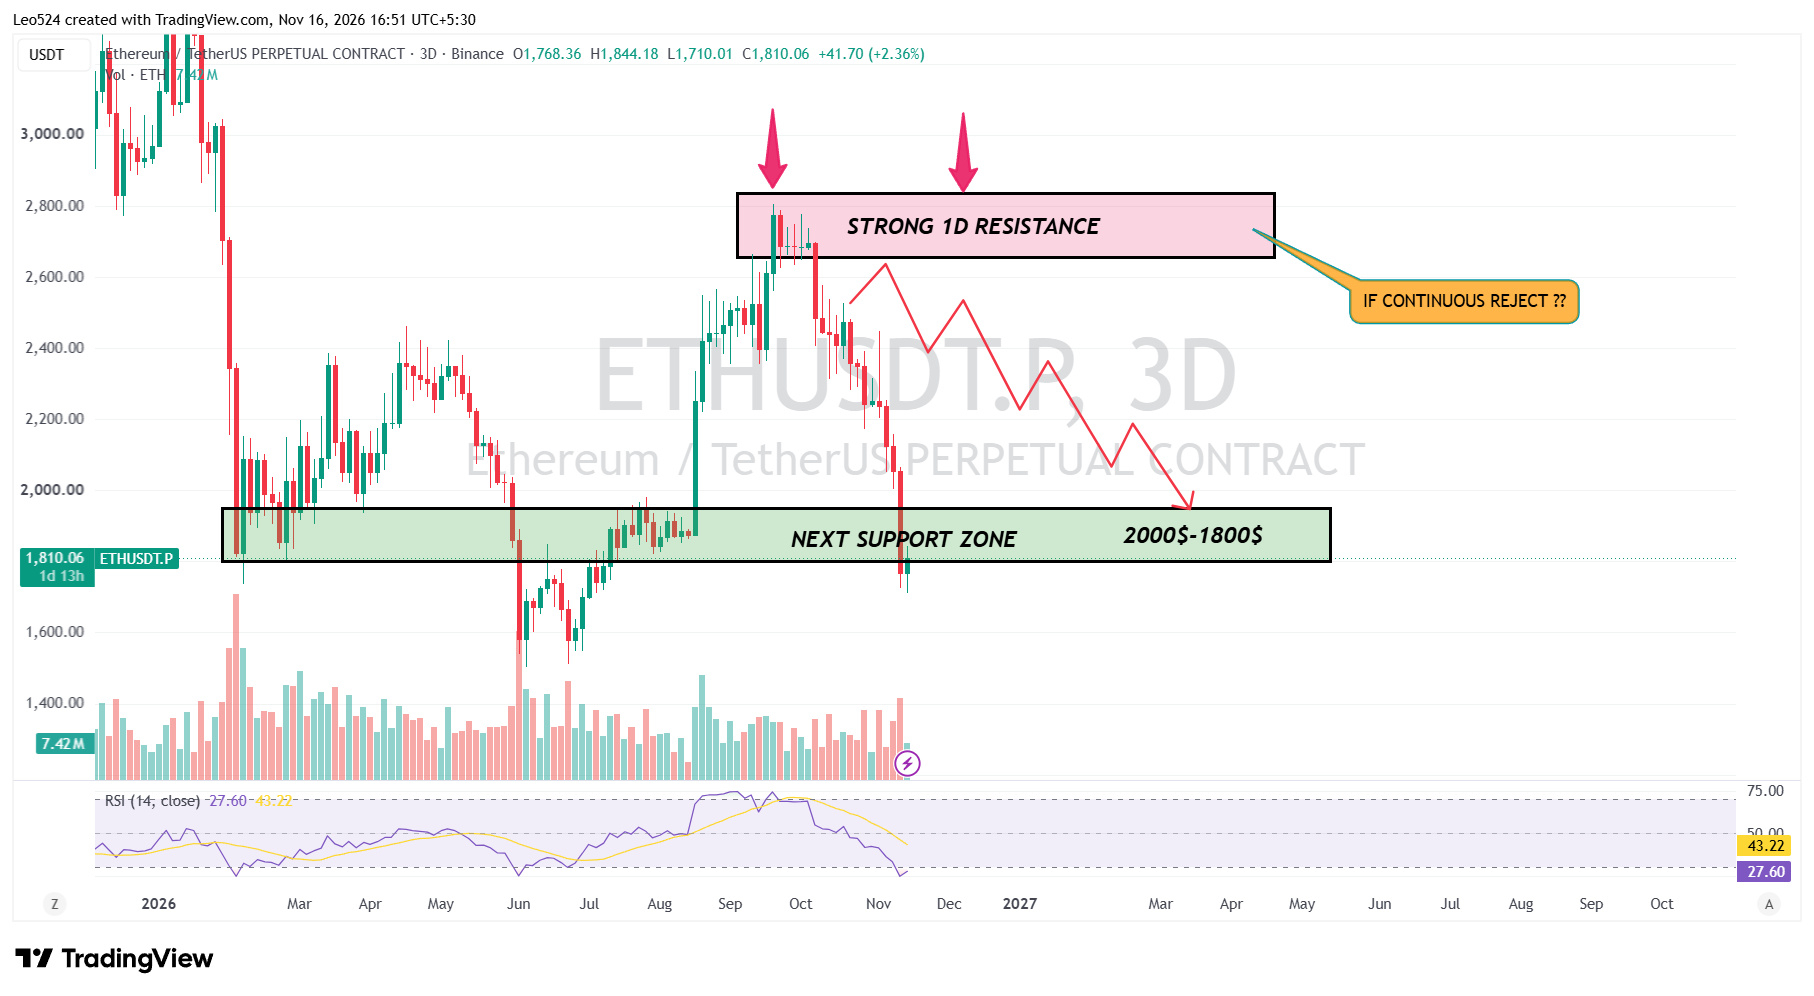
$ETH FACES A DOUBLE WARNING !
$ETH just got another warning sign. U.S. Spot ETH ETFs recorded $160.9M in net outflows on October 7, extending the outflow streak to 7 consecutive trading days. Over the last 5 sessions, outflows reached about $506.4M.
At the same time, ETH is struggling around the $2,650–$2,800 resistance area shown in my 3D analysis.
Multiple rejections here could keep pressure on ETH.
If sellers remain in control, I’m watching the $2,000–$1,800 support zone.
But a clean breakout above the resistance could change the setup
#EthereumSpotETFRecords$161MNetOutflows
$ETH just got another warning sign. U.S. Spot ETH ETFs recorded $160.9M in net outflows on October 7, extending the outflow streak to 7 consecutive trading days. Over the last 5 sessions, outflows reached about $506.4M.
At the same time, ETH is struggling around the $2,650–$2,800 resistance area shown in my 3D analysis.
Multiple rejections here could keep pressure on ETH.
If sellers remain in control, I’m watching the $2,000–$1,800 support zone.
But a clean breakout above the resistance could change the setup
#EthereumSpotETFRecords$161MNetOutflows
1
169
·
--
Bullish
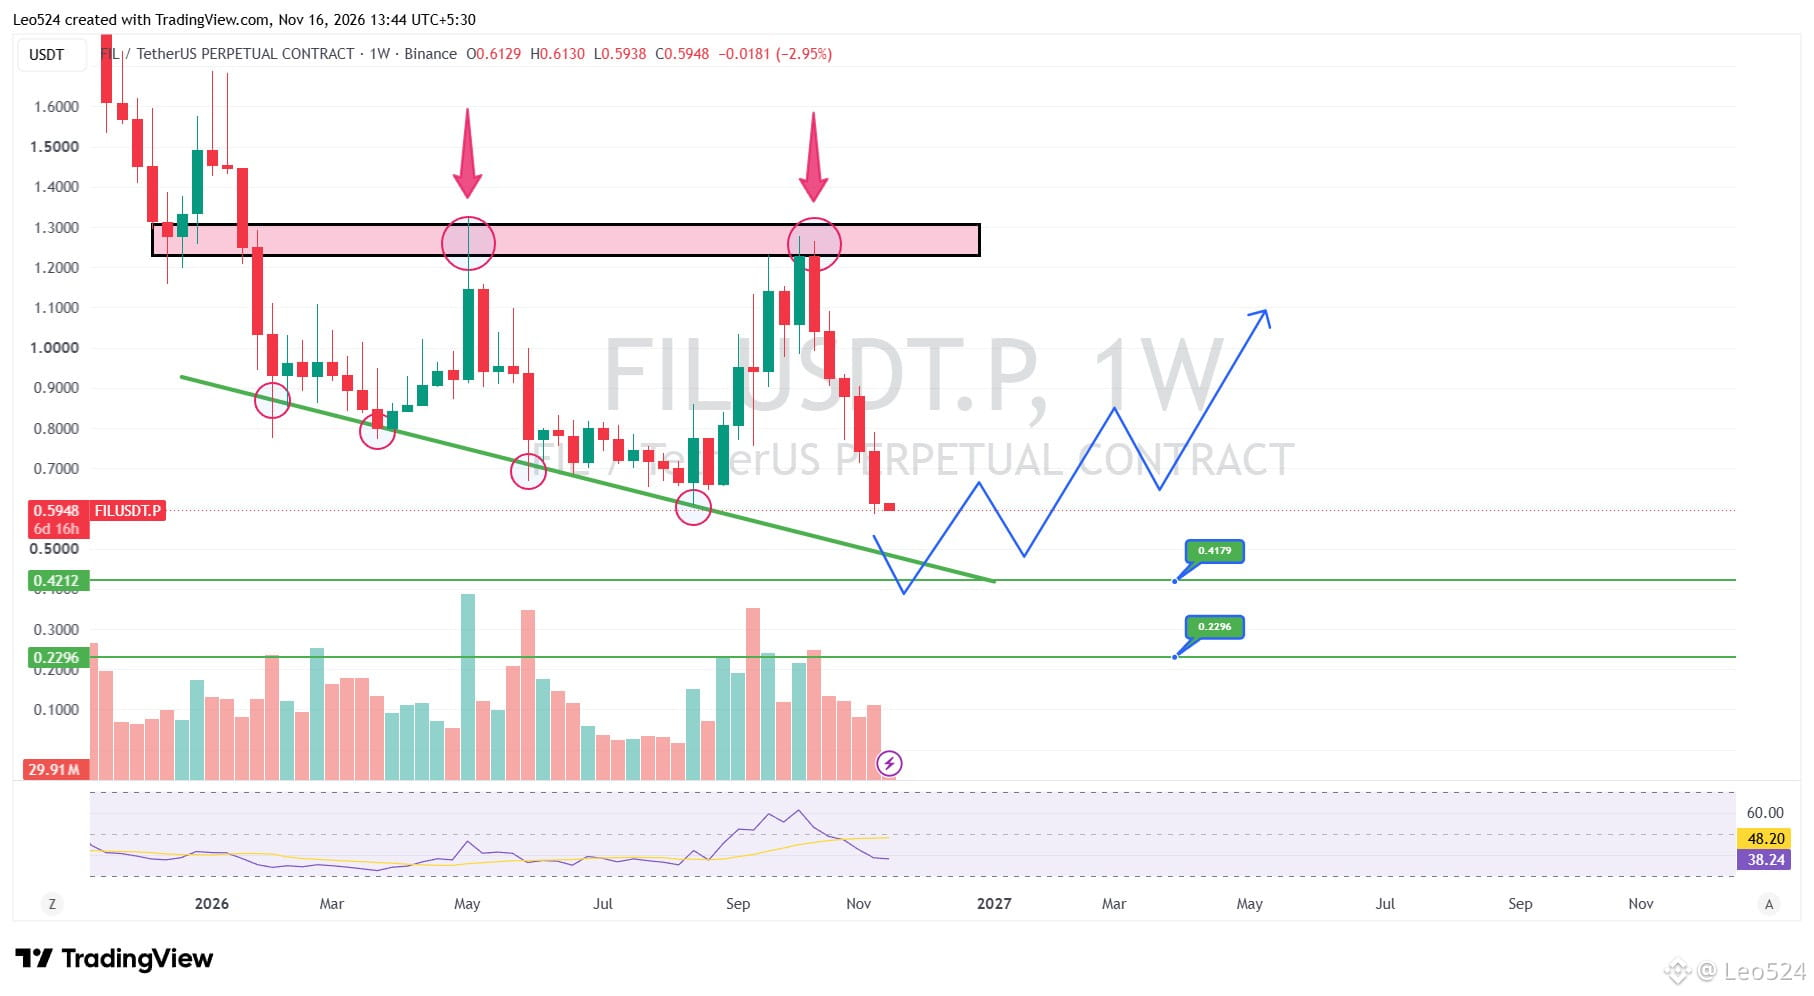
$FIL Is This the Beginning of a Major Reversal?
Filecoin (FIL) is facing continued selling pressure, recently dropping around 6% amid a broader crypto market selloff. According to the latest market report, this decline appears to be driven mainly by overall market weakness rather than Filecoin-specific negative developments. However, the weekly chart is still showing a clear bearish structure, with price continuing to form lower highs and lower lows.
FIL is now approaching an important support area around $0.42, which also aligns with the descending trendline. If buyers manage to defend this zone, we could see a relief rally and potentially the beginning of a larger recovery. The first major resistance sits around $1.23–$1.30, where previous rallies faced strong selling pressure.
A bullish reversal is still not confirmed. We need to see strong buying pressure, a break of the current lower-high structure, and LTF confirmation before considering a sustainable recovery. If the support fails, further downside remains possible. For now, $0.42 is the key level to watch.
#fil #Filecoin #CryptoAnalysis #Leo524
Analysis by LEO524
{spot}(FILUSDT)
$FIL Is This the Beginning of a Major Reversal?
Filecoin (FIL) is facing continued selling pressure, recently dropping around 6% amid a broader crypto market selloff. According to the latest market report, this decline appears to be driven mainly by overall market weakness rather than Filecoin-specific negative developments. However, the weekly chart is still showing a clear bearish structure, with price continuing to form lower highs and lower lows.
FIL is now approaching an important support area around $0.42, which also aligns with the descending trendline. If buyers manage to defend this zone, we could see a relief rally and potentially the beginning of a larger recovery. The first major resistance sits around $1.23–$1.30, where previous rallies faced strong selling pressure.
A bullish reversal is still not confirmed. We need to see strong buying pressure, a break of the current lower-high structure, and LTF confirmation before considering a sustainable recovery. If the support fails, further downside remains possible. For now, $0.42 is the key level to watch.
#fil #Filecoin #CryptoAnalysis #Leo524
Analysis by LEO524
Filecoin (FIL) is facing continued selling pressure, recently dropping around 6% amid a broader crypto market selloff. According to the latest market report, this decline appears to be driven mainly by overall market weakness rather than Filecoin-specific negative developments. However, the weekly chart is still showing a clear bearish structure, with price continuing to form lower highs and lower lows.
FIL is now approaching an important support area around $0.42, which also aligns with the descending trendline. If buyers manage to defend this zone, we could see a relief rally and potentially the beginning of a larger recovery. The first major resistance sits around $1.23–$1.30, where previous rallies faced strong selling pressure.
A bullish reversal is still not confirmed. We need to see strong buying pressure, a break of the current lower-high structure, and LTF confirmation before considering a sustainable recovery. If the support fails, further downside remains possible. For now, $0.42 is the key level to watch.
#fil #Filecoin #CryptoAnalysis #Leo524
Analysis by LEO524
5
5
9.8k
·
--
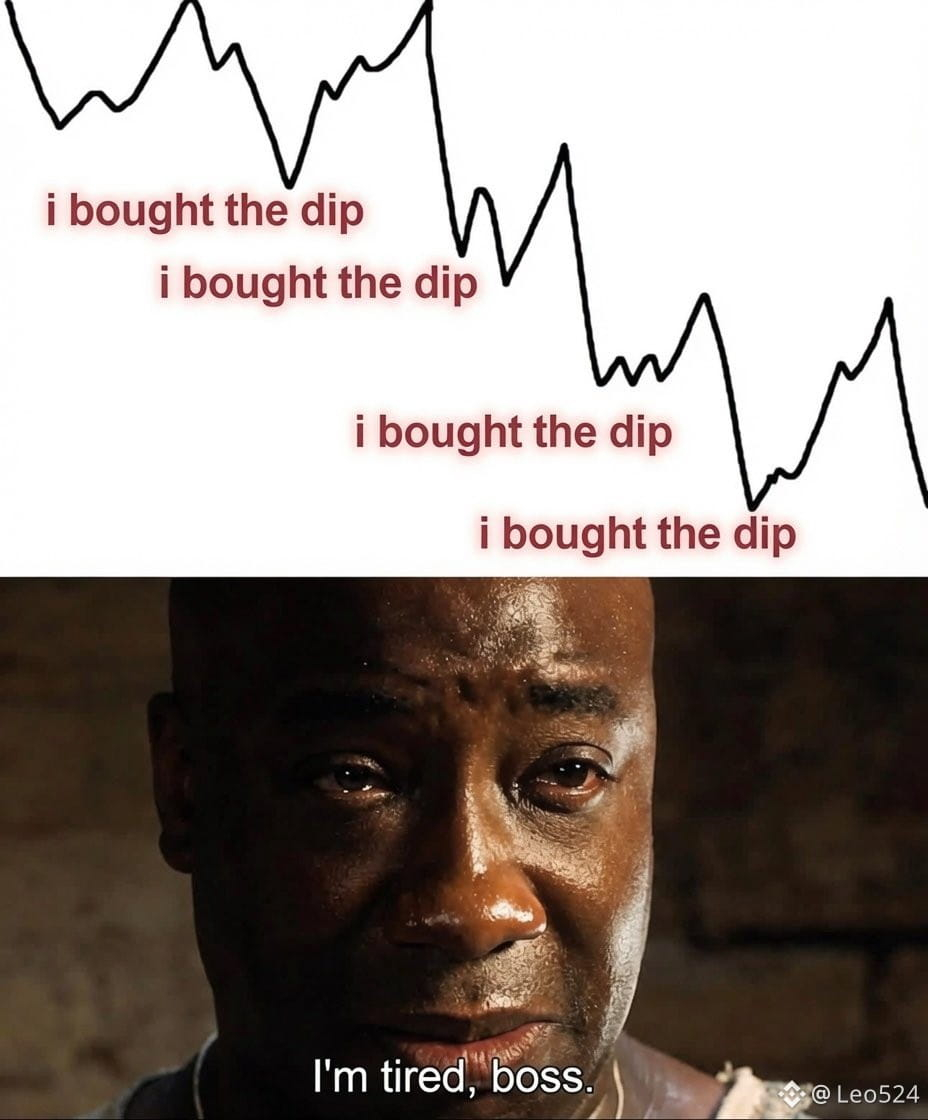
Stop opening long trades on every dip. Wait for a bullish reversal accompanied by a solid liquidity sweep before entering long positions. Alternatively, simply respect the trend.
Stop opening long trades on every dip. Wait for a bullish reversal accompanied by a solid liquidity sweep before entering long positions. Alternatively, simply respect the trend.
2
537
·
--
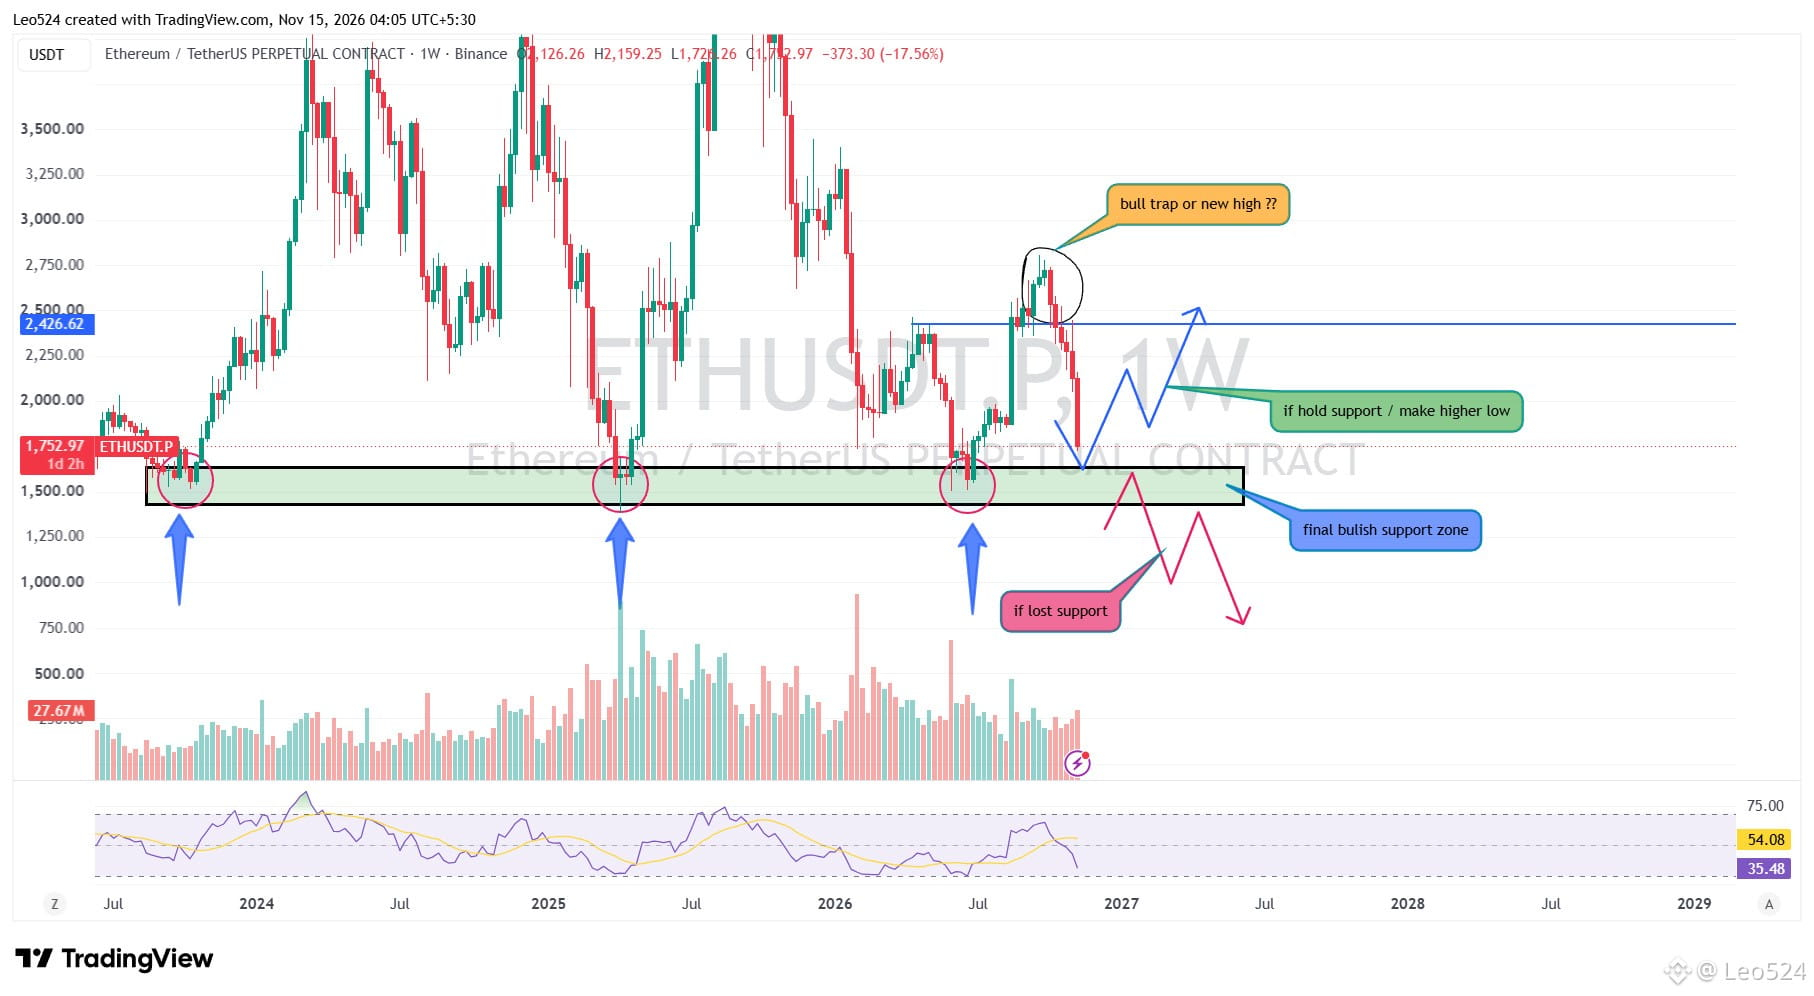
$ETH WEEKLY: BULL TRAP OR THE START OF A NEW HIGHER LOW? 👀
Ethereum is approaching a critical weekly support zone around $1,430–$1,630, a level that has repeatedly attracted buyers in the past. The recent bounce toward $2,700 failed to hold, and ETH is now back near $1,750. This makes the current reaction extremely important for the bigger picture.
If buyers manage to defend this support and ETH starts building a higher low, we could see another recovery attempt toward $2,400 resistance. A breakout above that level would strengthen the bullish structure and open the door for a larger reversal. However, the recent bounce could still be a bull trap if buyers fail to reclaim key resistance.
**This is a major decision zone for ETH.** Holding support could create the foundation for a new bullish structure, while a clean weekly breakdown would weaken the entire recovery scenario. The next move around this zone could define Ethereum's direction for the coming weeks.
Analysis by LEO524
$ETH WEEKLY: BULL TRAP OR THE START OF A NEW HIGHER LOW? 👀
Ethereum is approaching a critical weekly support zone around $1,430–$1,630, a level that has repeatedly attracted buyers in the past. The recent bounce toward $2,700 failed to hold, and ETH is now back near $1,750. This makes the current reaction extremely important for the bigger picture.
If buyers manage to defend this support and ETH starts building a higher low, we could see another recovery attempt toward $2,400 resistance. A breakout above that level would strengthen the bullish structure and open the door for a larger reversal. However, the recent bounce could still be a bull trap if buyers fail to reclaim key resistance.
**This is a major decision zone for ETH.** Holding support could create the foundation for a new bullish structure, while a clean weekly breakdown would weaken the entire recovery scenario. The next move around this zone could define Ethereum's direction for the coming weeks.
Analysis by LEO524
Ethereum is approaching a critical weekly support zone around $1,430–$1,630, a level that has repeatedly attracted buyers in the past. The recent bounce toward $2,700 failed to hold, and ETH is now back near $1,750. This makes the current reaction extremely important for the bigger picture.
If buyers manage to defend this support and ETH starts building a higher low, we could see another recovery attempt toward $2,400 resistance. A breakout above that level would strengthen the bullish structure and open the door for a larger reversal. However, the recent bounce could still be a bull trap if buyers fail to reclaim key resistance.
**This is a major decision zone for ETH.** Holding support could create the foundation for a new bullish structure, while a clean weekly breakdown would weaken the entire recovery scenario. The next move around this zone could define Ethereum's direction for the coming weeks.
Analysis by LEO524
1
314
·
--
Bearish
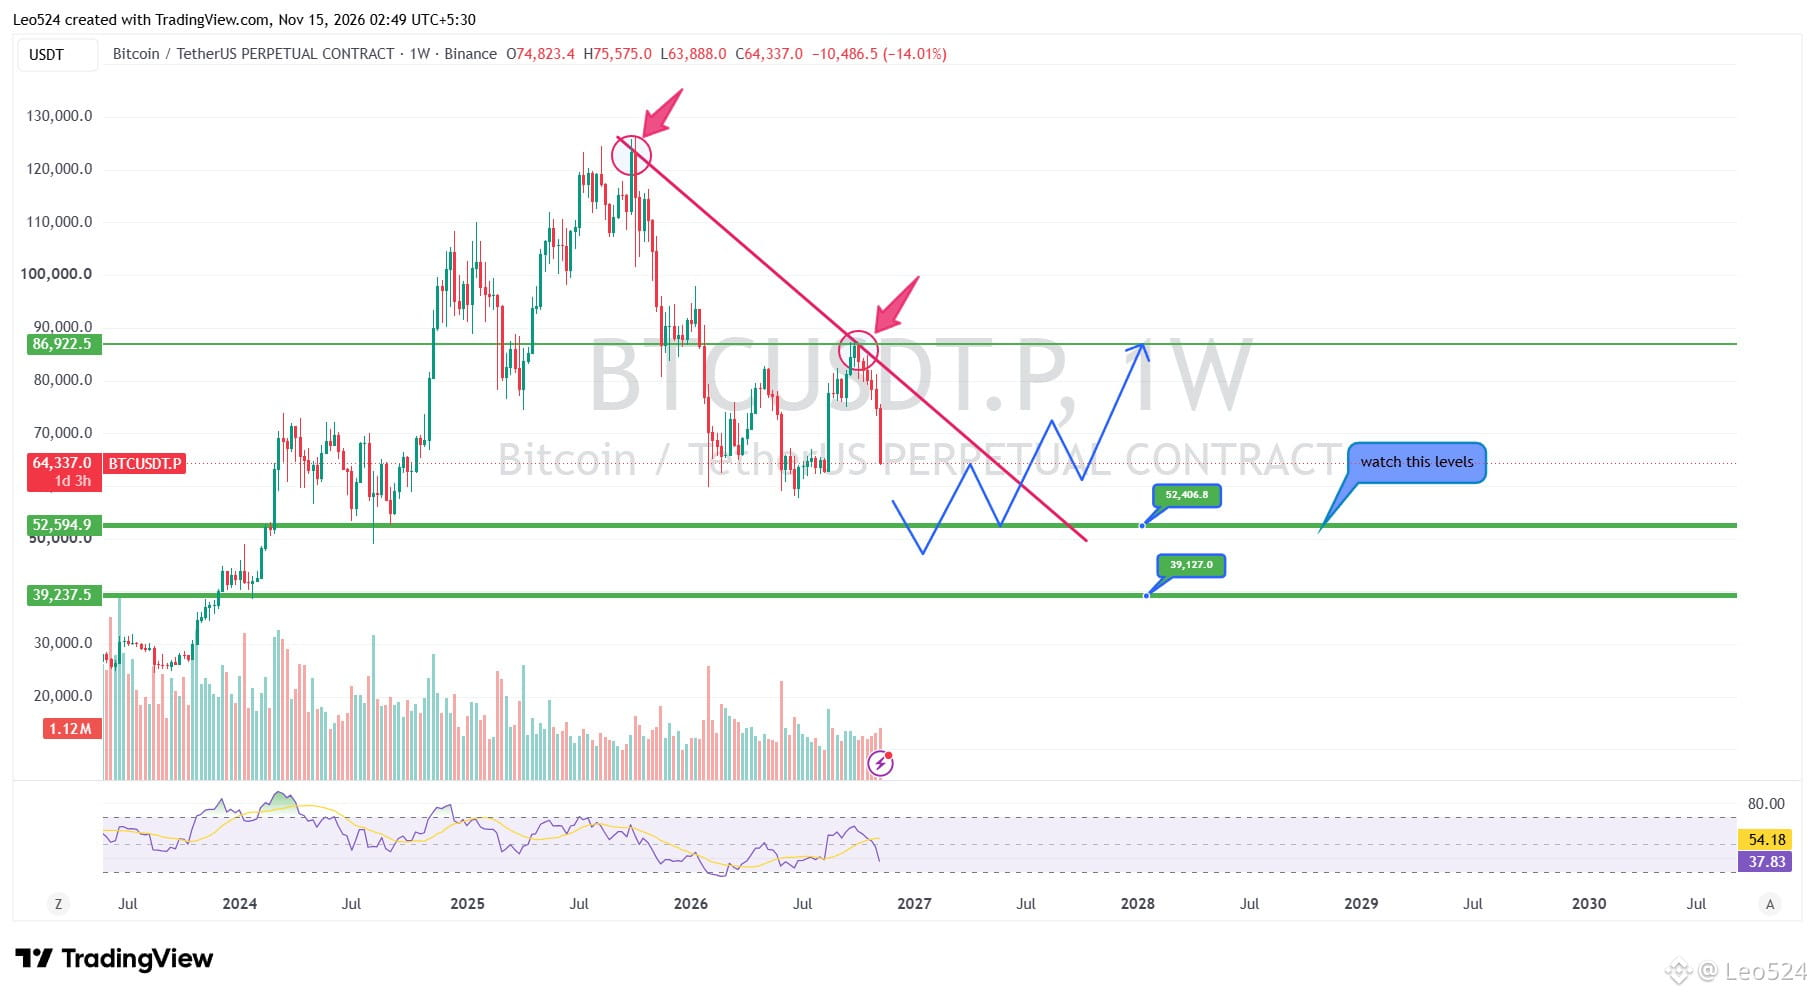
$BTC A MAJOR SUPPORT ZONE COULD DECIDE THE NEXT TREND 🔍
{spot}(BTCUSDT)
Bitcoin is facing serious selling pressure on the weekly chart after rejecting from the $125K region. The market has now returned to a major support zone around $52K, which could become an important area for buyers to defend. RSI is also approaching oversold territory, but that alone is not enough to confirm a reversal.
If Bitcoin manages to hold this support and buyers start showing strength, we could see a recovery attempt toward $86K. However, a bullish reversal is not confirmed yet. Lower timeframe market structure, a strong bullish BOS/CHoCH, and clear buying displacement are important confirmations to watch before expecting a sustained recovery.
The key is simple: support must hold. If Bitcoin loses this zone with strong selling pressure, the next major support sits around $39K. The continuation of an uptrend depends on buyers successfully defending the current support area.
Analysis by LEO524
#BTC #Bitcoin #Crypto #LEO524
$BTC A MAJOR SUPPORT ZONE COULD DECIDE THE NEXT TREND 🔍
Bitcoin is facing serious selling pressure on the weekly chart after rejecting from the $125K region. The market has now returned to a major support zone around $52K, which could become an important area for buyers to defend. RSI is also approaching oversold territory, but that alone is not enough to confirm a reversal.
If Bitcoin manages to hold this support and buyers start showing strength, we could see a recovery attempt toward $86K. However, a bullish reversal is not confirmed yet. Lower timeframe market structure, a strong bullish BOS/CHoCH, and clear buying displacement are important confirmations to watch before expecting a sustained recovery.
The key is simple: support must hold. If Bitcoin loses this zone with strong selling pressure, the next major support sits around $39K. The continuation of an uptrend depends on buyers successfully defending the current support area.
Analysis by LEO524
#BTC #Bitcoin #Crypto #LEO524
Bitcoin is facing serious selling pressure on the weekly chart after rejecting from the $125K region. The market has now returned to a major support zone around $52K, which could become an important area for buyers to defend. RSI is also approaching oversold territory, but that alone is not enough to confirm a reversal.
If Bitcoin manages to hold this support and buyers start showing strength, we could see a recovery attempt toward $86K. However, a bullish reversal is not confirmed yet. Lower timeframe market structure, a strong bullish BOS/CHoCH, and clear buying displacement are important confirmations to watch before expecting a sustained recovery.
The key is simple: support must hold. If Bitcoin loses this zone with strong selling pressure, the next major support sits around $39K. The continuation of an uptrend depends on buyers successfully defending the current support area.
Analysis by LEO524
#BTC #Bitcoin #Crypto #LEO524
1
224
Log in to explore more content
Join global crypto users on Binance Square
⚡️ Get latest and useful information about crypto.
💬 Trusted by the world’s largest crypto exchange.
👍 Discover real insights from verified creators.
Email / Phone number
Trending Topics
IsAnthropic’s$1.5TMarketCapJustified?
9,207 views
74 Discussing
Anthropic Set to Open at $105 in Record Nasdaq Debut
Binance News
·12 Likes
·11.9k views
BTCRemainsUnderPressureAfterHawkishFOMCMinutes
224,334 views
2,035 Discussing
NvidiaBoardReportedlySplitOverHuang’sReturn
108,982 views
1,091 Discussing