

Arthur Academy
69 Posts

Arthur Academy
Report
Block User
Learn about Crypto in Arthur Academy. Simple guide to upgrade your trading skills | Update 2 Articles/day | Follow me on X to find my Airdrop project 🚀
Open Trade
Frequent Trader
5.4 Years
10 Following
185 Followers
97 Liked
Posts
Portfolio
PINNED

Article
How to Identify Entry and Exit PointsMastering the art of identifying entry and exit points is essential for successful cryptocurrency trading. Precise timing can significantly affect your profitability, whether you're a long-term investor or an active trader. This guide explains how to determine optimal entry and exit points using technical analysis, indicators, and market sentiment.
1. Why Entry and Exit Points Matter
Timing your trades involves identifying when to buy (entry) and when to sell (exit) an asset. Correct timing helps:
Maximize profits.Minimize risks.Avoid emotional decision-making by following a structured plan.
2. Identifying Entry Points
A. Support Levels
Support is a price level where an asset tends to stop falling and bounce back.
How to Spot It: Look for historical price levels where the asset has consistently reversed upward.Why It Works: Traders see these levels as good buying opportunities because they often indicate demand.
B. Trend Lines and Breakouts
Trend lines connect a series of price highs or lows to show the overall direction. Breakouts occur when the price crosses a resistance level or a trend line.
How to Use: Buy when the price breaks above a significant resistance level, signaling upward momentum.Caution: Confirm breakouts with indicators like volume to avoid false signals.
C. Indicators for Entry
Moving Averages (MA): A short-term MA crossing above a long-term MA often signals a buying opportunity.Relative Strength Index (RSI): When RSI is below 30 (oversold), it may indicate a good entry point.
3. Identifying Exit Points
A. Resistance Levels
Resistance is a price level where an asset tends to stop rising and reverse downward.
How to Spot It: Look for historical price levels where the asset has consistently reversed downward.Why It Works: Traders often sell at these levels to lock in profits, creating a self-fulfilling price drop.
B. Risk-Reward Ratio
Determine your risk-reward ratio before entering a trade.
Example: If your risk is $100, aim for a reward of at least $200 (2:1 ratio).How to Exit: Close your trade when the price reaches your predefined target.
C. Indicators for Exit
Bollinger Bands: When the price reaches the upper band, it might be overbought and a good time to sell.RSI: When RSI is above 70 (overbought), it may signal a good exit point.
4. Using Stop-Loss and Take-Profit Orders
Stop-Loss Orders
Automatically close your position if the price falls to a certain level, limiting potential losses.
How to Set: Place your stop-loss below a key support level.Example: If you buy Bitcoin at $30,000, set a stop-loss at $28,000 to cap your loss.
Take-Profit Orders
Automatically close your position when the price hits your desired profit level.
How to Set: Place it just below a resistance level or based on your risk-reward ratio.Example: If your target is a 10% profit, set your take-profit at $33,000.
5. Combining Indicators for Better Accuracy
Using multiple tools together can improve the accuracy of your entry and exit points:
Volume and Trend Lines: Combine breakouts with rising volume to confirm momentum.RSI and Moving Averages: Use RSI for oversold/overbought signals and MAs for trend confirmation.
6. Using Binance for Entry and Exit Strategies
Binance offers several features to help traders optimize entry and exit points:
Charting Tools: Use TradingView integration on Binance to analyze support, resistance, and indicators.Advanced Orders: Set stop-loss and take-profit orders directly in the app.Price Alerts: Receive notifications when an asset hits your predefined entry or exit levels.
7. Common Mistakes to Avoid
Chasing Trades: Avoid entering late during a price surge due to FOMO (fear of missing out).Ignoring Stop-Losses: Failing to set stop-losses can lead to significant losses during unexpected market drops.Overtrading: Entering and exiting too frequently can lead to high fees and reduced profits.
Conclusion
Identifying entry and exit points is a fundamental skill for crypto traders. By combining support and resistance levels, technical indicators, and risk management tools, you can make well-informed decisions and maximize your trading success. Use Binance’s comprehensive tools to streamline your strategy and ensure you're always one step ahead in the fast-paced world of crypto trading.
{spot}(BTCUSDT)
{spot}(BNBUSDT)
{spot}(SOLUSDT)
How to Identify Entry and Exit Points
Mastering the art of identifying entry and exit points is essential for successful cryptocurrency trading. Precise timing can significantly affect your profitability, whether you're a long-term investor or an active trader. This guide explains how to determine optimal entry and exit points using technical analysis, indicators, and market sentiment.
1. Why Entry and Exit Points Matter
Timing your trades involves identifying when to buy (entry) and when to sell (exit) an asset. Correct timing helps:
Maximize profits.Minimize risks.Avoid emotional decision-making by following a structured plan.
2. Identifying Entry Points
A. Support Levels
Support is a price level where an asset tends to stop falling and bounce back.
How to Spot It: Look for historical price levels where the asset has consistently reversed upward.Why It Works: Traders see these levels as good buying opportunities because they often indicate demand.
B. Trend Lines and Breakouts
Trend lines connect a series of price highs or lows to show the overall direction. Breakouts occur when the price crosses a resistance level or a trend line.
How to Use: Buy when the price breaks above a significant resistance level, signaling upward momentum.Caution: Confirm breakouts with indicators like volume to avoid false signals.
C. Indicators for Entry
Moving Averages (MA): A short-term MA crossing above a long-term MA often signals a buying opportunity.Relative Strength Index (RSI): When RSI is below 30 (oversold), it may indicate a good entry point.
3. Identifying Exit Points
A. Resistance Levels
Resistance is a price level where an asset tends to stop rising and reverse downward.
How to Spot It: Look for historical price levels where the asset has consistently reversed downward.Why It Works: Traders often sell at these levels to lock in profits, creating a self-fulfilling price drop.
B. Risk-Reward Ratio
Determine your risk-reward ratio before entering a trade.
Example: If your risk is $100, aim for a reward of at least $200 (2:1 ratio).How to Exit: Close your trade when the price reaches your predefined target.
C. Indicators for Exit
Bollinger Bands: When the price reaches the upper band, it might be overbought and a good time to sell.RSI: When RSI is above 70 (overbought), it may signal a good exit point.
4. Using Stop-Loss and Take-Profit Orders
Stop-Loss Orders
Automatically close your position if the price falls to a certain level, limiting potential losses.
How to Set: Place your stop-loss below a key support level.Example: If you buy Bitcoin at $30,000, set a stop-loss at $28,000 to cap your loss.
Take-Profit Orders
Automatically close your position when the price hits your desired profit level.
How to Set: Place it just below a resistance level or based on your risk-reward ratio.Example: If your target is a 10% profit, set your take-profit at $33,000.
5. Combining Indicators for Better Accuracy
Using multiple tools together can improve the accuracy of your entry and exit points:
Volume and Trend Lines: Combine breakouts with rising volume to confirm momentum.RSI and Moving Averages: Use RSI for oversold/overbought signals and MAs for trend confirmation.
6. Using Binance for Entry and Exit Strategies
Binance offers several features to help traders optimize entry and exit points:
Charting Tools: Use TradingView integration on Binance to analyze support, resistance, and indicators.Advanced Orders: Set stop-loss and take-profit orders directly in the app.Price Alerts: Receive notifications when an asset hits your predefined entry or exit levels.
7. Common Mistakes to Avoid
Chasing Trades: Avoid entering late during a price surge due to FOMO (fear of missing out).Ignoring Stop-Losses: Failing to set stop-losses can lead to significant losses during unexpected market drops.Overtrading: Entering and exiting too frequently can lead to high fees and reduced profits.
Conclusion
Identifying entry and exit points is a fundamental skill for crypto traders. By combining support and resistance levels, technical indicators, and risk management tools, you can make well-informed decisions and maximize your trading success. Use Binance’s comprehensive tools to streamline your strategy and ensure you're always one step ahead in the fast-paced world of crypto trading.
1. Why Entry and Exit Points Matter
Timing your trades involves identifying when to buy (entry) and when to sell (exit) an asset. Correct timing helps:
Maximize profits.Minimize risks.Avoid emotional decision-making by following a structured plan.
2. Identifying Entry Points
A. Support Levels
Support is a price level where an asset tends to stop falling and bounce back.
How to Spot It: Look for historical price levels where the asset has consistently reversed upward.Why It Works: Traders see these levels as good buying opportunities because they often indicate demand.
B. Trend Lines and Breakouts
Trend lines connect a series of price highs or lows to show the overall direction. Breakouts occur when the price crosses a resistance level or a trend line.
How to Use: Buy when the price breaks above a significant resistance level, signaling upward momentum.Caution: Confirm breakouts with indicators like volume to avoid false signals.
C. Indicators for Entry
Moving Averages (MA): A short-term MA crossing above a long-term MA often signals a buying opportunity.Relative Strength Index (RSI): When RSI is below 30 (oversold), it may indicate a good entry point.
3. Identifying Exit Points
A. Resistance Levels
Resistance is a price level where an asset tends to stop rising and reverse downward.
How to Spot It: Look for historical price levels where the asset has consistently reversed downward.Why It Works: Traders often sell at these levels to lock in profits, creating a self-fulfilling price drop.
B. Risk-Reward Ratio
Determine your risk-reward ratio before entering a trade.
Example: If your risk is $100, aim for a reward of at least $200 (2:1 ratio).How to Exit: Close your trade when the price reaches your predefined target.
C. Indicators for Exit
Bollinger Bands: When the price reaches the upper band, it might be overbought and a good time to sell.RSI: When RSI is above 70 (overbought), it may signal a good exit point.
4. Using Stop-Loss and Take-Profit Orders
Stop-Loss Orders
Automatically close your position if the price falls to a certain level, limiting potential losses.
How to Set: Place your stop-loss below a key support level.Example: If you buy Bitcoin at $30,000, set a stop-loss at $28,000 to cap your loss.
Take-Profit Orders
Automatically close your position when the price hits your desired profit level.
How to Set: Place it just below a resistance level or based on your risk-reward ratio.Example: If your target is a 10% profit, set your take-profit at $33,000.
5. Combining Indicators for Better Accuracy
Using multiple tools together can improve the accuracy of your entry and exit points:
Volume and Trend Lines: Combine breakouts with rising volume to confirm momentum.RSI and Moving Averages: Use RSI for oversold/overbought signals and MAs for trend confirmation.
6. Using Binance for Entry and Exit Strategies
Binance offers several features to help traders optimize entry and exit points:
Charting Tools: Use TradingView integration on Binance to analyze support, resistance, and indicators.Advanced Orders: Set stop-loss and take-profit orders directly in the app.Price Alerts: Receive notifications when an asset hits your predefined entry or exit levels.
7. Common Mistakes to Avoid
Chasing Trades: Avoid entering late during a price surge due to FOMO (fear of missing out).Ignoring Stop-Losses: Failing to set stop-losses can lead to significant losses during unexpected market drops.Overtrading: Entering and exiting too frequently can lead to high fees and reduced profits.
Conclusion
Identifying entry and exit points is a fundamental skill for crypto traders. By combining support and resistance levels, technical indicators, and risk management tools, you can make well-informed decisions and maximize your trading success. Use Binance’s comprehensive tools to streamline your strategy and ensure you're always one step ahead in the fast-paced world of crypto trading.
1
15
15.3k

Article
The Impact of Global Events on Crypto MarketsCryptocurrency markets, much like traditional financial markets, are highly sensitive to global events. Whether it's economic policies, geopolitical tensions, technological advancements, or regulatory announcements, external factors can significantly influence the value of cryptocurrencies. Understanding these impacts is essential for traders looking to navigate the volatile crypto landscape, especially on platforms like Binance.
How Global Events Affect Crypto Markets
1. Economic Policies and Inflation
Global economic policies, particularly those related to inflation and interest rates, often impact crypto markets.
Inflation Hedge:
Cryptocurrencies like Bitcoin are increasingly viewed as a hedge against inflation. When central banks print more money, reducing fiat currency value, investors may shift toward Bitcoin or stable assets like USDT.Interest Rate Changes:
Higher interest rates can reduce liquidity in financial markets, leading to a decline in investments across risky assets, including cryptocurrencies.
2. Regulatory Announcements
Cryptocurrency regulations can either boost or suppress market confidence.
Positive Regulation:
Countries adopting crypto-friendly policies (e.g., approving Bitcoin ETFs or legalizing crypto payments) can lead to bullish trends.Negative Regulation:
Crackdowns, bans, or heavy restrictions on crypto usage, like China's ban on crypto mining, often result in sharp market declines.
3. Geopolitical Tensions
Geopolitical events such as wars, trade disputes, or international sanctions can impact crypto prices in unexpected ways.
Flight to Safety:
In times of geopolitical uncertainty, investors often flock to cryptocurrencies as alternative assets to safeguard their wealth, causing price surges.Sanctions and Crypto:
Countries facing international sanctions may turn to cryptocurrencies to bypass traditional financial systems, driving demand for decentralized assets.
4. Technological Advancements and Security Concerns
The crypto market is deeply influenced by advancements and setbacks in blockchain technology.
Innovations:
Updates like Ethereum’s transition to Proof-of-Stake (Ethereum 2.0) can spark enthusiasm and price increases.Hacks and Scams:
Major security breaches on crypto exchanges or DeFi platforms can erode trust, leading to widespread sell-offs.
5. Global Financial Crises
During global financial downturns, crypto markets can either follow traditional market trends or diverge significantly.
Correlation with Stock Markets:
In some cases, crypto markets move in tandem with traditional financial markets, especially during large-scale sell-offs.Decoupling During Crises:
Conversely, during localized financial crises (e.g., in economies like Turkey or Venezuela), cryptocurrencies may become more valuable as they serve as a store of value against collapsing local currencies.
Case Studies of Global Events Impacting Crypto Markets
1. COVID-19 Pandemic
Initial Decline:
In March 2020, the pandemic caused a massive sell-off in all markets, including cryptocurrencies, as investors sought liquidity.Subsequent Bull Run:
Massive stimulus packages and low-interest rates fueled a Bitcoin rally, pushing it to new all-time highs by late 2020.
2. Russia-Ukraine War
Spike in Bitcoin Demand:
The conflict in early 2022 saw an increase in Bitcoin trading volumes in Eastern Europe as people sought alternatives to unstable fiat currencies.
3. FTX Collapse (2022)
The high-profile collapse of FTX, a major crypto exchange, triggered a loss of trust in centralized platforms, leading to significant market downturns.
Strategies for Traders to Manage Global Event Risks
Stay Informed:Regularly monitor global news, especially financial and geopolitical developments. Use Binance's news section or external resources for updates.Diversify Investments:Spread your portfolio across multiple cryptocurrencies and stablecoins to mitigate the risk of a single event impacting all your assets.Set Stop-Loss Orders:Protect your investments by using stop-loss orders, especially during periods of heightened volatility.Leverage Stablecoins:In uncertain times, convert part of your portfolio to stablecoins like USDT to preserve value.Adopt a Long-Term Perspective:While global events cause short-term volatility, focusing on long-term trends can help reduce emotional decision-making.
Conclusion
Global events are a double-edged sword for cryptocurrency markets. They can either trigger rapid price increases or cause sharp declines. For traders on Binance and other platforms, staying informed, managing risks, and diversifying investments are crucial strategies to navigate this volatile environment. By understanding the broader implications of these events, you can position yourself to capitalize on opportunities while mitigating potential losses.
#USConsumerConfidence
The Impact of Global Events on Crypto Markets
Cryptocurrency markets, much like traditional financial markets, are highly sensitive to global events. Whether it's economic policies, geopolitical tensions, technological advancements, or regulatory announcements, external factors can significantly influence the value of cryptocurrencies. Understanding these impacts is essential for traders looking to navigate the volatile crypto landscape, especially on platforms like Binance.
How Global Events Affect Crypto Markets
1. Economic Policies and Inflation
Global economic policies, particularly those related to inflation and interest rates, often impact crypto markets.
Inflation Hedge:
Cryptocurrencies like Bitcoin are increasingly viewed as a hedge against inflation. When central banks print more money, reducing fiat currency value, investors may shift toward Bitcoin or stable assets like USDT.Interest Rate Changes:
Higher interest rates can reduce liquidity in financial markets, leading to a decline in investments across risky assets, including cryptocurrencies.
2. Regulatory Announcements
Cryptocurrency regulations can either boost or suppress market confidence.
Positive Regulation:
Countries adopting crypto-friendly policies (e.g., approving Bitcoin ETFs or legalizing crypto payments) can lead to bullish trends.Negative Regulation:
Crackdowns, bans, or heavy restrictions on crypto usage, like China's ban on crypto mining, often result in sharp market declines.
3. Geopolitical Tensions
Geopolitical events such as wars, trade disputes, or international sanctions can impact crypto prices in unexpected ways.
Flight to Safety:
In times of geopolitical uncertainty, investors often flock to cryptocurrencies as alternative assets to safeguard their wealth, causing price surges.Sanctions and Crypto:
Countries facing international sanctions may turn to cryptocurrencies to bypass traditional financial systems, driving demand for decentralized assets.
4. Technological Advancements and Security Concerns
The crypto market is deeply influenced by advancements and setbacks in blockchain technology.
Innovations:
Updates like Ethereum’s transition to Proof-of-Stake (Ethereum 2.0) can spark enthusiasm and price increases.Hacks and Scams:
Major security breaches on crypto exchanges or DeFi platforms can erode trust, leading to widespread sell-offs.
5. Global Financial Crises
During global financial downturns, crypto markets can either follow traditional market trends or diverge significantly.
Correlation with Stock Markets:
In some cases, crypto markets move in tandem with traditional financial markets, especially during large-scale sell-offs.Decoupling During Crises:
Conversely, during localized financial crises (e.g., in economies like Turkey or Venezuela), cryptocurrencies may become more valuable as they serve as a store of value against collapsing local currencies.
Case Studies of Global Events Impacting Crypto Markets
1. COVID-19 Pandemic
Initial Decline:
In March 2020, the pandemic caused a massive sell-off in all markets, including cryptocurrencies, as investors sought liquidity.Subsequent Bull Run:
Massive stimulus packages and low-interest rates fueled a Bitcoin rally, pushing it to new all-time highs by late 2020.
2. Russia-Ukraine War
Spike in Bitcoin Demand:
The conflict in early 2022 saw an increase in Bitcoin trading volumes in Eastern Europe as people sought alternatives to unstable fiat currencies.
3. FTX Collapse (2022)
The high-profile collapse of FTX, a major crypto exchange, triggered a loss of trust in centralized platforms, leading to significant market downturns.
Strategies for Traders to Manage Global Event Risks
Stay Informed:Regularly monitor global news, especially financial and geopolitical developments. Use Binance's news section or external resources for updates.Diversify Investments:Spread your portfolio across multiple cryptocurrencies and stablecoins to mitigate the risk of a single event impacting all your assets.Set Stop-Loss Orders:Protect your investments by using stop-loss orders, especially during periods of heightened volatility.Leverage Stablecoins:In uncertain times, convert part of your portfolio to stablecoins like USDT to preserve value.Adopt a Long-Term Perspective:While global events cause short-term volatility, focusing on long-term trends can help reduce emotional decision-making.
Conclusion
Global events are a double-edged sword for cryptocurrency markets. They can either trigger rapid price increases or cause sharp declines. For traders on Binance and other platforms, staying informed, managing risks, and diversifying investments are crucial strategies to navigate this volatile environment. By understanding the broader implications of these events, you can position yourself to capitalize on opportunities while mitigating potential losses.
#USConsumerConfidence
How Global Events Affect Crypto Markets
1. Economic Policies and Inflation
Global economic policies, particularly those related to inflation and interest rates, often impact crypto markets.
Inflation Hedge:
Cryptocurrencies like Bitcoin are increasingly viewed as a hedge against inflation. When central banks print more money, reducing fiat currency value, investors may shift toward Bitcoin or stable assets like USDT.Interest Rate Changes:
Higher interest rates can reduce liquidity in financial markets, leading to a decline in investments across risky assets, including cryptocurrencies.
2. Regulatory Announcements
Cryptocurrency regulations can either boost or suppress market confidence.
Positive Regulation:
Countries adopting crypto-friendly policies (e.g., approving Bitcoin ETFs or legalizing crypto payments) can lead to bullish trends.Negative Regulation:
Crackdowns, bans, or heavy restrictions on crypto usage, like China's ban on crypto mining, often result in sharp market declines.
3. Geopolitical Tensions
Geopolitical events such as wars, trade disputes, or international sanctions can impact crypto prices in unexpected ways.
Flight to Safety:
In times of geopolitical uncertainty, investors often flock to cryptocurrencies as alternative assets to safeguard their wealth, causing price surges.Sanctions and Crypto:
Countries facing international sanctions may turn to cryptocurrencies to bypass traditional financial systems, driving demand for decentralized assets.
4. Technological Advancements and Security Concerns
The crypto market is deeply influenced by advancements and setbacks in blockchain technology.
Innovations:
Updates like Ethereum’s transition to Proof-of-Stake (Ethereum 2.0) can spark enthusiasm and price increases.Hacks and Scams:
Major security breaches on crypto exchanges or DeFi platforms can erode trust, leading to widespread sell-offs.
5. Global Financial Crises
During global financial downturns, crypto markets can either follow traditional market trends or diverge significantly.
Correlation with Stock Markets:
In some cases, crypto markets move in tandem with traditional financial markets, especially during large-scale sell-offs.Decoupling During Crises:
Conversely, during localized financial crises (e.g., in economies like Turkey or Venezuela), cryptocurrencies may become more valuable as they serve as a store of value against collapsing local currencies.
Case Studies of Global Events Impacting Crypto Markets
1. COVID-19 Pandemic
Initial Decline:
In March 2020, the pandemic caused a massive sell-off in all markets, including cryptocurrencies, as investors sought liquidity.Subsequent Bull Run:
Massive stimulus packages and low-interest rates fueled a Bitcoin rally, pushing it to new all-time highs by late 2020.
2. Russia-Ukraine War
Spike in Bitcoin Demand:
The conflict in early 2022 saw an increase in Bitcoin trading volumes in Eastern Europe as people sought alternatives to unstable fiat currencies.
3. FTX Collapse (2022)
The high-profile collapse of FTX, a major crypto exchange, triggered a loss of trust in centralized platforms, leading to significant market downturns.
Strategies for Traders to Manage Global Event Risks
Stay Informed:Regularly monitor global news, especially financial and geopolitical developments. Use Binance's news section or external resources for updates.Diversify Investments:Spread your portfolio across multiple cryptocurrencies and stablecoins to mitigate the risk of a single event impacting all your assets.Set Stop-Loss Orders:Protect your investments by using stop-loss orders, especially during periods of heightened volatility.Leverage Stablecoins:In uncertain times, convert part of your portfolio to stablecoins like USDT to preserve value.Adopt a Long-Term Perspective:While global events cause short-term volatility, focusing on long-term trends can help reduce emotional decision-making.
Conclusion
Global events are a double-edged sword for cryptocurrency markets. They can either trigger rapid price increases or cause sharp declines. For traders on Binance and other platforms, staying informed, managing risks, and diversifying investments are crucial strategies to navigate this volatile environment. By understanding the broader implications of these events, you can position yourself to capitalize on opportunities while mitigating potential losses.
#USConsumerConfidence
616

Article
Building Your Own Algorithmic Trading StrategyAlgorithmic trading, also known as "algo trading," involves using computer algorithms to execute trades based on predefined criteria. This type of trading is increasingly popular in the crypto markets due to its speed, precision, and ability to execute complex strategies without human intervention. If you're looking to build your own algorithmic trading strategy, here's a step-by-step guide to get started, specifically tailored for crypto trading on platforms like Binance.
What Is Algorithmic Trading?
Algorithmic trading refers to the use of automated systems to make trading decisions based on a set of rules and parameters. These rules can range from basic conditions like price and volume to more complex conditions like market sentiment or news events.
Key Features:Executes trades automatically.Based on mathematical models and predefined conditions.Aims to remove emotional decision-making and human error.
Why Use Algorithmic Trading?
Speed and Precision:Algo trading allows you to execute trades faster than manual methods, taking advantage of even the smallest market opportunities.Backtesting and Optimization:You can backtest your strategy using historical data to see how it would have performed in different market conditions.24/7 Trading:Crypto markets are open around the clock. Algorithms can trade on your behalf even when you're not available.Reduced Emotional Bias:Automated trading eliminates the risk of emotional decisions, such as panic selling or impulsive buying.
Step-by-Step Guide to Building Your Own Algorithmic Trading Strategy
Step 1: Define Your Strategy
Before writing any code, you need to define the strategy your algorithm will follow. Some common types of algorithmic trading strategies in the crypto market include:
Trend-Following Strategies:These strategies aim to buy when prices are rising and sell when they’re falling.Example: Use moving averages to determine the trend direction and trade accordingly.Arbitrage:Exploit price discrepancies between different exchanges or crypto pairs.Example: Buy Bitcoin on Exchange A at $25,000 and sell it on Exchange B at $25,100.Market-Making:Place both buy and sell orders at different prices to profit from the bid-ask spread.Mean Reversion:This strategy assumes that prices will revert to their historical mean.Example: Buy when the price is below the moving average and sell when it’s above.
Step 2: Choose Your Tools and Platform
To start coding your algorithm, you’ll need:
Programming Language:Popular languages for algorithmic trading include Python, Java, and C++. Python is especially popular due to its simplicity and access to powerful libraries.Trading Platform:Platforms like Binance offer robust API access, enabling you to connect your algorithm directly to your trading account.Backtesting Tools:Use backtesting platforms like Backtrader or QuantConnect to test your strategy against historical data before going live.
Step 3: Write the Algorithm
Now, let’s get into the core of building your algorithm. Here’s how to approach it:
Fetch Market Data:Use Binance’s API to fetch real-time market data like price, volume, and order book depth.Example: Fetch the latest Bitcoin price using Binance’s GET /api/v3/ticker/price endpoint.Define Entry and Exit Signals:Based on your strategy, set rules for when to buy or sell.Example: If the price crosses above a 50-period moving average, trigger a buy signal.Risk Management:Set parameters for stop-loss, take-profit, and position sizing.Example: Use a 2% stop-loss to minimize potential losses on each trade.Order Execution:Use Binance’s trading API to place orders based on the signals your algorithm generates.Example: Place a market order with Binance’s POST /api/v3/order endpoint.Monitor and Optimize:Your algorithm should be able to continuously monitor the market and adjust orders as needed.
Step 4: Backtest Your Strategy
Backtesting is one of the most critical aspects of algorithmic trading. It allows you to simulate how your strategy would have performed in the past, using historical market data.
Test Across Different Market Conditions:Make sure your strategy performs well during various market conditions: bull markets, bear markets, and sideways trends.Evaluate Performance Metrics:Metrics like win rate, profit factor, and drawdown are essential to understanding the risk-reward ratio of your strategy.
Step 5: Paper Trade (Simulated Trading)
Before using real money, run your algorithm in a paper trading environment.
Paper Trading on Binance:Binance offers testnet accounts for you to simulate trades without risking real funds.This step helps ensure your strategy is sound and ready for live trading.
Step 6: Go Live with Real Capital
Once you’ve tested your algorithm thoroughly, it’s time to deploy it with real capital. However, start small to minimize risk as you adjust to live market conditions.
Monitor Performance:Regularly check your algorithm’s performance to ensure it’s functioning as expected.Use Binance’s API to receive real-time updates on your trades and account balance.Adjust as Needed:Market conditions evolve, and your strategy might need fine-tuning over time. Be prepared to make adjustments to your algorithm for maximum effectiveness.
Tips for Successful Algorithmic Trading
Start with Simple Strategies:Begin with basic strategies like moving average crossovers before moving to more complex ones.Risk Management Is Key:Always incorporate stop-loss orders and never risk more than you can afford to lose.Use Proper Infrastructure:Ensure you have a reliable server and fast internet connection for low-latency trading.Continuous Learning:The crypto market is volatile, and your algorithm needs constant updates and improvements. Keep learning from market feedback.
Conclusion
Building your own algorithmic trading strategy can seem like a daunting task, but with the right approach and tools, it can be incredibly rewarding. By defining your strategy, choosing the right tools, writing your algorithm, and rigorously testing it, you can automate your trading on Binance and take advantage of the fast-paced crypto markets. Always remember to implement sound risk management practices and keep refining your strategy as you gain more experience.
#BinanceMegadropSolv
Building Your Own Algorithmic Trading Strategy
Algorithmic trading, also known as "algo trading," involves using computer algorithms to execute trades based on predefined criteria. This type of trading is increasingly popular in the crypto markets due to its speed, precision, and ability to execute complex strategies without human intervention. If you're looking to build your own algorithmic trading strategy, here's a step-by-step guide to get started, specifically tailored for crypto trading on platforms like Binance.
What Is Algorithmic Trading?
Algorithmic trading refers to the use of automated systems to make trading decisions based on a set of rules and parameters. These rules can range from basic conditions like price and volume to more complex conditions like market sentiment or news events.
Key Features:Executes trades automatically.Based on mathematical models and predefined conditions.Aims to remove emotional decision-making and human error.
Why Use Algorithmic Trading?
Speed and Precision:Algo trading allows you to execute trades faster than manual methods, taking advantage of even the smallest market opportunities.Backtesting and Optimization:You can backtest your strategy using historical data to see how it would have performed in different market conditions.24/7 Trading:Crypto markets are open around the clock. Algorithms can trade on your behalf even when you're not available.Reduced Emotional Bias:Automated trading eliminates the risk of emotional decisions, such as panic selling or impulsive buying.
Step-by-Step Guide to Building Your Own Algorithmic Trading Strategy
Step 1: Define Your Strategy
Before writing any code, you need to define the strategy your algorithm will follow. Some common types of algorithmic trading strategies in the crypto market include:
Trend-Following Strategies:These strategies aim to buy when prices are rising and sell when they’re falling.Example: Use moving averages to determine the trend direction and trade accordingly.Arbitrage:Exploit price discrepancies between different exchanges or crypto pairs.Example: Buy Bitcoin on Exchange A at $25,000 and sell it on Exchange B at $25,100.Market-Making:Place both buy and sell orders at different prices to profit from the bid-ask spread.Mean Reversion:This strategy assumes that prices will revert to their historical mean.Example: Buy when the price is below the moving average and sell when it’s above.
Step 2: Choose Your Tools and Platform
To start coding your algorithm, you’ll need:
Programming Language:Popular languages for algorithmic trading include Python, Java, and C++. Python is especially popular due to its simplicity and access to powerful libraries.Trading Platform:Platforms like Binance offer robust API access, enabling you to connect your algorithm directly to your trading account.Backtesting Tools:Use backtesting platforms like Backtrader or QuantConnect to test your strategy against historical data before going live.
Step 3: Write the Algorithm
Now, let’s get into the core of building your algorithm. Here’s how to approach it:
Fetch Market Data:Use Binance’s API to fetch real-time market data like price, volume, and order book depth.Example: Fetch the latest Bitcoin price using Binance’s GET /api/v3/ticker/price endpoint.Define Entry and Exit Signals:Based on your strategy, set rules for when to buy or sell.Example: If the price crosses above a 50-period moving average, trigger a buy signal.Risk Management:Set parameters for stop-loss, take-profit, and position sizing.Example: Use a 2% stop-loss to minimize potential losses on each trade.Order Execution:Use Binance’s trading API to place orders based on the signals your algorithm generates.Example: Place a market order with Binance’s POST /api/v3/order endpoint.Monitor and Optimize:Your algorithm should be able to continuously monitor the market and adjust orders as needed.
Step 4: Backtest Your Strategy
Backtesting is one of the most critical aspects of algorithmic trading. It allows you to simulate how your strategy would have performed in the past, using historical market data.
Test Across Different Market Conditions:Make sure your strategy performs well during various market conditions: bull markets, bear markets, and sideways trends.Evaluate Performance Metrics:Metrics like win rate, profit factor, and drawdown are essential to understanding the risk-reward ratio of your strategy.
Step 5: Paper Trade (Simulated Trading)
Before using real money, run your algorithm in a paper trading environment.
Paper Trading on Binance:Binance offers testnet accounts for you to simulate trades without risking real funds.This step helps ensure your strategy is sound and ready for live trading.
Step 6: Go Live with Real Capital
Once you’ve tested your algorithm thoroughly, it’s time to deploy it with real capital. However, start small to minimize risk as you adjust to live market conditions.
Monitor Performance:Regularly check your algorithm’s performance to ensure it’s functioning as expected.Use Binance’s API to receive real-time updates on your trades and account balance.Adjust as Needed:Market conditions evolve, and your strategy might need fine-tuning over time. Be prepared to make adjustments to your algorithm for maximum effectiveness.
Tips for Successful Algorithmic Trading
Start with Simple Strategies:Begin with basic strategies like moving average crossovers before moving to more complex ones.Risk Management Is Key:Always incorporate stop-loss orders and never risk more than you can afford to lose.Use Proper Infrastructure:Ensure you have a reliable server and fast internet connection for low-latency trading.Continuous Learning:The crypto market is volatile, and your algorithm needs constant updates and improvements. Keep learning from market feedback.
Conclusion
Building your own algorithmic trading strategy can seem like a daunting task, but with the right approach and tools, it can be incredibly rewarding. By defining your strategy, choosing the right tools, writing your algorithm, and rigorously testing it, you can automate your trading on Binance and take advantage of the fast-paced crypto markets. Always remember to implement sound risk management practices and keep refining your strategy as you gain more experience.
#BinanceMegadropSolv
What Is Algorithmic Trading?
Algorithmic trading refers to the use of automated systems to make trading decisions based on a set of rules and parameters. These rules can range from basic conditions like price and volume to more complex conditions like market sentiment or news events.
Key Features:Executes trades automatically.Based on mathematical models and predefined conditions.Aims to remove emotional decision-making and human error.
Why Use Algorithmic Trading?
Speed and Precision:Algo trading allows you to execute trades faster than manual methods, taking advantage of even the smallest market opportunities.Backtesting and Optimization:You can backtest your strategy using historical data to see how it would have performed in different market conditions.24/7 Trading:Crypto markets are open around the clock. Algorithms can trade on your behalf even when you're not available.Reduced Emotional Bias:Automated trading eliminates the risk of emotional decisions, such as panic selling or impulsive buying.
Step-by-Step Guide to Building Your Own Algorithmic Trading Strategy
Step 1: Define Your Strategy
Before writing any code, you need to define the strategy your algorithm will follow. Some common types of algorithmic trading strategies in the crypto market include:
Trend-Following Strategies:These strategies aim to buy when prices are rising and sell when they’re falling.Example: Use moving averages to determine the trend direction and trade accordingly.Arbitrage:Exploit price discrepancies between different exchanges or crypto pairs.Example: Buy Bitcoin on Exchange A at $25,000 and sell it on Exchange B at $25,100.Market-Making:Place both buy and sell orders at different prices to profit from the bid-ask spread.Mean Reversion:This strategy assumes that prices will revert to their historical mean.Example: Buy when the price is below the moving average and sell when it’s above.
Step 2: Choose Your Tools and Platform
To start coding your algorithm, you’ll need:
Programming Language:Popular languages for algorithmic trading include Python, Java, and C++. Python is especially popular due to its simplicity and access to powerful libraries.Trading Platform:Platforms like Binance offer robust API access, enabling you to connect your algorithm directly to your trading account.Backtesting Tools:Use backtesting platforms like Backtrader or QuantConnect to test your strategy against historical data before going live.
Step 3: Write the Algorithm
Now, let’s get into the core of building your algorithm. Here’s how to approach it:
Fetch Market Data:Use Binance’s API to fetch real-time market data like price, volume, and order book depth.Example: Fetch the latest Bitcoin price using Binance’s GET /api/v3/ticker/price endpoint.Define Entry and Exit Signals:Based on your strategy, set rules for when to buy or sell.Example: If the price crosses above a 50-period moving average, trigger a buy signal.Risk Management:Set parameters for stop-loss, take-profit, and position sizing.Example: Use a 2% stop-loss to minimize potential losses on each trade.Order Execution:Use Binance’s trading API to place orders based on the signals your algorithm generates.Example: Place a market order with Binance’s POST /api/v3/order endpoint.Monitor and Optimize:Your algorithm should be able to continuously monitor the market and adjust orders as needed.
Step 4: Backtest Your Strategy
Backtesting is one of the most critical aspects of algorithmic trading. It allows you to simulate how your strategy would have performed in the past, using historical market data.
Test Across Different Market Conditions:Make sure your strategy performs well during various market conditions: bull markets, bear markets, and sideways trends.Evaluate Performance Metrics:Metrics like win rate, profit factor, and drawdown are essential to understanding the risk-reward ratio of your strategy.
Step 5: Paper Trade (Simulated Trading)
Before using real money, run your algorithm in a paper trading environment.
Paper Trading on Binance:Binance offers testnet accounts for you to simulate trades without risking real funds.This step helps ensure your strategy is sound and ready for live trading.
Step 6: Go Live with Real Capital
Once you’ve tested your algorithm thoroughly, it’s time to deploy it with real capital. However, start small to minimize risk as you adjust to live market conditions.
Monitor Performance:Regularly check your algorithm’s performance to ensure it’s functioning as expected.Use Binance’s API to receive real-time updates on your trades and account balance.Adjust as Needed:Market conditions evolve, and your strategy might need fine-tuning over time. Be prepared to make adjustments to your algorithm for maximum effectiveness.
Tips for Successful Algorithmic Trading
Start with Simple Strategies:Begin with basic strategies like moving average crossovers before moving to more complex ones.Risk Management Is Key:Always incorporate stop-loss orders and never risk more than you can afford to lose.Use Proper Infrastructure:Ensure you have a reliable server and fast internet connection for low-latency trading.Continuous Learning:The crypto market is volatile, and your algorithm needs constant updates and improvements. Keep learning from market feedback.
Conclusion
Building your own algorithmic trading strategy can seem like a daunting task, but with the right approach and tools, it can be incredibly rewarding. By defining your strategy, choosing the right tools, writing your algorithm, and rigorously testing it, you can automate your trading on Binance and take advantage of the fast-paced crypto markets. Always remember to implement sound risk management practices and keep refining your strategy as you gain more experience.
#BinanceMegadropSolv
1
195

Article
High-Frequency Trading in Crypto MarketsHigh-Frequency Trading (HFT) is a cutting-edge trading strategy that utilizes advanced algorithms and technology to execute trades at lightning speed. While HFT has been a staple in traditional financial markets, its adoption in cryptocurrency trading has grown significantly due to the market's high volatility and 24/7 operation. Here's an overview of HFT in the crypto markets, including its benefits, challenges, and how traders can get started.
What Is High-Frequency Trading?
HFT involves using algorithms to execute a large number of trades in a fraction of a second. The goal is to capitalize on tiny price differences across exchanges or within the same market.
Core Features:High-speed trade execution.Reliance on advanced algorithms and trading bots.Exploitation of market inefficiencies.
Why HFT Works in Crypto Markets
High Volatility:The frequent price swings in crypto markets provide ample opportunities for HFT strategies.Fragmented Market:With hundreds of exchanges operating globally, price discrepancies are common, making arbitrage opportunities plentiful.24/7 Market Operation:Unlike traditional markets, crypto trading never stops, allowing HFT systems to operate continuously.
Popular HFT Strategies in Crypto
Market MakingPlacing both buy and sell orders to profit from bid-ask spreads.Example: A bot might buy Bitcoin at $25,000 and sell it at $25,005, pocketing the $5 spread.ArbitrageExploiting price differences between exchanges.Example: Buying Ethereum on Exchange A for $1,800 and selling it on Exchange B for $1,810.Momentum TradingIdentifying and riding short-term price trends based on volume and momentum indicators.Statistical ArbitrageUsing mathematical models to identify and exploit price inefficiencies.
Benefits of HFT in Crypto
Speed:HFT bots can process and execute trades faster than any human trader.Scalability:Algorithms can handle thousands of trades simultaneously, increasing potential profits.Efficiency:Reduces manual effort, as algorithms handle all the heavy lifting.
Challenges of HFT in Crypto
High Technical Requirements:Requires advanced infrastructure, such as low-latency networks and powerful servers.Market Risks:Extreme volatility can lead to unexpected losses.Example: Sudden market crashes can liquidate HFT positions.Competition:Many players, including institutional traders, use HFT, increasing competition for opportunities.Regulatory Concerns:As HFT grows in crypto, some jurisdictions might impose regulations to ensure market fairness.
Getting Started with HFT
1. Choose the Right Platform
Binance is an excellent choice for HFT due to:High liquidity across trading pairs.Advanced API access for algorithmic trading.
2. Develop or Acquire a Bot
Developing Your Bot:Requires programming knowledge (e.g., Python, Java).Integrate with Binance API to execute trades.Third-Party Solutions:Use platforms like 3Commas, HaasOnline, or Cryptohopper for pre-built HFT bots.
3. Optimize Your Strategy
Test your algorithm using historical data or in a demo account.Focus on minimizing latency and optimizing execution speed.
4. Monitor and Adjust
Even the best algorithms require regular updates to stay effective.Monitor performance metrics like win rate, average profit per trade, and execution speed.
Tips for Successful HFT in Crypto
Start Small:Test your strategy with smaller capital before scaling up.Focus on Liquid Markets:Trade high-volume pairs like BTC/USDT or ETH/USDT to ensure smooth execution.Stay Updated on Fees:Understand Binance’s fee structure to ensure profitability.Use Reliable Infrastructure:Invest in low-latency servers and high-speed internet connections.
Is HFT Right for You?
High-Frequency Trading offers immense potential but demands a combination of technical expertise, infrastructure, and strategic insight. While it’s not suited for every trader, those willing to invest in the necessary tools and knowledge can find it to be a lucrative avenue in the fast-moving crypto markets.
Whether you're building your first bot or refining an existing one, the Binance platform provides a robust environment for implementing and scaling HFT strategies.
#BitcoinHashRateSurge
High-Frequency Trading in Crypto Markets
High-Frequency Trading (HFT) is a cutting-edge trading strategy that utilizes advanced algorithms and technology to execute trades at lightning speed. While HFT has been a staple in traditional financial markets, its adoption in cryptocurrency trading has grown significantly due to the market's high volatility and 24/7 operation. Here's an overview of HFT in the crypto markets, including its benefits, challenges, and how traders can get started.
What Is High-Frequency Trading?
HFT involves using algorithms to execute a large number of trades in a fraction of a second. The goal is to capitalize on tiny price differences across exchanges or within the same market.
Core Features:High-speed trade execution.Reliance on advanced algorithms and trading bots.Exploitation of market inefficiencies.
Why HFT Works in Crypto Markets
High Volatility:The frequent price swings in crypto markets provide ample opportunities for HFT strategies.Fragmented Market:With hundreds of exchanges operating globally, price discrepancies are common, making arbitrage opportunities plentiful.24/7 Market Operation:Unlike traditional markets, crypto trading never stops, allowing HFT systems to operate continuously.
Popular HFT Strategies in Crypto
Market MakingPlacing both buy and sell orders to profit from bid-ask spreads.Example: A bot might buy Bitcoin at $25,000 and sell it at $25,005, pocketing the $5 spread.ArbitrageExploiting price differences between exchanges.Example: Buying Ethereum on Exchange A for $1,800 and selling it on Exchange B for $1,810.Momentum TradingIdentifying and riding short-term price trends based on volume and momentum indicators.Statistical ArbitrageUsing mathematical models to identify and exploit price inefficiencies.
Benefits of HFT in Crypto
Speed:HFT bots can process and execute trades faster than any human trader.Scalability:Algorithms can handle thousands of trades simultaneously, increasing potential profits.Efficiency:Reduces manual effort, as algorithms handle all the heavy lifting.
Challenges of HFT in Crypto
High Technical Requirements:Requires advanced infrastructure, such as low-latency networks and powerful servers.Market Risks:Extreme volatility can lead to unexpected losses.Example: Sudden market crashes can liquidate HFT positions.Competition:Many players, including institutional traders, use HFT, increasing competition for opportunities.Regulatory Concerns:As HFT grows in crypto, some jurisdictions might impose regulations to ensure market fairness.
Getting Started with HFT
1. Choose the Right Platform
Binance is an excellent choice for HFT due to:High liquidity across trading pairs.Advanced API access for algorithmic trading.
2. Develop or Acquire a Bot
Developing Your Bot:Requires programming knowledge (e.g., Python, Java).Integrate with Binance API to execute trades.Third-Party Solutions:Use platforms like 3Commas, HaasOnline, or Cryptohopper for pre-built HFT bots.
3. Optimize Your Strategy
Test your algorithm using historical data or in a demo account.Focus on minimizing latency and optimizing execution speed.
4. Monitor and Adjust
Even the best algorithms require regular updates to stay effective.Monitor performance metrics like win rate, average profit per trade, and execution speed.
Tips for Successful HFT in Crypto
Start Small:Test your strategy with smaller capital before scaling up.Focus on Liquid Markets:Trade high-volume pairs like BTC/USDT or ETH/USDT to ensure smooth execution.Stay Updated on Fees:Understand Binance’s fee structure to ensure profitability.Use Reliable Infrastructure:Invest in low-latency servers and high-speed internet connections.
Is HFT Right for You?
High-Frequency Trading offers immense potential but demands a combination of technical expertise, infrastructure, and strategic insight. While it’s not suited for every trader, those willing to invest in the necessary tools and knowledge can find it to be a lucrative avenue in the fast-moving crypto markets.
Whether you're building your first bot or refining an existing one, the Binance platform provides a robust environment for implementing and scaling HFT strategies.
#BitcoinHashRateSurge
What Is High-Frequency Trading?
HFT involves using algorithms to execute a large number of trades in a fraction of a second. The goal is to capitalize on tiny price differences across exchanges or within the same market.
Core Features:High-speed trade execution.Reliance on advanced algorithms and trading bots.Exploitation of market inefficiencies.
Why HFT Works in Crypto Markets
High Volatility:The frequent price swings in crypto markets provide ample opportunities for HFT strategies.Fragmented Market:With hundreds of exchanges operating globally, price discrepancies are common, making arbitrage opportunities plentiful.24/7 Market Operation:Unlike traditional markets, crypto trading never stops, allowing HFT systems to operate continuously.
Popular HFT Strategies in Crypto
Market MakingPlacing both buy and sell orders to profit from bid-ask spreads.Example: A bot might buy Bitcoin at $25,000 and sell it at $25,005, pocketing the $5 spread.ArbitrageExploiting price differences between exchanges.Example: Buying Ethereum on Exchange A for $1,800 and selling it on Exchange B for $1,810.Momentum TradingIdentifying and riding short-term price trends based on volume and momentum indicators.Statistical ArbitrageUsing mathematical models to identify and exploit price inefficiencies.
Benefits of HFT in Crypto
Speed:HFT bots can process and execute trades faster than any human trader.Scalability:Algorithms can handle thousands of trades simultaneously, increasing potential profits.Efficiency:Reduces manual effort, as algorithms handle all the heavy lifting.
Challenges of HFT in Crypto
High Technical Requirements:Requires advanced infrastructure, such as low-latency networks and powerful servers.Market Risks:Extreme volatility can lead to unexpected losses.Example: Sudden market crashes can liquidate HFT positions.Competition:Many players, including institutional traders, use HFT, increasing competition for opportunities.Regulatory Concerns:As HFT grows in crypto, some jurisdictions might impose regulations to ensure market fairness.
Getting Started with HFT
1. Choose the Right Platform
Binance is an excellent choice for HFT due to:High liquidity across trading pairs.Advanced API access for algorithmic trading.
2. Develop or Acquire a Bot
Developing Your Bot:Requires programming knowledge (e.g., Python, Java).Integrate with Binance API to execute trades.Third-Party Solutions:Use platforms like 3Commas, HaasOnline, or Cryptohopper for pre-built HFT bots.
3. Optimize Your Strategy
Test your algorithm using historical data or in a demo account.Focus on minimizing latency and optimizing execution speed.
4. Monitor and Adjust
Even the best algorithms require regular updates to stay effective.Monitor performance metrics like win rate, average profit per trade, and execution speed.
Tips for Successful HFT in Crypto
Start Small:Test your strategy with smaller capital before scaling up.Focus on Liquid Markets:Trade high-volume pairs like BTC/USDT or ETH/USDT to ensure smooth execution.Stay Updated on Fees:Understand Binance’s fee structure to ensure profitability.Use Reliable Infrastructure:Invest in low-latency servers and high-speed internet connections.
Is HFT Right for You?
High-Frequency Trading offers immense potential but demands a combination of technical expertise, infrastructure, and strategic insight. While it’s not suited for every trader, those willing to invest in the necessary tools and knowledge can find it to be a lucrative avenue in the fast-moving crypto markets.
Whether you're building your first bot or refining an existing one, the Binance platform provides a robust environment for implementing and scaling HFT strategies.
#BitcoinHashRateSurge
183

Article
Combining Technical and Fundamental AnalysisWhen it comes to cryptocurrency trading, two main approaches dominate the scene: technical analysis (TA) and fundamental analysis (FA). While each has its own strengths, combining these methods can provide a more comprehensive view of the market, allowing traders to make informed decisions. Here's a guide to effectively integrating both analyses.
What Is Technical Analysis (TA)?
Technical analysis focuses on analyzing price charts and market data to predict future price movements.
Key Tools:Price Charts: Line, candlestick, and bar charts.Indicators: RSI, MACD, Bollinger Bands, Moving Averages.Chart Patterns: Head and Shoulders, Double Tops, Flags.Objective: Identify trends, support/resistance levels, and market entry/exit points.
What Is Fundamental Analysis (FA)?
Fundamental analysis examines the intrinsic value of an asset based on external factors.
Key Factors:Project Fundamentals: Team, roadmap, partnerships, and technology.Market Sentiment: News, regulations, and adoption rates.On-Chain Metrics: Network activity, token supply, and distribution.Objective: Understand the long-term potential of a cryptocurrency.
Why Combine Both?
Broader PerspectiveTA reveals short-term price movements.FA offers insights into long-term viability.Enhanced AccuracyTA confirms timing for trades based on FA signals.FA validates the fundamental strength of a TA signal.Risk MitigationCombining both methods reduces reliance on a single data point, lowering the risk of errors.
How to Combine TA and FA
1. Start with Fundamental Analysis
Evaluate Project Fundamentals:Research the whitepaper, team, use case, and competitive edge.Example: Ethereum’s shift to Proof-of-Stake (PoS) drove interest due to sustainability and scalability improvements.Check Market Sentiment:Monitor crypto news and social media for trends and announcements.Example: A regulatory crackdown can suppress bullish trends despite positive TA signals.Assess On-Chain Metrics:Use tools like Glassnode or CryptoQuant to evaluate metrics such as active addresses and transaction volumes.
2. Use Technical Analysis for Timing
Identify Trends:Use moving averages or trend lines to confirm whether the market is bullish or bearish.Pinpoint Entry and Exit Points:Utilize RSI to detect overbought/oversold conditions.Use Fibonacci retracements to identify key support and resistance levels.Track Volume:Increasing volume confirms the validity of price movements.
3. Combine Signals
Scenario Action
Positive FA + Confirming TA = Consider buying or holding.
Positive FA + Diverging TA = Wait for TA signals to align or use small positions.
Negative FA + Confirming TA = Trade cautiously; consider shorter time frames.
Negative FA + Diverging TA = Avoid trading; the asset lacks strong long-term potential.
Practical Example: Bitcoin
Fundamental AnalysisBitcoin’s limited supply (21 million) and increasing institutional adoption strengthen its long-term potential.News of ETF approval could drive positive sentiment.Technical AnalysisTA shows BTC breaking through a key resistance level with high volume.RSI is neutral, suggesting room for further upward movement.ConclusionCombine FA (positive sentiment) with TA (bullish breakout) to make a buy decision.
Tips for Using Both Analyses on Binance
FA Tools on Binance:Check Binance News for updates on market trends.Use Binance Research for in-depth reports on projects.TA Tools on Binance:Use advanced charting features to apply indicators and analyze price movements.Set price alerts for key levels to act on TA signals promptly.
Conclusion
Combining technical and fundamental analysis equips traders with a well-rounded strategy for navigating the volatile crypto markets. By leveraging both approaches, you can balance short-term opportunities with long-term insights, ultimately enhancing your decision-making and increasing your chances of success in trading.
#Crypto2025Trends
Combining Technical and Fundamental Analysis
When it comes to cryptocurrency trading, two main approaches dominate the scene: technical analysis (TA) and fundamental analysis (FA). While each has its own strengths, combining these methods can provide a more comprehensive view of the market, allowing traders to make informed decisions. Here's a guide to effectively integrating both analyses.
What Is Technical Analysis (TA)?
Technical analysis focuses on analyzing price charts and market data to predict future price movements.
Key Tools:Price Charts: Line, candlestick, and bar charts.Indicators: RSI, MACD, Bollinger Bands, Moving Averages.Chart Patterns: Head and Shoulders, Double Tops, Flags.Objective: Identify trends, support/resistance levels, and market entry/exit points.
What Is Fundamental Analysis (FA)?
Fundamental analysis examines the intrinsic value of an asset based on external factors.
Key Factors:Project Fundamentals: Team, roadmap, partnerships, and technology.Market Sentiment: News, regulations, and adoption rates.On-Chain Metrics: Network activity, token supply, and distribution.Objective: Understand the long-term potential of a cryptocurrency.
Why Combine Both?
Broader PerspectiveTA reveals short-term price movements.FA offers insights into long-term viability.Enhanced AccuracyTA confirms timing for trades based on FA signals.FA validates the fundamental strength of a TA signal.Risk MitigationCombining both methods reduces reliance on a single data point, lowering the risk of errors.
How to Combine TA and FA
1. Start with Fundamental Analysis
Evaluate Project Fundamentals:Research the whitepaper, team, use case, and competitive edge.Example: Ethereum’s shift to Proof-of-Stake (PoS) drove interest due to sustainability and scalability improvements.Check Market Sentiment:Monitor crypto news and social media for trends and announcements.Example: A regulatory crackdown can suppress bullish trends despite positive TA signals.Assess On-Chain Metrics:Use tools like Glassnode or CryptoQuant to evaluate metrics such as active addresses and transaction volumes.
2. Use Technical Analysis for Timing
Identify Trends:Use moving averages or trend lines to confirm whether the market is bullish or bearish.Pinpoint Entry and Exit Points:Utilize RSI to detect overbought/oversold conditions.Use Fibonacci retracements to identify key support and resistance levels.Track Volume:Increasing volume confirms the validity of price movements.
3. Combine Signals
Scenario Action
Positive FA + Confirming TA = Consider buying or holding.
Positive FA + Diverging TA = Wait for TA signals to align or use small positions.
Negative FA + Confirming TA = Trade cautiously; consider shorter time frames.
Negative FA + Diverging TA = Avoid trading; the asset lacks strong long-term potential.
Practical Example: Bitcoin
Fundamental AnalysisBitcoin’s limited supply (21 million) and increasing institutional adoption strengthen its long-term potential.News of ETF approval could drive positive sentiment.Technical AnalysisTA shows BTC breaking through a key resistance level with high volume.RSI is neutral, suggesting room for further upward movement.ConclusionCombine FA (positive sentiment) with TA (bullish breakout) to make a buy decision.
Tips for Using Both Analyses on Binance
FA Tools on Binance:Check Binance News for updates on market trends.Use Binance Research for in-depth reports on projects.TA Tools on Binance:Use advanced charting features to apply indicators and analyze price movements.Set price alerts for key levels to act on TA signals promptly.
Conclusion
Combining technical and fundamental analysis equips traders with a well-rounded strategy for navigating the volatile crypto markets. By leveraging both approaches, you can balance short-term opportunities with long-term insights, ultimately enhancing your decision-making and increasing your chances of success in trading.
#Crypto2025Trends
What Is Technical Analysis (TA)?
Technical analysis focuses on analyzing price charts and market data to predict future price movements.
Key Tools:Price Charts: Line, candlestick, and bar charts.Indicators: RSI, MACD, Bollinger Bands, Moving Averages.Chart Patterns: Head and Shoulders, Double Tops, Flags.Objective: Identify trends, support/resistance levels, and market entry/exit points.
What Is Fundamental Analysis (FA)?
Fundamental analysis examines the intrinsic value of an asset based on external factors.
Key Factors:Project Fundamentals: Team, roadmap, partnerships, and technology.Market Sentiment: News, regulations, and adoption rates.On-Chain Metrics: Network activity, token supply, and distribution.Objective: Understand the long-term potential of a cryptocurrency.
Why Combine Both?
Broader PerspectiveTA reveals short-term price movements.FA offers insights into long-term viability.Enhanced AccuracyTA confirms timing for trades based on FA signals.FA validates the fundamental strength of a TA signal.Risk MitigationCombining both methods reduces reliance on a single data point, lowering the risk of errors.
How to Combine TA and FA
1. Start with Fundamental Analysis
Evaluate Project Fundamentals:Research the whitepaper, team, use case, and competitive edge.Example: Ethereum’s shift to Proof-of-Stake (PoS) drove interest due to sustainability and scalability improvements.Check Market Sentiment:Monitor crypto news and social media for trends and announcements.Example: A regulatory crackdown can suppress bullish trends despite positive TA signals.Assess On-Chain Metrics:Use tools like Glassnode or CryptoQuant to evaluate metrics such as active addresses and transaction volumes.
2. Use Technical Analysis for Timing
Identify Trends:Use moving averages or trend lines to confirm whether the market is bullish or bearish.Pinpoint Entry and Exit Points:Utilize RSI to detect overbought/oversold conditions.Use Fibonacci retracements to identify key support and resistance levels.Track Volume:Increasing volume confirms the validity of price movements.
3. Combine Signals
Scenario Action
Positive FA + Confirming TA = Consider buying or holding.
Positive FA + Diverging TA = Wait for TA signals to align or use small positions.
Negative FA + Confirming TA = Trade cautiously; consider shorter time frames.
Negative FA + Diverging TA = Avoid trading; the asset lacks strong long-term potential.
Practical Example: Bitcoin
Fundamental AnalysisBitcoin’s limited supply (21 million) and increasing institutional adoption strengthen its long-term potential.News of ETF approval could drive positive sentiment.Technical AnalysisTA shows BTC breaking through a key resistance level with high volume.RSI is neutral, suggesting room for further upward movement.ConclusionCombine FA (positive sentiment) with TA (bullish breakout) to make a buy decision.
Tips for Using Both Analyses on Binance
FA Tools on Binance:Check Binance News for updates on market trends.Use Binance Research for in-depth reports on projects.TA Tools on Binance:Use advanced charting features to apply indicators and analyze price movements.Set price alerts for key levels to act on TA signals promptly.
Conclusion
Combining technical and fundamental analysis equips traders with a well-rounded strategy for navigating the volatile crypto markets. By leveraging both approaches, you can balance short-term opportunities with long-term insights, ultimately enhancing your decision-making and increasing your chances of success in trading.
#Crypto2025Trends
500

Article
Reading Whale Activity and Its Market ImpactIn the world of cryptocurrency, whales—individuals or entities holding large amounts of crypto—can significantly influence market movements. Understanding how whale activity affects market trends can help traders anticipate potential price changes and make more informed decisions.
What Is Whale Activity?
Whale activity refers to the movements and actions of large crypto holders in the market. This includes:
Massive Transactions: Transfers of large amounts of cryptocurrency between wallets, exchanges, or cold storage.Buy and Sell Orders: Whales placing large orders can cause significant price fluctuations.Accumulation and Distribution: Whales gradually accumulating or selling off assets over time.
Whale movements are often tracked through blockchain analytics, as most transactions are transparent.
Why Does Whale Activity Matter?
Liquidity Shifts: Whales moving assets onto exchanges may signal selling pressure, while withdrawing assets can indicate holding intentions.Price Volatility: Large buy or sell orders can lead to sudden spikes or drops in price.Market Sentiment: Whale behavior often influences retail traders, amplifying trends.
How to Track Whale Activity
On-Chain Analytics ToolsPlatforms like Whale Alert, Glassnode, and CryptoQuant monitor large transactions and wallet movements.Look for large deposits to exchanges, which might signal upcoming sell pressure.Order Book AnalysisObserve order books on exchanges like Binance. Large buy walls or sell walls can reveal whale intentions.A large sell wall might indicate resistance, while a buy wall could signal support.Whale Wallet MonitoringTrack known whale wallets to see their activity patterns.Wallets accumulating coins might hint at an impending price increase.
Types of Whale Activity and Their Impact
1. Large Exchange Deposits
What It Means: Whales transferring large amounts to exchanges typically intend to sell.Impact: Increased sell pressure may lead to a price drop.Action for Traders:Prepare for potential price dips.Use stop-loss orders to protect positions.
2. Large Withdrawals from Exchanges
What It Means: Whales moving assets off exchanges suggest a long-term holding strategy.Impact: Reduced sell pressure and possible price stabilization or increase.Action for Traders:Look for accumulation opportunities.
3. Sudden Large Trades
What It Means: A whale executing a massive buy or sell order can cause short-term volatility.Impact: Price spikes or dumps.Action for Traders:Monitor price levels and volume.Avoid chasing the market after abrupt movements.
4. Pump-and-Dump Activity
What It Means: Coordinated whale actions to manipulate prices for profit.Impact: Artificial price movements followed by rapid corrections.Action for Traders:Be cautious of sudden, unexplained price surges.Avoid buying into pumps without solid market justification.
Strategies to Respond to Whale Activity
Analyze ContextConsider market conditions. Whale activity may coincide with news events or market cycles.Follow the TrendWhen whales accumulate, consider aligning with their buying behavior.When they distribute, evaluate whether to sell or hold.Diversify Your PortfolioMinimize risk by spreading investments across multiple assets to avoid overexposure to whale-driven volatility.Use Binance ToolsUtilize advanced charting tools on Binance to analyze large trades and market depth.Enable alerts for unusual trading volumes or large price movements.
Real-World Examples
Bitcoin Bull Run 2020–2021Large institutions like MicroStrategy accumulated significant BTC, driving bullish sentiment and price increases.Market Dips Following Exchange DepositsSeveral times, large Bitcoin deposits to exchanges preceded price corrections, showing the impact of whale selling.
Conclusion
Understanding and tracking whale activity is an essential skill for any crypto trader. By observing wallet movements, order books, and on-chain data, you can better predict market trends and avoid being caught off guard by sudden price shifts. Stay vigilant and use tools like Binance’s market insights to incorporate whale analysis into your trading strategy.
#XmasCryptoMiracles
Reading Whale Activity and Its Market Impact
In the world of cryptocurrency, whales—individuals or entities holding large amounts of crypto—can significantly influence market movements. Understanding how whale activity affects market trends can help traders anticipate potential price changes and make more informed decisions.
What Is Whale Activity?
Whale activity refers to the movements and actions of large crypto holders in the market. This includes:
Massive Transactions: Transfers of large amounts of cryptocurrency between wallets, exchanges, or cold storage.Buy and Sell Orders: Whales placing large orders can cause significant price fluctuations.Accumulation and Distribution: Whales gradually accumulating or selling off assets over time.
Whale movements are often tracked through blockchain analytics, as most transactions are transparent.
Why Does Whale Activity Matter?
Liquidity Shifts: Whales moving assets onto exchanges may signal selling pressure, while withdrawing assets can indicate holding intentions.Price Volatility: Large buy or sell orders can lead to sudden spikes or drops in price.Market Sentiment: Whale behavior often influences retail traders, amplifying trends.
How to Track Whale Activity
On-Chain Analytics ToolsPlatforms like Whale Alert, Glassnode, and CryptoQuant monitor large transactions and wallet movements.Look for large deposits to exchanges, which might signal upcoming sell pressure.Order Book AnalysisObserve order books on exchanges like Binance. Large buy walls or sell walls can reveal whale intentions.A large sell wall might indicate resistance, while a buy wall could signal support.Whale Wallet MonitoringTrack known whale wallets to see their activity patterns.Wallets accumulating coins might hint at an impending price increase.
Types of Whale Activity and Their Impact
1. Large Exchange Deposits
What It Means: Whales transferring large amounts to exchanges typically intend to sell.Impact: Increased sell pressure may lead to a price drop.Action for Traders:Prepare for potential price dips.Use stop-loss orders to protect positions.
2. Large Withdrawals from Exchanges
What It Means: Whales moving assets off exchanges suggest a long-term holding strategy.Impact: Reduced sell pressure and possible price stabilization or increase.Action for Traders:Look for accumulation opportunities.
3. Sudden Large Trades
What It Means: A whale executing a massive buy or sell order can cause short-term volatility.Impact: Price spikes or dumps.Action for Traders:Monitor price levels and volume.Avoid chasing the market after abrupt movements.
4. Pump-and-Dump Activity
What It Means: Coordinated whale actions to manipulate prices for profit.Impact: Artificial price movements followed by rapid corrections.Action for Traders:Be cautious of sudden, unexplained price surges.Avoid buying into pumps without solid market justification.
Strategies to Respond to Whale Activity
Analyze ContextConsider market conditions. Whale activity may coincide with news events or market cycles.Follow the TrendWhen whales accumulate, consider aligning with their buying behavior.When they distribute, evaluate whether to sell or hold.Diversify Your PortfolioMinimize risk by spreading investments across multiple assets to avoid overexposure to whale-driven volatility.Use Binance ToolsUtilize advanced charting tools on Binance to analyze large trades and market depth.Enable alerts for unusual trading volumes or large price movements.
Real-World Examples
Bitcoin Bull Run 2020–2021Large institutions like MicroStrategy accumulated significant BTC, driving bullish sentiment and price increases.Market Dips Following Exchange DepositsSeveral times, large Bitcoin deposits to exchanges preceded price corrections, showing the impact of whale selling.
Conclusion
Understanding and tracking whale activity is an essential skill for any crypto trader. By observing wallet movements, order books, and on-chain data, you can better predict market trends and avoid being caught off guard by sudden price shifts. Stay vigilant and use tools like Binance’s market insights to incorporate whale analysis into your trading strategy.
#XmasCryptoMiracles
What Is Whale Activity?
Whale activity refers to the movements and actions of large crypto holders in the market. This includes:
Massive Transactions: Transfers of large amounts of cryptocurrency between wallets, exchanges, or cold storage.Buy and Sell Orders: Whales placing large orders can cause significant price fluctuations.Accumulation and Distribution: Whales gradually accumulating or selling off assets over time.
Whale movements are often tracked through blockchain analytics, as most transactions are transparent.
Why Does Whale Activity Matter?
Liquidity Shifts: Whales moving assets onto exchanges may signal selling pressure, while withdrawing assets can indicate holding intentions.Price Volatility: Large buy or sell orders can lead to sudden spikes or drops in price.Market Sentiment: Whale behavior often influences retail traders, amplifying trends.
How to Track Whale Activity
On-Chain Analytics ToolsPlatforms like Whale Alert, Glassnode, and CryptoQuant monitor large transactions and wallet movements.Look for large deposits to exchanges, which might signal upcoming sell pressure.Order Book AnalysisObserve order books on exchanges like Binance. Large buy walls or sell walls can reveal whale intentions.A large sell wall might indicate resistance, while a buy wall could signal support.Whale Wallet MonitoringTrack known whale wallets to see their activity patterns.Wallets accumulating coins might hint at an impending price increase.
Types of Whale Activity and Their Impact
1. Large Exchange Deposits
What It Means: Whales transferring large amounts to exchanges typically intend to sell.Impact: Increased sell pressure may lead to a price drop.Action for Traders:Prepare for potential price dips.Use stop-loss orders to protect positions.
2. Large Withdrawals from Exchanges
What It Means: Whales moving assets off exchanges suggest a long-term holding strategy.Impact: Reduced sell pressure and possible price stabilization or increase.Action for Traders:Look for accumulation opportunities.
3. Sudden Large Trades
What It Means: A whale executing a massive buy or sell order can cause short-term volatility.Impact: Price spikes or dumps.Action for Traders:Monitor price levels and volume.Avoid chasing the market after abrupt movements.
4. Pump-and-Dump Activity
What It Means: Coordinated whale actions to manipulate prices for profit.Impact: Artificial price movements followed by rapid corrections.Action for Traders:Be cautious of sudden, unexplained price surges.Avoid buying into pumps without solid market justification.
Strategies to Respond to Whale Activity
Analyze ContextConsider market conditions. Whale activity may coincide with news events or market cycles.Follow the TrendWhen whales accumulate, consider aligning with their buying behavior.When they distribute, evaluate whether to sell or hold.Diversify Your PortfolioMinimize risk by spreading investments across multiple assets to avoid overexposure to whale-driven volatility.Use Binance ToolsUtilize advanced charting tools on Binance to analyze large trades and market depth.Enable alerts for unusual trading volumes or large price movements.
Real-World Examples
Bitcoin Bull Run 2020–2021Large institutions like MicroStrategy accumulated significant BTC, driving bullish sentiment and price increases.Market Dips Following Exchange DepositsSeveral times, large Bitcoin deposits to exchanges preceded price corrections, showing the impact of whale selling.
Conclusion
Understanding and tracking whale activity is an essential skill for any crypto trader. By observing wallet movements, order books, and on-chain data, you can better predict market trends and avoid being caught off guard by sudden price shifts. Stay vigilant and use tools like Binance’s market insights to incorporate whale analysis into your trading strategy.
#XmasCryptoMiracles
2
502
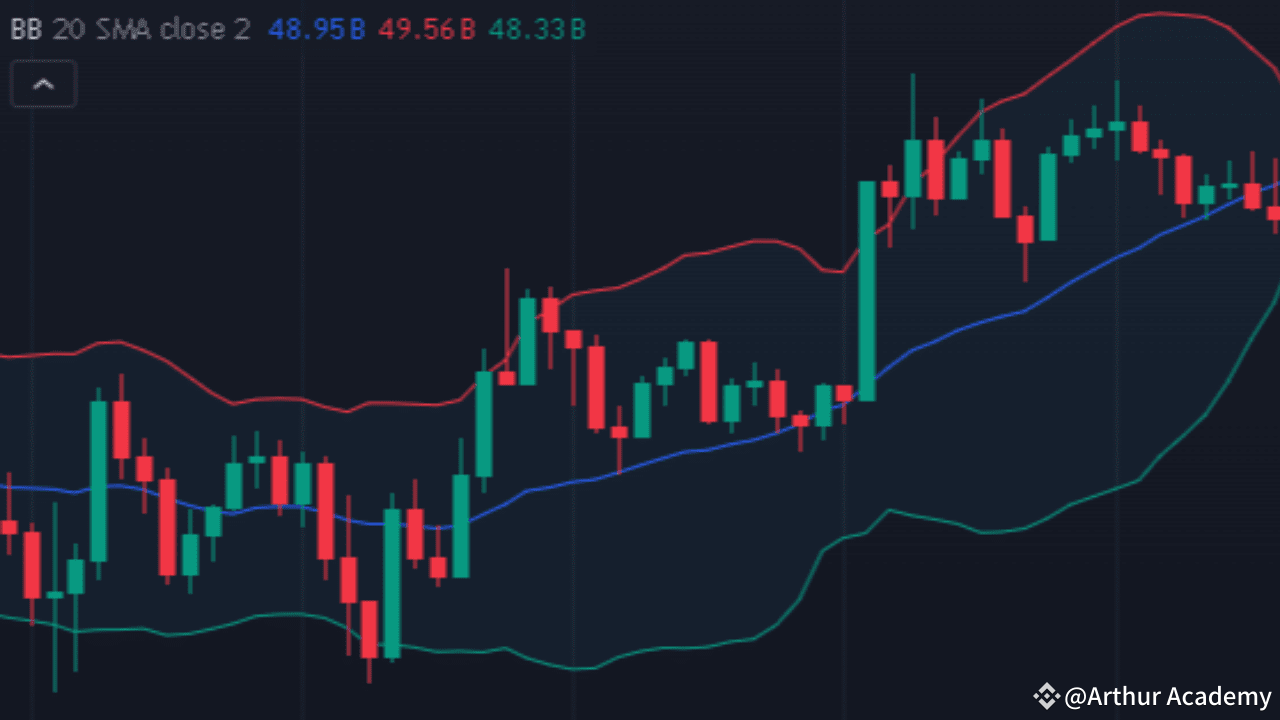
Article
Advanced Bollinger Bands TechniquesBollinger Bands are a versatile tool in technical analysis, widely used to assess market volatility and identify potential trading opportunities. While many traders are familiar with the basics, advanced techniques can unlock greater insights and improve trading strategies. Let’s dive into these advanced Bollinger Bands strategies tailored for crypto trading.
Quick Recap: What Are Bollinger Bands?
Bollinger Bands consist of:
Middle Band: A simple moving average (SMA).Upper Band: SMA plus 2 standard deviations of price.Lower Band: SMA minus 2 standard deviations of price.
The bands expand during high volatility and contract during low volatility, providing insights into market conditions.
1. Bollinger Band Squeeze Strategy
What It Is
The Bollinger Bands squeeze indicates periods of low volatility, often preceding significant price movements.
How to Use It
Look for a squeeze, where the upper and lower bands contract close to the SMA.Prepare for a breakout, but wait for confirmation (e.g., a candle closing outside the bands).Combine with volume analysis to confirm the direction of the breakout.
Pro Tip
Trade cautiously after the breakout; false breakouts can occur. Use stop-loss orders to manage risk.
2. Riding the Bands
What It Is
This technique involves trading trends that "ride" along the upper or lower Bollinger Band.
How to Use It
Bullish Trend: Price consistently touches or closes near the upper band while staying above the middle band.Bearish Trend: Price consistently touches or closes near the lower band while staying below the middle band.Use the middle band as a dynamic stop-loss level.
Pro Tip
Avoid trading against the trend when using this method. Ensure the trend is supported by strong volume.
3. Bollinger Band Divergences
What It Is
Divergences occur when price movement contradicts Bollinger Band behavior, signaling potential reversals.
How to Use It
Bullish Divergence: Price forms a lower low, but the lower band doesn’t extend further down.Bearish Divergence: Price forms a higher high, but the upper band doesn’t extend further up.Combine with momentum indicators like RSI for confirmation.
4. Double Bollinger Bands (DBBs)
What It Is
Using two sets of Bollinger Bands with different standard deviation settings (e.g., ±1 and ±2).
How to Use It
The area between the first and second bands (inner bands) indicates moderate volatility.When price stays outside the outer bands, it signals strong trends.Enter trades when the price moves from the inner bands toward the outer bands.
Pro Tip
DBBs can help refine entries and exits, particularly in trending markets.
5. Bollinger Bands with Other Indicators
What It Is
Combine Bollinger Bands with complementary indicators for deeper insights.
How to Use It
RSI (Relative Strength Index): Use RSI to confirm overbought/oversold conditions when price touches the bands.MACD (Moving Average Convergence Divergence): Look for MACD crossovers during Bollinger Band squeezes to predict breakout directions.Volume Analysis: Ensure breakout trades are supported by a spike in volume for higher reliability.
6. Bollinger Band Mean Reversion
What It Is
Prices tend to revert to the mean (middle band) after moving toward the upper or lower band.
How to Use It
When price touches the upper band in a ranging market, consider short positions.When price touches the lower band in a ranging market, consider long positions.Set take-profit levels near the middle band.
Pro Tip
Avoid this strategy during strong trending markets as prices may continue to ride the bands.
Using Bollinger Bands on Binance
Chart Tools: Binance’s charting tools allow easy customization of Bollinger Bands.Combine with Alerts: Set price alerts to notify you of band breakouts or squeezes.Test Strategies: Use the Binance Futures Testnet or a demo account to practice these techniques before live trading.
Conclusion
Mastering advanced Bollinger Bands techniques can significantly enhance your crypto trading skills. Whether you’re identifying squeezes for breakout opportunities, riding trends, or using double bands for precision, Bollinger Bands offer endless possibilities. Always combine these techniques with sound risk management and other indicators to maximize your success in the volatile crypto market.
#ReboundRally
Advanced Bollinger Bands Techniques
Bollinger Bands are a versatile tool in technical analysis, widely used to assess market volatility and identify potential trading opportunities. While many traders are familiar with the basics, advanced techniques can unlock greater insights and improve trading strategies. Let’s dive into these advanced Bollinger Bands strategies tailored for crypto trading.
Quick Recap: What Are Bollinger Bands?
Bollinger Bands consist of:
Middle Band: A simple moving average (SMA).Upper Band: SMA plus 2 standard deviations of price.Lower Band: SMA minus 2 standard deviations of price.
The bands expand during high volatility and contract during low volatility, providing insights into market conditions.
1. Bollinger Band Squeeze Strategy
What It Is
The Bollinger Bands squeeze indicates periods of low volatility, often preceding significant price movements.
How to Use It
Look for a squeeze, where the upper and lower bands contract close to the SMA.Prepare for a breakout, but wait for confirmation (e.g., a candle closing outside the bands).Combine with volume analysis to confirm the direction of the breakout.
Pro Tip
Trade cautiously after the breakout; false breakouts can occur. Use stop-loss orders to manage risk.
2. Riding the Bands
What It Is
This technique involves trading trends that "ride" along the upper or lower Bollinger Band.
How to Use It
Bullish Trend: Price consistently touches or closes near the upper band while staying above the middle band.Bearish Trend: Price consistently touches or closes near the lower band while staying below the middle band.Use the middle band as a dynamic stop-loss level.
Pro Tip
Avoid trading against the trend when using this method. Ensure the trend is supported by strong volume.
3. Bollinger Band Divergences
What It Is
Divergences occur when price movement contradicts Bollinger Band behavior, signaling potential reversals.
How to Use It
Bullish Divergence: Price forms a lower low, but the lower band doesn’t extend further down.Bearish Divergence: Price forms a higher high, but the upper band doesn’t extend further up.Combine with momentum indicators like RSI for confirmation.
4. Double Bollinger Bands (DBBs)
What It Is
Using two sets of Bollinger Bands with different standard deviation settings (e.g., ±1 and ±2).
How to Use It
The area between the first and second bands (inner bands) indicates moderate volatility.When price stays outside the outer bands, it signals strong trends.Enter trades when the price moves from the inner bands toward the outer bands.
Pro Tip
DBBs can help refine entries and exits, particularly in trending markets.
5. Bollinger Bands with Other Indicators
What It Is
Combine Bollinger Bands with complementary indicators for deeper insights.
How to Use It
RSI (Relative Strength Index): Use RSI to confirm overbought/oversold conditions when price touches the bands.MACD (Moving Average Convergence Divergence): Look for MACD crossovers during Bollinger Band squeezes to predict breakout directions.Volume Analysis: Ensure breakout trades are supported by a spike in volume for higher reliability.
6. Bollinger Band Mean Reversion
What It Is
Prices tend to revert to the mean (middle band) after moving toward the upper or lower band.
How to Use It
When price touches the upper band in a ranging market, consider short positions.When price touches the lower band in a ranging market, consider long positions.Set take-profit levels near the middle band.
Pro Tip
Avoid this strategy during strong trending markets as prices may continue to ride the bands.
Using Bollinger Bands on Binance
Chart Tools: Binance’s charting tools allow easy customization of Bollinger Bands.Combine with Alerts: Set price alerts to notify you of band breakouts or squeezes.Test Strategies: Use the Binance Futures Testnet or a demo account to practice these techniques before live trading.
Conclusion
Mastering advanced Bollinger Bands techniques can significantly enhance your crypto trading skills. Whether you’re identifying squeezes for breakout opportunities, riding trends, or using double bands for precision, Bollinger Bands offer endless possibilities. Always combine these techniques with sound risk management and other indicators to maximize your success in the volatile crypto market.
#ReboundRally
Quick Recap: What Are Bollinger Bands?
Bollinger Bands consist of:
Middle Band: A simple moving average (SMA).Upper Band: SMA plus 2 standard deviations of price.Lower Band: SMA minus 2 standard deviations of price.
The bands expand during high volatility and contract during low volatility, providing insights into market conditions.
1. Bollinger Band Squeeze Strategy
What It Is
The Bollinger Bands squeeze indicates periods of low volatility, often preceding significant price movements.
How to Use It
Look for a squeeze, where the upper and lower bands contract close to the SMA.Prepare for a breakout, but wait for confirmation (e.g., a candle closing outside the bands).Combine with volume analysis to confirm the direction of the breakout.
Pro Tip
Trade cautiously after the breakout; false breakouts can occur. Use stop-loss orders to manage risk.
2. Riding the Bands
What It Is
This technique involves trading trends that "ride" along the upper or lower Bollinger Band.
How to Use It
Bullish Trend: Price consistently touches or closes near the upper band while staying above the middle band.Bearish Trend: Price consistently touches or closes near the lower band while staying below the middle band.Use the middle band as a dynamic stop-loss level.
Pro Tip
Avoid trading against the trend when using this method. Ensure the trend is supported by strong volume.
3. Bollinger Band Divergences
What It Is
Divergences occur when price movement contradicts Bollinger Band behavior, signaling potential reversals.
How to Use It
Bullish Divergence: Price forms a lower low, but the lower band doesn’t extend further down.Bearish Divergence: Price forms a higher high, but the upper band doesn’t extend further up.Combine with momentum indicators like RSI for confirmation.
4. Double Bollinger Bands (DBBs)
What It Is
Using two sets of Bollinger Bands with different standard deviation settings (e.g., ±1 and ±2).
How to Use It
The area between the first and second bands (inner bands) indicates moderate volatility.When price stays outside the outer bands, it signals strong trends.Enter trades when the price moves from the inner bands toward the outer bands.
Pro Tip
DBBs can help refine entries and exits, particularly in trending markets.
5. Bollinger Bands with Other Indicators
What It Is
Combine Bollinger Bands with complementary indicators for deeper insights.
How to Use It
RSI (Relative Strength Index): Use RSI to confirm overbought/oversold conditions when price touches the bands.MACD (Moving Average Convergence Divergence): Look for MACD crossovers during Bollinger Band squeezes to predict breakout directions.Volume Analysis: Ensure breakout trades are supported by a spike in volume for higher reliability.
6. Bollinger Band Mean Reversion
What It Is
Prices tend to revert to the mean (middle band) after moving toward the upper or lower band.
How to Use It
When price touches the upper band in a ranging market, consider short positions.When price touches the lower band in a ranging market, consider long positions.Set take-profit levels near the middle band.
Pro Tip
Avoid this strategy during strong trending markets as prices may continue to ride the bands.
Using Bollinger Bands on Binance
Chart Tools: Binance’s charting tools allow easy customization of Bollinger Bands.Combine with Alerts: Set price alerts to notify you of band breakouts or squeezes.Test Strategies: Use the Binance Futures Testnet or a demo account to practice these techniques before live trading.
Conclusion
Mastering advanced Bollinger Bands techniques can significantly enhance your crypto trading skills. Whether you’re identifying squeezes for breakout opportunities, riding trends, or using double bands for precision, Bollinger Bands offer endless possibilities. Always combine these techniques with sound risk management and other indicators to maximize your success in the volatile crypto market.
#ReboundRally
153
Article
Intro to Smart Contracts and DeFi TokensSmart contracts and decentralized finance (DeFi) tokens have revolutionized the cryptocurrency world, enabling new financial opportunities and automation. Understanding their purpose and mechanics is essential for anyone entering the crypto space.
What Are Smart Contracts?
A smart contract is a self-executing program on a blockchain that automatically enforces agreements when specific conditions are met. These contracts eliminate the need for intermediaries, ensuring transparency, speed, and cost efficiency.
Key Features of Smart Contracts:
Automation: Executes transactions automatically.Immutable: Once deployed, the code can’t be altered.Transparent: Code and transactions are visible to all participants on the blockchain.
Popular Blockchain for Smart Contracts:
Ethereum: $ETH The pioneer in smart contract platforms.Binance Smart Chain (BSC): $BNB Offers faster and cheaper transactions compared to Ethereum.
Example Use Case:
Imagine renting a property using a smart contract. The contract automatically releases the security deposit to the landlord once you pay the rent and fulfill the terms.
What Are DeFi Tokens?
DeFi tokens power decentralized finance protocols, providing tools for borrowing, lending, staking, and trading without traditional banks.
Functions of DeFi Tokens:
Governance: Token holders vote on protocol changes.Staking Rewards: Tokens earned by staking or locking funds.Utility: Used within the ecosystem for fees or collateral.
Popular DeFi Tokens:
UNI (Uniswap): Powers the Uniswap decentralized exchange (DEX).CAKE (PancakeSwap): Used on Binance Smart Chain’s leading DEX.AAVE: Enables decentralized lending and borrowing.
How Do Smart Contracts and DeFi Tokens Work Together?
DeFi protocols rely on smart contracts to automate financial services:
Lending Platforms: Users lend crypto and earn interest, all managed by smart contracts.Decentralized Exchanges (DEXs): Traders swap tokens directly using automated market maker (AMM) contracts.Yield Farming: Smart contracts distribute rewards to liquidity providers.
Example: On PancakeSwap, smart contracts facilitate token swaps and distribute CAKE tokens as staking rewards.
Why Are They Important?
Eliminating Intermediaries: Cuts costs by removing banks and brokers.Global Accessibility: Anyone with internet access can participate.Innovation: Opens up new financial instruments like flash loans and liquidity pools.
Risks and Considerations
Smart Contract Bugs: Exploitable vulnerabilities in the code can result in losses.Market Volatility: DeFi tokens often experience significant price swings.Regulatory Uncertainty: The future of DeFi faces scrutiny from governments worldwide.
Getting Started with Smart Contracts and DeFi Tokens
On Binance Smart Chain (BSC):
Use Trust Wallet to connect to DeFi platforms.Start small by staking in PancakeSwap’s pools to earn CAKE.
Learning Resources:
Binance Academy offers in-depth guides on DeFi and smart contracts.Explore Ethereum’s smart contract examples to understand basic coding concepts.
Conclusion
Smart contracts and DeFi tokens are at the heart of the crypto revolution, transforming traditional finance into a more accessible and decentralized ecosystem. By understanding their mechanics and risks, you can unlock the potential of this rapidly growing sector. Whether you’re looking to trade, invest, or simply learn, platforms like Binance make it easy to explore and participate in the DeFi space.
{spot}(BNBUSDT)
#CryptoUsersHit18M
Intro to Smart Contracts and DeFi Tokens
Smart contracts and decentralized finance (DeFi) tokens have revolutionized the cryptocurrency world, enabling new financial opportunities and automation. Understanding their purpose and mechanics is essential for anyone entering the crypto space.
What Are Smart Contracts?
A smart contract is a self-executing program on a blockchain that automatically enforces agreements when specific conditions are met. These contracts eliminate the need for intermediaries, ensuring transparency, speed, and cost efficiency.
Key Features of Smart Contracts:
Automation: Executes transactions automatically.Immutable: Once deployed, the code can’t be altered.Transparent: Code and transactions are visible to all participants on the blockchain.
Popular Blockchain for Smart Contracts:
Ethereum: $ETH The pioneer in smart contract platforms.Binance Smart Chain (BSC): $BNB Offers faster and cheaper transactions compared to Ethereum.
Example Use Case:
Imagine renting a property using a smart contract. The contract automatically releases the security deposit to the landlord once you pay the rent and fulfill the terms.
What Are DeFi Tokens?
DeFi tokens power decentralized finance protocols, providing tools for borrowing, lending, staking, and trading without traditional banks.
Functions of DeFi Tokens:
Governance: Token holders vote on protocol changes.Staking Rewards: Tokens earned by staking or locking funds.Utility: Used within the ecosystem for fees or collateral.
Popular DeFi Tokens:
UNI (Uniswap): Powers the Uniswap decentralized exchange (DEX).CAKE (PancakeSwap): Used on Binance Smart Chain’s leading DEX.AAVE: Enables decentralized lending and borrowing.
How Do Smart Contracts and DeFi Tokens Work Together?
DeFi protocols rely on smart contracts to automate financial services:
Lending Platforms: Users lend crypto and earn interest, all managed by smart contracts.Decentralized Exchanges (DEXs): Traders swap tokens directly using automated market maker (AMM) contracts.Yield Farming: Smart contracts distribute rewards to liquidity providers.
Example: On PancakeSwap, smart contracts facilitate token swaps and distribute CAKE tokens as staking rewards.
Why Are They Important?
Eliminating Intermediaries: Cuts costs by removing banks and brokers.Global Accessibility: Anyone with internet access can participate.Innovation: Opens up new financial instruments like flash loans and liquidity pools.
Risks and Considerations
Smart Contract Bugs: Exploitable vulnerabilities in the code can result in losses.Market Volatility: DeFi tokens often experience significant price swings.Regulatory Uncertainty: The future of DeFi faces scrutiny from governments worldwide.
Getting Started with Smart Contracts and DeFi Tokens
On Binance Smart Chain (BSC):
Use Trust Wallet to connect to DeFi platforms.Start small by staking in PancakeSwap’s pools to earn CAKE.
Learning Resources:
Binance Academy offers in-depth guides on DeFi and smart contracts.Explore Ethereum’s smart contract examples to understand basic coding concepts.
Conclusion
Smart contracts and DeFi tokens are at the heart of the crypto revolution, transforming traditional finance into a more accessible and decentralized ecosystem. By understanding their mechanics and risks, you can unlock the potential of this rapidly growing sector. Whether you’re looking to trade, invest, or simply learn, platforms like Binance make it easy to explore and participate in the DeFi space.
#CryptoUsersHit18M
What Are Smart Contracts?
A smart contract is a self-executing program on a blockchain that automatically enforces agreements when specific conditions are met. These contracts eliminate the need for intermediaries, ensuring transparency, speed, and cost efficiency.
Key Features of Smart Contracts:
Automation: Executes transactions automatically.Immutable: Once deployed, the code can’t be altered.Transparent: Code and transactions are visible to all participants on the blockchain.
Popular Blockchain for Smart Contracts:
Ethereum: $ETH The pioneer in smart contract platforms.Binance Smart Chain (BSC): $BNB Offers faster and cheaper transactions compared to Ethereum.
Example Use Case:
Imagine renting a property using a smart contract. The contract automatically releases the security deposit to the landlord once you pay the rent and fulfill the terms.
What Are DeFi Tokens?
DeFi tokens power decentralized finance protocols, providing tools for borrowing, lending, staking, and trading without traditional banks.
Functions of DeFi Tokens:
Governance: Token holders vote on protocol changes.Staking Rewards: Tokens earned by staking or locking funds.Utility: Used within the ecosystem for fees or collateral.
Popular DeFi Tokens:
UNI (Uniswap): Powers the Uniswap decentralized exchange (DEX).CAKE (PancakeSwap): Used on Binance Smart Chain’s leading DEX.AAVE: Enables decentralized lending and borrowing.
How Do Smart Contracts and DeFi Tokens Work Together?
DeFi protocols rely on smart contracts to automate financial services:
Lending Platforms: Users lend crypto and earn interest, all managed by smart contracts.Decentralized Exchanges (DEXs): Traders swap tokens directly using automated market maker (AMM) contracts.Yield Farming: Smart contracts distribute rewards to liquidity providers.
Example: On PancakeSwap, smart contracts facilitate token swaps and distribute CAKE tokens as staking rewards.
Why Are They Important?
Eliminating Intermediaries: Cuts costs by removing banks and brokers.Global Accessibility: Anyone with internet access can participate.Innovation: Opens up new financial instruments like flash loans and liquidity pools.
Risks and Considerations
Smart Contract Bugs: Exploitable vulnerabilities in the code can result in losses.Market Volatility: DeFi tokens often experience significant price swings.Regulatory Uncertainty: The future of DeFi faces scrutiny from governments worldwide.
Getting Started with Smart Contracts and DeFi Tokens
On Binance Smart Chain (BSC):
Use Trust Wallet to connect to DeFi platforms.Start small by staking in PancakeSwap’s pools to earn CAKE.
Learning Resources:
Binance Academy offers in-depth guides on DeFi and smart contracts.Explore Ethereum’s smart contract examples to understand basic coding concepts.
Conclusion
Smart contracts and DeFi tokens are at the heart of the crypto revolution, transforming traditional finance into a more accessible and decentralized ecosystem. By understanding their mechanics and risks, you can unlock the potential of this rapidly growing sector. Whether you’re looking to trade, invest, or simply learn, platforms like Binance make it easy to explore and participate in the DeFi space.
#CryptoUsersHit18M
959

Article
TRON CEO Spends $6.2 Million on "Banana Art", Plans to Eat ItA U.S.-based crypto entrepreneur, Justin Sun, spent a jaw-dropping $6.2 million to purchase a controversial artwork featuring a banana duct-taped to a wall. His plans? To eat the banana as part of an “artistic experience.”
In 2019, Maurizio Cattelan’s satirical artwork “Comedian” created a stir on social media. Displayed at Art Basel Miami, it featured a single banana taped to a wall and sold for $120,000. Years later, this piece returned to the spotlight, selling for $6.2 million in an auction held by Sotheby’s in New York on November 20, 2024.
Justin Sun, the founder of TRON cryptocurrency, emerged victorious in the bidding war against six others, paying for the artwork entirely in cryptocurrency. Sun expressed his excitement on X (formerly Twitter):
"I’m thrilled to announce that I’ve successfully acquired Maurizio Cattelan’s iconic artwork, Comedian, for $6.2 million."
What Did He Actually Buy?
According to David Galperin, Sotheby’s head of contemporary art, the true value of “Comedian” isn’t in the banana itself. What buyers receive is a certificate of authenticity, which grants them the right to recreate the artwork.
“You’re not buying the banana; you’re buying the license to reproduce the artwork as an authentic Maurizio Cattelan creation,” explained Galperin.
Sun sees the purchase as more than a quirky investment. He believes “Comedian” bridges the worlds of art, memes, and cryptocurrency, labeling it a cultural phenomenon.
Rather than simply displaying the piece, Sun plans to eat the banana as a tribute to art and pop culture. “I’m honored to own Comedian and hope this inspires art lovers worldwide. I’ll also eat the banana privately in the coming days as a unique artistic experience to celebrate its place in history,” Sun shared.
The package Sun received included a roll of duct tape, instructions on how to display the banana properly, and a certificate of authenticity.
Impact on the Crypto Market
Justin Sun’s extravagant purchase could have ripple effects on the cryptocurrency market:
Boosted Publicity for TRON: As the TRON founder, Sun’s actions often double as marketing stunts. This event could draw more attention to TRON, potentially increasing its adoption and value.Highlighting Crypto’s Role in Art Investment: Paying for “Comedian” in cryptocurrency showcases how crypto is becoming a legitimate medium for high-profile transactions, possibly attracting more traditional investors to the crypto space.Market Sentiment Shifts: While some may see the purchase as a savvy move to connect crypto and culture, others might view it as frivolous. This mixed sentiment could lead to short-term market fluctuations.
In the long run, such events help position cryptocurrency as a versatile asset capable of influencing diverse sectors, including art, tech, and entertainment. However, it also raises questions about the sustainability of such high-profile, unconventional investments.
{spot}(TRXUSDT)
#2024WithBinance
TRON CEO Spends $6.2 Million on "Banana Art", Plans to Eat It
A U.S.-based crypto entrepreneur, Justin Sun, spent a jaw-dropping $6.2 million to purchase a controversial artwork featuring a banana duct-taped to a wall. His plans? To eat the banana as part of an “artistic experience.”
In 2019, Maurizio Cattelan’s satirical artwork “Comedian” created a stir on social media. Displayed at Art Basel Miami, it featured a single banana taped to a wall and sold for $120,000. Years later, this piece returned to the spotlight, selling for $6.2 million in an auction held by Sotheby’s in New York on November 20, 2024.
Justin Sun, the founder of TRON cryptocurrency, emerged victorious in the bidding war against six others, paying for the artwork entirely in cryptocurrency. Sun expressed his excitement on X (formerly Twitter):
"I’m thrilled to announce that I’ve successfully acquired Maurizio Cattelan’s iconic artwork, Comedian, for $6.2 million."
What Did He Actually Buy?
According to David Galperin, Sotheby’s head of contemporary art, the true value of “Comedian” isn’t in the banana itself. What buyers receive is a certificate of authenticity, which grants them the right to recreate the artwork.
“You’re not buying the banana; you’re buying the license to reproduce the artwork as an authentic Maurizio Cattelan creation,” explained Galperin.
Sun sees the purchase as more than a quirky investment. He believes “Comedian” bridges the worlds of art, memes, and cryptocurrency, labeling it a cultural phenomenon.
Rather than simply displaying the piece, Sun plans to eat the banana as a tribute to art and pop culture. “I’m honored to own Comedian and hope this inspires art lovers worldwide. I’ll also eat the banana privately in the coming days as a unique artistic experience to celebrate its place in history,” Sun shared.
The package Sun received included a roll of duct tape, instructions on how to display the banana properly, and a certificate of authenticity.
Impact on the Crypto Market
Justin Sun’s extravagant purchase could have ripple effects on the cryptocurrency market:
Boosted Publicity for TRON: As the TRON founder, Sun’s actions often double as marketing stunts. This event could draw more attention to TRON, potentially increasing its adoption and value.Highlighting Crypto’s Role in Art Investment: Paying for “Comedian” in cryptocurrency showcases how crypto is becoming a legitimate medium for high-profile transactions, possibly attracting more traditional investors to the crypto space.Market Sentiment Shifts: While some may see the purchase as a savvy move to connect crypto and culture, others might view it as frivolous. This mixed sentiment could lead to short-term market fluctuations.
In the long run, such events help position cryptocurrency as a versatile asset capable of influencing diverse sectors, including art, tech, and entertainment. However, it also raises questions about the sustainability of such high-profile, unconventional investments.
#2024WithBinance
In 2019, Maurizio Cattelan’s satirical artwork “Comedian” created a stir on social media. Displayed at Art Basel Miami, it featured a single banana taped to a wall and sold for $120,000. Years later, this piece returned to the spotlight, selling for $6.2 million in an auction held by Sotheby’s in New York on November 20, 2024.
Justin Sun, the founder of TRON cryptocurrency, emerged victorious in the bidding war against six others, paying for the artwork entirely in cryptocurrency. Sun expressed his excitement on X (formerly Twitter):
"I’m thrilled to announce that I’ve successfully acquired Maurizio Cattelan’s iconic artwork, Comedian, for $6.2 million."
What Did He Actually Buy?
According to David Galperin, Sotheby’s head of contemporary art, the true value of “Comedian” isn’t in the banana itself. What buyers receive is a certificate of authenticity, which grants them the right to recreate the artwork.
“You’re not buying the banana; you’re buying the license to reproduce the artwork as an authentic Maurizio Cattelan creation,” explained Galperin.
Sun sees the purchase as more than a quirky investment. He believes “Comedian” bridges the worlds of art, memes, and cryptocurrency, labeling it a cultural phenomenon.
Rather than simply displaying the piece, Sun plans to eat the banana as a tribute to art and pop culture. “I’m honored to own Comedian and hope this inspires art lovers worldwide. I’ll also eat the banana privately in the coming days as a unique artistic experience to celebrate its place in history,” Sun shared.
The package Sun received included a roll of duct tape, instructions on how to display the banana properly, and a certificate of authenticity.
Impact on the Crypto Market
Justin Sun’s extravagant purchase could have ripple effects on the cryptocurrency market:
Boosted Publicity for TRON: As the TRON founder, Sun’s actions often double as marketing stunts. This event could draw more attention to TRON, potentially increasing its adoption and value.Highlighting Crypto’s Role in Art Investment: Paying for “Comedian” in cryptocurrency showcases how crypto is becoming a legitimate medium for high-profile transactions, possibly attracting more traditional investors to the crypto space.Market Sentiment Shifts: While some may see the purchase as a savvy move to connect crypto and culture, others might view it as frivolous. This mixed sentiment could lead to short-term market fluctuations.
In the long run, such events help position cryptocurrency as a versatile asset capable of influencing diverse sectors, including art, tech, and entertainment. However, it also raises questions about the sustainability of such high-profile, unconventional investments.
#2024WithBinance
675

Article
Identifying and Avoiding Pump-and-Dump SchemesPump-and-dump schemes are one of the most common scams in the cryptocurrency world. These schemes manipulate the price of a cryptocurrency, enticing unsuspecting traders to invest, only for the orchestrators to sell at inflated prices, leaving others with significant losses. Here’s how to spot and steer clear of these traps.
What Is a Pump-and-Dump Scheme?
A pump-and-dump scheme involves artificially inflating the price of a cryptocurrency ("pumping") through misleading information, fake hype, or coordinated buying. Once the price peaks, scammers sell off their holdings ("dumping"), causing the price to plummet.
Common Targets:
Low-cap altcoins with limited liquidity.New tokens with minimal regulatory oversight.
How to Identify a Pump-and-Dump Scheme
1. Sudden Price Spikes Without News
Look for sharp, unexplained price increases. Legitimate surges are often accompanied by positive news, partnerships, or technological advancements. If there’s no obvious reason, be cautious.
2. Overhyped Social Media Posts
Scammers often use platforms like Telegram, Discord, or Twitter to spread FOMO (fear of missing out).
Promises of massive gains in a short time.Messages urging people to "buy now" before it’s too late.Anonymous accounts with no prior credibility.
3. Unusual Trading Volume
A sudden spike in trading volume, especially for lesser-known tokens, is a red flag. Use Binance’s market data tools to analyze volume trends.
4. Limited Information About the Token
Projects involved in pump-and-dump schemes often have vague goals, no whitepaper, or little online presence. If you can’t find detailed information about a cryptocurrency, it’s likely unreliable.
5. Coordinated Buying Patterns
If you see large buy orders or repeated transactions from the same wallets, this could indicate manipulation.
How to Avoid Falling for These Schemes
1. Do Your Own Research (DYOR)
Before investing in any cryptocurrency, investigate:
The project’s purpose and team.Its market cap, trading volume, and tokenomics.Past price behavior and growth patterns.
2. Be Skeptical of "Too Good to Be True" Promises
Avoid investments that promise overnight wealth or guaranteed returns. The crypto market is volatile, and no investment is risk-free.
3. Avoid FOMO
Scammers rely on creating urgency to manipulate traders. Take your time to assess the situation before making decisions.
4. Use Trusted Exchanges
Trade only on reputable platforms like Binance. Binance provides robust tools to analyze price movements, volume, and token legitimacy.
5. Stick to Known Cryptocurrencies
Established cryptocurrencies like Bitcoin (BTC) or Ethereum (ETH) are less likely to be targeted by pump-and-dump schemes due to their high liquidity and strong market presence.
6. Set Trading Limits
Use stop-loss and take-profit orders to protect your investments from sudden price crashes. Binance’s trading platform allows you to set these limits easily.
7. Monitor Regulatory Compliance
Tokens with regulatory approval or partnerships with trusted institutions are generally safer investments.
What to Do If You Suspect a Pump-and-Dump
Report the Activity: Notify the exchange where the trading is taking place.Avoid Investing Further: Don’t double down on a sinking token.Warn Others: Share your findings to protect other traders.
Real-Life Example: The Risks of Low-Cap Tokens
In 2021, many traders fell for pump-and-dump schemes targeting obscure tokens promoted on social media. Prices soared by hundreds of percent within minutes, only to crash just as quickly, leaving late investors with heavy losses.
Conclusion
Pump-and-dump schemes prey on uninformed traders and exploit market psychology. By staying vigilant, conducting thorough research, and avoiding FOMO, you can protect yourself from these scams. Always rely on trusted platforms like Binance to trade and use its tools to analyze and verify tokens before investing.
Trading smart means staying informed—don’t let hype cloud your judgment.
#ETHOnTheRise
Identifying and Avoiding Pump-and-Dump Schemes
Pump-and-dump schemes are one of the most common scams in the cryptocurrency world. These schemes manipulate the price of a cryptocurrency, enticing unsuspecting traders to invest, only for the orchestrators to sell at inflated prices, leaving others with significant losses. Here’s how to spot and steer clear of these traps.
What Is a Pump-and-Dump Scheme?
A pump-and-dump scheme involves artificially inflating the price of a cryptocurrency ("pumping") through misleading information, fake hype, or coordinated buying. Once the price peaks, scammers sell off their holdings ("dumping"), causing the price to plummet.
Common Targets:
Low-cap altcoins with limited liquidity.New tokens with minimal regulatory oversight.
How to Identify a Pump-and-Dump Scheme
1. Sudden Price Spikes Without News
Look for sharp, unexplained price increases. Legitimate surges are often accompanied by positive news, partnerships, or technological advancements. If there’s no obvious reason, be cautious.
2. Overhyped Social Media Posts
Scammers often use platforms like Telegram, Discord, or Twitter to spread FOMO (fear of missing out).
Promises of massive gains in a short time.Messages urging people to "buy now" before it’s too late.Anonymous accounts with no prior credibility.
3. Unusual Trading Volume
A sudden spike in trading volume, especially for lesser-known tokens, is a red flag. Use Binance’s market data tools to analyze volume trends.
4. Limited Information About the Token
Projects involved in pump-and-dump schemes often have vague goals, no whitepaper, or little online presence. If you can’t find detailed information about a cryptocurrency, it’s likely unreliable.
5. Coordinated Buying Patterns
If you see large buy orders or repeated transactions from the same wallets, this could indicate manipulation.
How to Avoid Falling for These Schemes
1. Do Your Own Research (DYOR)
Before investing in any cryptocurrency, investigate:
The project’s purpose and team.Its market cap, trading volume, and tokenomics.Past price behavior and growth patterns.
2. Be Skeptical of "Too Good to Be True" Promises
Avoid investments that promise overnight wealth or guaranteed returns. The crypto market is volatile, and no investment is risk-free.
3. Avoid FOMO
Scammers rely on creating urgency to manipulate traders. Take your time to assess the situation before making decisions.
4. Use Trusted Exchanges
Trade only on reputable platforms like Binance. Binance provides robust tools to analyze price movements, volume, and token legitimacy.
5. Stick to Known Cryptocurrencies
Established cryptocurrencies like Bitcoin (BTC) or Ethereum (ETH) are less likely to be targeted by pump-and-dump schemes due to their high liquidity and strong market presence.
6. Set Trading Limits
Use stop-loss and take-profit orders to protect your investments from sudden price crashes. Binance’s trading platform allows you to set these limits easily.
7. Monitor Regulatory Compliance
Tokens with regulatory approval or partnerships with trusted institutions are generally safer investments.
What to Do If You Suspect a Pump-and-Dump
Report the Activity: Notify the exchange where the trading is taking place.Avoid Investing Further: Don’t double down on a sinking token.Warn Others: Share your findings to protect other traders.
Real-Life Example: The Risks of Low-Cap Tokens
In 2021, many traders fell for pump-and-dump schemes targeting obscure tokens promoted on social media. Prices soared by hundreds of percent within minutes, only to crash just as quickly, leaving late investors with heavy losses.
Conclusion
Pump-and-dump schemes prey on uninformed traders and exploit market psychology. By staying vigilant, conducting thorough research, and avoiding FOMO, you can protect yourself from these scams. Always rely on trusted platforms like Binance to trade and use its tools to analyze and verify tokens before investing.
Trading smart means staying informed—don’t let hype cloud your judgment.
#ETHOnTheRise
What Is a Pump-and-Dump Scheme?
A pump-and-dump scheme involves artificially inflating the price of a cryptocurrency ("pumping") through misleading information, fake hype, or coordinated buying. Once the price peaks, scammers sell off their holdings ("dumping"), causing the price to plummet.
Common Targets:
Low-cap altcoins with limited liquidity.New tokens with minimal regulatory oversight.
How to Identify a Pump-and-Dump Scheme
1. Sudden Price Spikes Without News
Look for sharp, unexplained price increases. Legitimate surges are often accompanied by positive news, partnerships, or technological advancements. If there’s no obvious reason, be cautious.
2. Overhyped Social Media Posts
Scammers often use platforms like Telegram, Discord, or Twitter to spread FOMO (fear of missing out).
Promises of massive gains in a short time.Messages urging people to "buy now" before it’s too late.Anonymous accounts with no prior credibility.
3. Unusual Trading Volume
A sudden spike in trading volume, especially for lesser-known tokens, is a red flag. Use Binance’s market data tools to analyze volume trends.
4. Limited Information About the Token
Projects involved in pump-and-dump schemes often have vague goals, no whitepaper, or little online presence. If you can’t find detailed information about a cryptocurrency, it’s likely unreliable.
5. Coordinated Buying Patterns
If you see large buy orders or repeated transactions from the same wallets, this could indicate manipulation.
How to Avoid Falling for These Schemes
1. Do Your Own Research (DYOR)
Before investing in any cryptocurrency, investigate:
The project’s purpose and team.Its market cap, trading volume, and tokenomics.Past price behavior and growth patterns.
2. Be Skeptical of "Too Good to Be True" Promises
Avoid investments that promise overnight wealth or guaranteed returns. The crypto market is volatile, and no investment is risk-free.
3. Avoid FOMO
Scammers rely on creating urgency to manipulate traders. Take your time to assess the situation before making decisions.
4. Use Trusted Exchanges
Trade only on reputable platforms like Binance. Binance provides robust tools to analyze price movements, volume, and token legitimacy.
5. Stick to Known Cryptocurrencies
Established cryptocurrencies like Bitcoin (BTC) or Ethereum (ETH) are less likely to be targeted by pump-and-dump schemes due to their high liquidity and strong market presence.
6. Set Trading Limits
Use stop-loss and take-profit orders to protect your investments from sudden price crashes. Binance’s trading platform allows you to set these limits easily.
7. Monitor Regulatory Compliance
Tokens with regulatory approval or partnerships with trusted institutions are generally safer investments.
What to Do If You Suspect a Pump-and-Dump
Report the Activity: Notify the exchange where the trading is taking place.Avoid Investing Further: Don’t double down on a sinking token.Warn Others: Share your findings to protect other traders.
Real-Life Example: The Risks of Low-Cap Tokens
In 2021, many traders fell for pump-and-dump schemes targeting obscure tokens promoted on social media. Prices soared by hundreds of percent within minutes, only to crash just as quickly, leaving late investors with heavy losses.
Conclusion
Pump-and-dump schemes prey on uninformed traders and exploit market psychology. By staying vigilant, conducting thorough research, and avoiding FOMO, you can protect yourself from these scams. Always rely on trusted platforms like Binance to trade and use its tools to analyze and verify tokens before investing.
Trading smart means staying informed—don’t let hype cloud your judgment.
#ETHOnTheRise
241

Article
How to Conduct Fundamental Analysis in CryptoFundamental analysis (FA) is a powerful method to evaluate the true value of a cryptocurrency, helping traders make informed decisions. It focuses on understanding the underlying factors that drive an asset's long-term potential rather than short-term price movements. Here’s a comprehensive guide to conducting FA for cryptocurrencies, particularly when trading on platforms like Binance.
1. Understand the Project's Purpose
Key Questions to Ask:
What problem is the cryptocurrency solving?Is it offering a unique solution or improving existing technologies?Who are its competitors, and how does it differentiate itself?
Example: Ethereum introduced smart contracts, a game-changing innovation in blockchain technology.
2. Evaluate the Whitepaper
A cryptocurrency’s whitepaper serves as its blueprint, outlining its purpose, technology, and roadmap.
Key Points to Analyze:
Clarity of Objectives: Is the problem and solution clearly defined?Tokenomics: How is the cryptocurrency’s supply structured?Technology: Does the project offer an innovative or unique technology?
Red Flag: A poorly written or overly complex whitepaper can indicate a lack of seriousness or attempt to mislead.
3. Study the Team and Advisors
A strong team often correlates with the success of a cryptocurrency project.
Questions to Ask:
Do the team members have relevant experience in blockchain or related industries?Are the advisors credible and active?Is the team transparent and accessible via official channels?
Example: Projects led by recognized industry professionals, like Binance CEO Changpeng Zhao (CZ), instill confidence in investors.
4. Analyze Market Data
Market data provides a snapshot of a cryptocurrency’s position and potential.
Key Metrics:
Market Cap: High market cap assets are more stable, while lower caps offer high-risk, high-reward opportunities.Trading Volume: Indicates liquidity and market interest.Supply Metrics: Evaluate circulating supply, total supply, and inflation potential.
Pro Tip: Use Binance’s “Markets” section to review real-time data.
5. Check Developer Activity
A healthy development environment ensures continuous innovation and reliability.
How to Evaluate:
Visit repositories like GitHub for code updates and community contributions.Look for frequent updates and bug fixes.
Red Flag: Stagnant development activity could mean the project is inactive or abandoned.
6. Assess Partnerships and Integrations
Strong partnerships indicate trust and utility.
Key Points to Evaluate:
Are there partnerships with reputable organizations or platforms?Is the cryptocurrency integrated into real-world applications or other ecosystems?
Example: Chainlink (LINK) has partnered with various DeFi platforms to provide reliable data feeds.
7. Tokenomics and Use Case
Tokenomics refers to the economic model of a cryptocurrency.
What to Check:
Utility: Does the token have a clear purpose (e.g., governance, staking)?Supply Mechanism: Are new tokens introduced gradually or in large quantities?Burn Mechanisms: Regular token burns, like Binance Coin (BNB), increase scarcity.
8. Community and Social Presence
Community support can significantly influence a project’s growth.
How to Evaluate:
Check activity levels on Telegram, Discord, Twitter, and Reddit.Analyze the quality of discussions—are they focused on genuine interest or hype?
Tip: Beware of overhyped communities; focus on real engagement.
9. Security and Regulation
Security vulnerabilities or regulatory issues can severely impact a project.
Key Areas to Review:
Has the project undergone third-party audits (e.g., Certik)?What is its approach to complying with global regulations?
Example: Regulatory clarity often makes projects more attractive to institutional investors.
10. Review the Roadmap
A well-defined roadmap indicates a clear vision and direction.
Key Considerations:
Are the milestones realistic and achievable?Has the team met past deadlines consistently?
Tip: Look for projects with both short-term and long-term goals to ensure sustained growth.
Case Study: Binance Coin (BNB)
Purpose: Utility token for Binance exchange, used for fee discounts, staking, and DeFi applications.Tokenomics: Regular token burns reduce supply, increasing value over time.Development: Binance consistently rolls out new features, such as Binance Pay and Launchpad.Community: Large and engaged user base due to Binance’s global reach.Partnerships: Integrated with various DeFi platforms and merchant services.
Result: A fundamentally strong cryptocurrency with a clear utility and growth potential.
Conclusion
Fundamental analysis helps you look beyond the hype, focusing on what truly matters: the cryptocurrency’s value proposition, team, community, and market potential. By systematically evaluating these aspects, you can make informed decisions and build a robust crypto portfolio.
Always combine FA with proper risk management and technical analysis for a balanced trading approach, especially when trading on Binance.
#BSCOnTheRise
How to Conduct Fundamental Analysis in Crypto
Fundamental analysis (FA) is a powerful method to evaluate the true value of a cryptocurrency, helping traders make informed decisions. It focuses on understanding the underlying factors that drive an asset's long-term potential rather than short-term price movements. Here’s a comprehensive guide to conducting FA for cryptocurrencies, particularly when trading on platforms like Binance.
1. Understand the Project's Purpose
Key Questions to Ask:
What problem is the cryptocurrency solving?Is it offering a unique solution or improving existing technologies?Who are its competitors, and how does it differentiate itself?
Example: Ethereum introduced smart contracts, a game-changing innovation in blockchain technology.
2. Evaluate the Whitepaper
A cryptocurrency’s whitepaper serves as its blueprint, outlining its purpose, technology, and roadmap.
Key Points to Analyze:
Clarity of Objectives: Is the problem and solution clearly defined?Tokenomics: How is the cryptocurrency’s supply structured?Technology: Does the project offer an innovative or unique technology?
Red Flag: A poorly written or overly complex whitepaper can indicate a lack of seriousness or attempt to mislead.
3. Study the Team and Advisors
A strong team often correlates with the success of a cryptocurrency project.
Questions to Ask:
Do the team members have relevant experience in blockchain or related industries?Are the advisors credible and active?Is the team transparent and accessible via official channels?
Example: Projects led by recognized industry professionals, like Binance CEO Changpeng Zhao (CZ), instill confidence in investors.
4. Analyze Market Data
Market data provides a snapshot of a cryptocurrency’s position and potential.
Key Metrics:
Market Cap: High market cap assets are more stable, while lower caps offer high-risk, high-reward opportunities.Trading Volume: Indicates liquidity and market interest.Supply Metrics: Evaluate circulating supply, total supply, and inflation potential.
Pro Tip: Use Binance’s “Markets” section to review real-time data.
5. Check Developer Activity
A healthy development environment ensures continuous innovation and reliability.
How to Evaluate:
Visit repositories like GitHub for code updates and community contributions.Look for frequent updates and bug fixes.
Red Flag: Stagnant development activity could mean the project is inactive or abandoned.
6. Assess Partnerships and Integrations
Strong partnerships indicate trust and utility.
Key Points to Evaluate:
Are there partnerships with reputable organizations or platforms?Is the cryptocurrency integrated into real-world applications or other ecosystems?
Example: Chainlink (LINK) has partnered with various DeFi platforms to provide reliable data feeds.
7. Tokenomics and Use Case
Tokenomics refers to the economic model of a cryptocurrency.
What to Check:
Utility: Does the token have a clear purpose (e.g., governance, staking)?Supply Mechanism: Are new tokens introduced gradually or in large quantities?Burn Mechanisms: Regular token burns, like Binance Coin (BNB), increase scarcity.
8. Community and Social Presence
Community support can significantly influence a project’s growth.
How to Evaluate:
Check activity levels on Telegram, Discord, Twitter, and Reddit.Analyze the quality of discussions—are they focused on genuine interest or hype?
Tip: Beware of overhyped communities; focus on real engagement.
9. Security and Regulation
Security vulnerabilities or regulatory issues can severely impact a project.
Key Areas to Review:
Has the project undergone third-party audits (e.g., Certik)?What is its approach to complying with global regulations?
Example: Regulatory clarity often makes projects more attractive to institutional investors.
10. Review the Roadmap
A well-defined roadmap indicates a clear vision and direction.
Key Considerations:
Are the milestones realistic and achievable?Has the team met past deadlines consistently?
Tip: Look for projects with both short-term and long-term goals to ensure sustained growth.
Case Study: Binance Coin (BNB)
Purpose: Utility token for Binance exchange, used for fee discounts, staking, and DeFi applications.Tokenomics: Regular token burns reduce supply, increasing value over time.Development: Binance consistently rolls out new features, such as Binance Pay and Launchpad.Community: Large and engaged user base due to Binance’s global reach.Partnerships: Integrated with various DeFi platforms and merchant services.
Result: A fundamentally strong cryptocurrency with a clear utility and growth potential.
Conclusion
Fundamental analysis helps you look beyond the hype, focusing on what truly matters: the cryptocurrency’s value proposition, team, community, and market potential. By systematically evaluating these aspects, you can make informed decisions and build a robust crypto portfolio.
Always combine FA with proper risk management and technical analysis for a balanced trading approach, especially when trading on Binance.
#BSCOnTheRise
1. Understand the Project's Purpose
Key Questions to Ask:
What problem is the cryptocurrency solving?Is it offering a unique solution or improving existing technologies?Who are its competitors, and how does it differentiate itself?
Example: Ethereum introduced smart contracts, a game-changing innovation in blockchain technology.
2. Evaluate the Whitepaper
A cryptocurrency’s whitepaper serves as its blueprint, outlining its purpose, technology, and roadmap.
Key Points to Analyze:
Clarity of Objectives: Is the problem and solution clearly defined?Tokenomics: How is the cryptocurrency’s supply structured?Technology: Does the project offer an innovative or unique technology?
Red Flag: A poorly written or overly complex whitepaper can indicate a lack of seriousness or attempt to mislead.
3. Study the Team and Advisors
A strong team often correlates with the success of a cryptocurrency project.
Questions to Ask:
Do the team members have relevant experience in blockchain or related industries?Are the advisors credible and active?Is the team transparent and accessible via official channels?
Example: Projects led by recognized industry professionals, like Binance CEO Changpeng Zhao (CZ), instill confidence in investors.
4. Analyze Market Data
Market data provides a snapshot of a cryptocurrency’s position and potential.
Key Metrics:
Market Cap: High market cap assets are more stable, while lower caps offer high-risk, high-reward opportunities.Trading Volume: Indicates liquidity and market interest.Supply Metrics: Evaluate circulating supply, total supply, and inflation potential.
Pro Tip: Use Binance’s “Markets” section to review real-time data.
5. Check Developer Activity
A healthy development environment ensures continuous innovation and reliability.
How to Evaluate:
Visit repositories like GitHub for code updates and community contributions.Look for frequent updates and bug fixes.
Red Flag: Stagnant development activity could mean the project is inactive or abandoned.
6. Assess Partnerships and Integrations
Strong partnerships indicate trust and utility.
Key Points to Evaluate:
Are there partnerships with reputable organizations or platforms?Is the cryptocurrency integrated into real-world applications or other ecosystems?
Example: Chainlink (LINK) has partnered with various DeFi platforms to provide reliable data feeds.
7. Tokenomics and Use Case
Tokenomics refers to the economic model of a cryptocurrency.
What to Check:
Utility: Does the token have a clear purpose (e.g., governance, staking)?Supply Mechanism: Are new tokens introduced gradually or in large quantities?Burn Mechanisms: Regular token burns, like Binance Coin (BNB), increase scarcity.
8. Community and Social Presence
Community support can significantly influence a project’s growth.
How to Evaluate:
Check activity levels on Telegram, Discord, Twitter, and Reddit.Analyze the quality of discussions—are they focused on genuine interest or hype?
Tip: Beware of overhyped communities; focus on real engagement.
9. Security and Regulation
Security vulnerabilities or regulatory issues can severely impact a project.
Key Areas to Review:
Has the project undergone third-party audits (e.g., Certik)?What is its approach to complying with global regulations?
Example: Regulatory clarity often makes projects more attractive to institutional investors.
10. Review the Roadmap
A well-defined roadmap indicates a clear vision and direction.
Key Considerations:
Are the milestones realistic and achievable?Has the team met past deadlines consistently?
Tip: Look for projects with both short-term and long-term goals to ensure sustained growth.
Case Study: Binance Coin (BNB)
Purpose: Utility token for Binance exchange, used for fee discounts, staking, and DeFi applications.Tokenomics: Regular token burns reduce supply, increasing value over time.Development: Binance consistently rolls out new features, such as Binance Pay and Launchpad.Community: Large and engaged user base due to Binance’s global reach.Partnerships: Integrated with various DeFi platforms and merchant services.
Result: A fundamentally strong cryptocurrency with a clear utility and growth potential.
Conclusion
Fundamental analysis helps you look beyond the hype, focusing on what truly matters: the cryptocurrency’s value proposition, team, community, and market potential. By systematically evaluating these aspects, you can make informed decisions and build a robust crypto portfolio.
Always combine FA with proper risk management and technical analysis for a balanced trading approach, especially when trading on Binance.
#BSCOnTheRise
523

Article
Key Metrics for Analyzing AltcoinsWith thousands of altcoins in the cryptocurrency market, identifying the most promising ones can be overwhelming. To make informed decisions, you need to focus on specific key metrics that provide valuable insights into an altcoin's potential. This guide outlines the essential metrics to consider when analyzing altcoins, particularly for trading on platforms like Binance.
1. Market Capitalization
Definition:
Market capitalization is the total value of all the coins in circulation, calculated as:
Market Cap = Current Price × Circulating Supply
Why It Matters:
High Market Cap: Indicates stability but may have limited growth potential. Examples: $ETH $BNB .Low Market Cap: High risk but potentially high reward. Often includes newer or niche projects.
Use Case: Compare market caps of similar projects to identify undervalued options.
2. Volume and Liquidity
Definition:
Volume: Total value of an altcoin traded within a specific time frame (e.g., 24 hours).Liquidity: How easily the altcoin can be bought or sold without significantly affecting its price.
Why It Matters:
High volume and liquidity indicate active trading and easier entry/exit points.Low liquidity may lead to slippage, especially in large trades.
Use Case: On Binance, monitor the trading volume in the order book to identify actively traded altcoins.
3. Circulating vs. Total Supply
Definition:
Circulating Supply: Coins currently in circulation.Total Supply: The maximum number of coins that will ever exist.
Why It Matters:
A low circulating supply compared to the total supply may lead to inflationary pressure if new coins are introduced rapidly.A limited total supply often attracts investors due to scarcity (e.g., Bitcoin’s 21M cap).
Use Case: Assess supply dynamics to predict future price pressures.
4. Utility and Use Case
Definition:
The purpose of the altcoin within its ecosystem or in solving real-world problems.
Why It Matters:
Altcoins with strong use cases often have long-term growth potential.Example: Ethereum's smart contracts, Chainlink’s data oracles.
Use Case: Evaluate whitepapers or official websites to understand an altcoin's utility.
5. Developer Activity
Definition:
The frequency of updates, commits, and contributions to the project’s codebase.
Why It Matters:
Active development indicates a committed team and evolving technology.Stagnant activity may signal a lack of progress or abandonment.
Use Case: Use platforms like GitHub or crypto trackers to check the development status.
6. Community Engagement
Definition:
The level of support and activity from the altcoin's community.
Why It Matters:
A strong community often translates into organic adoption and marketing.Overhyped communities may inflate prices without fundamental backing.
Use Case: Monitor social media, forums, and official communication channels for sentiment and updates.
7. Partnerships and Integrations
Definition:
Collaborations with other projects, businesses, or institutions.
Why It Matters:
Real-world partnerships often validate the project’s use case and increase adoption.Example: Altcoins used in DeFi platforms or gaming ecosystems.
Use Case: Research the project's roadmap and press releases to identify key partnerships.
8. Competitors and Differentiation
Definition:
Other projects that offer similar solutions or target the same market.
Why It Matters:
Understanding competitors helps identify whether the altcoin offers a unique advantage.Example: Compare Polygon (MATIC) and Avalanche (AVAX) in the layer-2 scaling niche.
Use Case: Evaluate whitepapers, tokenomics, and technology to spot differentiating factors.
9. Tokenomics
Definition:
The economic model of the altcoin, including distribution, staking rewards, and incentives.
Why It Matters:
Well-designed tokenomics encourage holding and usage.Poorly designed tokenomics may lead to inflation and price instability.
Use Case: Analyze token distribution and staking mechanisms for sustainability.
10. Security and Audit Reports
Definition:
The altcoin's track record in avoiding hacks and vulnerabilities.
Why It Matters:
Security issues can devastate investor confidence and lead to significant losses.Audits by reputable firms signal reliability.
Use Case: Check if the project has undergone third-party audits (e.g., Certik, SlowMist).
Example: Applying These Metrics on Binance
Scenario: Comparing Altcoins A and B
Altcoin A:
Market Cap: $2 billionVolume: $500 millionUse Case: Decentralized storageDevelopment Activity: Frequent updates on GitHub
Altcoin B:
Market Cap: $200 millionVolume: $10 millionUse Case: Payment processingDevelopment Activity: Infrequent updates
Analysis:
Altcoin A has a robust development team and strong trading activity, making it a safer choice for long-term investment. Altcoin B, while riskier, may offer higher returns if its ecosystem gains adoption.
Conclusion
Analyzing altcoins involves more than just price movements; it requires understanding their market position, utility, and growth potential. By focusing on these key metrics, you can make better-informed trading decisions and minimize risks. Always combine these analyses with your trading strategy and risk management practices on Binance.
#AIAndGameFiBoom
Key Metrics for Analyzing Altcoins
With thousands of altcoins in the cryptocurrency market, identifying the most promising ones can be overwhelming. To make informed decisions, you need to focus on specific key metrics that provide valuable insights into an altcoin's potential. This guide outlines the essential metrics to consider when analyzing altcoins, particularly for trading on platforms like Binance.
1. Market Capitalization
Definition:
Market capitalization is the total value of all the coins in circulation, calculated as:
Market Cap = Current Price × Circulating Supply
Why It Matters:
High Market Cap: Indicates stability but may have limited growth potential. Examples: $ETH $BNB .Low Market Cap: High risk but potentially high reward. Often includes newer or niche projects.
Use Case: Compare market caps of similar projects to identify undervalued options.
2. Volume and Liquidity
Definition:
Volume: Total value of an altcoin traded within a specific time frame (e.g., 24 hours).Liquidity: How easily the altcoin can be bought or sold without significantly affecting its price.
Why It Matters:
High volume and liquidity indicate active trading and easier entry/exit points.Low liquidity may lead to slippage, especially in large trades.
Use Case: On Binance, monitor the trading volume in the order book to identify actively traded altcoins.
3. Circulating vs. Total Supply
Definition:
Circulating Supply: Coins currently in circulation.Total Supply: The maximum number of coins that will ever exist.
Why It Matters:
A low circulating supply compared to the total supply may lead to inflationary pressure if new coins are introduced rapidly.A limited total supply often attracts investors due to scarcity (e.g., Bitcoin’s 21M cap).
Use Case: Assess supply dynamics to predict future price pressures.
4. Utility and Use Case
Definition:
The purpose of the altcoin within its ecosystem or in solving real-world problems.
Why It Matters:
Altcoins with strong use cases often have long-term growth potential.Example: Ethereum's smart contracts, Chainlink’s data oracles.
Use Case: Evaluate whitepapers or official websites to understand an altcoin's utility.
5. Developer Activity
Definition:
The frequency of updates, commits, and contributions to the project’s codebase.
Why It Matters:
Active development indicates a committed team and evolving technology.Stagnant activity may signal a lack of progress or abandonment.
Use Case: Use platforms like GitHub or crypto trackers to check the development status.
6. Community Engagement
Definition:
The level of support and activity from the altcoin's community.
Why It Matters:
A strong community often translates into organic adoption and marketing.Overhyped communities may inflate prices without fundamental backing.
Use Case: Monitor social media, forums, and official communication channels for sentiment and updates.
7. Partnerships and Integrations
Definition:
Collaborations with other projects, businesses, or institutions.
Why It Matters:
Real-world partnerships often validate the project’s use case and increase adoption.Example: Altcoins used in DeFi platforms or gaming ecosystems.
Use Case: Research the project's roadmap and press releases to identify key partnerships.
8. Competitors and Differentiation
Definition:
Other projects that offer similar solutions or target the same market.
Why It Matters:
Understanding competitors helps identify whether the altcoin offers a unique advantage.Example: Compare Polygon (MATIC) and Avalanche (AVAX) in the layer-2 scaling niche.
Use Case: Evaluate whitepapers, tokenomics, and technology to spot differentiating factors.
9. Tokenomics
Definition:
The economic model of the altcoin, including distribution, staking rewards, and incentives.
Why It Matters:
Well-designed tokenomics encourage holding and usage.Poorly designed tokenomics may lead to inflation and price instability.
Use Case: Analyze token distribution and staking mechanisms for sustainability.
10. Security and Audit Reports
Definition:
The altcoin's track record in avoiding hacks and vulnerabilities.
Why It Matters:
Security issues can devastate investor confidence and lead to significant losses.Audits by reputable firms signal reliability.
Use Case: Check if the project has undergone third-party audits (e.g., Certik, SlowMist).
Example: Applying These Metrics on Binance
Scenario: Comparing Altcoins A and B
Altcoin A:
Market Cap: $2 billionVolume: $500 millionUse Case: Decentralized storageDevelopment Activity: Frequent updates on GitHub
Altcoin B:
Market Cap: $200 millionVolume: $10 millionUse Case: Payment processingDevelopment Activity: Infrequent updates
Analysis:
Altcoin A has a robust development team and strong trading activity, making it a safer choice for long-term investment. Altcoin B, while riskier, may offer higher returns if its ecosystem gains adoption.
Conclusion
Analyzing altcoins involves more than just price movements; it requires understanding their market position, utility, and growth potential. By focusing on these key metrics, you can make better-informed trading decisions and minimize risks. Always combine these analyses with your trading strategy and risk management practices on Binance.
#AIAndGameFiBoom
1. Market Capitalization
Definition:
Market capitalization is the total value of all the coins in circulation, calculated as:
Market Cap = Current Price × Circulating Supply
Why It Matters:
High Market Cap: Indicates stability but may have limited growth potential. Examples: $ETH $BNB .Low Market Cap: High risk but potentially high reward. Often includes newer or niche projects.
Use Case: Compare market caps of similar projects to identify undervalued options.
2. Volume and Liquidity
Definition:
Volume: Total value of an altcoin traded within a specific time frame (e.g., 24 hours).Liquidity: How easily the altcoin can be bought or sold without significantly affecting its price.
Why It Matters:
High volume and liquidity indicate active trading and easier entry/exit points.Low liquidity may lead to slippage, especially in large trades.
Use Case: On Binance, monitor the trading volume in the order book to identify actively traded altcoins.
3. Circulating vs. Total Supply
Definition:
Circulating Supply: Coins currently in circulation.Total Supply: The maximum number of coins that will ever exist.
Why It Matters:
A low circulating supply compared to the total supply may lead to inflationary pressure if new coins are introduced rapidly.A limited total supply often attracts investors due to scarcity (e.g., Bitcoin’s 21M cap).
Use Case: Assess supply dynamics to predict future price pressures.
4. Utility and Use Case
Definition:
The purpose of the altcoin within its ecosystem or in solving real-world problems.
Why It Matters:
Altcoins with strong use cases often have long-term growth potential.Example: Ethereum's smart contracts, Chainlink’s data oracles.
Use Case: Evaluate whitepapers or official websites to understand an altcoin's utility.
5. Developer Activity
Definition:
The frequency of updates, commits, and contributions to the project’s codebase.
Why It Matters:
Active development indicates a committed team and evolving technology.Stagnant activity may signal a lack of progress or abandonment.
Use Case: Use platforms like GitHub or crypto trackers to check the development status.
6. Community Engagement
Definition:
The level of support and activity from the altcoin's community.
Why It Matters:
A strong community often translates into organic adoption and marketing.Overhyped communities may inflate prices without fundamental backing.
Use Case: Monitor social media, forums, and official communication channels for sentiment and updates.
7. Partnerships and Integrations
Definition:
Collaborations with other projects, businesses, or institutions.
Why It Matters:
Real-world partnerships often validate the project’s use case and increase adoption.Example: Altcoins used in DeFi platforms or gaming ecosystems.
Use Case: Research the project's roadmap and press releases to identify key partnerships.
8. Competitors and Differentiation
Definition:
Other projects that offer similar solutions or target the same market.
Why It Matters:
Understanding competitors helps identify whether the altcoin offers a unique advantage.Example: Compare Polygon (MATIC) and Avalanche (AVAX) in the layer-2 scaling niche.
Use Case: Evaluate whitepapers, tokenomics, and technology to spot differentiating factors.
9. Tokenomics
Definition:
The economic model of the altcoin, including distribution, staking rewards, and incentives.
Why It Matters:
Well-designed tokenomics encourage holding and usage.Poorly designed tokenomics may lead to inflation and price instability.
Use Case: Analyze token distribution and staking mechanisms for sustainability.
10. Security and Audit Reports
Definition:
The altcoin's track record in avoiding hacks and vulnerabilities.
Why It Matters:
Security issues can devastate investor confidence and lead to significant losses.Audits by reputable firms signal reliability.
Use Case: Check if the project has undergone third-party audits (e.g., Certik, SlowMist).
Example: Applying These Metrics on Binance
Scenario: Comparing Altcoins A and B
Altcoin A:
Market Cap: $2 billionVolume: $500 millionUse Case: Decentralized storageDevelopment Activity: Frequent updates on GitHub
Altcoin B:
Market Cap: $200 millionVolume: $10 millionUse Case: Payment processingDevelopment Activity: Infrequent updates
Analysis:
Altcoin A has a robust development team and strong trading activity, making it a safer choice for long-term investment. Altcoin B, while riskier, may offer higher returns if its ecosystem gains adoption.
Conclusion
Analyzing altcoins involves more than just price movements; it requires understanding their market position, utility, and growth potential. By focusing on these key metrics, you can make better-informed trading decisions and minimize risks. Always combine these analyses with your trading strategy and risk management practices on Binance.
#AIAndGameFiBoom
772
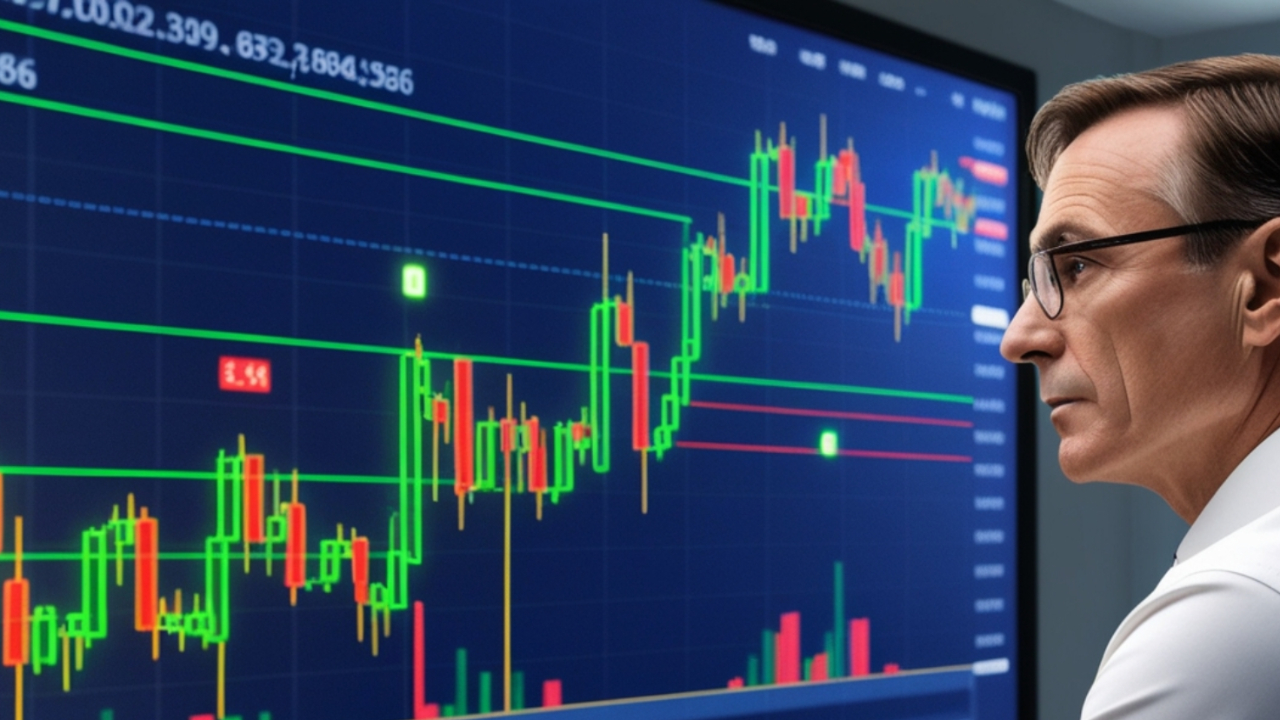
Article
How to Trade with Market Sentiment DataMarket sentiment, or the overall attitude of traders toward a particular cryptocurrency or the market as a whole, plays a crucial role in trading decisions. By understanding and leveraging market sentiment, you can gain an edge in predicting price movements and adjusting your strategy accordingly.
This guide explains what market sentiment data is, how to interpret it, and how to use it to trade effectively on platforms like Binance.
What Is Market Sentiment?
Market sentiment reflects the collective emotions, opinions, and attitudes of traders in the market. It can be categorized as:
Bullish: Optimism dominates, and prices are expected to rise.Bearish: Pessimism prevails, and prices are likely to decline.
Market sentiment is influenced by a range of factors, including:
News and Events: Regulatory changes, hacks, or technological upgrades.Social Media: Trends on platforms.Volume and Volatility: Significant price movements or trading activity.
Sources of Market Sentiment Data
Social Media and News Platforms:
Track trending topics, hashtags, or news stories to gauge market mood. Sentiment Indicators:_Fear & Greed Index: Measures overall market emotions ranging from extreme fear (pessimism) to extreme greed (optimism)._Crypto Heatmaps: Visual tools showing market performance by color coding gains and losses.Volume Metrics:
Analyze trading volume on Binance to identify shifts in trader behavior.
How to Trade with Market Sentiment
1. Identify Sentiment Trends
Bullish sentiment can signal an uptrend, while bearish sentiment may indicate a downtrend.Combine sentiment analysis with technical indicators like Moving Averages or RSI to confirm the trend.
2. Use Sentiment to Time Entries and Exits
During Extreme Fear: Consider buying, as prices may be undervalued due to panic selling.During Extreme Greed: Be cautious; prices may be overbought and primed for a correction.
3. Spot Market Reversals
Look for divergences between sentiment and price action. For example:Prices rise while sentiment becomes more bearish.Prices drop while sentiment turns more bullish.
4. Follow the Crowd (Sometimes)
In the short term, following the prevailing sentiment can be profitable, especially during strong trends.In the long term, consider contrarian strategies, buying when fear is high and selling during greed.
Using Market Sentiment on Binance
Spot Trading:
Combine sentiment data with order book depth on Binance to identify buying and selling pressure.Watch for sudden shifts in volume or order cancellations, which may reflect sentiment changes.
Futures Trading:
Sentiment can guide your decision to go long (bullish sentiment) or short (bearish sentiment).Monitor the Funding Rate: High positive funding rates may indicate bullish sentiment but can precede corrections.
Technical Indicators:
Use sentiment alongside tools like Bollinger Bands, MACD, or OBV to refine your entries and exits.
Example: Trading Based on Market Sentiment
Scenario:
The Fear & Greed Index shows extreme fear, and Bitcoin ($ETH ) has dropped 15% over the past week.Analysis:_ Sentiment suggests that fear is dominating._ On-chain data shows whales accumulating $ETH at lower prices.Action:_ Enter a long position on $ETH with proper risk management._ Set a stop-loss just below the recent low to minimize risk.
Tips for Effective Sentiment-Based Trading
Avoid Overreliance: Use sentiment as one part of your analysis, not the sole factor.Combine with Fundamentals: Assess whether sentiment aligns with the asset’s intrinsic value.Stay Updated: Monitor sentiment regularly, as it can shift rapidly in volatile markets like crypto.
Challenges and Limitations
Noise: Social media sentiment may be influenced by bots or hype.Short-Term Relevance: Sentiment can be fleeting, especially during high-volatility periods.Manipulation: Large players may spread news to sway sentiment for their benefit.
Conclusion
Market sentiment is a powerful tool for understanding crowd psychology and predicting potential price movements. By incorporating sentiment analysis into your trading strategy on Binance, you can better anticipate market trends, time your trades, and manage risks effectively. As with any strategy, balance sentiment with technical and fundamental analyses for a comprehensive approach.
#AltcoinMomentum
How to Trade with Market Sentiment Data
Market sentiment, or the overall attitude of traders toward a particular cryptocurrency or the market as a whole, plays a crucial role in trading decisions. By understanding and leveraging market sentiment, you can gain an edge in predicting price movements and adjusting your strategy accordingly.
This guide explains what market sentiment data is, how to interpret it, and how to use it to trade effectively on platforms like Binance.
What Is Market Sentiment?
Market sentiment reflects the collective emotions, opinions, and attitudes of traders in the market. It can be categorized as:
Bullish: Optimism dominates, and prices are expected to rise.Bearish: Pessimism prevails, and prices are likely to decline.
Market sentiment is influenced by a range of factors, including:
News and Events: Regulatory changes, hacks, or technological upgrades.Social Media: Trends on platforms.Volume and Volatility: Significant price movements or trading activity.
Sources of Market Sentiment Data
Social Media and News Platforms:
Track trending topics, hashtags, or news stories to gauge market mood. Sentiment Indicators:_Fear & Greed Index: Measures overall market emotions ranging from extreme fear (pessimism) to extreme greed (optimism)._Crypto Heatmaps: Visual tools showing market performance by color coding gains and losses.Volume Metrics:
Analyze trading volume on Binance to identify shifts in trader behavior.
How to Trade with Market Sentiment
1. Identify Sentiment Trends
Bullish sentiment can signal an uptrend, while bearish sentiment may indicate a downtrend.Combine sentiment analysis with technical indicators like Moving Averages or RSI to confirm the trend.
2. Use Sentiment to Time Entries and Exits
During Extreme Fear: Consider buying, as prices may be undervalued due to panic selling.During Extreme Greed: Be cautious; prices may be overbought and primed for a correction.
3. Spot Market Reversals
Look for divergences between sentiment and price action. For example:Prices rise while sentiment becomes more bearish.Prices drop while sentiment turns more bullish.
4. Follow the Crowd (Sometimes)
In the short term, following the prevailing sentiment can be profitable, especially during strong trends.In the long term, consider contrarian strategies, buying when fear is high and selling during greed.
Using Market Sentiment on Binance
Spot Trading:
Combine sentiment data with order book depth on Binance to identify buying and selling pressure.Watch for sudden shifts in volume or order cancellations, which may reflect sentiment changes.
Futures Trading:
Sentiment can guide your decision to go long (bullish sentiment) or short (bearish sentiment).Monitor the Funding Rate: High positive funding rates may indicate bullish sentiment but can precede corrections.
Technical Indicators:
Use sentiment alongside tools like Bollinger Bands, MACD, or OBV to refine your entries and exits.
Example: Trading Based on Market Sentiment
Scenario:
The Fear & Greed Index shows extreme fear, and Bitcoin ($ETH ) has dropped 15% over the past week.Analysis:_ Sentiment suggests that fear is dominating._ On-chain data shows whales accumulating $ETH at lower prices.Action:_ Enter a long position on $ETH with proper risk management._ Set a stop-loss just below the recent low to minimize risk.
Tips for Effective Sentiment-Based Trading
Avoid Overreliance: Use sentiment as one part of your analysis, not the sole factor.Combine with Fundamentals: Assess whether sentiment aligns with the asset’s intrinsic value.Stay Updated: Monitor sentiment regularly, as it can shift rapidly in volatile markets like crypto.
Challenges and Limitations
Noise: Social media sentiment may be influenced by bots or hype.Short-Term Relevance: Sentiment can be fleeting, especially during high-volatility periods.Manipulation: Large players may spread news to sway sentiment for their benefit.
Conclusion
Market sentiment is a powerful tool for understanding crowd psychology and predicting potential price movements. By incorporating sentiment analysis into your trading strategy on Binance, you can better anticipate market trends, time your trades, and manage risks effectively. As with any strategy, balance sentiment with technical and fundamental analyses for a comprehensive approach.
#AltcoinMomentum
This guide explains what market sentiment data is, how to interpret it, and how to use it to trade effectively on platforms like Binance.
What Is Market Sentiment?
Market sentiment reflects the collective emotions, opinions, and attitudes of traders in the market. It can be categorized as:
Bullish: Optimism dominates, and prices are expected to rise.Bearish: Pessimism prevails, and prices are likely to decline.
Market sentiment is influenced by a range of factors, including:
News and Events: Regulatory changes, hacks, or technological upgrades.Social Media: Trends on platforms.Volume and Volatility: Significant price movements or trading activity.
Sources of Market Sentiment Data
Social Media and News Platforms:
Track trending topics, hashtags, or news stories to gauge market mood. Sentiment Indicators:_Fear & Greed Index: Measures overall market emotions ranging from extreme fear (pessimism) to extreme greed (optimism)._Crypto Heatmaps: Visual tools showing market performance by color coding gains and losses.Volume Metrics:
Analyze trading volume on Binance to identify shifts in trader behavior.
How to Trade with Market Sentiment
1. Identify Sentiment Trends
Bullish sentiment can signal an uptrend, while bearish sentiment may indicate a downtrend.Combine sentiment analysis with technical indicators like Moving Averages or RSI to confirm the trend.
2. Use Sentiment to Time Entries and Exits
During Extreme Fear: Consider buying, as prices may be undervalued due to panic selling.During Extreme Greed: Be cautious; prices may be overbought and primed for a correction.
3. Spot Market Reversals
Look for divergences between sentiment and price action. For example:Prices rise while sentiment becomes more bearish.Prices drop while sentiment turns more bullish.
4. Follow the Crowd (Sometimes)
In the short term, following the prevailing sentiment can be profitable, especially during strong trends.In the long term, consider contrarian strategies, buying when fear is high and selling during greed.
Using Market Sentiment on Binance
Spot Trading:
Combine sentiment data with order book depth on Binance to identify buying and selling pressure.Watch for sudden shifts in volume or order cancellations, which may reflect sentiment changes.
Futures Trading:
Sentiment can guide your decision to go long (bullish sentiment) or short (bearish sentiment).Monitor the Funding Rate: High positive funding rates may indicate bullish sentiment but can precede corrections.
Technical Indicators:
Use sentiment alongside tools like Bollinger Bands, MACD, or OBV to refine your entries and exits.
Example: Trading Based on Market Sentiment
Scenario:
The Fear & Greed Index shows extreme fear, and Bitcoin ($ETH ) has dropped 15% over the past week.Analysis:_ Sentiment suggests that fear is dominating._ On-chain data shows whales accumulating $ETH at lower prices.Action:_ Enter a long position on $ETH with proper risk management._ Set a stop-loss just below the recent low to minimize risk.
Tips for Effective Sentiment-Based Trading
Avoid Overreliance: Use sentiment as one part of your analysis, not the sole factor.Combine with Fundamentals: Assess whether sentiment aligns with the asset’s intrinsic value.Stay Updated: Monitor sentiment regularly, as it can shift rapidly in volatile markets like crypto.
Challenges and Limitations
Noise: Social media sentiment may be influenced by bots or hype.Short-Term Relevance: Sentiment can be fleeting, especially during high-volatility periods.Manipulation: Large players may spread news to sway sentiment for their benefit.
Conclusion
Market sentiment is a powerful tool for understanding crowd psychology and predicting potential price movements. By incorporating sentiment analysis into your trading strategy on Binance, you can better anticipate market trends, time your trades, and manage risks effectively. As with any strategy, balance sentiment with technical and fundamental analyses for a comprehensive approach.
#AltcoinMomentum
164

Article
Understanding On-Balance Volume (OBV)On-Balance Volume (OBV) is a powerful technical indicator used by traders to analyze market momentum and predict price movements based on trading volume. Developed by Joseph Granville in the 1960s, OBV remains a go-to tool for crypto traders who want to gain insights into the strength of market trends.
This guide will explain how OBV works, how to calculate it, and how you can use it to enhance your trading strategy on platforms like Binance.
What Is On-Balance Volume (OBV)?
OBV measures the cumulative volume flow to indicate whether a particular asset is experiencing buying or selling pressure. The basic premise is that volume precedes price; changes in volume can signal potential price movements.
Key Concept:
When volume increases significantly without a corresponding price increase, a breakout may be imminent.Conversely, declining volume can signal a weakening trend.
How Is OBV Calculated?
OBV is calculated by adding or subtracting daily trading volume based on the asset's price movement:
If the closing price is higher than the previous close, add the day's volume to the OBV.If the closing price is lower than the previous close, subtract the day's volume from the OBV.If the price is unchanged, the OBV remains the same.
Formula:
OBV (today) = OBV (yesterday) + Volume (if price up)
OBV (today) = OBV (yesterday) − Volume (if price down)
How to Use OBV in Crypto Trading
Identifying Trends:OBV can confirm whether a price trend is strong or weak.
Uptrend: OBV rises along with the price, indicating strong buying interest.Downtrend: OBV falls as the price decreases, showing selling pressure.Spotting Divergences:Divergences between OBV and price can signal potential reversals.
Bullish Divergence: Price makes lower lows, but OBV makes higher lows, suggesting an upcoming price increase.Bearish Divergence: Price makes higher highs, but OBV makes lower highs, hinting at a possible price drop.Volume Breakouts:A sudden spike in OBV can indicate a breakout, even if the price hasn’t yet moved significantly.
Using OBV on Binance
To apply OBV on Binance, follow these steps:
Open a Chart: Go to Binance’s trading interface and select your desired asset (e.g., BTC/USDT).Add the OBV Indicator: In the chart tools section, search for "OBV" and apply it to the chart.Analyze the Trend: Observe how the OBV line moves relative to the price.Combine with Other Indicators: Enhance your analysis by pairing OBV with tools like RSI, Moving Averages, or Bollinger Bands.
Practical Example
Let’s say you’re analyzing the BTC/USDT pair:
Scenario: BTC is trading at $30,000, and OBV has been steadily increasing.Interpretation: Rising OBV suggests strong buying pressure, supporting the idea that BTC’s price may continue upward.Action: Consider entering a long position with appropriate risk management.
Alternatively:
If OBV starts to diverge from the price (e.g., OBV falls while BTC’s price rises), it might indicate a weakening trend or potential reversal.
Tips for Using OBV Effectively
Combine with Other Tools: OBV is best used alongside other technical indicators to confirm signals.Monitor Divergences: Pay close attention to OBV divergences for early trend reversal clues.Avoid Noise: Use OBV on higher timeframes (e.g., 4-hour, daily) to reduce false signals caused by short-term market fluctuations.
Limitations of OBV
Simplicity: OBV doesn’t account for the magnitude of price changes, which can sometimes lead to misleading signals.Market Manipulation: In the volatile crypto market, sudden volume spikes (whale trades) can distort OBV readings.Confirmation Tool: OBV alone shouldn’t dictate trading decisions—use it in conjunction with other analyses.
Conclusion
On-Balance Volume is a valuable tool for understanding market momentum and predicting potential price movements. By analyzing volume flow alongside price action, you can make more informed trading decisions on Binance. Practice using OBV with other indicators to create a robust strategy that aligns with your trading goals.
{future}(BTCUSDT)
Understanding On-Balance Volume (OBV)
On-Balance Volume (OBV) is a powerful technical indicator used by traders to analyze market momentum and predict price movements based on trading volume. Developed by Joseph Granville in the 1960s, OBV remains a go-to tool for crypto traders who want to gain insights into the strength of market trends.
This guide will explain how OBV works, how to calculate it, and how you can use it to enhance your trading strategy on platforms like Binance.
What Is On-Balance Volume (OBV)?
OBV measures the cumulative volume flow to indicate whether a particular asset is experiencing buying or selling pressure. The basic premise is that volume precedes price; changes in volume can signal potential price movements.
Key Concept:
When volume increases significantly without a corresponding price increase, a breakout may be imminent.Conversely, declining volume can signal a weakening trend.
How Is OBV Calculated?
OBV is calculated by adding or subtracting daily trading volume based on the asset's price movement:
If the closing price is higher than the previous close, add the day's volume to the OBV.If the closing price is lower than the previous close, subtract the day's volume from the OBV.If the price is unchanged, the OBV remains the same.
Formula:
OBV (today) = OBV (yesterday) + Volume (if price up)
OBV (today) = OBV (yesterday) − Volume (if price down)
How to Use OBV in Crypto Trading
Identifying Trends:OBV can confirm whether a price trend is strong or weak.
Uptrend: OBV rises along with the price, indicating strong buying interest.Downtrend: OBV falls as the price decreases, showing selling pressure.Spotting Divergences:Divergences between OBV and price can signal potential reversals.
Bullish Divergence: Price makes lower lows, but OBV makes higher lows, suggesting an upcoming price increase.Bearish Divergence: Price makes higher highs, but OBV makes lower highs, hinting at a possible price drop.Volume Breakouts:A sudden spike in OBV can indicate a breakout, even if the price hasn’t yet moved significantly.
Using OBV on Binance
To apply OBV on Binance, follow these steps:
Open a Chart: Go to Binance’s trading interface and select your desired asset (e.g., BTC/USDT).Add the OBV Indicator: In the chart tools section, search for "OBV" and apply it to the chart.Analyze the Trend: Observe how the OBV line moves relative to the price.Combine with Other Indicators: Enhance your analysis by pairing OBV with tools like RSI, Moving Averages, or Bollinger Bands.
Practical Example
Let’s say you’re analyzing the BTC/USDT pair:
Scenario: BTC is trading at $30,000, and OBV has been steadily increasing.Interpretation: Rising OBV suggests strong buying pressure, supporting the idea that BTC’s price may continue upward.Action: Consider entering a long position with appropriate risk management.
Alternatively:
If OBV starts to diverge from the price (e.g., OBV falls while BTC’s price rises), it might indicate a weakening trend or potential reversal.
Tips for Using OBV Effectively
Combine with Other Tools: OBV is best used alongside other technical indicators to confirm signals.Monitor Divergences: Pay close attention to OBV divergences for early trend reversal clues.Avoid Noise: Use OBV on higher timeframes (e.g., 4-hour, daily) to reduce false signals caused by short-term market fluctuations.
Limitations of OBV
Simplicity: OBV doesn’t account for the magnitude of price changes, which can sometimes lead to misleading signals.Market Manipulation: In the volatile crypto market, sudden volume spikes (whale trades) can distort OBV readings.Confirmation Tool: OBV alone shouldn’t dictate trading decisions—use it in conjunction with other analyses.
Conclusion
On-Balance Volume is a valuable tool for understanding market momentum and predicting potential price movements. By analyzing volume flow alongside price action, you can make more informed trading decisions on Binance. Practice using OBV with other indicators to create a robust strategy that aligns with your trading goals.
This guide will explain how OBV works, how to calculate it, and how you can use it to enhance your trading strategy on platforms like Binance.
What Is On-Balance Volume (OBV)?
OBV measures the cumulative volume flow to indicate whether a particular asset is experiencing buying or selling pressure. The basic premise is that volume precedes price; changes in volume can signal potential price movements.
Key Concept:
When volume increases significantly without a corresponding price increase, a breakout may be imminent.Conversely, declining volume can signal a weakening trend.
How Is OBV Calculated?
OBV is calculated by adding or subtracting daily trading volume based on the asset's price movement:
If the closing price is higher than the previous close, add the day's volume to the OBV.If the closing price is lower than the previous close, subtract the day's volume from the OBV.If the price is unchanged, the OBV remains the same.
Formula:
OBV (today) = OBV (yesterday) + Volume (if price up)
OBV (today) = OBV (yesterday) − Volume (if price down)
How to Use OBV in Crypto Trading
Identifying Trends:OBV can confirm whether a price trend is strong or weak.
Uptrend: OBV rises along with the price, indicating strong buying interest.Downtrend: OBV falls as the price decreases, showing selling pressure.Spotting Divergences:Divergences between OBV and price can signal potential reversals.
Bullish Divergence: Price makes lower lows, but OBV makes higher lows, suggesting an upcoming price increase.Bearish Divergence: Price makes higher highs, but OBV makes lower highs, hinting at a possible price drop.Volume Breakouts:A sudden spike in OBV can indicate a breakout, even if the price hasn’t yet moved significantly.
Using OBV on Binance
To apply OBV on Binance, follow these steps:
Open a Chart: Go to Binance’s trading interface and select your desired asset (e.g., BTC/USDT).Add the OBV Indicator: In the chart tools section, search for "OBV" and apply it to the chart.Analyze the Trend: Observe how the OBV line moves relative to the price.Combine with Other Indicators: Enhance your analysis by pairing OBV with tools like RSI, Moving Averages, or Bollinger Bands.
Practical Example
Let’s say you’re analyzing the BTC/USDT pair:
Scenario: BTC is trading at $30,000, and OBV has been steadily increasing.Interpretation: Rising OBV suggests strong buying pressure, supporting the idea that BTC’s price may continue upward.Action: Consider entering a long position with appropriate risk management.
Alternatively:
If OBV starts to diverge from the price (e.g., OBV falls while BTC’s price rises), it might indicate a weakening trend or potential reversal.
Tips for Using OBV Effectively
Combine with Other Tools: OBV is best used alongside other technical indicators to confirm signals.Monitor Divergences: Pay close attention to OBV divergences for early trend reversal clues.Avoid Noise: Use OBV on higher timeframes (e.g., 4-hour, daily) to reduce false signals caused by short-term market fluctuations.
Limitations of OBV
Simplicity: OBV doesn’t account for the magnitude of price changes, which can sometimes lead to misleading signals.Market Manipulation: In the volatile crypto market, sudden volume spikes (whale trades) can distort OBV readings.Confirmation Tool: OBV alone shouldn’t dictate trading decisions—use it in conjunction with other analyses.
Conclusion
On-Balance Volume is a valuable tool for understanding market momentum and predicting potential price movements. By analyzing volume flow alongside price action, you can make more informed trading decisions on Binance. Practice using OBV with other indicators to create a robust strategy that aligns with your trading goals.
291

Article
Building a High-Confidence Trading StrategyA well-thought-out trading strategy is essential for consistent success in cryptocurrency markets. It provides a structured approach to decision-making, helping traders minimize emotional responses and maximize profitability. This guide will help you build a trading strategy that fosters high confidence, adaptability, and long-term success.
Why Do You Need a Trading Strategy?
Eliminates Emotional Decisions: Reduces impulsive trading based on fear or greed.Increases Consistency: Ensures that every trade follows a clear, repeatable process.Improves Risk Management: Keeps potential losses in check while focusing on high-probability setups.Boosts Confidence: A tested strategy gives you trust in your approach, even during market turbulence.
Steps to Building a High-Confidence Trading Strategy
1. Define Your Goals
Short-Term or Long-Term: Decide if you’re focusing on scalping, day trading, swing trading, or investing.Profit Targets: Set realistic ROI expectations based on your capital and risk tolerance.Risk Appetite: Know how much capital you’re willing to risk per trade.
2. Understand the Market
Research the dynamics of crypto trading, including volatility, liquidity, and 24/7 operation.Familiarize yourself with Binance’s tools and resources, such as price charts, order types, and derivatives.
3. Choose a Trading Style
Trend Trading: Follow the direction of the market trend.Range Trading: Focus on assets moving within predictable price ranges.Breakout Trading: Enter trades when the price breaks through a key support or resistance level.
4. Develop Rules for Entry and Exit
High-confidence strategies rely on clear rules for entering and exiting trades.
Entry Rules:
Use indicators to confirm your decision. Examples include:Moving Averages (e.g., 50-day/200-day crossover).Relative Strength Index (RSI) to identify overbought or oversold conditions.Volume analysis to confirm the strength of a trend.Exit Rules:
Protect profits and limit losses with:Take-Profit Orders: Set predefined levels to secure gains.Stop-Loss Orders: Automatically close losing positions before they worsen.
5. Prioritize Risk Management
Confidence grows when risks are controlled.
Position Sizing: Limit each trade to a small percentage (e.g., 1-2%) of your total capital.Risk-Reward Ratio: Aim for a ratio of at least 1:2, where potential profit is double the potential loss.Diversification: Avoid putting all your funds into one asset.
6. Test Your Strategy
Backtesting: Analyze how your strategy would have performed using historical data.Paper Trading: Practice your strategy in real-time without risking actual funds. Binance offers demo accounts for beginners.
7. Track and Refine
Confidence builds through continuous learning and improvement.
Keep a Trading Journal: Record your trades, including reasons for entry/exit, outcomes, and lessons learned.Adjust your strategy based on market conditions and performance reviews.
Example Strategy: Trend Trading with RSI and Moving Averages
Setup:
Asset: $BTC Indicators: RSI (14), 50-day and 200-day Moving Averages
Entry Rule:
Enter a long trade when:
The 50-day MA crosses above the 200-day MA (Golden Cross).RSI is between 30-50 (indicating upward momentum).
Exit Rule:
Take profit at resistance levels or when RSI exceeds 70 (overbought).Set a stop-loss below the most recent swing low.
Common Pitfalls to Avoid
Overtrading: Entering too many trades without high-confidence setups.Ignoring Risk Management: Taking oversized positions that could wipe out your account.Neglecting Market Conditions: Applying a strategy blindly in unsuitable environments.
Conclusion
A high-confidence trading strategy is built on research, clear rules, and disciplined execution. By understanding the market, defining entry and exit criteria, and managing risks effectively, you can approach crypto trading with greater certainty. Remember, the key to success is consistency and adaptability—refine your strategy as you gain experience and market conditions evolve.
{future}(BTCUSDT)
Building a High-Confidence Trading Strategy
A well-thought-out trading strategy is essential for consistent success in cryptocurrency markets. It provides a structured approach to decision-making, helping traders minimize emotional responses and maximize profitability. This guide will help you build a trading strategy that fosters high confidence, adaptability, and long-term success.
Why Do You Need a Trading Strategy?
Eliminates Emotional Decisions: Reduces impulsive trading based on fear or greed.Increases Consistency: Ensures that every trade follows a clear, repeatable process.Improves Risk Management: Keeps potential losses in check while focusing on high-probability setups.Boosts Confidence: A tested strategy gives you trust in your approach, even during market turbulence.
Steps to Building a High-Confidence Trading Strategy
1. Define Your Goals
Short-Term or Long-Term: Decide if you’re focusing on scalping, day trading, swing trading, or investing.Profit Targets: Set realistic ROI expectations based on your capital and risk tolerance.Risk Appetite: Know how much capital you’re willing to risk per trade.
2. Understand the Market
Research the dynamics of crypto trading, including volatility, liquidity, and 24/7 operation.Familiarize yourself with Binance’s tools and resources, such as price charts, order types, and derivatives.
3. Choose a Trading Style
Trend Trading: Follow the direction of the market trend.Range Trading: Focus on assets moving within predictable price ranges.Breakout Trading: Enter trades when the price breaks through a key support or resistance level.
4. Develop Rules for Entry and Exit
High-confidence strategies rely on clear rules for entering and exiting trades.
Entry Rules:
Use indicators to confirm your decision. Examples include:Moving Averages (e.g., 50-day/200-day crossover).Relative Strength Index (RSI) to identify overbought or oversold conditions.Volume analysis to confirm the strength of a trend.Exit Rules:
Protect profits and limit losses with:Take-Profit Orders: Set predefined levels to secure gains.Stop-Loss Orders: Automatically close losing positions before they worsen.
5. Prioritize Risk Management
Confidence grows when risks are controlled.
Position Sizing: Limit each trade to a small percentage (e.g., 1-2%) of your total capital.Risk-Reward Ratio: Aim for a ratio of at least 1:2, where potential profit is double the potential loss.Diversification: Avoid putting all your funds into one asset.
6. Test Your Strategy
Backtesting: Analyze how your strategy would have performed using historical data.Paper Trading: Practice your strategy in real-time without risking actual funds. Binance offers demo accounts for beginners.
7. Track and Refine
Confidence builds through continuous learning and improvement.
Keep a Trading Journal: Record your trades, including reasons for entry/exit, outcomes, and lessons learned.Adjust your strategy based on market conditions and performance reviews.
Example Strategy: Trend Trading with RSI and Moving Averages
Setup:
Asset: $BTC Indicators: RSI (14), 50-day and 200-day Moving Averages
Entry Rule:
Enter a long trade when:
The 50-day MA crosses above the 200-day MA (Golden Cross).RSI is between 30-50 (indicating upward momentum).
Exit Rule:
Take profit at resistance levels or when RSI exceeds 70 (overbought).Set a stop-loss below the most recent swing low.
Common Pitfalls to Avoid
Overtrading: Entering too many trades without high-confidence setups.Ignoring Risk Management: Taking oversized positions that could wipe out your account.Neglecting Market Conditions: Applying a strategy blindly in unsuitable environments.
Conclusion
A high-confidence trading strategy is built on research, clear rules, and disciplined execution. By understanding the market, defining entry and exit criteria, and managing risks effectively, you can approach crypto trading with greater certainty. Remember, the key to success is consistency and adaptability—refine your strategy as you gain experience and market conditions evolve.
Why Do You Need a Trading Strategy?
Eliminates Emotional Decisions: Reduces impulsive trading based on fear or greed.Increases Consistency: Ensures that every trade follows a clear, repeatable process.Improves Risk Management: Keeps potential losses in check while focusing on high-probability setups.Boosts Confidence: A tested strategy gives you trust in your approach, even during market turbulence.
Steps to Building a High-Confidence Trading Strategy
1. Define Your Goals
Short-Term or Long-Term: Decide if you’re focusing on scalping, day trading, swing trading, or investing.Profit Targets: Set realistic ROI expectations based on your capital and risk tolerance.Risk Appetite: Know how much capital you’re willing to risk per trade.
2. Understand the Market
Research the dynamics of crypto trading, including volatility, liquidity, and 24/7 operation.Familiarize yourself with Binance’s tools and resources, such as price charts, order types, and derivatives.
3. Choose a Trading Style
Trend Trading: Follow the direction of the market trend.Range Trading: Focus on assets moving within predictable price ranges.Breakout Trading: Enter trades when the price breaks through a key support or resistance level.
4. Develop Rules for Entry and Exit
High-confidence strategies rely on clear rules for entering and exiting trades.
Entry Rules:
Use indicators to confirm your decision. Examples include:Moving Averages (e.g., 50-day/200-day crossover).Relative Strength Index (RSI) to identify overbought or oversold conditions.Volume analysis to confirm the strength of a trend.Exit Rules:
Protect profits and limit losses with:Take-Profit Orders: Set predefined levels to secure gains.Stop-Loss Orders: Automatically close losing positions before they worsen.
5. Prioritize Risk Management
Confidence grows when risks are controlled.
Position Sizing: Limit each trade to a small percentage (e.g., 1-2%) of your total capital.Risk-Reward Ratio: Aim for a ratio of at least 1:2, where potential profit is double the potential loss.Diversification: Avoid putting all your funds into one asset.
6. Test Your Strategy
Backtesting: Analyze how your strategy would have performed using historical data.Paper Trading: Practice your strategy in real-time without risking actual funds. Binance offers demo accounts for beginners.
7. Track and Refine
Confidence builds through continuous learning and improvement.
Keep a Trading Journal: Record your trades, including reasons for entry/exit, outcomes, and lessons learned.Adjust your strategy based on market conditions and performance reviews.
Example Strategy: Trend Trading with RSI and Moving Averages
Setup:
Asset: $BTC Indicators: RSI (14), 50-day and 200-day Moving Averages
Entry Rule:
Enter a long trade when:
The 50-day MA crosses above the 200-day MA (Golden Cross).RSI is between 30-50 (indicating upward momentum).
Exit Rule:
Take profit at resistance levels or when RSI exceeds 70 (overbought).Set a stop-loss below the most recent swing low.
Common Pitfalls to Avoid
Overtrading: Entering too many trades without high-confidence setups.Ignoring Risk Management: Taking oversized positions that could wipe out your account.Neglecting Market Conditions: Applying a strategy blindly in unsuitable environments.
Conclusion
A high-confidence trading strategy is built on research, clear rules, and disciplined execution. By understanding the market, defining entry and exit criteria, and managing risks effectively, you can approach crypto trading with greater certainty. Remember, the key to success is consistency and adaptability—refine your strategy as you gain experience and market conditions evolve.
606

Article
Trading Volume Patterns: What They RevealTrading volume, the total number of assets traded within a specific period, is a critical metric in cryptocurrency trading. It provides insights into market strength, trends, and potential price movements. Understanding volume patterns can help traders make informed decisions and anticipate market behavior.
What Is Trading Volume?
Trading volume reflects the total quantity of an asset bought and sold during a specific timeframe, such as an hour, a day, or a week. In crypto markets, this data is readily available on platforms like Binance, CoinMarketCap, and CoinGecko.
Why Is Trading Volume Important?
Confirms Price Trends: High volume during price movements indicates strong market interest, confirming the trend.Identifies Potential Reversals: Sudden spikes or drops in volume can signal a shift in market sentiment.Measures Liquidity: Higher volume means better liquidity, allowing traders to execute large trades without significant price changes.Detects Market Manipulation: Unusual volume patterns can indicate pump-and-dump schemes or whale activity.
Common Volume Patterns and Their Meanings
High Volume with Price IncreaseWhat It Means: Strong bullish sentiment. Buyers are dominating the market, pushing prices up.Example: $BTC sees a 5% rise in price alongside a surge in volume—indicating increased investor confidence.High Volume with Price DecreaseWhat It Means: Strong bearish sentiment. Sellers are overwhelming buyers, driving prices down.Example: $ETH drops 7% with high volume—suggesting a bearish trend.Low Volume with Price Increase or DecreaseWhat It Means: The trend is weak and might not sustain. Traders are hesitant to participate.Example: A coin rises 2% but with negligible volume—indicating a lack of conviction in the market.Volume SpikesWhat It Means: Can signal news events, whale activity, or manipulation. Watch for confirmation before trading.Example: A sudden 300% spike in volume without corresponding news might indicate speculative activity.Volume DivergenceWhat It Means: When price and volume move in opposite directions, it suggests a potential reversal.Example: Price rises while volume declines—indicating a weakening trend.
How to Use Volume in Trading
Combine Volume with Technical IndicatorsUse volume in conjunction with RSI, MACD, or Bollinger Bands to validate signals.Analyze Volume BreakoutsHigh volume during a breakout confirms the price movement. Low volume suggests a false breakout.Track Historical Volume TrendsCompare current volume levels with historical data to gauge market activity.Monitor Volume at Key LevelsVolume surges near support or resistance levels often indicate potential breakouts or reversals.
Risks in Relying Solely on Volume
False Signals: Spikes in volume may be caused by manipulation or one-off events.Short-Term Noise: High-frequency trading or bots can create misleading volume patterns.Lagging Data: Volume changes might lag behind price action in fast-moving markets.
Conclusion
Trading volume is a powerful tool for analyzing market trends, confirming price movements, and identifying potential reversals. By understanding volume patterns and combining them with other indicators, you can gain deeper insights into market behavior. However, always be cautious of false signals and conduct thorough research before making decisions.
Trading Volume Patterns: What They Reveal
Trading volume, the total number of assets traded within a specific period, is a critical metric in cryptocurrency trading. It provides insights into market strength, trends, and potential price movements. Understanding volume patterns can help traders make informed decisions and anticipate market behavior.
What Is Trading Volume?
Trading volume reflects the total quantity of an asset bought and sold during a specific timeframe, such as an hour, a day, or a week. In crypto markets, this data is readily available on platforms like Binance, CoinMarketCap, and CoinGecko.
Why Is Trading Volume Important?
Confirms Price Trends: High volume during price movements indicates strong market interest, confirming the trend.Identifies Potential Reversals: Sudden spikes or drops in volume can signal a shift in market sentiment.Measures Liquidity: Higher volume means better liquidity, allowing traders to execute large trades without significant price changes.Detects Market Manipulation: Unusual volume patterns can indicate pump-and-dump schemes or whale activity.
Common Volume Patterns and Their Meanings
High Volume with Price IncreaseWhat It Means: Strong bullish sentiment. Buyers are dominating the market, pushing prices up.Example: $BTC sees a 5% rise in price alongside a surge in volume—indicating increased investor confidence.High Volume with Price DecreaseWhat It Means: Strong bearish sentiment. Sellers are overwhelming buyers, driving prices down.Example: $ETH drops 7% with high volume—suggesting a bearish trend.Low Volume with Price Increase or DecreaseWhat It Means: The trend is weak and might not sustain. Traders are hesitant to participate.Example: A coin rises 2% but with negligible volume—indicating a lack of conviction in the market.Volume SpikesWhat It Means: Can signal news events, whale activity, or manipulation. Watch for confirmation before trading.Example: A sudden 300% spike in volume without corresponding news might indicate speculative activity.Volume DivergenceWhat It Means: When price and volume move in opposite directions, it suggests a potential reversal.Example: Price rises while volume declines—indicating a weakening trend.
How to Use Volume in Trading
Combine Volume with Technical IndicatorsUse volume in conjunction with RSI, MACD, or Bollinger Bands to validate signals.Analyze Volume BreakoutsHigh volume during a breakout confirms the price movement. Low volume suggests a false breakout.Track Historical Volume TrendsCompare current volume levels with historical data to gauge market activity.Monitor Volume at Key LevelsVolume surges near support or resistance levels often indicate potential breakouts or reversals.
Risks in Relying Solely on Volume
False Signals: Spikes in volume may be caused by manipulation or one-off events.Short-Term Noise: High-frequency trading or bots can create misleading volume patterns.Lagging Data: Volume changes might lag behind price action in fast-moving markets.
Conclusion
Trading volume is a powerful tool for analyzing market trends, confirming price movements, and identifying potential reversals. By understanding volume patterns and combining them with other indicators, you can gain deeper insights into market behavior. However, always be cautious of false signals and conduct thorough research before making decisions.
What Is Trading Volume?
Trading volume reflects the total quantity of an asset bought and sold during a specific timeframe, such as an hour, a day, or a week. In crypto markets, this data is readily available on platforms like Binance, CoinMarketCap, and CoinGecko.
Why Is Trading Volume Important?
Confirms Price Trends: High volume during price movements indicates strong market interest, confirming the trend.Identifies Potential Reversals: Sudden spikes or drops in volume can signal a shift in market sentiment.Measures Liquidity: Higher volume means better liquidity, allowing traders to execute large trades without significant price changes.Detects Market Manipulation: Unusual volume patterns can indicate pump-and-dump schemes or whale activity.
Common Volume Patterns and Their Meanings
High Volume with Price IncreaseWhat It Means: Strong bullish sentiment. Buyers are dominating the market, pushing prices up.Example: $BTC sees a 5% rise in price alongside a surge in volume—indicating increased investor confidence.High Volume with Price DecreaseWhat It Means: Strong bearish sentiment. Sellers are overwhelming buyers, driving prices down.Example: $ETH drops 7% with high volume—suggesting a bearish trend.Low Volume with Price Increase or DecreaseWhat It Means: The trend is weak and might not sustain. Traders are hesitant to participate.Example: A coin rises 2% but with negligible volume—indicating a lack of conviction in the market.Volume SpikesWhat It Means: Can signal news events, whale activity, or manipulation. Watch for confirmation before trading.Example: A sudden 300% spike in volume without corresponding news might indicate speculative activity.Volume DivergenceWhat It Means: When price and volume move in opposite directions, it suggests a potential reversal.Example: Price rises while volume declines—indicating a weakening trend.
How to Use Volume in Trading
Combine Volume with Technical IndicatorsUse volume in conjunction with RSI, MACD, or Bollinger Bands to validate signals.Analyze Volume BreakoutsHigh volume during a breakout confirms the price movement. Low volume suggests a false breakout.Track Historical Volume TrendsCompare current volume levels with historical data to gauge market activity.Monitor Volume at Key LevelsVolume surges near support or resistance levels often indicate potential breakouts or reversals.
Risks in Relying Solely on Volume
False Signals: Spikes in volume may be caused by manipulation or one-off events.Short-Term Noise: High-frequency trading or bots can create misleading volume patterns.Lagging Data: Volume changes might lag behind price action in fast-moving markets.
Conclusion
Trading volume is a powerful tool for analyzing market trends, confirming price movements, and identifying potential reversals. By understanding volume patterns and combining them with other indicators, you can gain deeper insights into market behavior. However, always be cautious of false signals and conduct thorough research before making decisions.
1.3k

Article
What Is Arbitrage? A Beginner’s GuideArbitrage is a trading strategy that takes advantage of price differences for the same asset across different markets. It’s a popular technique among cryptocurrency traders who aim to profit from these small price discrepancies without significant risk. In this guide, we’ll break down the basics of arbitrage, how it works, and how you can start using it.
What Is Arbitrage?
Arbitrage is the simultaneous buying and selling of an asset in two or more markets to profit from price differences. For instance, if Bitcoin is priced at $30,000 on Exchange A and $30,500 on Exchange B, a trader can buy it on Exchange A and sell it on Exchange B, pocketing the $500 difference (minus fees).
Why Do Price Differences Exist?
Price discrepancies occur due to:
Liquidity Differences: Some exchanges have higher trading volumes, leading to better price stability.Market Timing: Prices on smaller exchanges may lag behind larger ones.Geographical Variations: Regional demand and supply can affect prices.Trading Pair Availability: Not all exchanges support the same trading pairs, leading to differences in token valuation.
Types of Arbitrage in Crypto Trading
Simple ArbitrageBuy an asset on one exchange and sell it on another.Example: Buy ETH on Binance at $1,800 and sell it on KuCoin at $1,820.Triangular ArbitrageExploits price discrepancies between three trading pairs on a single exchange.Example: Start with BTC, trade it for ETH, convert ETH to USDT, and then USDT back to BTC, ending with a profit.Spatial ArbitrageTakes advantage of price differences between exchanges in different regions.Example: Buying a token on a U.S.-based exchange and selling it on an Asian-based exchange where demand is higher.Statistical ArbitrageUses algorithms and statistical models to identify and exploit temporary inefficiencies in the market.
How to Start Arbitrage Trading
1. Choose the Right Tools
Use price-tracking platforms like CoinMarketCap or CoinGecko to monitor prices across exchanges.Consider arbitrage bots that automate the process, such as those integrated with Binance.
2. Select Suitable Exchanges
Opt for exchanges with high liquidity and fast transaction speeds.Popular exchanges include Binance, Coinbase, and Kraken.
3. Manage Fees
Account for trading fees, withdrawal fees, and network transaction costs to ensure profitability.
4. Monitor Market Conditions
Arbitrage opportunities are fleeting. Speed and timing are critical.Look for price discrepancies during periods of high market volatility.
5. Be Aware of Risks
Execution Delays: Price gaps may close before trades are completed.Transfer Time: Moving assets between exchanges can take time and reduce profits.Slippage: The price may change while the trade is being executed.
Example of Arbitrage in Action
Step 1: Spot an opportunity: BTC is priced at $30,000 on Exchange A and $30,200 on Exchange B.Step 2: Buy BTC on Exchange A.Step 3: Transfer BTC to Exchange B (ensure network fees are accounted for).Step 4: Sell BTC on Exchange B for $30,200, pocketing the price difference minus fees.
Tips for Successful Arbitrage
Start Small: Test your strategy with small amounts to understand the process.Track Fees: Always calculate whether fees will eat into your profits.Automate: Use trading bots for faster execution, especially in high-frequency arbitrage.Research: Focus on exchanges with consistent price discrepancies.
Is Arbitrage Worth It?
Arbitrage offers a relatively low-risk way to trade in cryptocurrency markets. However, it requires careful planning, fast execution, and meticulous attention to fees and transfer times. While profits per trade might be small, they can add up over time, especially for traders who automate the process.
By mastering arbitrage, you can turn market inefficiencies into a steady source of income, even in volatile crypto markets.
{future}(BTCUSDT)
{future}(ETHUSDT)
What Is Arbitrage? A Beginner’s Guide
Arbitrage is a trading strategy that takes advantage of price differences for the same asset across different markets. It’s a popular technique among cryptocurrency traders who aim to profit from these small price discrepancies without significant risk. In this guide, we’ll break down the basics of arbitrage, how it works, and how you can start using it.
What Is Arbitrage?
Arbitrage is the simultaneous buying and selling of an asset in two or more markets to profit from price differences. For instance, if Bitcoin is priced at $30,000 on Exchange A and $30,500 on Exchange B, a trader can buy it on Exchange A and sell it on Exchange B, pocketing the $500 difference (minus fees).
Why Do Price Differences Exist?
Price discrepancies occur due to:
Liquidity Differences: Some exchanges have higher trading volumes, leading to better price stability.Market Timing: Prices on smaller exchanges may lag behind larger ones.Geographical Variations: Regional demand and supply can affect prices.Trading Pair Availability: Not all exchanges support the same trading pairs, leading to differences in token valuation.
Types of Arbitrage in Crypto Trading
Simple ArbitrageBuy an asset on one exchange and sell it on another.Example: Buy ETH on Binance at $1,800 and sell it on KuCoin at $1,820.Triangular ArbitrageExploits price discrepancies between three trading pairs on a single exchange.Example: Start with BTC, trade it for ETH, convert ETH to USDT, and then USDT back to BTC, ending with a profit.Spatial ArbitrageTakes advantage of price differences between exchanges in different regions.Example: Buying a token on a U.S.-based exchange and selling it on an Asian-based exchange where demand is higher.Statistical ArbitrageUses algorithms and statistical models to identify and exploit temporary inefficiencies in the market.
How to Start Arbitrage Trading
1. Choose the Right Tools
Use price-tracking platforms like CoinMarketCap or CoinGecko to monitor prices across exchanges.Consider arbitrage bots that automate the process, such as those integrated with Binance.
2. Select Suitable Exchanges
Opt for exchanges with high liquidity and fast transaction speeds.Popular exchanges include Binance, Coinbase, and Kraken.
3. Manage Fees
Account for trading fees, withdrawal fees, and network transaction costs to ensure profitability.
4. Monitor Market Conditions
Arbitrage opportunities are fleeting. Speed and timing are critical.Look for price discrepancies during periods of high market volatility.
5. Be Aware of Risks
Execution Delays: Price gaps may close before trades are completed.Transfer Time: Moving assets between exchanges can take time and reduce profits.Slippage: The price may change while the trade is being executed.
Example of Arbitrage in Action
Step 1: Spot an opportunity: BTC is priced at $30,000 on Exchange A and $30,200 on Exchange B.Step 2: Buy BTC on Exchange A.Step 3: Transfer BTC to Exchange B (ensure network fees are accounted for).Step 4: Sell BTC on Exchange B for $30,200, pocketing the price difference minus fees.
Tips for Successful Arbitrage
Start Small: Test your strategy with small amounts to understand the process.Track Fees: Always calculate whether fees will eat into your profits.Automate: Use trading bots for faster execution, especially in high-frequency arbitrage.Research: Focus on exchanges with consistent price discrepancies.
Is Arbitrage Worth It?
Arbitrage offers a relatively low-risk way to trade in cryptocurrency markets. However, it requires careful planning, fast execution, and meticulous attention to fees and transfer times. While profits per trade might be small, they can add up over time, especially for traders who automate the process.
By mastering arbitrage, you can turn market inefficiencies into a steady source of income, even in volatile crypto markets.
What Is Arbitrage?
Arbitrage is the simultaneous buying and selling of an asset in two or more markets to profit from price differences. For instance, if Bitcoin is priced at $30,000 on Exchange A and $30,500 on Exchange B, a trader can buy it on Exchange A and sell it on Exchange B, pocketing the $500 difference (minus fees).
Why Do Price Differences Exist?
Price discrepancies occur due to:
Liquidity Differences: Some exchanges have higher trading volumes, leading to better price stability.Market Timing: Prices on smaller exchanges may lag behind larger ones.Geographical Variations: Regional demand and supply can affect prices.Trading Pair Availability: Not all exchanges support the same trading pairs, leading to differences in token valuation.
Types of Arbitrage in Crypto Trading
Simple ArbitrageBuy an asset on one exchange and sell it on another.Example: Buy ETH on Binance at $1,800 and sell it on KuCoin at $1,820.Triangular ArbitrageExploits price discrepancies between three trading pairs on a single exchange.Example: Start with BTC, trade it for ETH, convert ETH to USDT, and then USDT back to BTC, ending with a profit.Spatial ArbitrageTakes advantage of price differences between exchanges in different regions.Example: Buying a token on a U.S.-based exchange and selling it on an Asian-based exchange where demand is higher.Statistical ArbitrageUses algorithms and statistical models to identify and exploit temporary inefficiencies in the market.
How to Start Arbitrage Trading
1. Choose the Right Tools
Use price-tracking platforms like CoinMarketCap or CoinGecko to monitor prices across exchanges.Consider arbitrage bots that automate the process, such as those integrated with Binance.
2. Select Suitable Exchanges
Opt for exchanges with high liquidity and fast transaction speeds.Popular exchanges include Binance, Coinbase, and Kraken.
3. Manage Fees
Account for trading fees, withdrawal fees, and network transaction costs to ensure profitability.
4. Monitor Market Conditions
Arbitrage opportunities are fleeting. Speed and timing are critical.Look for price discrepancies during periods of high market volatility.
5. Be Aware of Risks
Execution Delays: Price gaps may close before trades are completed.Transfer Time: Moving assets between exchanges can take time and reduce profits.Slippage: The price may change while the trade is being executed.
Example of Arbitrage in Action
Step 1: Spot an opportunity: BTC is priced at $30,000 on Exchange A and $30,200 on Exchange B.Step 2: Buy BTC on Exchange A.Step 3: Transfer BTC to Exchange B (ensure network fees are accounted for).Step 4: Sell BTC on Exchange B for $30,200, pocketing the price difference minus fees.
Tips for Successful Arbitrage
Start Small: Test your strategy with small amounts to understand the process.Track Fees: Always calculate whether fees will eat into your profits.Automate: Use trading bots for faster execution, especially in high-frequency arbitrage.Research: Focus on exchanges with consistent price discrepancies.
Is Arbitrage Worth It?
Arbitrage offers a relatively low-risk way to trade in cryptocurrency markets. However, it requires careful planning, fast execution, and meticulous attention to fees and transfer times. While profits per trade might be small, they can add up over time, especially for traders who automate the process.
By mastering arbitrage, you can turn market inefficiencies into a steady source of income, even in volatile crypto markets.
408

Article
Introduction to Decentralized Finance (DeFi) TradingDecentralized Finance (DeFi) is revolutionizing the financial world by providing an open, permissionless, and transparent ecosystem for trading, lending, borrowing, and earning passive income. Unlike traditional finance, DeFi operates without intermediaries like banks, relying instead on blockchain technology and smart contracts. If you're new to DeFi trading, this guide will help you understand the basics and how to get started.
What is DeFi Trading?
DeFi trading involves the buying and selling of cryptocurrencies and tokens on decentralized platforms. It eliminates the need for centralized exchanges (CEXs) by utilizing decentralized exchanges (DEXs), such as Uniswap, PancakeSwap, and SushiSwap.
Key features include:
Peer-to-Peer Transactions: Trades occur directly between users.Smart Contracts: Automated protocols ensure secure and transparent transactions.Control: Users retain full custody of their assets through private wallets.
Benefits of DeFi Trading
Accessibility: Anyone with an internet connection and a crypto wallet can participate.No Intermediaries: Reduced fees and faster transactions.Global Market: Access to a wide variety of tokens and projects from around the world.Transparency: All transactions are visible on the blockchain.
Risks of DeFi Trading
Volatility: Cryptocurrency prices can change rapidly.Smart Contract Vulnerabilities: Bugs or exploits in smart contracts can lead to losses.Scams and Rug Pulls: Some projects may be fraudulent.No Customer Support: Unlike centralized exchanges, users must manage their own funds and security.
How to Start DeFi Trading
Step 1: Set Up a Crypto Wallet
A crypto wallet is essential for interacting with DeFi platforms. Popular options include:
MetaMask (Ethereum-based platforms).Trust Wallet (Binance Smart Chain and others).Phantom (Solana).
Step 2: Fund Your Wallet
Transfer cryptocurrency (e.g., $ETH $BNB or $SOL ) to your wallet. Use centralized exchanges like Binance to purchase crypto and transfer it to your wallet.
Step 3: Connect to a Decentralized Exchange (DEX)
Visit a DEX and connect your wallet. Examples include:
Uniswap: For Ethereum-based tokens.PancakeSwap: For Binance Smart Chain tokens.SushiSwap: Multi-chain support.
Step 4: Select a Trading Pair
Choose the token you want to trade and the token you wish to receive.
Example: Trade ETH for USDT.
Step 5: Confirm the Trade
Approve the transaction through your wallet. The DEX will process your trade automatically.
Popular DeFi Strategies
Yield Farming
Provide liquidity to a DEX and earn rewards in the form of fees or tokens.Staking
Lock up your tokens in a protocol to earn interest or rewards.Arbitrage
Take advantage of price differences between DEXs.Speculative Trading
Buy and sell tokens based on market analysis and trends.
Tips for Safe DeFi Trading
Do Your Research (DYOR): Verify the legitimacy of projects and tokens.Start Small: Test the waters with small trades.Monitor Gas Fees: Fees can vary significantly, especially on the Ethereum network.Enable Security Features: Use hardware wallets and secure your private keys.Stay Updated: Follow DeFi news and updates to avoid scams and stay informed.
Conclusion
DeFi trading offers a world of opportunities for traders seeking a decentralized alternative to traditional finance. While the ecosystem is exciting and innovative, it's also complex and comes with risks. By understanding the basics, using secure platforms, and managing risks effectively, you can explore DeFi trading with confidence and potentially unlock new financial possibilities.
Introduction to Decentralized Finance (DeFi) Trading
Decentralized Finance (DeFi) is revolutionizing the financial world by providing an open, permissionless, and transparent ecosystem for trading, lending, borrowing, and earning passive income. Unlike traditional finance, DeFi operates without intermediaries like banks, relying instead on blockchain technology and smart contracts. If you're new to DeFi trading, this guide will help you understand the basics and how to get started.
What is DeFi Trading?
DeFi trading involves the buying and selling of cryptocurrencies and tokens on decentralized platforms. It eliminates the need for centralized exchanges (CEXs) by utilizing decentralized exchanges (DEXs), such as Uniswap, PancakeSwap, and SushiSwap.
Key features include:
Peer-to-Peer Transactions: Trades occur directly between users.Smart Contracts: Automated protocols ensure secure and transparent transactions.Control: Users retain full custody of their assets through private wallets.
Benefits of DeFi Trading
Accessibility: Anyone with an internet connection and a crypto wallet can participate.No Intermediaries: Reduced fees and faster transactions.Global Market: Access to a wide variety of tokens and projects from around the world.Transparency: All transactions are visible on the blockchain.
Risks of DeFi Trading
Volatility: Cryptocurrency prices can change rapidly.Smart Contract Vulnerabilities: Bugs or exploits in smart contracts can lead to losses.Scams and Rug Pulls: Some projects may be fraudulent.No Customer Support: Unlike centralized exchanges, users must manage their own funds and security.
How to Start DeFi Trading
Step 1: Set Up a Crypto Wallet
A crypto wallet is essential for interacting with DeFi platforms. Popular options include:
MetaMask (Ethereum-based platforms).Trust Wallet (Binance Smart Chain and others).Phantom (Solana).
Step 2: Fund Your Wallet
Transfer cryptocurrency (e.g., $ETH $BNB or $SOL ) to your wallet. Use centralized exchanges like Binance to purchase crypto and transfer it to your wallet.
Step 3: Connect to a Decentralized Exchange (DEX)
Visit a DEX and connect your wallet. Examples include:
Uniswap: For Ethereum-based tokens.PancakeSwap: For Binance Smart Chain tokens.SushiSwap: Multi-chain support.
Step 4: Select a Trading Pair
Choose the token you want to trade and the token you wish to receive.
Example: Trade ETH for USDT.
Step 5: Confirm the Trade
Approve the transaction through your wallet. The DEX will process your trade automatically.
Popular DeFi Strategies
Yield Farming
Provide liquidity to a DEX and earn rewards in the form of fees or tokens.Staking
Lock up your tokens in a protocol to earn interest or rewards.Arbitrage
Take advantage of price differences between DEXs.Speculative Trading
Buy and sell tokens based on market analysis and trends.
Tips for Safe DeFi Trading
Do Your Research (DYOR): Verify the legitimacy of projects and tokens.Start Small: Test the waters with small trades.Monitor Gas Fees: Fees can vary significantly, especially on the Ethereum network.Enable Security Features: Use hardware wallets and secure your private keys.Stay Updated: Follow DeFi news and updates to avoid scams and stay informed.
Conclusion
DeFi trading offers a world of opportunities for traders seeking a decentralized alternative to traditional finance. While the ecosystem is exciting and innovative, it's also complex and comes with risks. By understanding the basics, using secure platforms, and managing risks effectively, you can explore DeFi trading with confidence and potentially unlock new financial possibilities.
What is DeFi Trading?
DeFi trading involves the buying and selling of cryptocurrencies and tokens on decentralized platforms. It eliminates the need for centralized exchanges (CEXs) by utilizing decentralized exchanges (DEXs), such as Uniswap, PancakeSwap, and SushiSwap.
Key features include:
Peer-to-Peer Transactions: Trades occur directly between users.Smart Contracts: Automated protocols ensure secure and transparent transactions.Control: Users retain full custody of their assets through private wallets.
Benefits of DeFi Trading
Accessibility: Anyone with an internet connection and a crypto wallet can participate.No Intermediaries: Reduced fees and faster transactions.Global Market: Access to a wide variety of tokens and projects from around the world.Transparency: All transactions are visible on the blockchain.
Risks of DeFi Trading
Volatility: Cryptocurrency prices can change rapidly.Smart Contract Vulnerabilities: Bugs or exploits in smart contracts can lead to losses.Scams and Rug Pulls: Some projects may be fraudulent.No Customer Support: Unlike centralized exchanges, users must manage their own funds and security.
How to Start DeFi Trading
Step 1: Set Up a Crypto Wallet
A crypto wallet is essential for interacting with DeFi platforms. Popular options include:
MetaMask (Ethereum-based platforms).Trust Wallet (Binance Smart Chain and others).Phantom (Solana).
Step 2: Fund Your Wallet
Transfer cryptocurrency (e.g., $ETH $BNB or $SOL ) to your wallet. Use centralized exchanges like Binance to purchase crypto and transfer it to your wallet.
Step 3: Connect to a Decentralized Exchange (DEX)
Visit a DEX and connect your wallet. Examples include:
Uniswap: For Ethereum-based tokens.PancakeSwap: For Binance Smart Chain tokens.SushiSwap: Multi-chain support.
Step 4: Select a Trading Pair
Choose the token you want to trade and the token you wish to receive.
Example: Trade ETH for USDT.
Step 5: Confirm the Trade
Approve the transaction through your wallet. The DEX will process your trade automatically.
Popular DeFi Strategies
Yield Farming
Provide liquidity to a DEX and earn rewards in the form of fees or tokens.Staking
Lock up your tokens in a protocol to earn interest or rewards.Arbitrage
Take advantage of price differences between DEXs.Speculative Trading
Buy and sell tokens based on market analysis and trends.
Tips for Safe DeFi Trading
Do Your Research (DYOR): Verify the legitimacy of projects and tokens.Start Small: Test the waters with small trades.Monitor Gas Fees: Fees can vary significantly, especially on the Ethereum network.Enable Security Features: Use hardware wallets and secure your private keys.Stay Updated: Follow DeFi news and updates to avoid scams and stay informed.
Conclusion
DeFi trading offers a world of opportunities for traders seeking a decentralized alternative to traditional finance. While the ecosystem is exciting and innovative, it's also complex and comes with risks. By understanding the basics, using secure platforms, and managing risks effectively, you can explore DeFi trading with confidence and potentially unlock new financial possibilities.
752

Article
Combining Indicators for Better Market AnalysisNOTE: This articles are not Financial Advice, do your own research !
In cryptocurrency trading, relying on a single technical indicator may not provide enough accuracy for making informed decisions. Combining multiple indicators can give a more comprehensive view of market trends, momentum, and potential reversals. Here’s how you can effectively combine indicators for better market analysis.
Why Combine Indicators?
Each technical indicator focuses on specific aspects of market behavior, such as price trends, momentum, or volatility. Combining indicators:
Reduces false signals.Provides confirmation of market conditions.Helps traders make well-rounded decisions.
Key Types of Indicators
Trend IndicatorsExamples: Moving Averages, MACD, ADX.Purpose: Identify the direction of the market (uptrend, downtrend, or sideways).Momentum IndicatorsExamples: RSI, Stochastic Oscillator.Purpose: Measure the speed of price movement and identify overbought or oversold conditions.Volume IndicatorsExamples: Volume Profile, OBV (On-Balance Volume).Purpose: Show the strength of a trend based on trading volume.Volatility IndicatorsExamples: Bollinger Bands, ATR (Average True Range).Purpose: Assess market volatility and predict potential price breakouts.
Popular Indicator Combinations
1. Moving Averages + RSI
How it Works: Use Moving Averages (e.g., EMA) to determine the trend and RSI to confirm entry/exit points based on momentum.Example:If the price is above the 50-day EMA (uptrend) and RSI is below 30 (oversold), it may indicate a buying opportunity.
2. MACD + Bollinger Bands
How it Works: MACD identifies momentum changes, while Bollinger Bands show volatility and potential price ranges.Example:When the MACD gives a bullish crossover near the lower Bollinger Band, it signals a potential upward reversal.
3. ADX + Stochastic Oscillator
How it Works: ADX measures trend strength, while the Stochastic Oscillator identifies overbought/oversold levels within that trend.Example:If ADX > 25 (strong trend) and the Stochastic Oscillator is oversold, it suggests a continuation of the uptrend.
Tips for Combining Indicators
Avoid RedundancyDon’t use multiple indicators that measure the same aspect (e.g., RSI and Stochastic Oscillator).Aim for complementary tools that provide unique insights.Focus on ConfirmationUse one indicator to identify opportunities and another to confirm them.Adapt to Market ConditionsUse trend-based indicators in trending markets and oscillators in range-bound markets.Practice on a Demo AccountTest your chosen combinations in a risk-free environment to refine your approach.
Practical Example
Let’s say you’re analyzing Ethereum (ETH) on Binance:
The price is above the 200-day EMA, indicating an uptrend.RSI is around 25, suggesting the asset is oversold.MACD shows a bullish crossover.
Action: Combine these signals to enter a long position, setting a stop-loss below the most recent support level.
Common Mistakes to Avoid
Overloading Charts: Too many indicators can clutter your analysis and lead to confusion.Ignoring Market Context: Indicators work best when used in conjunction with broader market analysis.Relying Solely on Indicators: Always consider fundamentals and market sentiment alongside technical analysis.
Conclusion
Combining indicators allows traders to gain deeper insights into the market and improve their decision-making. By pairing complementary tools like Moving Averages, RSI, MACD, and Bollinger Bands, you can create a robust strategy tailored to your trading style. Remember to test your combinations thoroughly and adjust them as needed based on market conditions.
Combining Indicators for Better Market Analysis
NOTE: This articles are not Financial Advice, do your own research !
In cryptocurrency trading, relying on a single technical indicator may not provide enough accuracy for making informed decisions. Combining multiple indicators can give a more comprehensive view of market trends, momentum, and potential reversals. Here’s how you can effectively combine indicators for better market analysis.
Why Combine Indicators?
Each technical indicator focuses on specific aspects of market behavior, such as price trends, momentum, or volatility. Combining indicators:
Reduces false signals.Provides confirmation of market conditions.Helps traders make well-rounded decisions.
Key Types of Indicators
Trend IndicatorsExamples: Moving Averages, MACD, ADX.Purpose: Identify the direction of the market (uptrend, downtrend, or sideways).Momentum IndicatorsExamples: RSI, Stochastic Oscillator.Purpose: Measure the speed of price movement and identify overbought or oversold conditions.Volume IndicatorsExamples: Volume Profile, OBV (On-Balance Volume).Purpose: Show the strength of a trend based on trading volume.Volatility IndicatorsExamples: Bollinger Bands, ATR (Average True Range).Purpose: Assess market volatility and predict potential price breakouts.
Popular Indicator Combinations
1. Moving Averages + RSI
How it Works: Use Moving Averages (e.g., EMA) to determine the trend and RSI to confirm entry/exit points based on momentum.Example:If the price is above the 50-day EMA (uptrend) and RSI is below 30 (oversold), it may indicate a buying opportunity.
2. MACD + Bollinger Bands
How it Works: MACD identifies momentum changes, while Bollinger Bands show volatility and potential price ranges.Example:When the MACD gives a bullish crossover near the lower Bollinger Band, it signals a potential upward reversal.
3. ADX + Stochastic Oscillator
How it Works: ADX measures trend strength, while the Stochastic Oscillator identifies overbought/oversold levels within that trend.Example:If ADX > 25 (strong trend) and the Stochastic Oscillator is oversold, it suggests a continuation of the uptrend.
Tips for Combining Indicators
Avoid RedundancyDon’t use multiple indicators that measure the same aspect (e.g., RSI and Stochastic Oscillator).Aim for complementary tools that provide unique insights.Focus on ConfirmationUse one indicator to identify opportunities and another to confirm them.Adapt to Market ConditionsUse trend-based indicators in trending markets and oscillators in range-bound markets.Practice on a Demo AccountTest your chosen combinations in a risk-free environment to refine your approach.
Practical Example
Let’s say you’re analyzing Ethereum (ETH) on Binance:
The price is above the 200-day EMA, indicating an uptrend.RSI is around 25, suggesting the asset is oversold.MACD shows a bullish crossover.
Action: Combine these signals to enter a long position, setting a stop-loss below the most recent support level.
Common Mistakes to Avoid
Overloading Charts: Too many indicators can clutter your analysis and lead to confusion.Ignoring Market Context: Indicators work best when used in conjunction with broader market analysis.Relying Solely on Indicators: Always consider fundamentals and market sentiment alongside technical analysis.
Conclusion
Combining indicators allows traders to gain deeper insights into the market and improve their decision-making. By pairing complementary tools like Moving Averages, RSI, MACD, and Bollinger Bands, you can create a robust strategy tailored to your trading style. Remember to test your combinations thoroughly and adjust them as needed based on market conditions.
In cryptocurrency trading, relying on a single technical indicator may not provide enough accuracy for making informed decisions. Combining multiple indicators can give a more comprehensive view of market trends, momentum, and potential reversals. Here’s how you can effectively combine indicators for better market analysis.
Why Combine Indicators?
Each technical indicator focuses on specific aspects of market behavior, such as price trends, momentum, or volatility. Combining indicators:
Reduces false signals.Provides confirmation of market conditions.Helps traders make well-rounded decisions.
Key Types of Indicators
Trend IndicatorsExamples: Moving Averages, MACD, ADX.Purpose: Identify the direction of the market (uptrend, downtrend, or sideways).Momentum IndicatorsExamples: RSI, Stochastic Oscillator.Purpose: Measure the speed of price movement and identify overbought or oversold conditions.Volume IndicatorsExamples: Volume Profile, OBV (On-Balance Volume).Purpose: Show the strength of a trend based on trading volume.Volatility IndicatorsExamples: Bollinger Bands, ATR (Average True Range).Purpose: Assess market volatility and predict potential price breakouts.
Popular Indicator Combinations
1. Moving Averages + RSI
How it Works: Use Moving Averages (e.g., EMA) to determine the trend and RSI to confirm entry/exit points based on momentum.Example:If the price is above the 50-day EMA (uptrend) and RSI is below 30 (oversold), it may indicate a buying opportunity.
2. MACD + Bollinger Bands
How it Works: MACD identifies momentum changes, while Bollinger Bands show volatility and potential price ranges.Example:When the MACD gives a bullish crossover near the lower Bollinger Band, it signals a potential upward reversal.
3. ADX + Stochastic Oscillator
How it Works: ADX measures trend strength, while the Stochastic Oscillator identifies overbought/oversold levels within that trend.Example:If ADX > 25 (strong trend) and the Stochastic Oscillator is oversold, it suggests a continuation of the uptrend.
Tips for Combining Indicators
Avoid RedundancyDon’t use multiple indicators that measure the same aspect (e.g., RSI and Stochastic Oscillator).Aim for complementary tools that provide unique insights.Focus on ConfirmationUse one indicator to identify opportunities and another to confirm them.Adapt to Market ConditionsUse trend-based indicators in trending markets and oscillators in range-bound markets.Practice on a Demo AccountTest your chosen combinations in a risk-free environment to refine your approach.
Practical Example
Let’s say you’re analyzing Ethereum (ETH) on Binance:
The price is above the 200-day EMA, indicating an uptrend.RSI is around 25, suggesting the asset is oversold.MACD shows a bullish crossover.
Action: Combine these signals to enter a long position, setting a stop-loss below the most recent support level.
Common Mistakes to Avoid
Overloading Charts: Too many indicators can clutter your analysis and lead to confusion.Ignoring Market Context: Indicators work best when used in conjunction with broader market analysis.Relying Solely on Indicators: Always consider fundamentals and market sentiment alongside technical analysis.
Conclusion
Combining indicators allows traders to gain deeper insights into the market and improve their decision-making. By pairing complementary tools like Moving Averages, RSI, MACD, and Bollinger Bands, you can create a robust strategy tailored to your trading style. Remember to test your combinations thoroughly and adjust them as needed based on market conditions.
1
256
Log in to explore more content
Join global crypto users on Binance Square
⚡️ Get latest and useful information about crypto.
💬 Trusted by the world’s largest crypto exchange.
👍 Discover real insights from verified creators.
Email / Phone number
Trending Topics
ADAGains10%Above$0.27
12,337 views
166 Discussing
$ADA is making a strong move today jumping over 10 percent to around 027 and breaking into a new 90 day high
Trading volume has also surged above 1 billion showing strong market activity
The move comes as $ADA continues its recovery from the June lows while its recent technical structure has turned more bullish
The 027 to 028 zone is now the key area to watch A sustained breakout could open the door toward higher resistance levels
But after such a sharp daily move volatility could remain high
#ADAGains10%Above$0.27 #crypto #ADA #Cardano #crypto #Write2Earn
AbdullahAbid_7
·0 Likes
·343 views
ETHUp70%InQ3ButLiquidityFalls
137,780 views
988 Discussing
EthStakingExitQueueHits2026High
48,518 views
715 Discussing