

Learn2trades
605 Posts

Learn2trades
Report
Block User
over 14 years experience in the crypto world.
@Wolfcrypto83
work on elliot waves analysis feel free to follow for more information
17 Following
1.3K+ Followers
3.0K+ Liked
Posts
All
Quotes
Videos
Live
·
--
🧠 What is the market doing — and will it reward those who waited patiently?
When the market was in Bottoming Structures, almost everyone was afraid to buy and Accumulate.
But when the market started the Pump, everyone began to jump behind Green Candles. 🟢📈
Now the question is:
👀 Who will pay for this behavior? And who will benefit from their patience?
Those who waited, planned, and Accumulated in the right areas may receive the reward.
But there’s one very important condition:
⚠️ They must not fear the last chance the market will offer.
🔥 All I want to say right now is that the time for waiting is over.
The Correction is happening before your eyes, and this Correction may be the last opportunity to re-select the Right Coins and arrange and fix your Portfolio the right way.
📌 I’m not saying everything is guaranteed, but this is the stage where we must be the most alert and disciplined.
⏳ Enjoy the coming weeks — not the coming days.
Because what awaits us may be Aggressive, not easy to trade, and full of Manipulation. 🎢
🧠 If you learn how to keep your emotions and feelings out of your decisions, and how to watch what’s happening without Fear or FOMO, you’ll have a better chance to stay in the Winning Podium. 🏆
🛡 Trade Safe.
🎯 Stay Patient.
🧠 Follow Your Plan.
Good luck, Wave Riders. 🌊🏆
🧠 What is the market doing — and will it reward those who waited patiently?
When the market was in Bottoming Structures, almost everyone was afraid to buy and Accumulate.
But when the market started the Pump, everyone began to jump behind Green Candles. 🟢📈
Now the question is:
👀 Who will pay for this behavior? And who will benefit from their patience?
Those who waited, planned, and Accumulated in the right areas may receive the reward.
But there’s one very important condition:
⚠️ They must not fear the last chance the market will offer.
🔥 All I want to say right now is that the time for waiting is over.
The Correction is happening before your eyes, and this Correction may be the last opportunity to re-select the Right Coins and arrange and fix your Portfolio the right way.
📌 I’m not saying everything is guaranteed, but this is the stage where we must be the most alert and disciplined.
⏳ Enjoy the coming weeks — not the coming days.
Because what awaits us may be Aggressive, not easy to trade, and full of Manipulation. 🎢
🧠 If you learn how to keep your emotions and feelings out of your decisions, and how to watch what’s happening without Fear or FOMO, you’ll have a better chance to stay in the Winning Podium. 🏆
🛡 Trade Safe.
🎯 Stay Patient.
🧠 Follow Your Plan.
Good luck, Wave Riders. 🌊🏆
When the market was in Bottoming Structures, almost everyone was afraid to buy and Accumulate.
But when the market started the Pump, everyone began to jump behind Green Candles. 🟢📈
Now the question is:
👀 Who will pay for this behavior? And who will benefit from their patience?
Those who waited, planned, and Accumulated in the right areas may receive the reward.
But there’s one very important condition:
⚠️ They must not fear the last chance the market will offer.
🔥 All I want to say right now is that the time for waiting is over.
The Correction is happening before your eyes, and this Correction may be the last opportunity to re-select the Right Coins and arrange and fix your Portfolio the right way.
📌 I’m not saying everything is guaranteed, but this is the stage where we must be the most alert and disciplined.
⏳ Enjoy the coming weeks — not the coming days.
Because what awaits us may be Aggressive, not easy to trade, and full of Manipulation. 🎢
🧠 If you learn how to keep your emotions and feelings out of your decisions, and how to watch what’s happening without Fear or FOMO, you’ll have a better chance to stay in the Winning Podium. 🏆
🛡 Trade Safe.
🎯 Stay Patient.
🧠 Follow Your Plan.
Good luck, Wave Riders. 🌊🏆
3
489
·
--
sui
⚠️ Every crypto project always carries risks.
There is no project that is guaranteed 100%, so risk management remains essential no matter how strong the project is.
For me, I still believe that SUI has strong potential in the long term. Even with any changes or disagreements between partners and platforms, the project can continue to evolve and join other platforms or partners.
📈 My take: SUI could deliver very strong performance if the project continues to execute and scale during the next cycle.
But saying that 10X is guaranteed within 12 months isn’t possible, because the crypto market is full of risks and volatility.
The opportunity is there, but nothing is guaranteed. Invest with a suitable amount and be ready for every scenario. 👀📊
sui
⚠️ Every crypto project always carries risks.
There is no project that is guaranteed 100%, so risk management remains essential no matter how strong the project is.
For me, I still believe that SUI has strong potential in the long term. Even with any changes or disagreements between partners and platforms, the project can continue to evolve and join other platforms or partners.
📈 My take: SUI could deliver very strong performance if the project continues to execute and scale during the next cycle.
But saying that 10X is guaranteed within 12 months isn’t possible, because the crypto market is full of risks and volatility.
The opportunity is there, but nothing is guaranteed. Invest with a suitable amount and be ready for every scenario. 👀📊
⚠️ Every crypto project always carries risks.
There is no project that is guaranteed 100%, so risk management remains essential no matter how strong the project is.
For me, I still believe that SUI has strong potential in the long term. Even with any changes or disagreements between partners and platforms, the project can continue to evolve and join other platforms or partners.
📈 My take: SUI could deliver very strong performance if the project continues to execute and scale during the next cycle.
But saying that 10X is guaranteed within 12 months isn’t possible, because the crypto market is full of risks and volatility.
The opportunity is there, but nothing is guaranteed. Invest with a suitable amount and be ready for every scenario. 👀📊
2
983
·
--
You probably won’t hear this from many other people. 👀
Because many people always want to appear as if they know exactly what will happen next.
But the truth is:
No one knows the future with 100% certainty.
What we can do is build a roadmap, identify the important levels, and create different scenarios.
📈 We know where to look for Long opportunities.
📉 And we know where to look for Short opportunities.
And as price evolves and a new structure forms, we get more evidence and confirmations.
You don’t have to predict the future… you just need to be ready for it. 🔥📊
You probably won’t hear this from many other people. 👀
Because many people always want to appear as if they know exactly what will happen next.
But the truth is:
No one knows the future with 100% certainty.
What we can do is build a roadmap, identify the important levels, and create different scenarios.
📈 We know where to look for Long opportunities.
📉 And we know where to look for Short opportunities.
And as price evolves and a new structure forms, we get more evidence and confirmations.
You don’t have to predict the future… you just need to be ready for it. 🔥📊
Because many people always want to appear as if they know exactly what will happen next.
But the truth is:
No one knows the future with 100% certainty.
What we can do is build a roadmap, identify the important levels, and create different scenarios.
📈 We know where to look for Long opportunities.
📉 And we know where to look for Short opportunities.
And as price evolves and a new structure forms, we get more evidence and confirmations.
You don’t have to predict the future… you just need to be ready for it. 🔥📊
4
62
25.4k
·
--
Article
be carful🚨📊 MARKET THOUGHTS — PLEASE READ CAREFULLY
I don’t want to be the negative one, but after being in crypto since 2014, there’s something I learned:
🧠 Market Makers know how to get Retail to enter at the wrong time.
And the funny part is that the scenarios repeat… but retail usually doesn’t learn. 😅
Now everyone is talking about:
🚀 ALT SEASON IS STARTING!
And this is exactly where I want you to be very careful. ⚠️
be carful
🚨📊 MARKET THOUGHTS — PLEASE READ CAREFULLY
I don’t want to be the negative one, but after being in crypto since 2014, there’s something I learned:
🧠 Market Makers know how to get Retail to enter at the wrong time.
And the funny part is that the scenarios repeat… but retail usually doesn’t learn. 😅
Now everyone is talking about:
🚀 ALT SEASON IS STARTING!
And this is exactly where I want you to be very careful. ⚠️
I don’t want to be the negative one, but after being in crypto since 2014, there’s something I learned:
🧠 Market Makers know how to get Retail to enter at the wrong time.
And the funny part is that the scenarios repeat… but retail usually doesn’t learn. 😅
Now everyone is talking about:
🚀 ALT SEASON IS STARTING!
And this is exactly where I want you to be very careful. ⚠️
1
1
491
·
--
📈 For this scenario
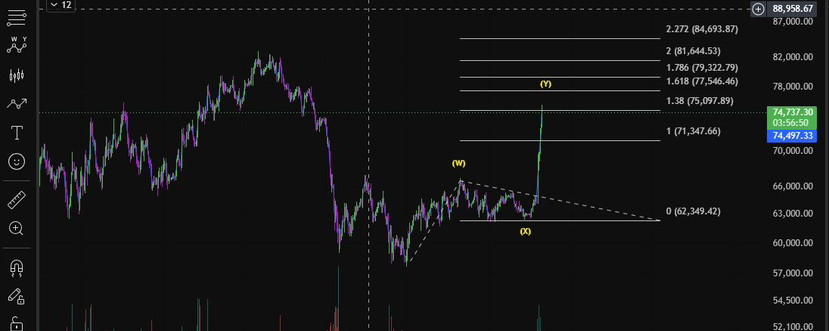
I want to see the price continue to fluctuate and rise gradually so that Wave C is completed. 🌊
I’m not necessarily looking for a strong immediate upward move; rather, the continuation of the Chop with the formation of local highs and lows is the ideal scenario to complete the structure.
🎯 The goal is to allow Wave C to complete clearly before thinking about the next scenario.
👀 We are monitoring the development of the Price Action and the structure step by step.
📈 For this scenario
I want to see the price continue to fluctuate and rise gradually so that Wave C is completed. 🌊
I’m not necessarily looking for a strong immediate upward move; rather, the continuation of the Chop with the formation of local highs and lows is the ideal scenario to complete the structure.
🎯 The goal is to allow Wave C to complete clearly before thinking about the next scenario.
👀 We are monitoring the development of the Price Action and the structure step by step.
I want to see the price continue to fluctuate and rise gradually so that Wave C is completed. 🌊
I’m not necessarily looking for a strong immediate upward move; rather, the continuation of the Chop with the formation of local highs and lows is the ideal scenario to complete the structure.
🎯 The goal is to allow Wave C to complete clearly before thinking about the next scenario.
👀 We are monitoring the development of the Price Action and the structure step by step.
4
450
·
--
📊 Levels and Resistances in the Uptrend
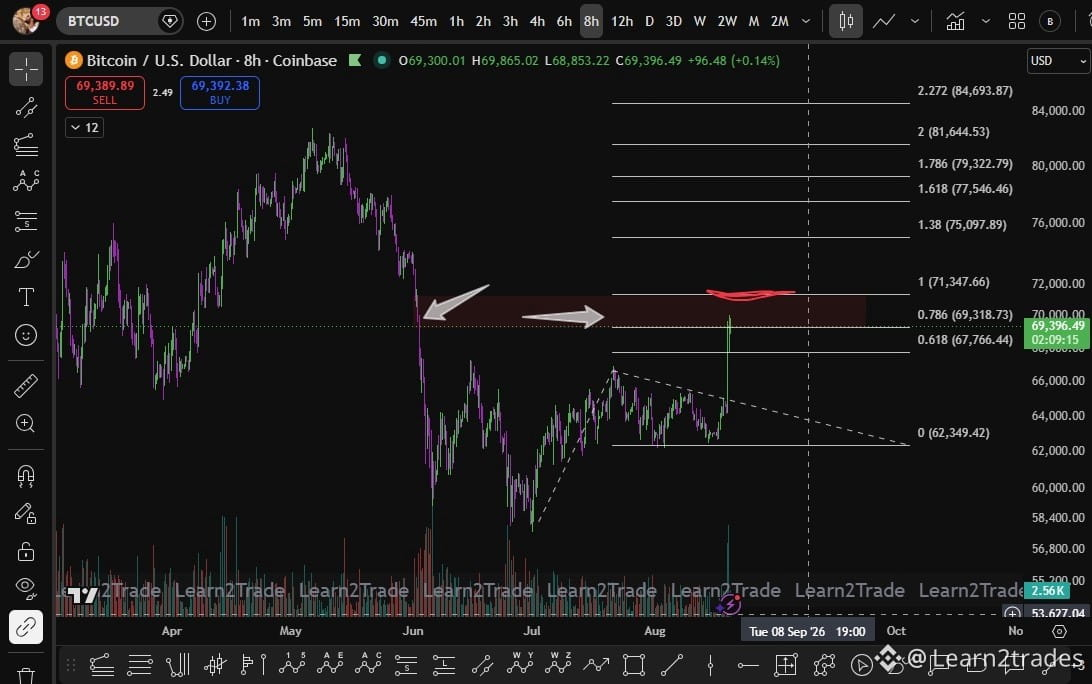
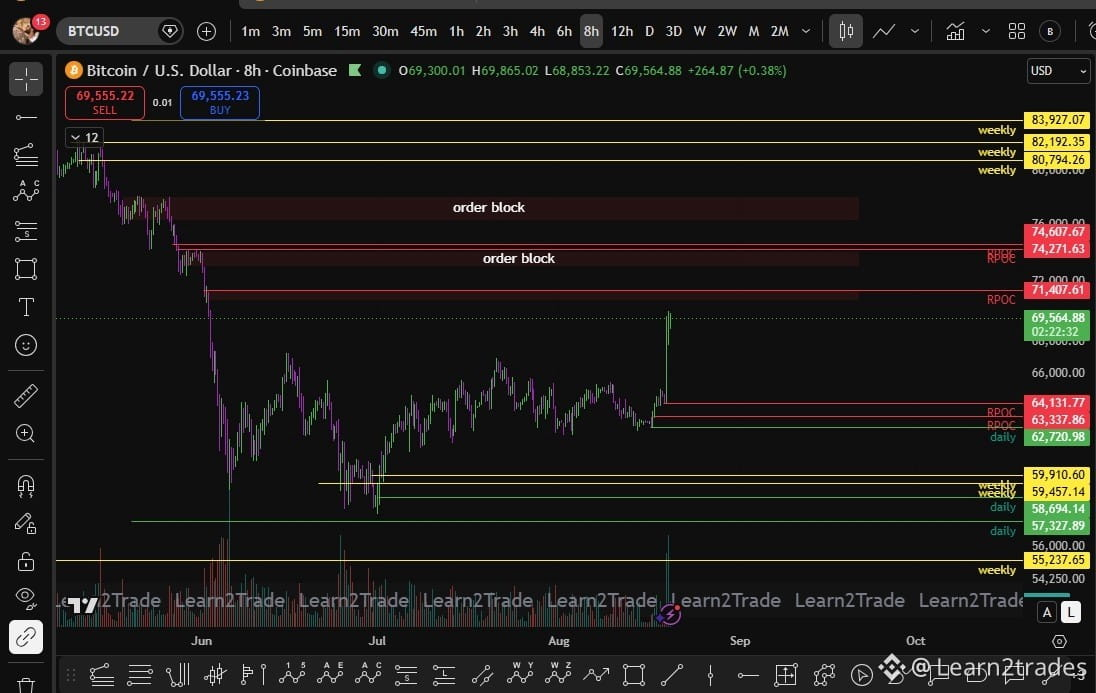
We’re watching several important resistance levels higher up. 👀📈
🎯 The closest exciting area for the price right now is:
🟥 8-Hour Order Block (OB)
This area will be our first important clue to watch for the price’s reaction, especially if it reaches there with strong momentum.
📌 We monitor upon reaching:
Price reaction
Momentum strength
Rejection or breakout
Price Action confirmation
The 8H Order Block area is the closest important resistance area in front of the price right now. 🎯📊
📊 Levels and Resistances in the Uptrend
We’re watching several important resistance levels higher up. 👀📈
🎯 The closest exciting area for the price right now is:
🟥 8-Hour Order Block (OB)
This area will be our first important clue to watch for the price’s reaction, especially if it reaches there with strong momentum.
📌 We monitor upon reaching:
Price reaction
Momentum strength
Rejection or breakout
Price Action confirmation
The 8H Order Block area is the closest important resistance area in front of the price right now. 🎯📊
We’re watching several important resistance levels higher up. 👀📈
🎯 The closest exciting area for the price right now is:
🟥 8-Hour Order Block (OB)
This area will be our first important clue to watch for the price’s reaction, especially if it reaches there with strong momentum.
📌 We monitor upon reaching:
Price reaction
Momentum strength
Rejection or breakout
Price Action confirmation
The 8H Order Block area is the closest important resistance area in front of the price right now. 🎯📊
2
237
·
--
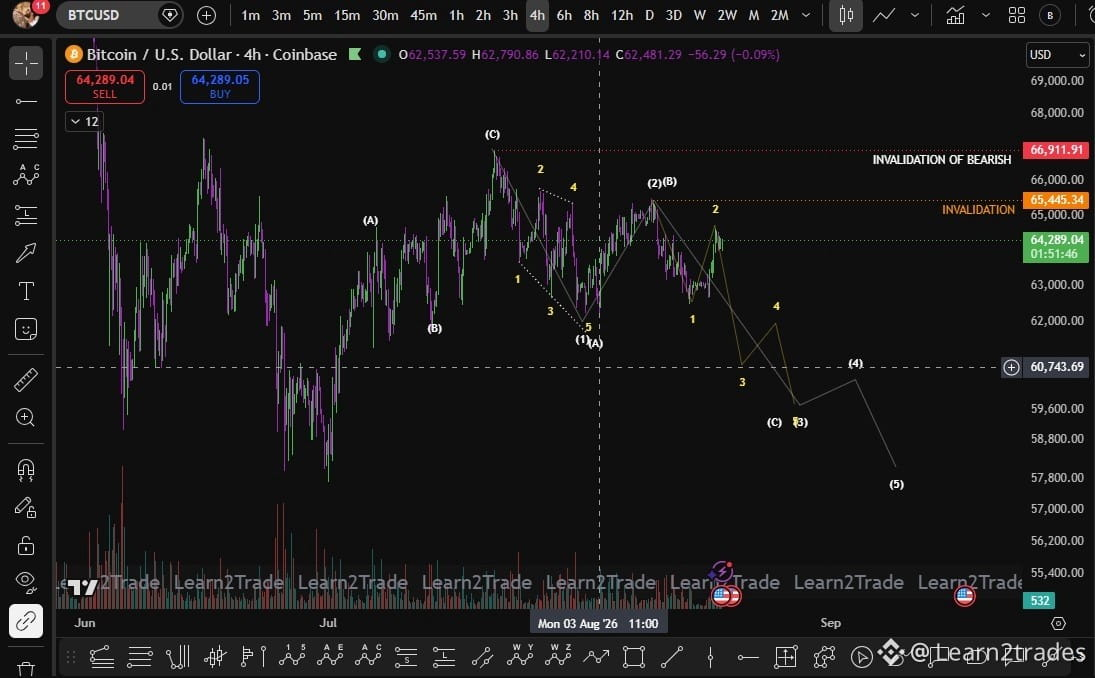
📉 4H TIME FRAME — Main Bearish Scenario
This is currently the main bearish scenario.
🌊 Elliott Wave Structure:
🔹 Finished ABC Up from the July bottom
🔹 Wave 1 / A: Expanding Diagonal down
🔹 Wave 2 / B: Corrective upward movement
🔹 Currently: we are working on Wave 3 / C down
🚩 The main issue with this scenario:
The Leading Expanding Diagonal in Wave 1/A is extremely rare, which reduces the likelihood of this count.
But we don’t rule it out—we just keep in mind that this is the biggest factor weakening the scenario.
🧠 Therefore, we monitor Price Action + Wave Structure to confirm that Wave 3/C has actually started, rather than relying on the count alone.
The bearish scenario remains valid, but with lower probability because of the rare expanding diagonal. 📉🌊
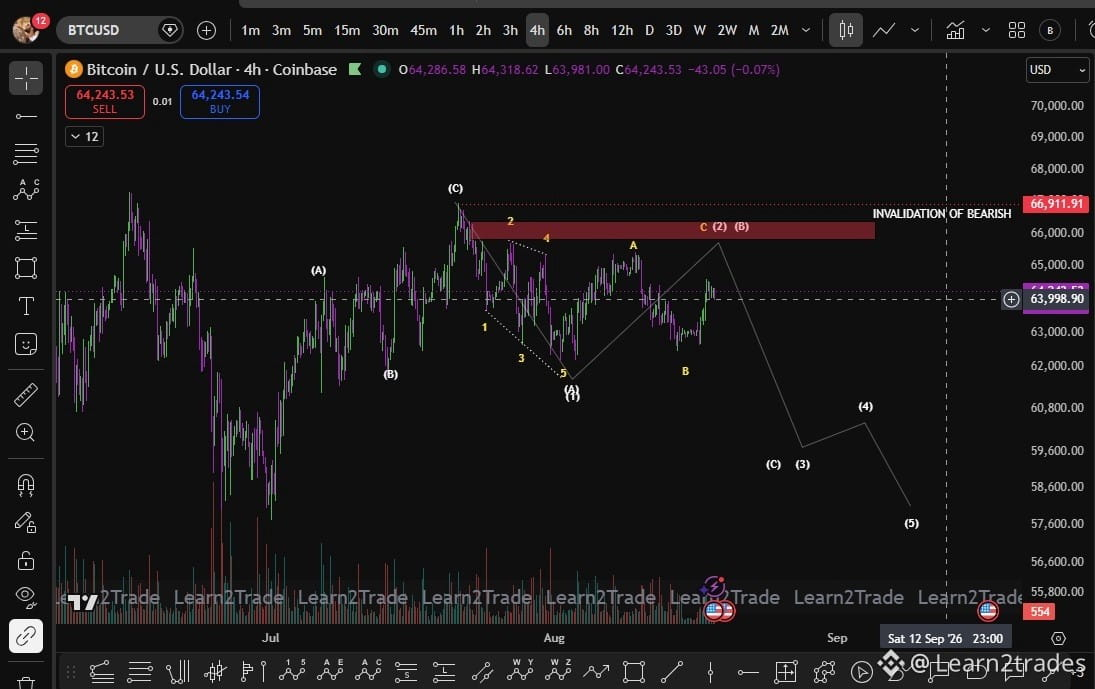
📊 4H TIME FRAME — Cheeky Alternative Scenario
Here we have an interesting alternative scenario with the Expanding Diagonal, and in this scenario we still consider that we are working on Wave 2 / B.
🎯 Main idea:
The price may first take liquidity from most of the Lower Highs that formed since 66.8K, and then afterward it starts to reverse and fall. 📉
🔑 The key in the coming days is to detect a 5-wave upward move to confirm the start of Wave C.
Currently, I believe we are still inside Wave 1 of Wave C.
⚠️ IMPORTANT — B Wave
The B Wave reached about 0.9 Fibonacci, which makes a Flat formation plausible.
But in this case:
🔸 The B Wave must exceed the High of the A Wave at 65.4K for us to consider the Flat complete.
❌ It cannot be considered a Running Flat unless it takes the B High above the A.
📉 4H TIME FRAME — Main Bearish Scenario
This is currently the main bearish scenario.
🌊 Elliott Wave Structure:
🔹 Finished ABC Up from the July bottom
🔹 Wave 1 / A: Expanding Diagonal down
🔹 Wave 2 / B: Corrective upward movement
🔹 Currently: we are working on Wave 3 / C down
🚩 The main issue with this scenario:
The Leading Expanding Diagonal in Wave 1/A is extremely rare, which reduces the likelihood of this count.
But we don’t rule it out—we just keep in mind that this is the biggest factor weakening the scenario.
🧠 Therefore, we monitor Price Action + Wave Structure to confirm that Wave 3/C has actually started, rather than relying on the count alone.
The bearish scenario remains valid, but with lower probability because of the rare expanding diagonal. 📉🌊
📊 4H TIME FRAME — Cheeky Alternative Scenario
Here we have an interesting alternative scenario with the Expanding Diagonal, and in this scenario we still consider that we are working on Wave 2 / B.
🎯 Main idea:
The price may first take liquidity from most of the Lower Highs that formed since 66.8K, and then afterward it starts to reverse and fall. 📉
🔑 The key in the coming days is to detect a 5-wave upward move to confirm the start of Wave C.
Currently, I believe we are still inside Wave 1 of Wave C.
⚠️ IMPORTANT — B Wave
The B Wave reached about 0.9 Fibonacci, which makes a Flat formation plausible.
But in this case:
🔸 The B Wave must exceed the High of the A Wave at 65.4K for us to consider the Flat complete.
❌ It cannot be considered a Running Flat unless it takes the B High above the A.
This is currently the main bearish scenario.
🌊 Elliott Wave Structure:
🔹 Finished ABC Up from the July bottom
🔹 Wave 1 / A: Expanding Diagonal down
🔹 Wave 2 / B: Corrective upward movement
🔹 Currently: we are working on Wave 3 / C down
🚩 The main issue with this scenario:
The Leading Expanding Diagonal in Wave 1/A is extremely rare, which reduces the likelihood of this count.
But we don’t rule it out—we just keep in mind that this is the biggest factor weakening the scenario.
🧠 Therefore, we monitor Price Action + Wave Structure to confirm that Wave 3/C has actually started, rather than relying on the count alone.
The bearish scenario remains valid, but with lower probability because of the rare expanding diagonal. 📉🌊
📊 4H TIME FRAME — Cheeky Alternative Scenario
Here we have an interesting alternative scenario with the Expanding Diagonal, and in this scenario we still consider that we are working on Wave 2 / B.
🎯 Main idea:
The price may first take liquidity from most of the Lower Highs that formed since 66.8K, and then afterward it starts to reverse and fall. 📉
🔑 The key in the coming days is to detect a 5-wave upward move to confirm the start of Wave C.
Currently, I believe we are still inside Wave 1 of Wave C.
⚠️ IMPORTANT — B Wave
The B Wave reached about 0.9 Fibonacci, which makes a Flat formation plausible.
But in this case:
🔸 The B Wave must exceed the High of the A Wave at 65.4K for us to consider the Flat complete.
❌ It cannot be considered a Running Flat unless it takes the B High above the A.
1
208
·
--
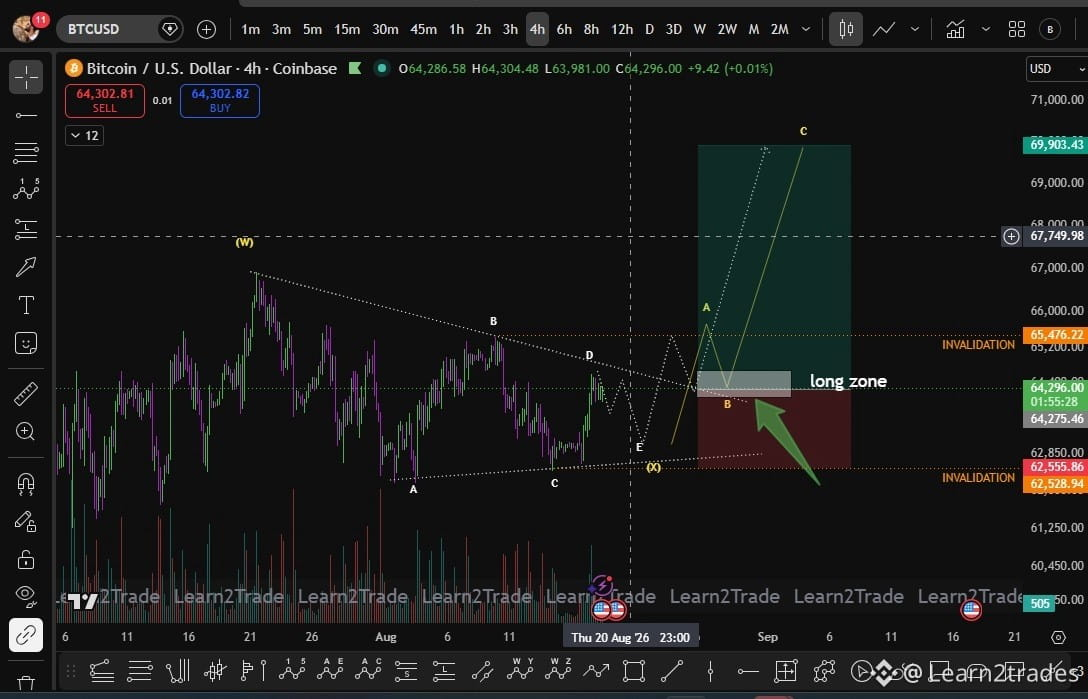
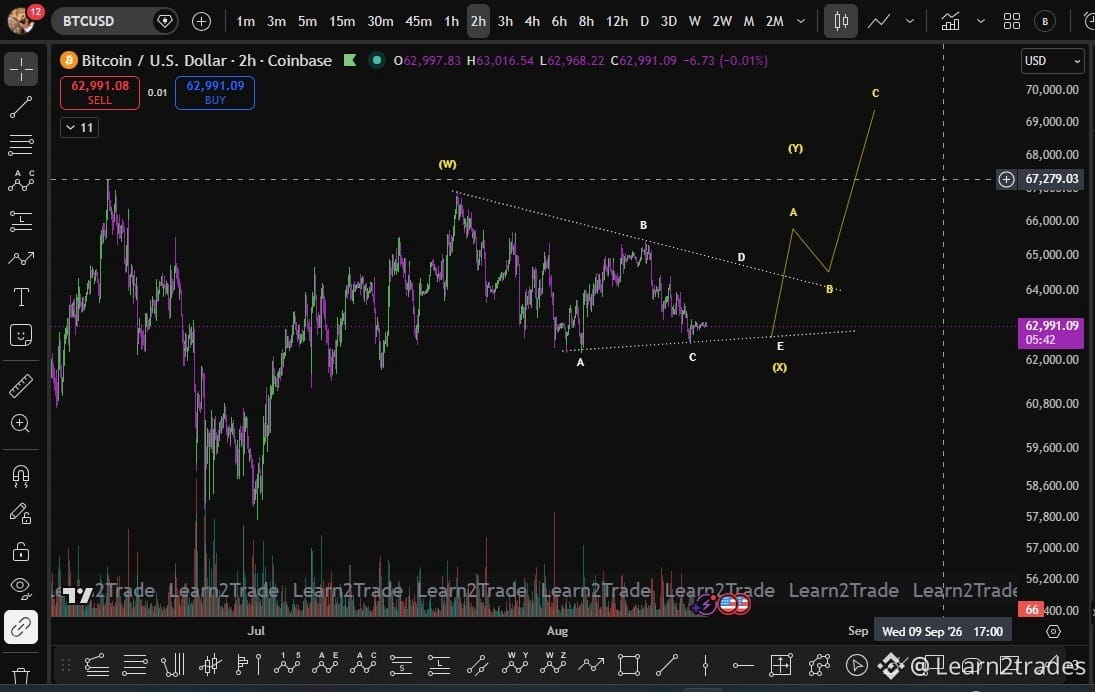
📈 4H TIME FRAME — Alternative Bullish Scenario
We have another interesting scenario that could develop to target 67K+ 🚀
🌊 Elliott Wave Structure
🔹 W: An upward ZigZag in July
🔹 X: Triangle
↳ We are currently working on Wave D, and we still need Wave E
🔹 Y: An upward ZigZag during August / September
🎯 What we need to activate this scenario:
First, we need to see a corrective move down for Wave E.
If we can identify this correction over the coming days, we could get a very strong Swing Long opportunity. 📈
🔥 Potential entry methods
We have more than one way to approach the trade:
1️⃣ Aggressive: Enter from the expected support area of Wave E.
2️⃣ Safer: Wait for a Trendline Breakout + Confirmation after Wave E completes.
3️⃣ Wait for a 5-wave impulse up from the Wave E area as additional evidence that the upward move is starting.
🛑 Clear Invalidation:
$62,550
If this level is broken, this scenario becomes invalid.
🎯 The big idea:
Wave E down → Swing Long → Wave Y higher → 67K+
Keep an eye on this scenario, because it could give us one of the cleanest Swing opportunities if the structure completes as we expect. 🧠📊
📈 4H TIME FRAME — Alternative Bullish Scenario
We have another interesting scenario that could develop to target 67K+ 🚀
🌊 Elliott Wave Structure
🔹 W: An upward ZigZag in July
🔹 X: Triangle
↳ We are currently working on Wave D, and we still need Wave E
🔹 Y: An upward ZigZag during August / September
🎯 What we need to activate this scenario:
First, we need to see a corrective move down for Wave E.
If we can identify this correction over the coming days, we could get a very strong Swing Long opportunity. 📈
🔥 Potential entry methods
We have more than one way to approach the trade:
1️⃣ Aggressive: Enter from the expected support area of Wave E.
2️⃣ Safer: Wait for a Trendline Breakout + Confirmation after Wave E completes.
3️⃣ Wait for a 5-wave impulse up from the Wave E area as additional evidence that the upward move is starting.
🛑 Clear Invalidation:
$62,550
If this level is broken, this scenario becomes invalid.
🎯 The big idea:
Wave E down → Swing Long → Wave Y higher → 67K+
Keep an eye on this scenario, because it could give us one of the cleanest Swing opportunities if the structure completes as we expect. 🧠📊
We have another interesting scenario that could develop to target 67K+ 🚀
🌊 Elliott Wave Structure
🔹 W: An upward ZigZag in July
🔹 X: Triangle
↳ We are currently working on Wave D, and we still need Wave E
🔹 Y: An upward ZigZag during August / September
🎯 What we need to activate this scenario:
First, we need to see a corrective move down for Wave E.
If we can identify this correction over the coming days, we could get a very strong Swing Long opportunity. 📈
🔥 Potential entry methods
We have more than one way to approach the trade:
1️⃣ Aggressive: Enter from the expected support area of Wave E.
2️⃣ Safer: Wait for a Trendline Breakout + Confirmation after Wave E completes.
3️⃣ Wait for a 5-wave impulse up from the Wave E area as additional evidence that the upward move is starting.
🛑 Clear Invalidation:
$62,550
If this level is broken, this scenario becomes invalid.
🎯 The big idea:
Wave E down → Swing Long → Wave Y higher → 67K+
Keep an eye on this scenario, because it could give us one of the cleanest Swing opportunities if the structure completes as we expect. 🧠📊
1
253
·
--
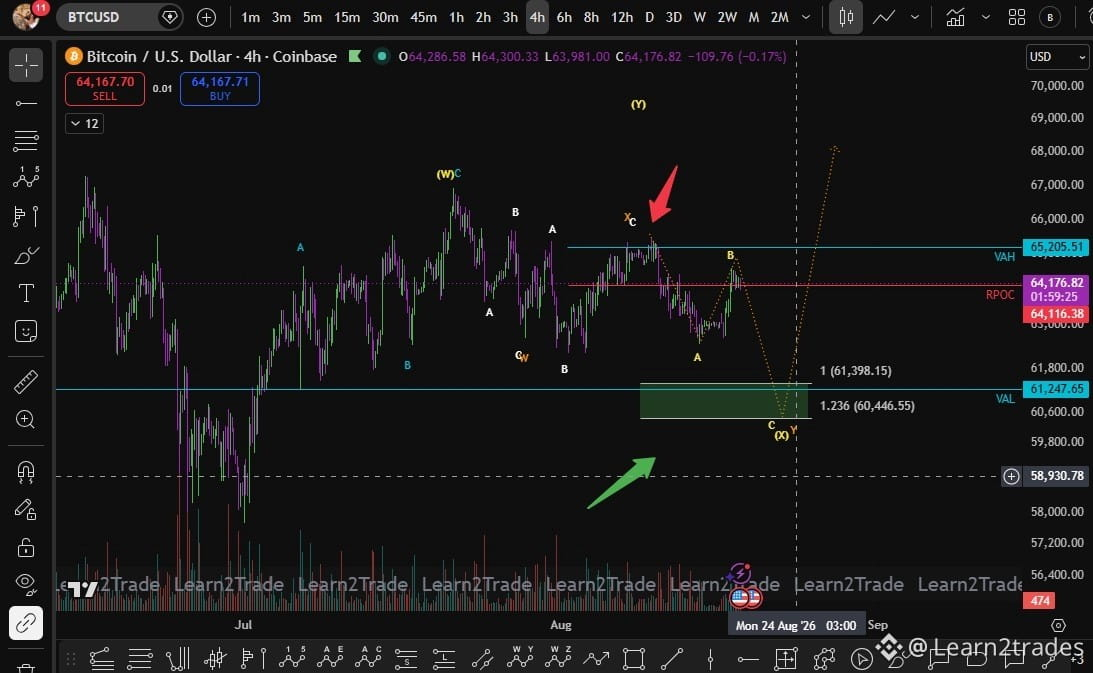
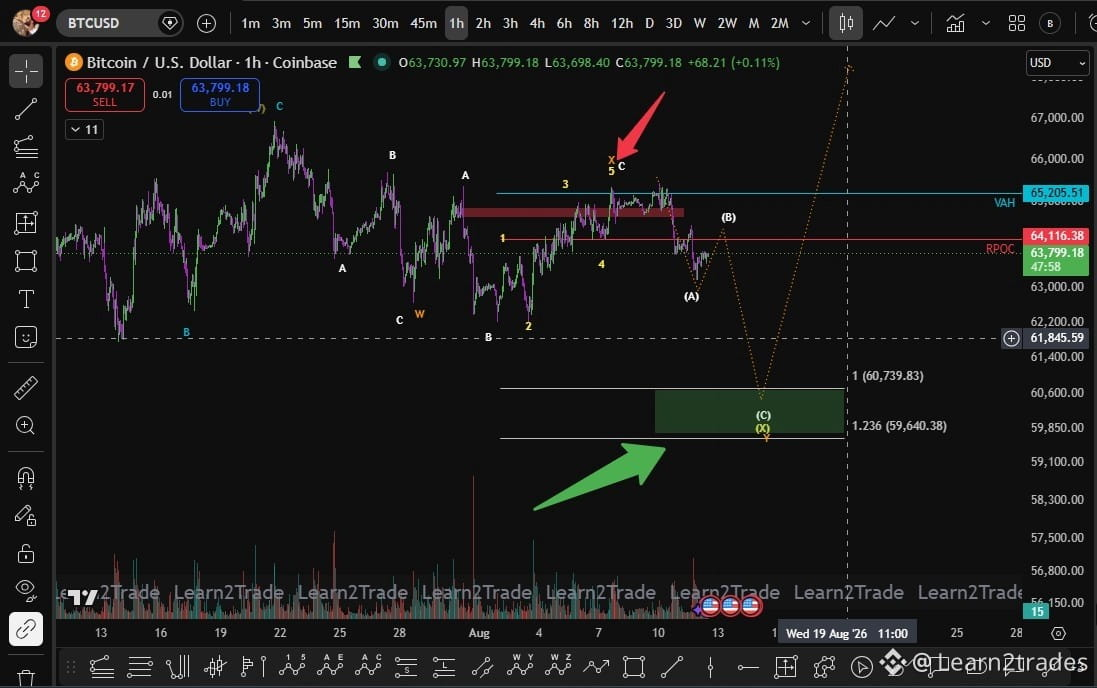
📊 4H TIME FRAME — The scenario is still in place
The scenario is still relevant: we expect a bearish move in the short term, followed by a bullish scenario targeting and reaching 67K. 📉➡️📈
🌊 Elliott Wave Structure
🔹 W: Upside ZigZag in July
🔹 X: WXY Double ZigZag
↳ We are currently working on Wave B from Y
🔹 Y: Upside ZigZag during August / September
🎯 Swing Long area of interest:
61K area
If the price reaches the 61K area, we will monitor the structure and confirmations there and update you regarding the Long opportunity.
🧠 Core idea:
Short-term bearish → Swing long around 61K → bullish move toward 67K.
The scenario is there, but we are waiting for the price to reach the zone and give us confirmation. 📊🎯
📊 4H TIME FRAME — The scenario is still in place
The scenario is still relevant: we expect a bearish move in the short term, followed by a bullish scenario targeting and reaching 67K. 📉➡️📈
🌊 Elliott Wave Structure
🔹 W: Upside ZigZag in July
🔹 X: WXY Double ZigZag
↳ We are currently working on Wave B from Y
🔹 Y: Upside ZigZag during August / September
🎯 Swing Long area of interest:
61K area
If the price reaches the 61K area, we will monitor the structure and confirmations there and update you regarding the Long opportunity.
🧠 Core idea:
Short-term bearish → Swing long around 61K → bullish move toward 67K.
The scenario is there, but we are waiting for the price to reach the zone and give us confirmation. 📊🎯
The scenario is still relevant: we expect a bearish move in the short term, followed by a bullish scenario targeting and reaching 67K. 📉➡️📈
🌊 Elliott Wave Structure
🔹 W: Upside ZigZag in July
🔹 X: WXY Double ZigZag
↳ We are currently working on Wave B from Y
🔹 Y: Upside ZigZag during August / September
🎯 Swing Long area of interest:
61K area
If the price reaches the 61K area, we will monitor the structure and confirmations there and update you regarding the Long opportunity.
🧠 Core idea:
Short-term bearish → Swing long around 61K → bullish move toward 67K.
The scenario is there, but we are waiting for the price to reach the zone and give us confirmation. 📊🎯
159
·
--
btc cycle:
🔥 Almost everyone I talk to tells me the same thing:
“I’m waiting for the 4-year cycle.” 😴
Very nice…
So now Retail expects that Bitcoin will wait politely for an additional 52 days, then give them the bottom exactly on October 6, on day 365 😂
As if the market has become room service, and you can order the bottom in advance! 🍽️📉
🧠 That’s a very dangerous way of thinking.
btc cycle
:
🔥 Almost everyone I talk to tells me the same thing:
“I’m waiting for the 4-year cycle.” 😴
Very nice…
So now Retail expects that Bitcoin will wait politely for an additional 52 days, then give them the bottom exactly on October 6, on day 365 😂
As if the market has become room service, and you can order the bottom in advance! 🍽️📉
🧠 That’s a very dangerous way of thinking.
🔥 Almost everyone I talk to tells me the same thing:
“I’m waiting for the 4-year cycle.” 😴
Very nice…
So now Retail expects that Bitcoin will wait politely for an additional 52 days, then give them the bottom exactly on October 6, on day 365 😂
As if the market has become room service, and you can order the bottom in advance! 🍽️📉
🧠 That’s a very dangerous way of thinking.
205
·
--
🧩 Potential Larger WXY
There is a possibility that we may be dealing with a larger WXY.
🔹 Wave X may form as a Triangle
🔹 After it completes and the Triangle breaks upward, Wave Y may begin moving upward.
👀 This scenario is still a possibility and needs confirmation from the structure and the upcoming movement before relying on it.
We are watching for the Triangle break to confirm the start of Wave Y. 📊🎯
🧩 Potential Larger WXY
There is a possibility that we may be dealing with a larger WXY.
🔹 Wave X may form as a Triangle
🔹 After it completes and the Triangle breaks upward, Wave Y may begin moving upward.
👀 This scenario is still a possibility and needs confirmation from the structure and the upcoming movement before relying on it.
We are watching for the Triangle break to confirm the start of Wave Y. 📊🎯
There is a possibility that we may be dealing with a larger WXY.
🔹 Wave X may form as a Triangle
🔹 After it completes and the Triangle breaks upward, Wave Y may begin moving upward.
👀 This scenario is still a possibility and needs confirmation from the structure and the upcoming movement before relying on it.
We are watching for the Triangle break to confirm the start of Wave Y. 📊🎯
2
500
·
--
🧩 This scenario is still on the table.
And honestly, I personally want to see the price drop even more 📉🔥
Because reaching those levels could give us a very strong and special Long.
👀 We keep the scenario open and wait for the price to reach the important levels before making a decision.
Sometimes the best trade is the one we patiently wait for. 🎯
🧩 This scenario is still on the table.
And honestly, I personally want to see the price drop even more 📉🔥
Because reaching those levels could give us a very strong and special Long.
👀 We keep the scenario open and wait for the price to reach the important levels before making a decision.
Sometimes the best trade is the one we patiently wait for. 🎯
And honestly, I personally want to see the price drop even more 📉🔥
Because reaching those levels could give us a very strong and special Long.
👀 We keep the scenario open and wait for the price to reach the important levels before making a decision.
Sometimes the best trade is the one we patiently wait for. 🎯
1
315
·
--
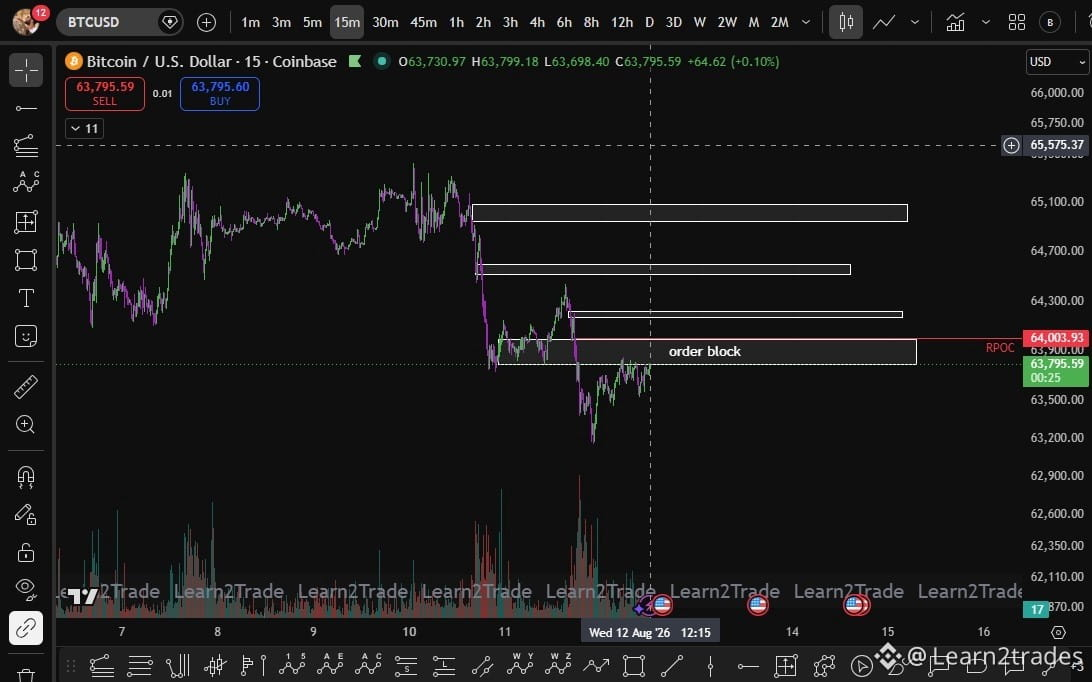
🔴 Resistance zones on the upper side
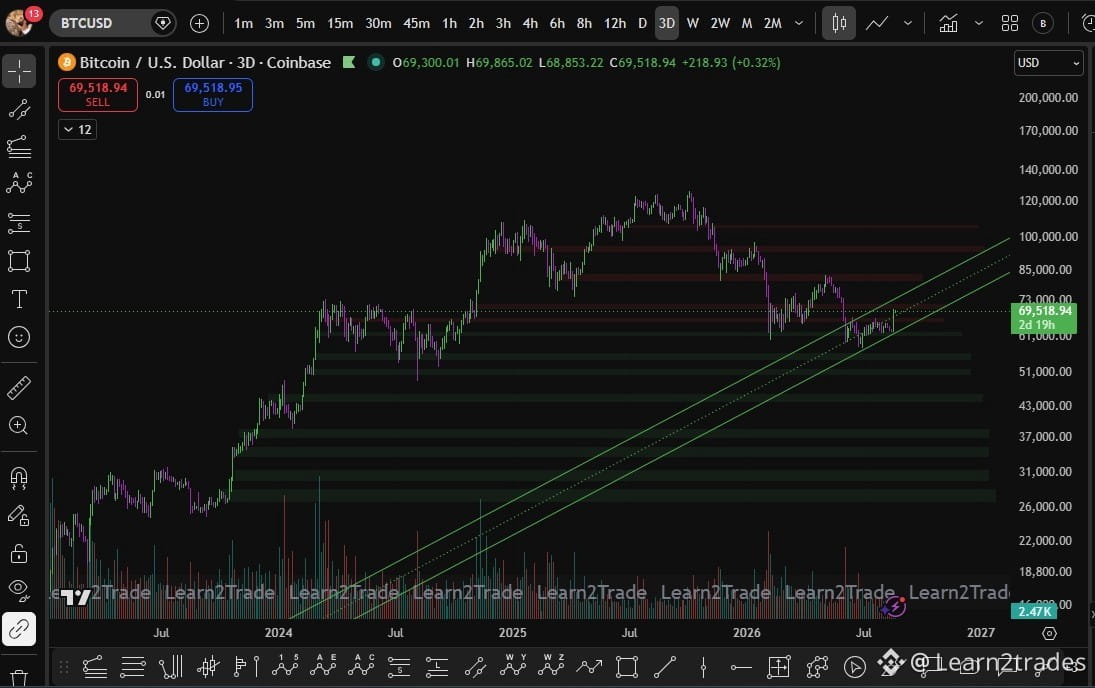
We have several Order Blocks at the top that can act as important resistance areas. 📊
👀 These are the zones we will watch when the price reaches them, especially if rejection appears or momentum weakens.
🎯 Order Blocks = potential resistance zones, not confirmation by themselves.
We wait for the price to react from them before making any decision. 🧩
🔴 Resistance zones on the upper side
We have several Order Blocks at the top that can act as important resistance areas. 📊
👀 These are the zones we will watch when the price reaches them, especially if rejection appears or momentum weakens.
🎯 Order Blocks = potential resistance zones, not confirmation by themselves.
We wait for the price to react from them before making any decision. 🧩
We have several Order Blocks at the top that can act as important resistance areas. 📊
👀 These are the zones we will watch when the price reaches them, especially if rejection appears or momentum weakens.
🎯 Order Blocks = potential resistance zones, not confirmation by themselves.
We wait for the price to react from them before making any decision. 🧩
1
321
Log in to explore more content
Join global crypto users on Binance Square
⚡️ Get latest and useful information about crypto.
💬 Trusted by the world’s largest crypto exchange.
👍 Discover real insights from verified creators.
Email / Phone number
Trending Topics
BNBSurpasses$790
1,910 views
44 Discussing
$BNB strategic long plan -> FOCUS NOW
BNB has created 2 strong lows after taking out internal liquidity
I'm expecting a move towards swing high $815-$830 and looking for a long on a retest of the green box
#BNBSurpasses$790 #bnb
Ghost Writer
·1 Likes
·729 views
ZamaRises15.99%ToIntradayHigh$0.09
965 views
48 Discussing
BitcoinSpotETFsDraw$6.34BInflowsInQ3
1,836 views
39 Discussing