
Koiisyourname
1.8k Posts

Koiisyourname
mình đăng bài chỉ để nhắc nhở bản thân khi vào lệnh, không mục đích kêu gọi, tạo nhóm hay bất cứ lý do gì khác…
Frequent Trader
4.8 Years
1 Following
4.1K+ Followers
29.3K+ Liked
Posts
All
Quotes
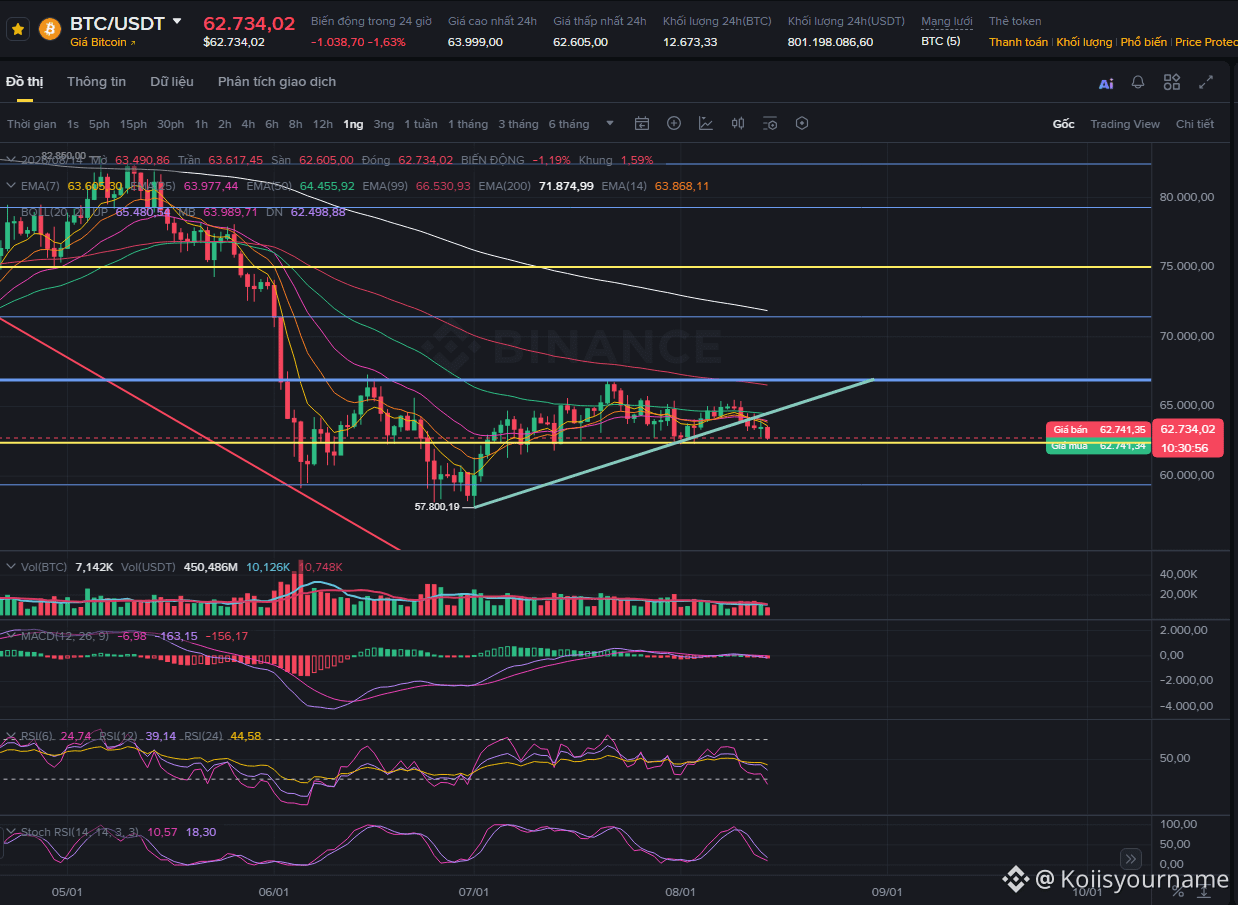
$BTC không có gì phân tích, biên đã vẽ từ tháng 6-7 thì giờ vẫn sw trong biên đoạn 65K-62K.
Tuy nhiên nhìn chart em đang thấy cụ sắp rụng về 60-54K (có lẽ vậy) :))
Tình hình là vẫn sw trong khung hỗ trợ trong đoạn lớn, tối rảnh em xem thêm tin tức vs nhìn kỹ chart đã!
Ý kiến anh chị như nào!?
Tuy nhiên nhìn chart em đang thấy cụ sắp rụng về 60-54K (có lẽ vậy) :))
Tình hình là vẫn sw trong khung hỗ trợ trong đoạn lớn, tối rảnh em xem thêm tin tức vs nhìn kỹ chart đã!
Ý kiến anh chị như nào!?

jeni nguyễn
·
--
still waiting for your post but I haven't seen it for a long time 😥
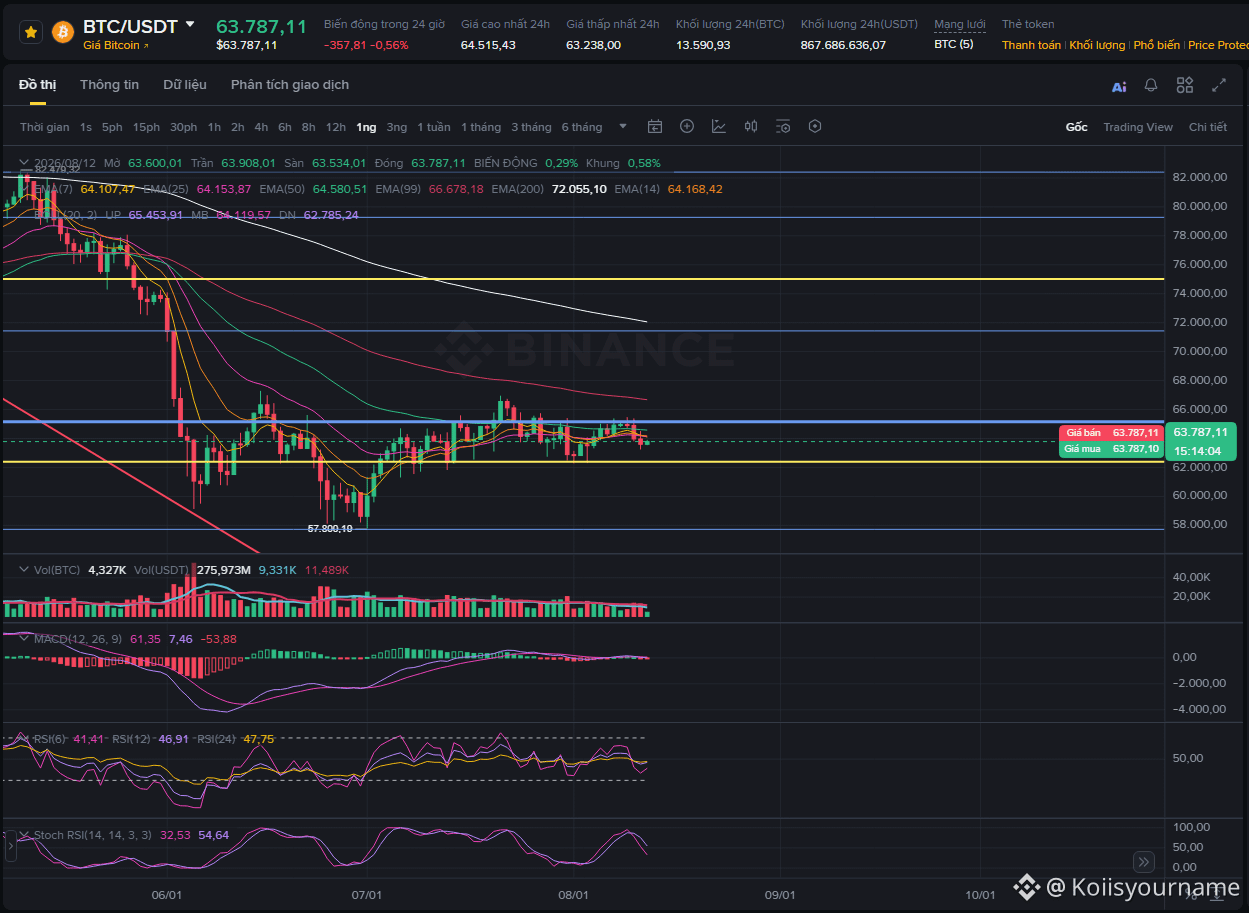
$BTC chart indicates the downtrend’s bottom has been reached. Many of the guys are starting to “catch the bottom” in the past few weeks. I already shared my perspective starting from June that the price has a high probability of consolidating in the 60-70K range, BUT right now I still haven’t bought any more shares 🥴
Waiting for something first!
Waiting for something first!
Koiisyourname
·
--
Spot needs to wait for this month's candlestick, you know? But the best move is to wait until the end of the washout! $BTC
Finished WC already, bro 🤭 still wandering around 60-65k! After collecting the gambling money, where are you going now 🤭🤭🤭
$BTC
$BTC
Spot needs to wait for this month's candlestick, you know? But the best move is to wait until the end of the washout! $BTC
Koiisyourname
·
--
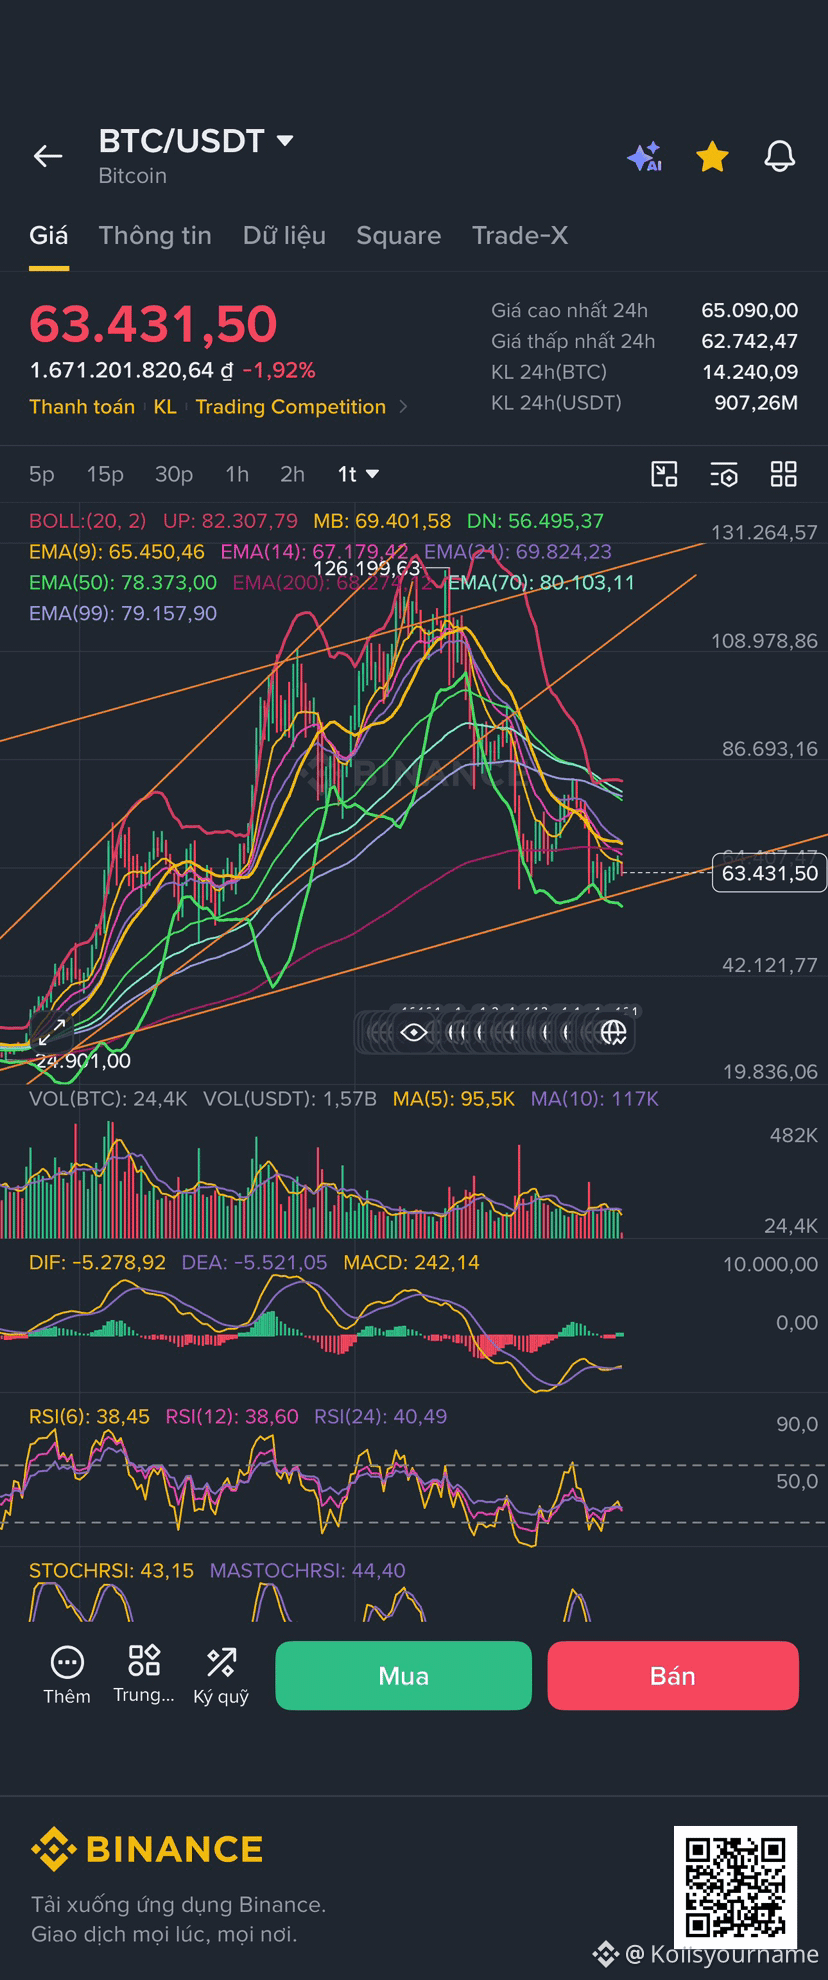
$BTC A few weeks ago, I predicted that it would rise to 82-85-88K and then experience a strong downtrend back to the 65K zone. Currently, the price has hit the 82 mark and is retracing quite early compared to my initial expectations! (There are many issues and reasons for this, mainly due to the global football WC)!
Given the current state, the price is at the old buy zone from two months ago around 65K, coupled with an oversold condition on the 1H chart, so in the next 1-2 weeks, I predict sideways movement in the price range of 65-71K.
In the long run, I still believe that by the end of this year, BTC will recover from the bottom at 60K-65K, but the likelihood is only about 60%.
In the worst-case scenario, if it closes a candlestick below 65K in June - it might lead to another deeper drop to 53K-50K - the final support of this cycle (30% chance).
If it drops below 50K, consider it a year for selling salt! :)
Given the current state, the price is at the old buy zone from two months ago around 65K, coupled with an oversold condition on the 1H chart, so in the next 1-2 weeks, I predict sideways movement in the price range of 65-71K.
In the long run, I still believe that by the end of this year, BTC will recover from the bottom at 60K-65K, but the likelihood is only about 60%.
In the worst-case scenario, if it closes a candlestick below 65K in June - it might lead to another deeper drop to 53K-50K - the final support of this cycle (30% chance).
If it drops below 50K, consider it a year for selling salt! :)
$BTC A few weeks ago, I predicted that it would rise to 82-85-88K and then experience a strong downtrend back to the 65K zone. Currently, the price has hit the 82 mark and is retracing quite early compared to my initial expectations! (There are many issues and reasons for this, mainly due to the global football WC)!
Given the current state, the price is at the old buy zone from two months ago around 65K, coupled with an oversold condition on the 1H chart, so in the next 1-2 weeks, I predict sideways movement in the price range of 65-71K.
In the long run, I still believe that by the end of this year, BTC will recover from the bottom at 60K-65K, but the likelihood is only about 60%.
In the worst-case scenario, if it closes a candlestick below 65K in June - it might lead to another deeper drop to 53K-50K - the final support of this cycle (30% chance).
If it drops below 50K, consider it a year for selling salt! :)
Given the current state, the price is at the old buy zone from two months ago around 65K, coupled with an oversold condition on the 1H chart, so in the next 1-2 weeks, I predict sideways movement in the price range of 65-71K.
In the long run, I still believe that by the end of this year, BTC will recover from the bottom at 60K-65K, but the likelihood is only about 60%.
In the worst-case scenario, if it closes a candlestick below 65K in June - it might lead to another deeper drop to 53K-50K - the final support of this cycle (30% chance).
If it drops below 50K, consider it a year for selling salt! :)
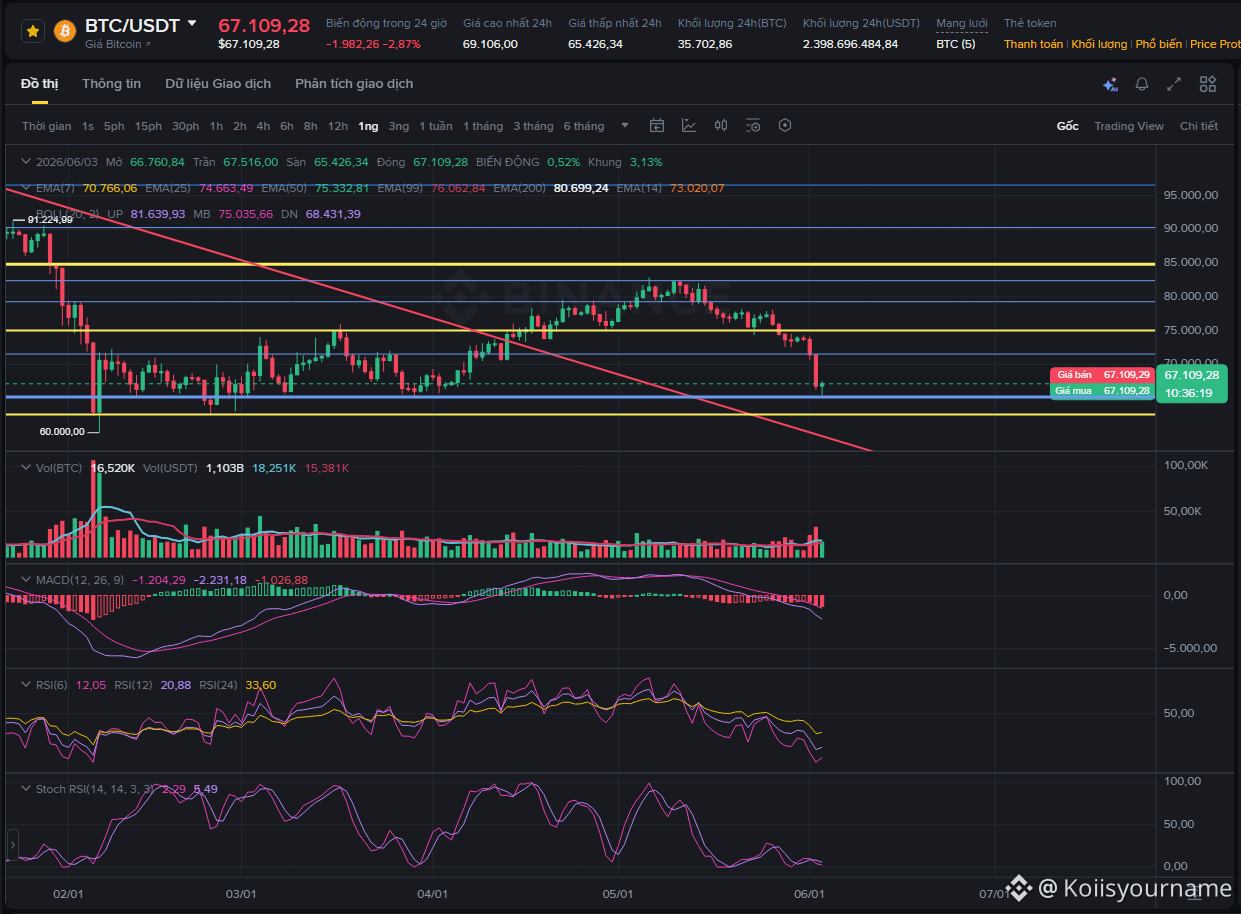
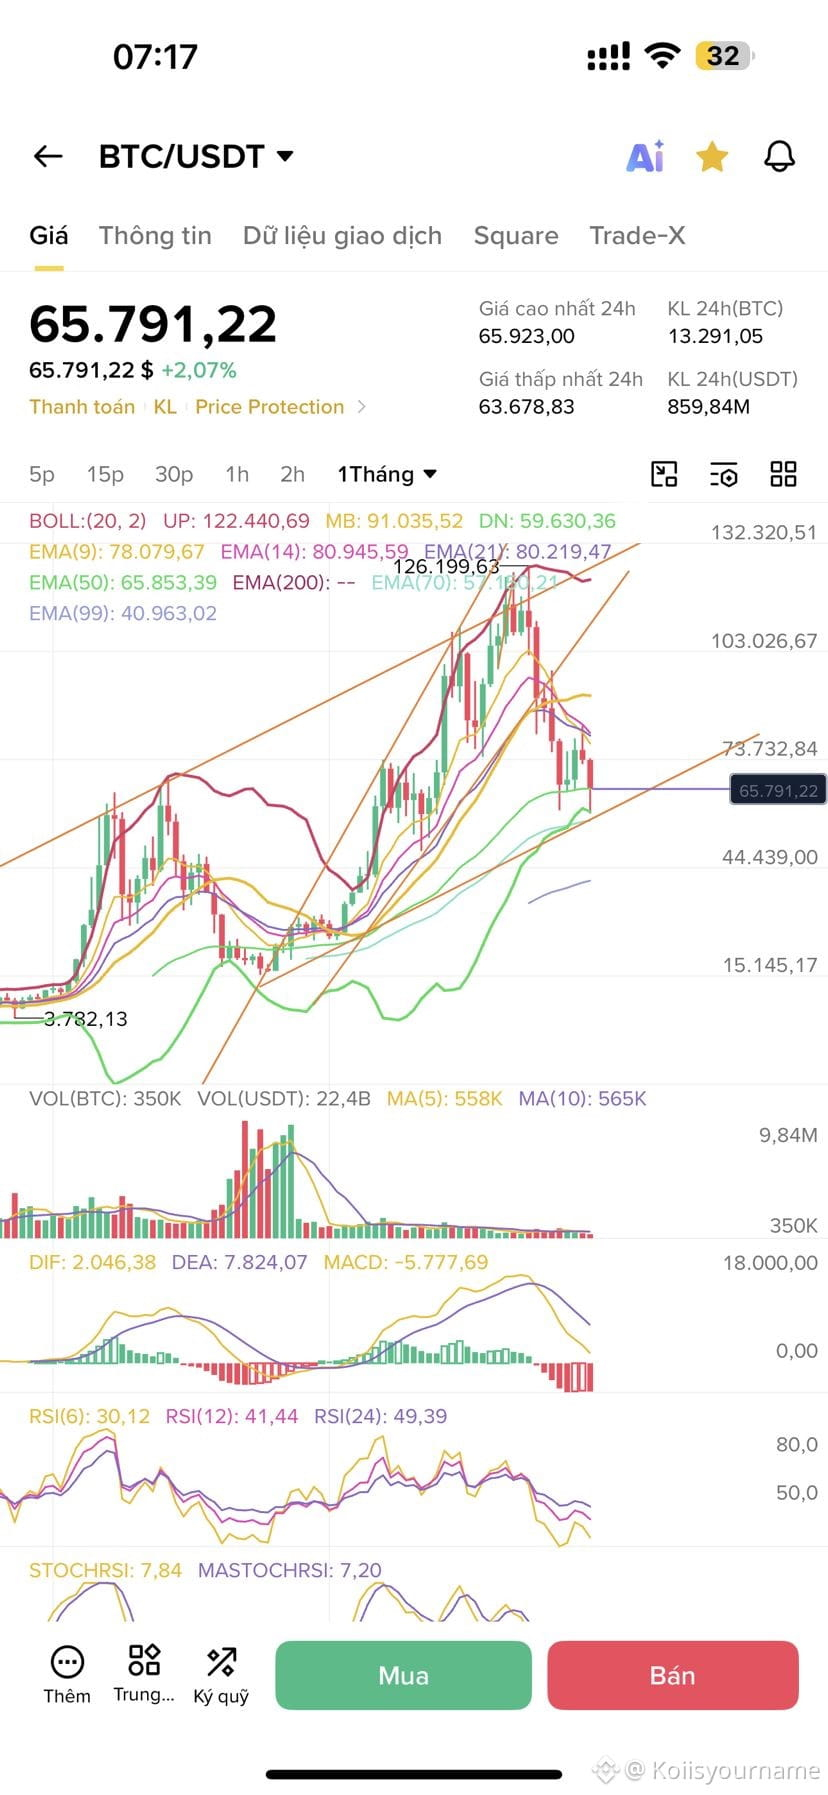
$BTC has returned to the old support zone of 65k as I mentioned! This is the buy zone from the price range of 60-65k!
However, I won't be throwing any cash into crypto just yet, so there are two scenarios: we might see a short at the 60k - 65k - 7x range in the coming months, or we could completely break this support zone and continue a long-term downtrend until the end of the year and into next year!
The market is sensitive to trends, so take it slow and don't get too eager to invest!
Later, if I'm not lazy, I'll post an update on the charts!
However, I won't be throwing any cash into crypto just yet, so there are two scenarios: we might see a short at the 60k - 65k - 7x range in the coming months, or we could completely break this support zone and continue a long-term downtrend until the end of the year and into next year!
The market is sensitive to trends, so take it slow and don't get too eager to invest!
Later, if I'm not lazy, I'll post an update on the charts!
With the World Cup coming up, keep an eye on meme coins related to football. As for the rest, it's not time to invest yet, and $BTC will likely retrace back to previous support.
$BTC The current update shows a complete loss of the bullish trend, and things are pretty shaky with the Fed changing the chair + governor, raising concerns about interest rates climbing as inflation hits 3.8!
The current candlestick chart is forming a large long-term range of 85K-75K since we haven't hit the 85K resistance on the weekly frame.
Before taking a position, we might see a price adjustment down to 79.2, and it could sideways in the 79-75K range; short-term trend is bearish.
Remember, we still aren’t in the buying spot price zone!
The market is tumultuous, be careful with the sparks! This weekend, it's better to go out and enjoy some fresh air instead of sitting at the computer all day :))
The current candlestick chart is forming a large long-term range of 85K-75K since we haven't hit the 85K resistance on the weekly frame.
Before taking a position, we might see a price adjustment down to 79.2, and it could sideways in the 79-75K range; short-term trend is bearish.
Remember, we still aren’t in the buying spot price zone!
The market is tumultuous, be careful with the sparks! This weekend, it's better to go out and enjoy some fresh air instead of sitting at the computer all day :))
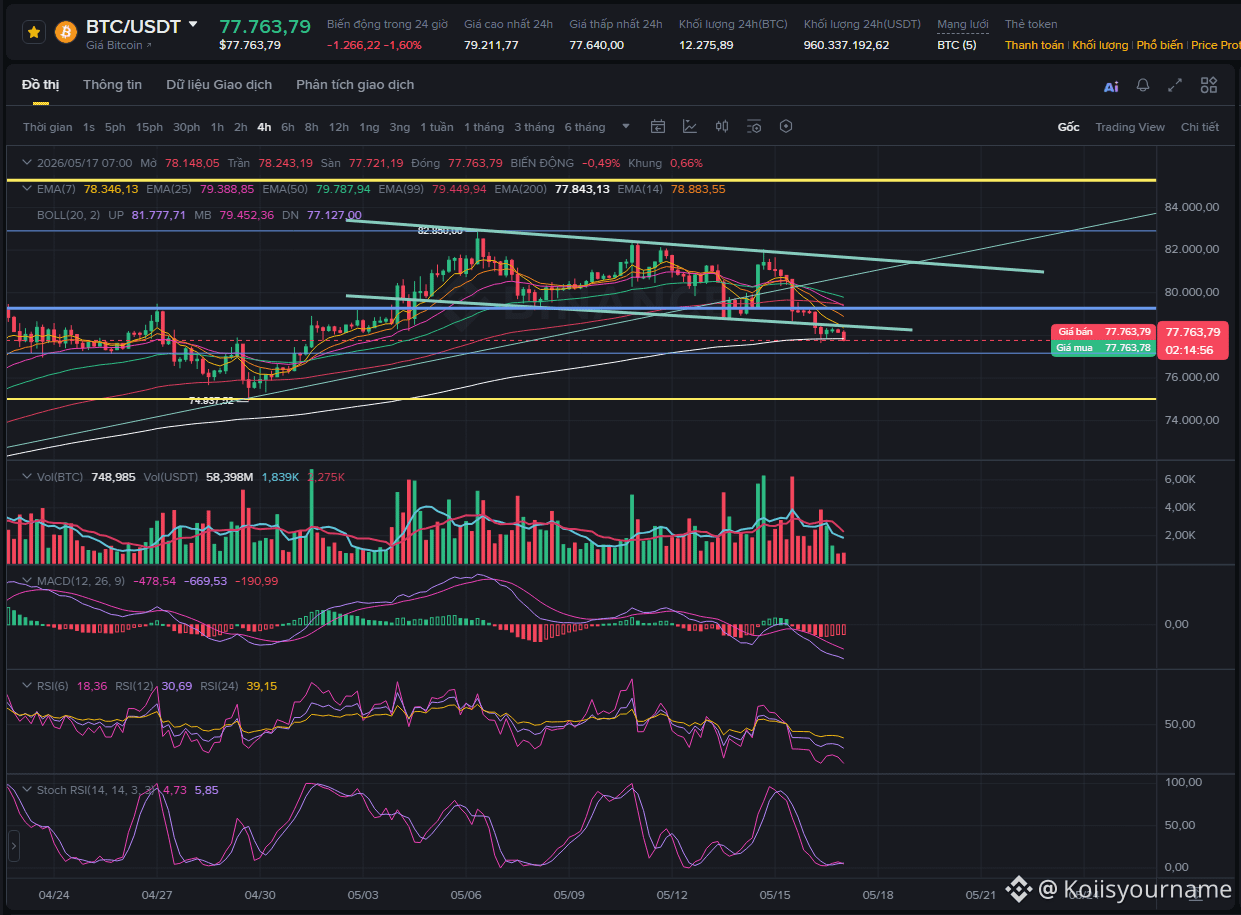
Update $BTC currently:
- Resistance: 82K
- Support: 78.7K
Still ranging in a bullish candlestick pattern, hasn't broken the trend!
- Resistance: 82K
- Support: 78.7K
Still ranging in a bullish candlestick pattern, hasn't broken the trend!
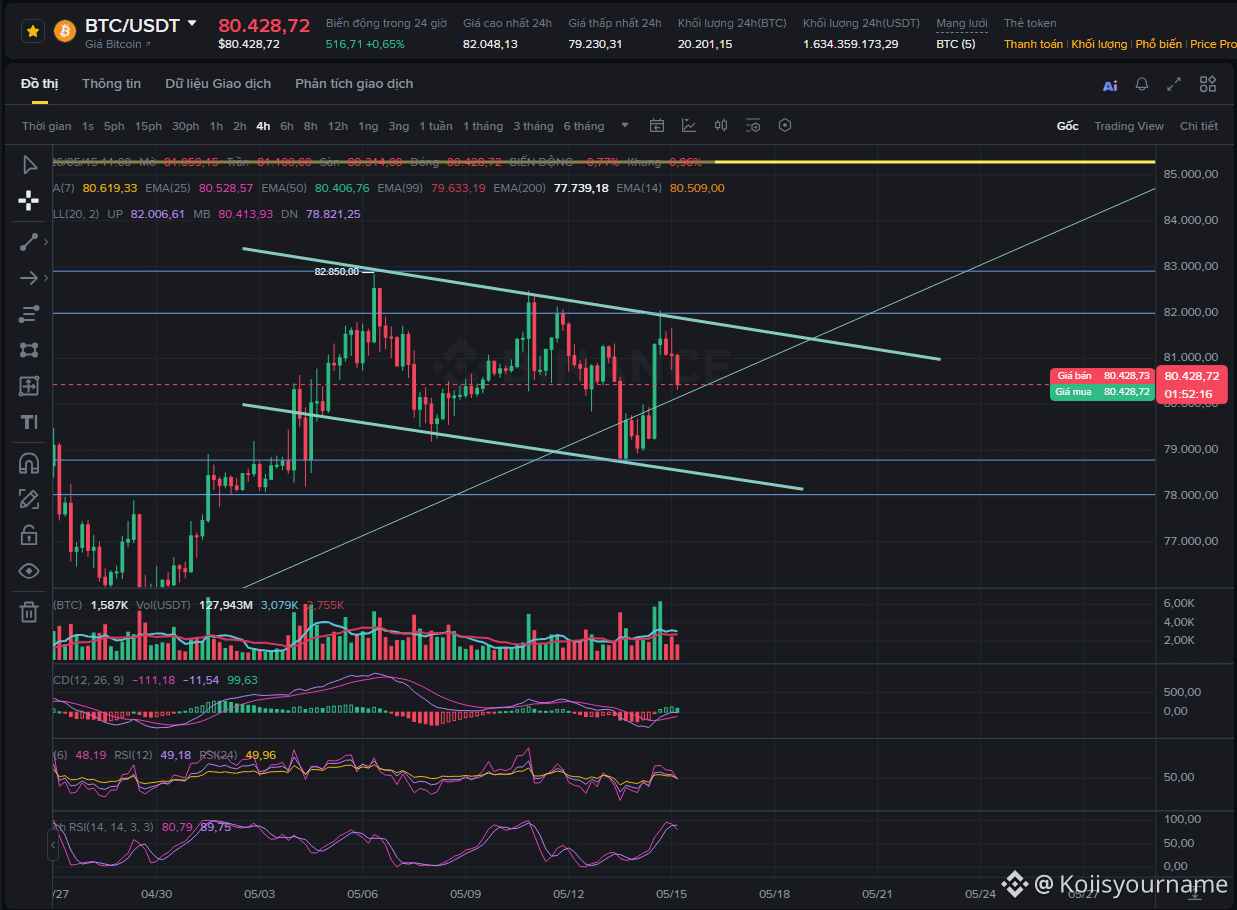
$BTC Scrolling through the newsfeed since the start of the week, I see everyone shouting 'short', and when it hits 80, the short pressure is on! This bubble is as big as a ripe watermelon ready to burst 🐧
$BTC Currently, we're siteway in the price range of 80.5-82.5.
An additional mint of about $1.5 billion has been made.
It's still a bit uncertain, but in my analysis, the price should continue climbing up to 85K, especially with solid buy candles around the 80K mark.
This week has been a bit lazy, and there haven't been any major shifts according to my previous analysis, so I've been slow to update. I'll post right away when there's new movement for you all!
An additional mint of about $1.5 billion has been made.
It's still a bit uncertain, but in my analysis, the price should continue climbing up to 85K, especially with solid buy candles around the 80K mark.
This week has been a bit lazy, and there haven't been any major shifts according to my previous analysis, so I've been slow to update. I'll post right away when there's new movement for you all!
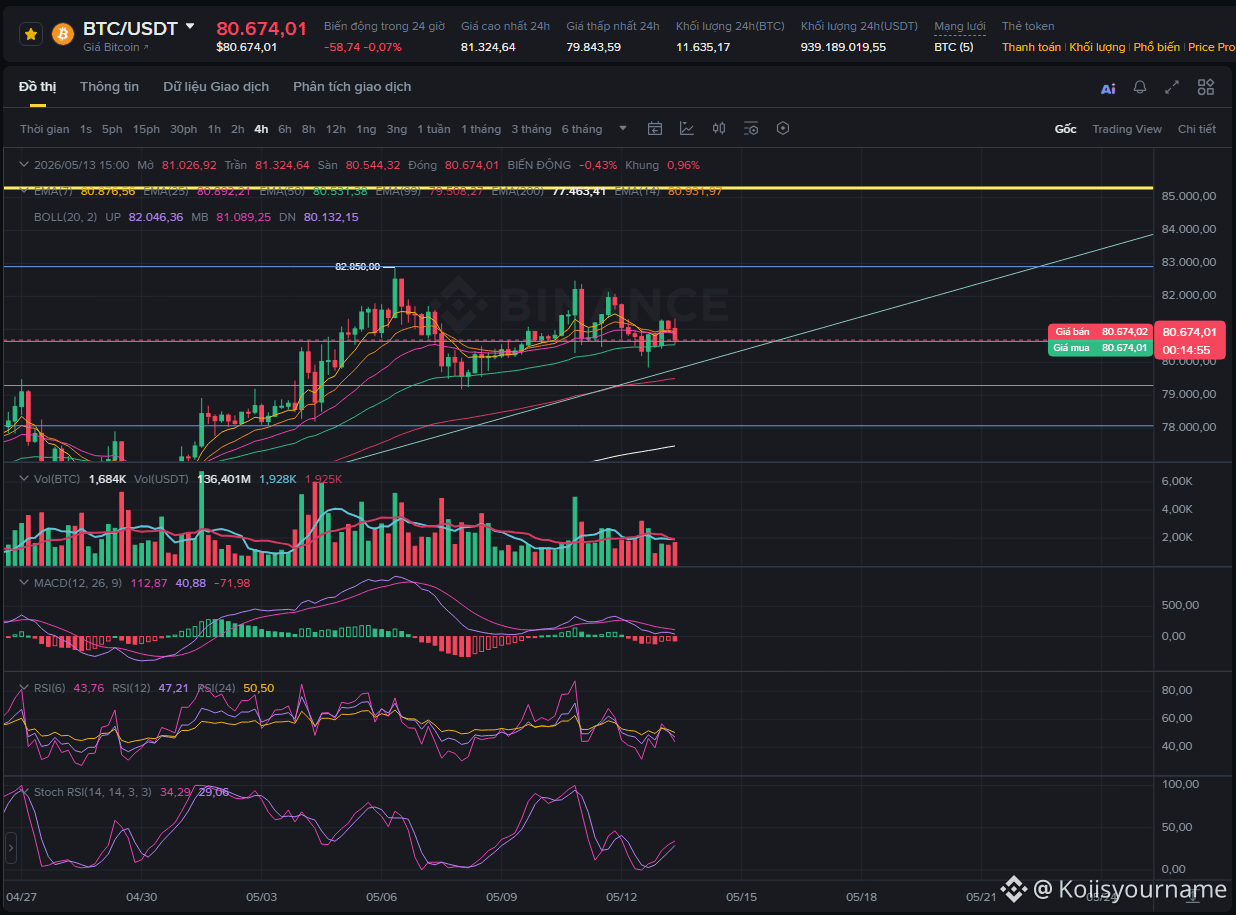
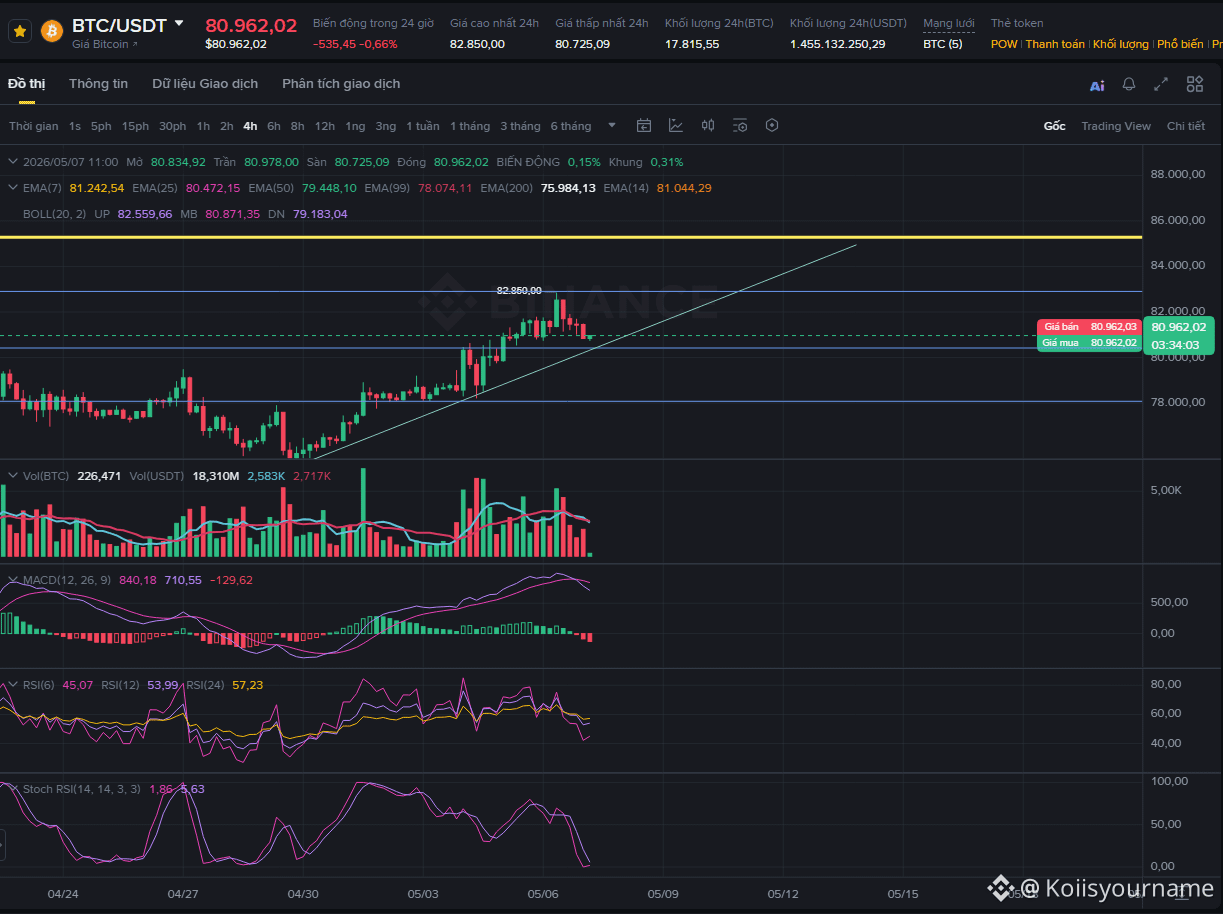
$BTC Let's be straight. Based on my analysis of the model, this rally could hit a ceiling at 88K! However, here are some important notes based on indicator analysis:
- Key EMA levels are converging around 85K
- Old sell points are hovering around the 85-82K zone
- Buying opportunities have previously not appeared in the 85-82K range
So keep in mind:
- The probability of hitting the ceiling at 88K isn't high.
- The 85-82K area will be a battleground.
- Selling could happen around the 85K mark and below.
- The upward trend is expected to continue until mid-May, followed by a quick correction back to the buying zone!
This is a future prediction, not investment advice! The futures market can change at any time, so please consider carefully!
- Key EMA levels are converging around 85K
- Old sell points are hovering around the 85-82K zone
- Buying opportunities have previously not appeared in the 85-82K range
So keep in mind:
- The probability of hitting the ceiling at 88K isn't high.
- The 85-82K area will be a battleground.
- Selling could happen around the 85K mark and below.
- The upward trend is expected to continue until mid-May, followed by a quick correction back to the buying zone!
This is a future prediction, not investment advice! The futures market can change at any time, so please consider carefully!
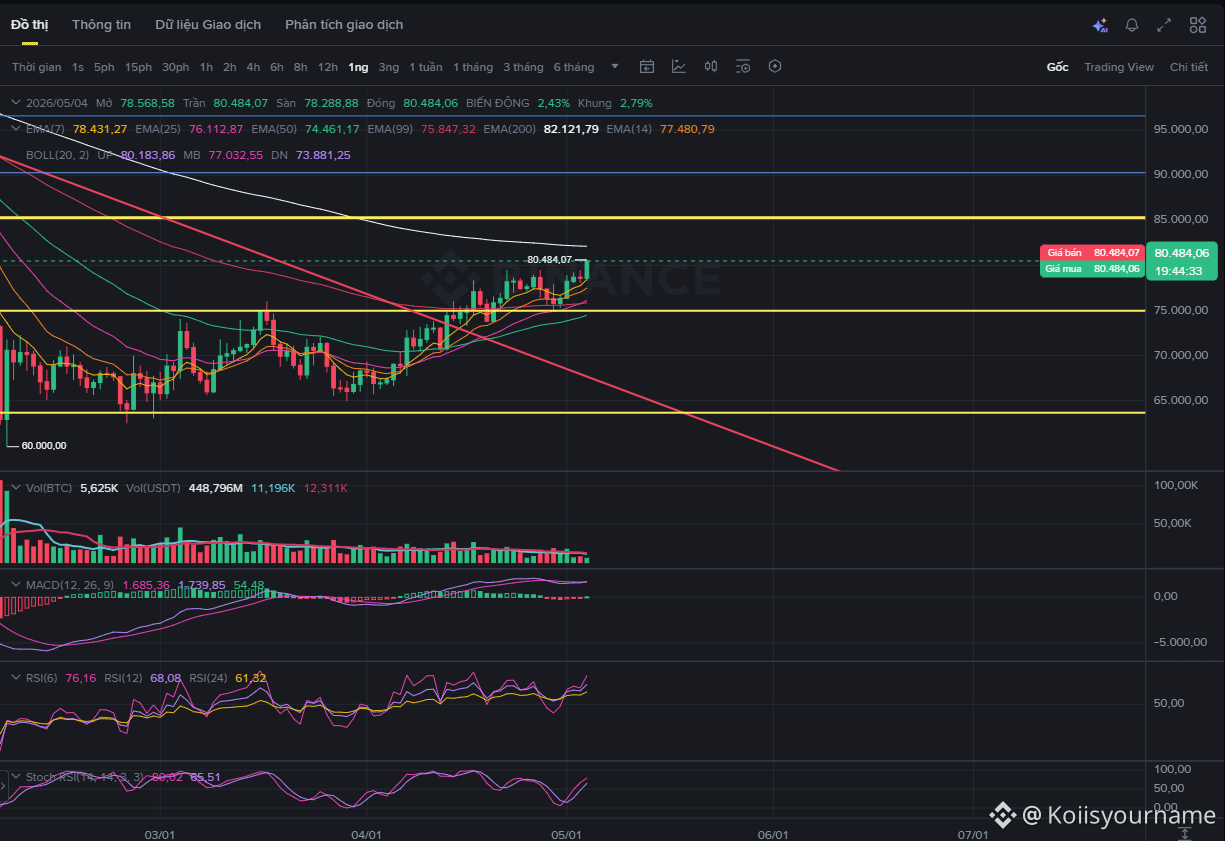
Knew it four days ahead! You guys must've already calculated everything, right? :))
Today, let's check out the weekly view of $BTC for everyone, okay? 😊
Today, let's check out the weekly view of $BTC for everyone, okay? 😊
Koiisyourname
·
--
$BTC Hey everyone, did you all close your shorts yet?
I'm sending over the latest receipt, just so you know, BTC might fluctuate between 73.5-85.1K this May!
The short-term trend is recovering, testing the 79x range, and if it can push past 79, there's a strong chance it will break above 85K.
Just keeping you all in the loop!
I'm sending over the latest receipt, just so you know, BTC might fluctuate between 73.5-85.1K this May!
The short-term trend is recovering, testing the 79x range, and if it can push past 79, there's a strong chance it will break above 85K.
Just keeping you all in the loop!
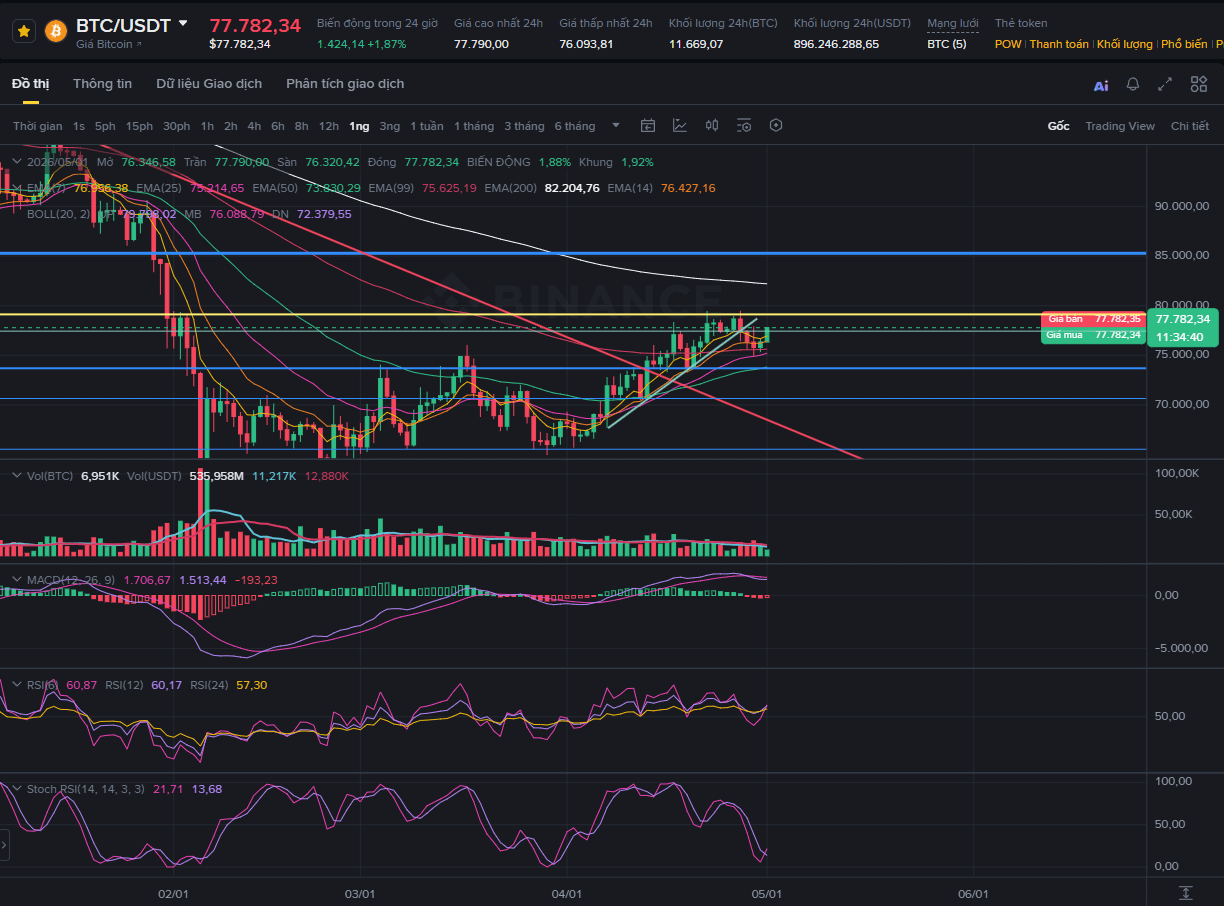
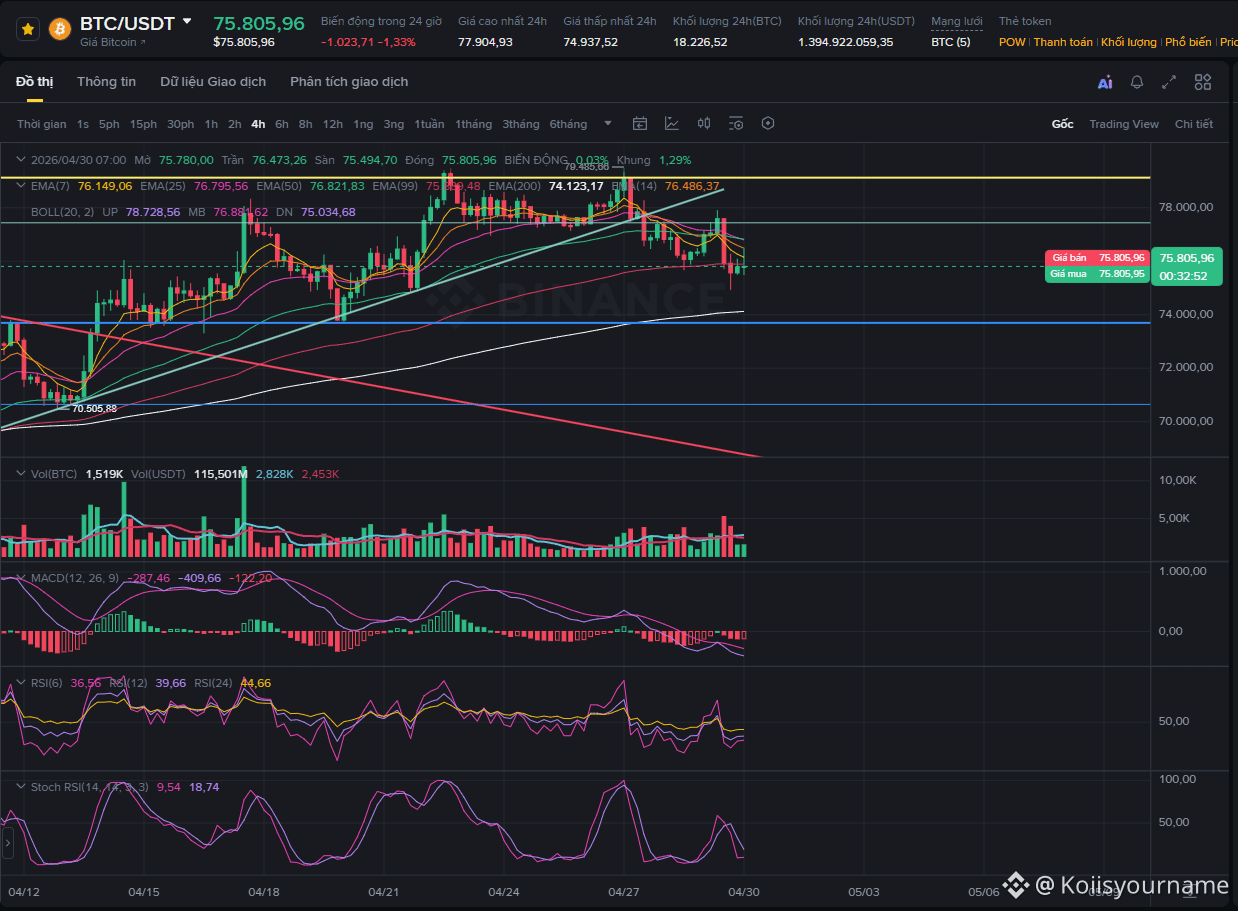
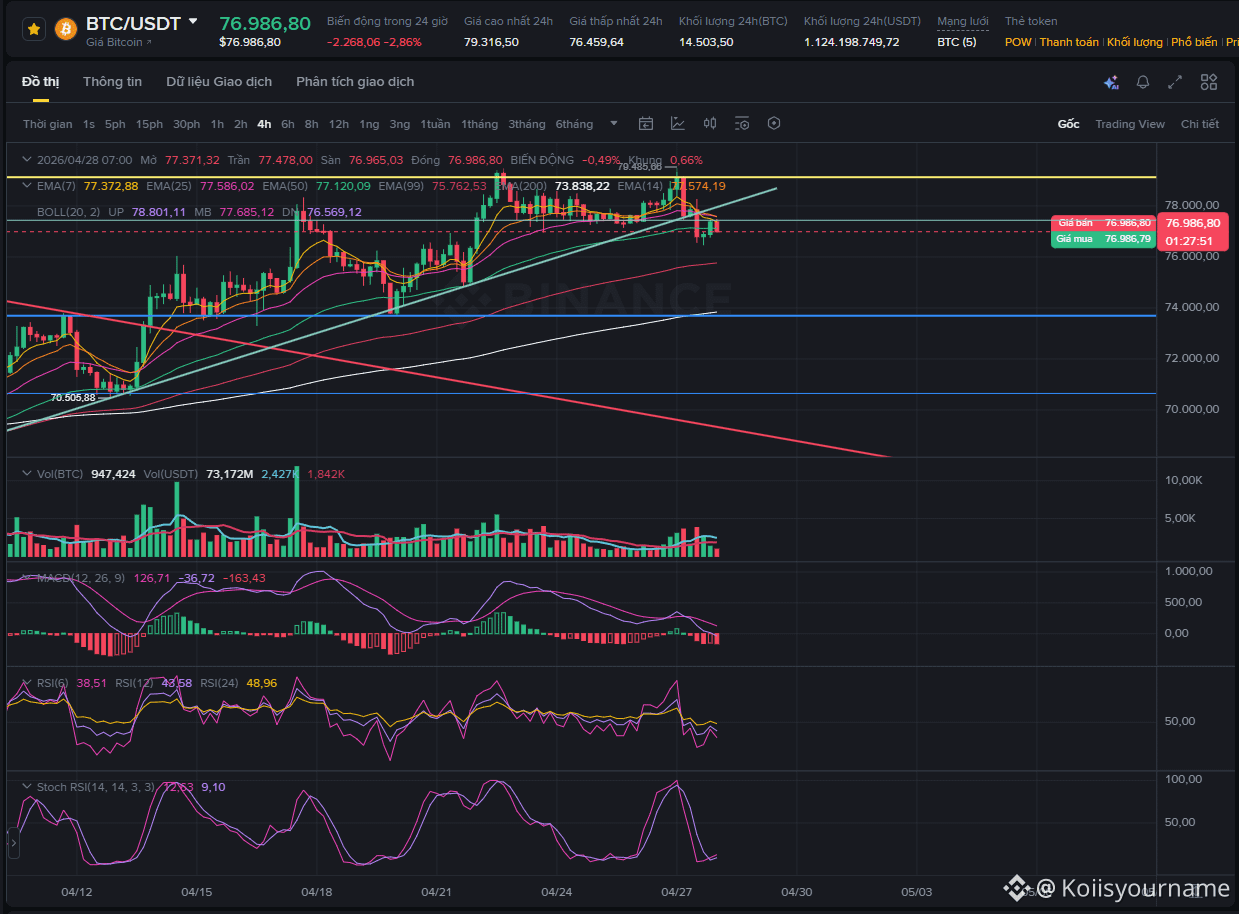
$BTC the current price range is between 73.5 - 77.4 - Could be sideways until the end of the week - bearish trend!
That's my prediction for the week! Right now it's a bit unclear, there's been selling pressure at 79K but it's not super strong yet!
Still quite sensitive, guys should short and set a stop-loss, alright?
That's my prediction for the week! Right now it's a bit unclear, there's been selling pressure at 79K but it's not super strong yet!
Still quite sensitive, guys should short and set a stop-loss, alright?
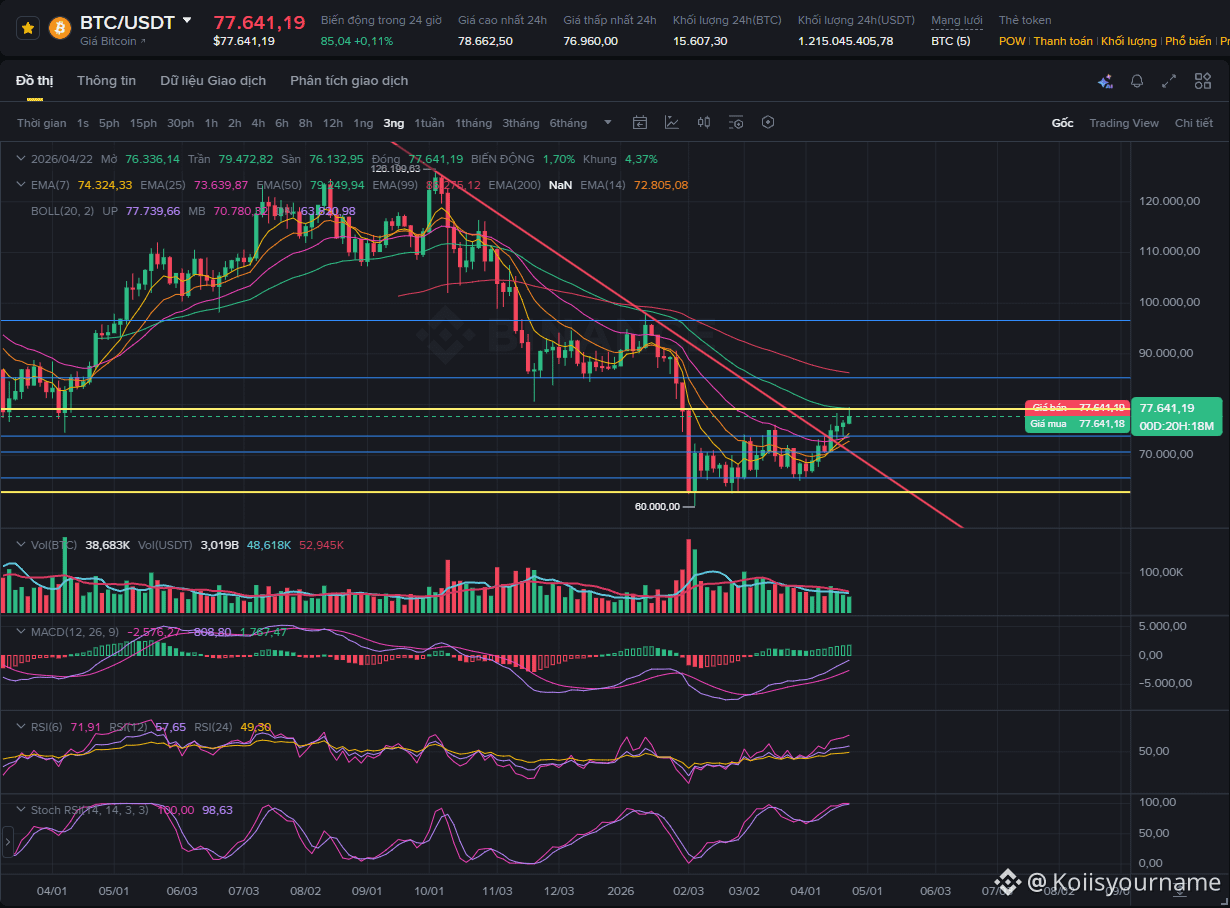
The long-term downtrend trendline of $BTC has broken - although it's unclear if it will create a new downtrend, right now the outlook is quite positive for the end of this year and the beginning of next year!
Institutions are gradually buying in at the 70K mark - for now, my prediction is that it will range trade for quite a while between 65-70K to accumulate - this could last 1-3 months!
Institutions are gradually buying in at the 70K mark - for now, my prediction is that it will range trade for quite a while between 65-70K to accumulate - this could last 1-3 months!
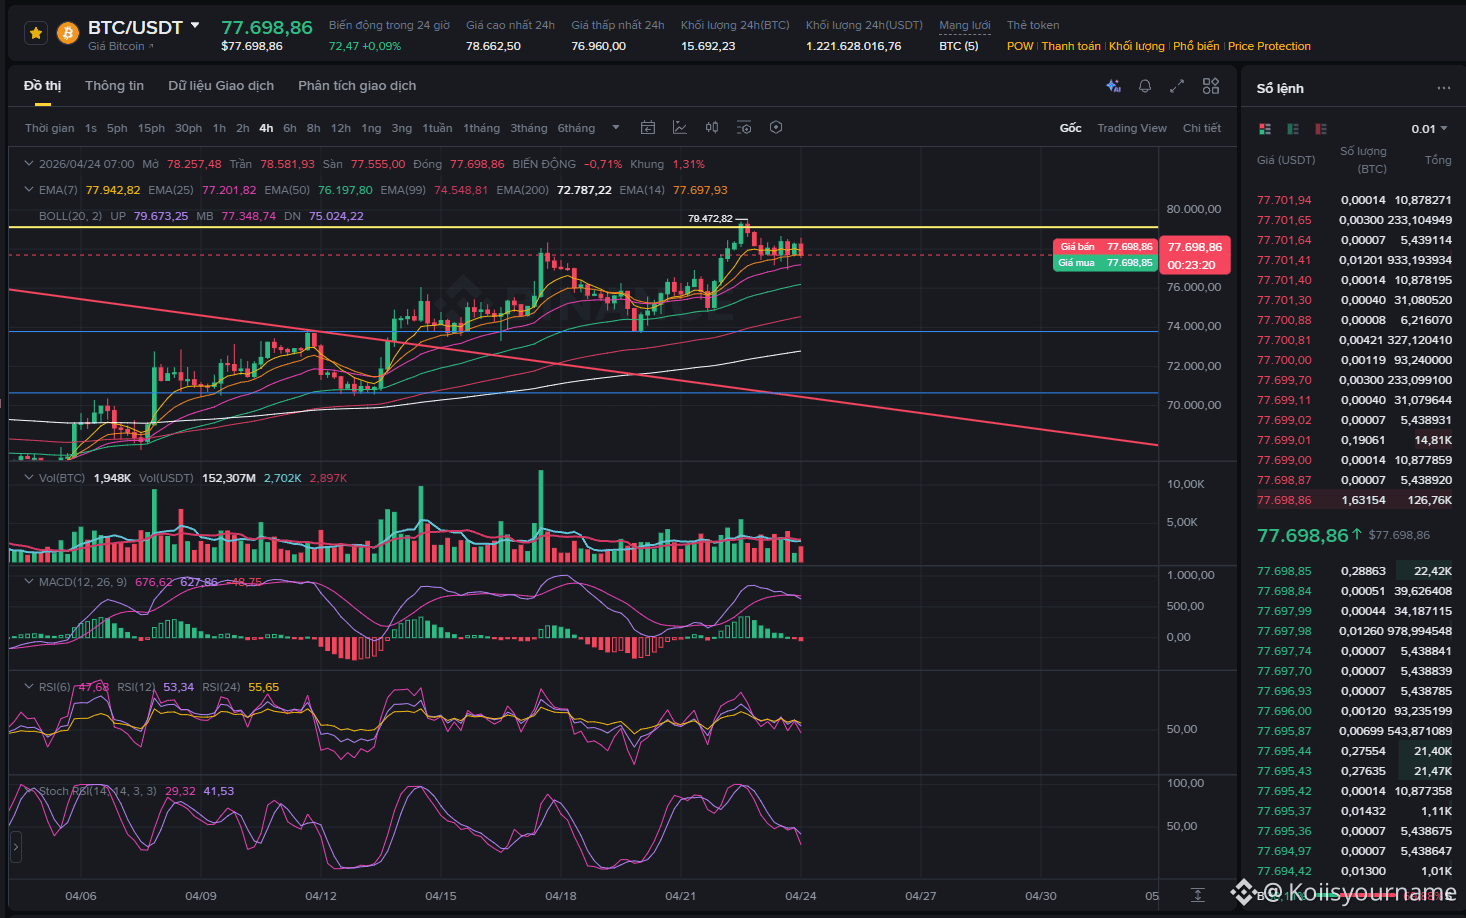
$BTC has hit the golden line, long positions have been fully closed! Waiting to place a short order down to 65K!
Currently, there are still no signs of a downturn, alright!
Currently, there are still no signs of a downturn, alright!
Log in to explore more content