

CryptoTradeMask
9.8k Posts

CryptoTradeMask
Report
Block User
Cryptocurrency market news, financial reviews, courses and training, all about cryptocurrencies and blockchain | 📊Technical analyses, Trading Strategy | 🦈
Open Trade
High-Frequency Trader
8.3 Years
233 Following
1.8K+ Followers
12.2K+ Liked
Posts
Portfolio
All
Quotes
Videos
PINNED
Article
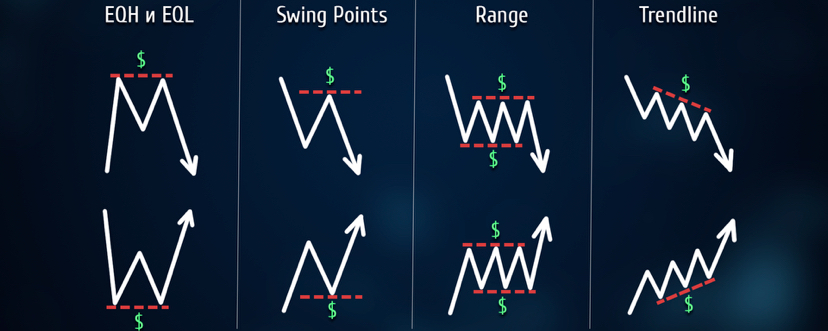
"What the Charts Don't Tell You: The Secret Language of Oscillators, Liquidity, and Smart Money"This is a detailed guide on advanced tools and market mechanics. If you've already outgrown basic technical analysis (like simple trend lines or basic moving averages), these four sections will help you peek behind the price chart and understand what actually drives the price action.
"What the Charts Don't Tell You: The Secret Language of Oscillators, Liquidity, and Smart Money"
This is a detailed guide on advanced tools and market mechanics. If you've already outgrown basic technical analysis (like simple trend lines or basic moving averages), these four sections will help you peek behind the price chart and understand what actually drives the price action.
1
144
PINNED

Article
📖Encyclopedia of Modern Trading: From Smart Money Concepts to Quantum Algorithms📊Trading is not just about buying and selling. It is an intellectual war where each participant uses their weapon: from classical geometry to artificial intelligence. In this article, we will analyze the complete map of methods that shape financial markets.
🧠 I. CONCEPTUAL METHODS: How professionals think
📖Encyclopedia of Modern Trading: From Smart Money Concepts to Quantum Algorithms📊
Trading is not just about buying and selling. It is an intellectual war where each participant uses their weapon: from classical geometry to artificial intelligence. In this article, we will analyze the complete map of methods that shape financial markets.
🧠 I. CONCEPTUAL METHODS: How professionals think
🧠 I. CONCEPTUAL METHODS: How professionals think
10
3
41
410
#bitcoin
📊 Bitcoin Analysis: Are buyers running out of steam after another rejection at $87K?
Following the September pullback, Bitcoin is once again approaching a key resistance zone. The price structure remains bullish, yet technical levels and on-chain metrics point to significant hurdles for further gains.
📉 Technical Outlook:
Daily: $BTC is trading around $85.2K, right up against the $86K–$90K resistance zone. Buyers have firmly held the $83K–$84K support level, signaling sustained demand. A "golden cross" of moving averages (near $71.5K) is potentially on the horizon, though not yet confirmed.
4-Hour: An ascending triangle is forming within an upward-sloping channel on the 4-hour chart. Resistance lies at $87K–$87.3K, while support is shifting higher ($84.5K–$85K). Price compression is occurring, which typically precedes a strong momentum move.
📊 On-chain Sentiment (Realized Price):
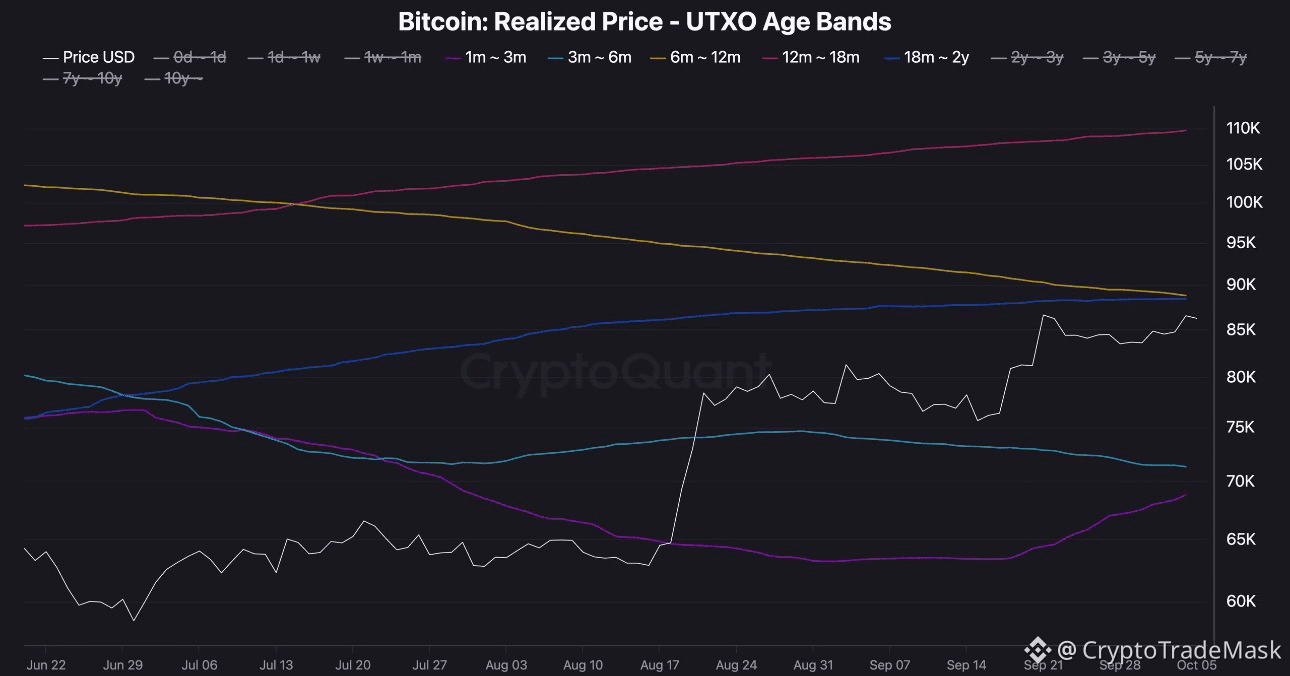
The "1–3 month" and "3–6 month" holder cohorts are currently in profit (with average purchase prices of $69K and $71K, respectively).
However, the price remains below the average purchase price for the "6–12 month" and "18–24 month" cohorts ($88K–$89K). The convergence of technical resistance and the break-even point for these investors creates a potential zone of heavy selling pressure.
🎯 Key scenarios:
🟢 Bullish scenario:
A decisive breakout and consolidation above $87.3K–$87.5K would pave the way to $88K–$90K. If the bulls manage to surpass $90K (pushing long-term holders into profit), the next target would be the $94K–$98K range.
🔴 Bearish scenario:
Another rejection and a loss of the $84.5K support level risk driving the price down to $82.5K–$83K, and subsequently to the channel median near $81K. The primary support zone below lies at the $75K–$78K level.
{future}(BTCUSDT)
#bitcoin
📊 Bitcoin Analysis: Are buyers running out of steam after another rejection at $87K?
Following the September pullback, Bitcoin is once again approaching a key resistance zone. The price structure remains bullish, yet technical levels and on-chain metrics point to significant hurdles for further gains.
📉 Technical Outlook:
Daily: $BTC is trading around $85.2K, right up against the $86K–$90K resistance zone. Buyers have firmly held the $83K–$84K support level, signaling sustained demand. A "golden cross" of moving averages (near $71.5K) is potentially on the horizon, though not yet confirmed.
4-Hour: An ascending triangle is forming within an upward-sloping channel on the 4-hour chart. Resistance lies at $87K–$87.3K, while support is shifting higher ($84.5K–$85K). Price compression is occurring, which typically precedes a strong momentum move.
📊 On-chain Sentiment (Realized Price):
The "1–3 month" and "3–6 month" holder cohorts are currently in profit (with average purchase prices of $69K and $71K, respectively).
However, the price remains below the average purchase price for the "6–12 month" and "18–24 month" cohorts ($88K–$89K). The convergence of technical resistance and the break-even point for these investors creates a potential zone of heavy selling pressure.
🎯 Key scenarios:
🟢 Bullish scenario:
A decisive breakout and consolidation above $87.3K–$87.5K would pave the way to $88K–$90K. If the bulls manage to surpass $90K (pushing long-term holders into profit), the next target would be the $94K–$98K range.
🔴 Bearish scenario:
Another rejection and a loss of the $84.5K support level risk driving the price down to $82.5K–$83K, and subsequently to the channel median near $81K. The primary support zone below lies at the $75K–$78K level.
📊 Bitcoin Analysis: Are buyers running out of steam after another rejection at $87K?
Following the September pullback, Bitcoin is once again approaching a key resistance zone. The price structure remains bullish, yet technical levels and on-chain metrics point to significant hurdles for further gains.
📉 Technical Outlook:
Daily: $BTC is trading around $85.2K, right up against the $86K–$90K resistance zone. Buyers have firmly held the $83K–$84K support level, signaling sustained demand. A "golden cross" of moving averages (near $71.5K) is potentially on the horizon, though not yet confirmed.
4-Hour: An ascending triangle is forming within an upward-sloping channel on the 4-hour chart. Resistance lies at $87K–$87.3K, while support is shifting higher ($84.5K–$85K). Price compression is occurring, which typically precedes a strong momentum move.
📊 On-chain Sentiment (Realized Price):
The "1–3 month" and "3–6 month" holder cohorts are currently in profit (with average purchase prices of $69K and $71K, respectively).
However, the price remains below the average purchase price for the "6–12 month" and "18–24 month" cohorts ($88K–$89K). The convergence of technical resistance and the break-even point for these investors creates a potential zone of heavy selling pressure.
🎯 Key scenarios:
🟢 Bullish scenario:
A decisive breakout and consolidation above $87.3K–$87.5K would pave the way to $88K–$90K. If the bulls manage to surpass $90K (pushing long-term holders into profit), the next target would be the $94K–$98K range.
🔴 Bearish scenario:
Another rejection and a loss of the $84.5K support level risk driving the price down to $82.5K–$83K, and subsequently to the channel median near $81K. The primary support zone below lies at the $75K–$78K level.
57
#metaplanet
Metaplanet grows Bitcoin reserves to 44,000 $BTC ($3.8 billion) by the end of Q3 2026 🚀
Japanese company Metaplanet (3350) continues to execute its aggressive Bitcoin strategy, adding a net 1,000 BTC during the third quarter. As of September 30, its holdings reached 44,000 BTC.
📊 Key report details:
➡️ Liquidity maneuver: The company sold 10,000 BTC for $789.2 million ($78,925 per coin) and temporarily held the cash to demonstrate to creditors its ability to cover interest obligations. Subsequently, Metaplanet repurchased 11,000 BTC for $948.7 million ($86,246 per coin).
➡️ Total cost basis: The total cost of all 44,000 BTC on the balance sheet is approximately $4.33 billion, with an average purchase price of $98,454 per BTC.
➡️ New strategy (Net Interest Income): Metaplanet plans to allocate 10–15% of its assets into preferred securities of other companies with significant Bitcoin treasuries to generate a yield exceeding its cost of capital.
➡️ Options revenue: The options business (Bitcoin Income Generation) generated $5.4 million in revenue for Q3 (a 51% drop compared to Q2), but total revenue for the nine-month period reached $35.2 million (marking the eighth consecutive profitable quarter).
➡️ Market reaction: Metaplanet shares in Tokyo closed 2% higher at 297 yen ($1.88).
⚠️ CEO Simon Gerovich emphasized that the company's goal is to move beyond mere BTC accumulation and become a leading Bitcoin financial company in Asia.
{future}(BTCUSDT)
#metaplanet
Metaplanet grows Bitcoin reserves to 44,000 $BTC ($3.8 billion) by the end of Q3 2026 🚀
Japanese company Metaplanet (3350) continues to execute its aggressive Bitcoin strategy, adding a net 1,000 BTC during the third quarter. As of September 30, its holdings reached 44,000 BTC.
📊 Key report details:
➡️ Liquidity maneuver: The company sold 10,000 BTC for $789.2 million ($78,925 per coin) and temporarily held the cash to demonstrate to creditors its ability to cover interest obligations. Subsequently, Metaplanet repurchased 11,000 BTC for $948.7 million ($86,246 per coin).
➡️ Total cost basis: The total cost of all 44,000 BTC on the balance sheet is approximately $4.33 billion, with an average purchase price of $98,454 per BTC.
➡️ New strategy (Net Interest Income): Metaplanet plans to allocate 10–15% of its assets into preferred securities of other companies with significant Bitcoin treasuries to generate a yield exceeding its cost of capital.
➡️ Options revenue: The options business (Bitcoin Income Generation) generated $5.4 million in revenue for Q3 (a 51% drop compared to Q2), but total revenue for the nine-month period reached $35.2 million (marking the eighth consecutive profitable quarter).
➡️ Market reaction: Metaplanet shares in Tokyo closed 2% higher at 297 yen ($1.88).
⚠️ CEO Simon Gerovich emphasized that the company's goal is to move beyond mere BTC accumulation and become a leading Bitcoin financial company in Asia.
Metaplanet grows Bitcoin reserves to 44,000 $BTC ($3.8 billion) by the end of Q3 2026 🚀
Japanese company Metaplanet (3350) continues to execute its aggressive Bitcoin strategy, adding a net 1,000 BTC during the third quarter. As of September 30, its holdings reached 44,000 BTC.
📊 Key report details:
➡️ Liquidity maneuver: The company sold 10,000 BTC for $789.2 million ($78,925 per coin) and temporarily held the cash to demonstrate to creditors its ability to cover interest obligations. Subsequently, Metaplanet repurchased 11,000 BTC for $948.7 million ($86,246 per coin).
➡️ Total cost basis: The total cost of all 44,000 BTC on the balance sheet is approximately $4.33 billion, with an average purchase price of $98,454 per BTC.
➡️ New strategy (Net Interest Income): Metaplanet plans to allocate 10–15% of its assets into preferred securities of other companies with significant Bitcoin treasuries to generate a yield exceeding its cost of capital.
➡️ Options revenue: The options business (Bitcoin Income Generation) generated $5.4 million in revenue for Q3 (a 51% drop compared to Q2), but total revenue for the nine-month period reached $35.2 million (marking the eighth consecutive profitable quarter).
➡️ Market reaction: Metaplanet shares in Tokyo closed 2% higher at 297 yen ($1.88).
⚠️ CEO Simon Gerovich emphasized that the company's goal is to move beyond mere BTC accumulation and become a leading Bitcoin financial company in Asia.
30
#CryptoMarketMoves
Bitcoin bounces off $87K again, while Cardano surges 11%: Market Overview
Despite renewed tensions in the Middle East, the cryptocurrency market is off to a dynamic start this week. Total market capitalization rose by 1% to reach $2.93 trillion.
📊 Key Market Highlights:
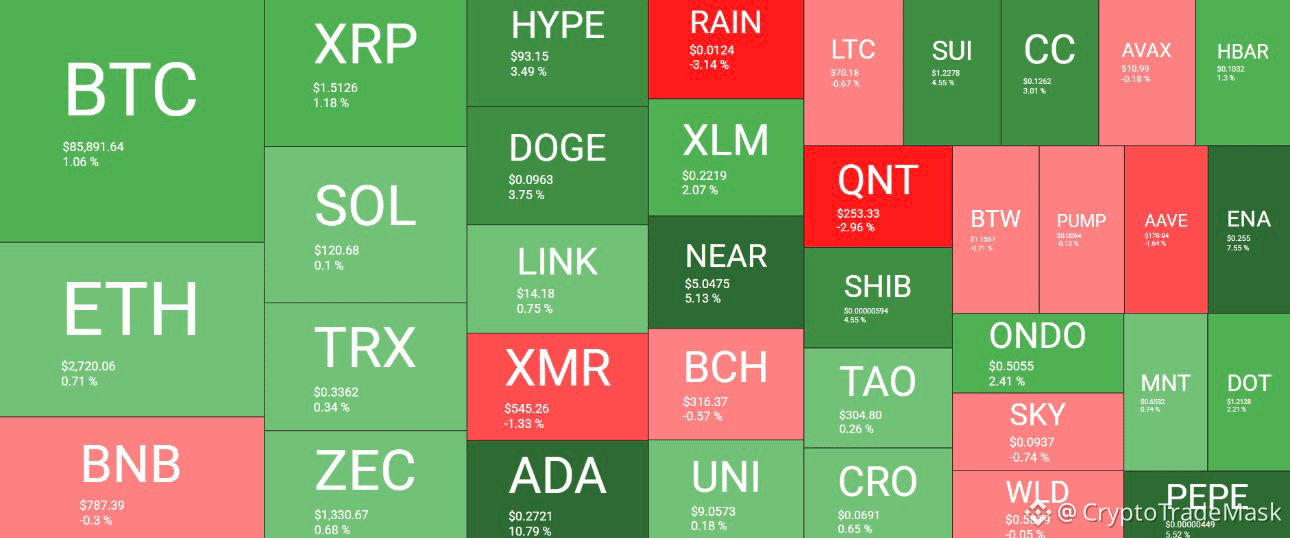
Bitcoin (#BTC ) climbed to $87,000 on Monday morning but once again faced strong selling pressure. After pulling back to $85,500, the price stabilized around the $86,000 mark. BTC's market cap stands at $1.72 trillion, with its dominance index holding steady at 59%.
Cardano (#ADA ) emerged as the clear leader among top altcoins, surging nearly 11% to reach the $0.27 level.
🚀 Altcoin Surge:
$FET rose by over 15%.
$VIRTUAL gained 12%.
$NEAR climbed 5%, reclaiming the $5 mark.
#DOGE (+3.75%), HYPE (+3.5%), and ENA (+7.5%) were also among the day's top performers.
Large caps: Ethereum (#ETH ) consolidated slightly above $2,700, while XRP is trading above $1.50.
{future}(NEARUSDT)
{future}(VIRTUALUSDT)
{future}(FETUSDT)
#CryptoMarketMoves
Bitcoin bounces off $87K again, while Cardano surges 11%: Market Overview
Despite renewed tensions in the Middle East, the cryptocurrency market is off to a dynamic start this week. Total market capitalization rose by 1% to reach $2.93 trillion.
📊 Key Market Highlights:
Bitcoin (#BTC ) climbed to $87,000 on Monday morning but once again faced strong selling pressure. After pulling back to $85,500, the price stabilized around the $86,000 mark. BTC's market cap stands at $1.72 trillion, with its dominance index holding steady at 59%.
Cardano (#ADA ) emerged as the clear leader among top altcoins, surging nearly 11% to reach the $0.27 level.
🚀 Altcoin Surge:
$FET rose by over 15%.
$VIRTUAL gained 12%.
$NEAR climbed 5%, reclaiming the $5 mark.
#DOGE (+3.75%), HYPE (+3.5%), and ENA (+7.5%) were also among the day's top performers.
Large caps: Ethereum (#ETH ) consolidated slightly above $2,700, while XRP is trading above $1.50.
Bitcoin bounces off $87K again, while Cardano surges 11%: Market Overview
Despite renewed tensions in the Middle East, the cryptocurrency market is off to a dynamic start this week. Total market capitalization rose by 1% to reach $2.93 trillion.
📊 Key Market Highlights:
Bitcoin (#BTC ) climbed to $87,000 on Monday morning but once again faced strong selling pressure. After pulling back to $85,500, the price stabilized around the $86,000 mark. BTC's market cap stands at $1.72 trillion, with its dominance index holding steady at 59%.
Cardano (#ADA ) emerged as the clear leader among top altcoins, surging nearly 11% to reach the $0.27 level.
🚀 Altcoin Surge:
$FET rose by over 15%.
$VIRTUAL gained 12%.
$NEAR climbed 5%, reclaiming the $5 mark.
#DOGE (+3.75%), HYPE (+3.5%), and ENA (+7.5%) were also among the day's top performers.
Large caps: Ethereum (#ETH ) consolidated slightly above $2,700, while XRP is trading above $1.50.
101
#zcash
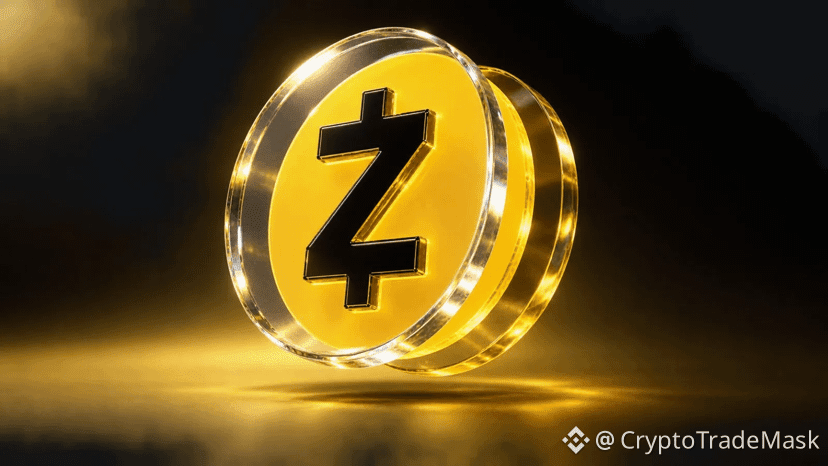
⚡ Zcash ($ZEC ) has launched the NU7 upgrade on the testnet: 25-second blocks and a new economic model!
Zcash has activated the major NU7 (Network Upgrade 7) on the public testnet (at block height 4,465,026). The primary goal is to prepare for the full Mainnet launch scheduled for November 5, 2026.
🔑 Key NU7 changes:
➡️ 3x faster block times (ZIP 218): Block generation time has been reduced from 75 to 25 seconds. This will significantly speed up initial transaction confirmations—critical for POS terminals, exchanges, and cross-chain bridges.
Note: Total ZEC supply, the 21-million-coin cap, and the 4-year halving schedule remain unchanged.
➡️ Network resilience mechanism (ZIP 235 & 237): A special reserve is being introduced to ensure long-term network security.
60% of fees from each block are removed from circulation and placed into the reserve, while 40% go to miners.
The reserve periodically redistributes small portions of accumulated funds as an additional block reward. This ensures continued funding for miners even after traditional rewards are significantly reduced by halvings.
➡️ Optimization and spam protection: New limits have been established for private (shielded) transactions. The throughput of the Orchard protocol will more than double, and the potential load from spam attacks on light wallets will decrease by approximately 37%.
🗓 What’s next?
All node operators are urged to update their software and test NU7 on the testnet. A final decision regarding the Mainnet launch date will be made on October 20. If testing is successful, the update will be activated on the main network on November 5.
{future}(ZECUSDT)
#zcash
⚡ Zcash ($ZEC ) has launched the NU7 upgrade on the testnet: 25-second blocks and a new economic model!
Zcash has activated the major NU7 (Network Upgrade 7) on the public testnet (at block height 4,465,026). The primary goal is to prepare for the full Mainnet launch scheduled for November 5, 2026.
🔑 Key NU7 changes:
➡️ 3x faster block times (ZIP 218): Block generation time has been reduced from 75 to 25 seconds. This will significantly speed up initial transaction confirmations—critical for POS terminals, exchanges, and cross-chain bridges.
Note: Total ZEC supply, the 21-million-coin cap, and the 4-year halving schedule remain unchanged.
➡️ Network resilience mechanism (ZIP 235 & 237): A special reserve is being introduced to ensure long-term network security.
60% of fees from each block are removed from circulation and placed into the reserve, while 40% go to miners.
The reserve periodically redistributes small portions of accumulated funds as an additional block reward. This ensures continued funding for miners even after traditional rewards are significantly reduced by halvings.
➡️ Optimization and spam protection: New limits have been established for private (shielded) transactions. The throughput of the Orchard protocol will more than double, and the potential load from spam attacks on light wallets will decrease by approximately 37%.
🗓 What’s next?
All node operators are urged to update their software and test NU7 on the testnet. A final decision regarding the Mainnet launch date will be made on October 20. If testing is successful, the update will be activated on the main network on November 5.
⚡ Zcash ($ZEC ) has launched the NU7 upgrade on the testnet: 25-second blocks and a new economic model!
Zcash has activated the major NU7 (Network Upgrade 7) on the public testnet (at block height 4,465,026). The primary goal is to prepare for the full Mainnet launch scheduled for November 5, 2026.
🔑 Key NU7 changes:
➡️ 3x faster block times (ZIP 218): Block generation time has been reduced from 75 to 25 seconds. This will significantly speed up initial transaction confirmations—critical for POS terminals, exchanges, and cross-chain bridges.
Note: Total ZEC supply, the 21-million-coin cap, and the 4-year halving schedule remain unchanged.
➡️ Network resilience mechanism (ZIP 235 & 237): A special reserve is being introduced to ensure long-term network security.
60% of fees from each block are removed from circulation and placed into the reserve, while 40% go to miners.
The reserve periodically redistributes small portions of accumulated funds as an additional block reward. This ensures continued funding for miners even after traditional rewards are significantly reduced by halvings.
➡️ Optimization and spam protection: New limits have been established for private (shielded) transactions. The throughput of the Orchard protocol will more than double, and the potential load from spam attacks on light wallets will decrease by approximately 37%.
🗓 What’s next?
All node operators are urged to update their software and test NU7 on the testnet. A final decision regarding the Mainnet launch date will be made on October 20. If testing is successful, the update will be activated on the main network on November 5.
73
#Near
🚀 $NEAR Protocol: Will the rally continue after the reversal?
After an impressive rally from $1.60 in August to over $5.00, the NEAR token entered a consolidation phase. However, buyers continue to buy the dips.
🔍 What’s happening on the chart?
Bounce from $4.70: Sellers' attempts to deepen the correction stalled. Bulls regained the initiative and pushed the price back above the $5.00 mark.
RSI Cooling Off: The Relative Strength Index has cooled down from the overheated overbought zone and reset without significantly losing the gains made. This is a healthy signal for further movement.
Trend Stronger Than Correction: The price is trading well above key moving averages (MAs).
‼️ Key levels to watch:
➡️ Resistance ($5.40 – $5.60): NEAR has faced rejection at the $5.00+ level several times, evidenced by long upper wicks. A daily candle close above $5.60 would confirm readiness to push toward $6.00 and beyond.
➡️ Support ($4.60): Losing this zone would weaken the bullish reversal scenario and open the path to $4.20.
⚠️ Conclusion: From a technical standpoint, the NEAR rally is not yet exhausted. However, following a +200% surge, the token's future trajectory depends on whether buyers can flip the $5.40–$5.60 resistance zone into solid support.
{future}(NEARUSDT)
#Near
🚀 $NEAR Protocol: Will the rally continue after the reversal?
After an impressive rally from $1.60 in August to over $5.00, the NEAR token entered a consolidation phase. However, buyers continue to buy the dips.
🔍 What’s happening on the chart?
Bounce from $4.70: Sellers' attempts to deepen the correction stalled. Bulls regained the initiative and pushed the price back above the $5.00 mark.
RSI Cooling Off: The Relative Strength Index has cooled down from the overheated overbought zone and reset without significantly losing the gains made. This is a healthy signal for further movement.
Trend Stronger Than Correction: The price is trading well above key moving averages (MAs).
‼️ Key levels to watch:
➡️ Resistance ($5.40 – $5.60): NEAR has faced rejection at the $5.00+ level several times, evidenced by long upper wicks. A daily candle close above $5.60 would confirm readiness to push toward $6.00 and beyond.
➡️ Support ($4.60): Losing this zone would weaken the bullish reversal scenario and open the path to $4.20.
⚠️ Conclusion: From a technical standpoint, the NEAR rally is not yet exhausted. However, following a +200% surge, the token's future trajectory depends on whether buyers can flip the $5.40–$5.60 resistance zone into solid support.
🚀 $NEAR Protocol: Will the rally continue after the reversal?
After an impressive rally from $1.60 in August to over $5.00, the NEAR token entered a consolidation phase. However, buyers continue to buy the dips.
🔍 What’s happening on the chart?
Bounce from $4.70: Sellers' attempts to deepen the correction stalled. Bulls regained the initiative and pushed the price back above the $5.00 mark.
RSI Cooling Off: The Relative Strength Index has cooled down from the overheated overbought zone and reset without significantly losing the gains made. This is a healthy signal for further movement.
Trend Stronger Than Correction: The price is trading well above key moving averages (MAs).
‼️ Key levels to watch:
➡️ Resistance ($5.40 – $5.60): NEAR has faced rejection at the $5.00+ level several times, evidenced by long upper wicks. A daily candle close above $5.60 would confirm readiness to push toward $6.00 and beyond.
➡️ Support ($4.60): Losing this zone would weaken the bullish reversal scenario and open the path to $4.20.
⚠️ Conclusion: From a technical standpoint, the NEAR rally is not yet exhausted. However, following a +200% surge, the token's future trajectory depends on whether buyers can flip the $5.40–$5.60 resistance zone into solid support.

82
#UMA
🔮 Why should you pay attention to $UMA ? 3 key growth factors
The $UMA project (Optimistic Oracle) develops infrastructure for prediction markets and DeFi, enabling real-world data verification without centralized intermediaries.
📊 Here are three main reasons why this oracle has strong prospects:
1️⃣ Polymarket dominance and expanding brand reach
UMA’s Optimistic Oracle is the "heart" of the Polymarket prediction market. In the first quarter of 2025 alone, the oracle processed over 7,000 requests and resolved disputes involving $1 billion. Polymarket’s official X (Twitter) account regularly posts content about UMA’s mechanics, continuously boosting the project's visibility.
2️⃣ Technological upgrade: Launch of MOOV2
In 2025, UMA unveiled the Managed Optimistic Oracle V2 (MOOV2) update, which allows for the deployment of custom oracles in minutes without writing code. Furthermore, the updated token-burning mechanism—triggered by every dispute resolution—creates deflationary pressure on UMA's supply.
3️⃣ Revenue and staking growth
In the first quarter of 2026, protocol revenue hit a record $520,000, and staking volumes continue to rise. Additionally, the integration ecosystem is expanding; the UMA oracle has been integrated into advanced markets on Hyperliquid.
⚠️ Conclusion: $UMA is not merely a utility token but the foundation for the world's largest prediction market. Revenue growth, token burns, and new integrations make it one of the most compelling assets in the infrastructure sector.
{future}(UMAUSDT)
#UMA
🔮 Why should you pay attention to $UMA ? 3 key growth factors
The $UMA project (Optimistic Oracle) develops infrastructure for prediction markets and DeFi, enabling real-world data verification without centralized intermediaries.
📊 Here are three main reasons why this oracle has strong prospects:
1️⃣ Polymarket dominance and expanding brand reach
UMA’s Optimistic Oracle is the "heart" of the Polymarket prediction market. In the first quarter of 2025 alone, the oracle processed over 7,000 requests and resolved disputes involving $1 billion. Polymarket’s official X (Twitter) account regularly posts content about UMA’s mechanics, continuously boosting the project's visibility.
2️⃣ Technological upgrade: Launch of MOOV2
In 2025, UMA unveiled the Managed Optimistic Oracle V2 (MOOV2) update, which allows for the deployment of custom oracles in minutes without writing code. Furthermore, the updated token-burning mechanism—triggered by every dispute resolution—creates deflationary pressure on UMA's supply.
3️⃣ Revenue and staking growth
In the first quarter of 2026, protocol revenue hit a record $520,000, and staking volumes continue to rise. Additionally, the integration ecosystem is expanding; the UMA oracle has been integrated into advanced markets on Hyperliquid.
⚠️ Conclusion: $UMA is not merely a utility token but the foundation for the world's largest prediction market. Revenue growth, token burns, and new integrations make it one of the most compelling assets in the infrastructure sector.
🔮 Why should you pay attention to $UMA ? 3 key growth factors
The $UMA project (Optimistic Oracle) develops infrastructure for prediction markets and DeFi, enabling real-world data verification without centralized intermediaries.
📊 Here are three main reasons why this oracle has strong prospects:
1️⃣ Polymarket dominance and expanding brand reach
UMA’s Optimistic Oracle is the "heart" of the Polymarket prediction market. In the first quarter of 2025 alone, the oracle processed over 7,000 requests and resolved disputes involving $1 billion. Polymarket’s official X (Twitter) account regularly posts content about UMA’s mechanics, continuously boosting the project's visibility.
2️⃣ Technological upgrade: Launch of MOOV2
In 2025, UMA unveiled the Managed Optimistic Oracle V2 (MOOV2) update, which allows for the deployment of custom oracles in minutes without writing code. Furthermore, the updated token-burning mechanism—triggered by every dispute resolution—creates deflationary pressure on UMA's supply.
3️⃣ Revenue and staking growth
In the first quarter of 2026, protocol revenue hit a record $520,000, and staking volumes continue to rise. Additionally, the integration ecosystem is expanding; the UMA oracle has been integrated into advanced markets on Hyperliquid.
⚠️ Conclusion: $UMA is not merely a utility token but the foundation for the world's largest prediction market. Revenue growth, token burns, and new integrations make it one of the most compelling assets in the infrastructure sector.

1
179
#ThetaFuel
🚀 The Future of Theta Fuel ($TFUEL ): 3 Key Growth Factors for 2026
Theta Fuel ($TFUEL ) remains the native "fuel" of the Theta Network, and significant technological upgrades lie ahead. Here are the main drivers that could positively impact TFUEL's value and demand in 2026:
1️⃣ Generative AI (Early 2026)
The Concept: The network is introducing support for Large Language Models (LLMs). Developers and companies will be able to deploy and train AI models using decentralized computing power.
Impact on TFUEL: All transactions and computations will be paid for in TFUEL, enhancing its network utility. A portion of the fees will be burned, while the rest will be distributed among node operators, supporting the token's price.
2️⃣ Crypto Gaming (2026)
The Concept: One of Theta's main areas of focus in 2026 is the Web3 gaming sector. New gaming projects are launching where players can earn real rewards for in-game achievements.
Impact on TFUEL: Players will withdraw rewards directly in TFUEL, creating a steady stream of transactions. The more active players the platform attracts, the higher the demand for the token will be.
3️⃣ Partnerships and institutional support
Essence: Theta continues to expand its ecosystem through collaborations with major technology and crypto companies (e.g., the partnership with ZAN to develop EdgeCloud).
Impact on TFUEL: Attracting corporate partners increases overall EdgeCloud usage. Higher network load translates to a greater volume of TFUEL burning and stable payouts to stakers.
⚠️ Summary: Theta Fuel remains directly linked to the activity and popularity of the Theta Network. The launch of AI tools, the expansion of the gaming segment, and partnerships in 2026 create a solid foundation for growth.
{spot}(TFUELUSDT)
#ThetaFuel
🚀 The Future of Theta Fuel ($TFUEL ): 3 Key Growth Factors for 2026
Theta Fuel ($TFUEL ) remains the native "fuel" of the Theta Network, and significant technological upgrades lie ahead. Here are the main drivers that could positively impact TFUEL's value and demand in 2026:
1️⃣ Generative AI (Early 2026)
The Concept: The network is introducing support for Large Language Models (LLMs). Developers and companies will be able to deploy and train AI models using decentralized computing power.
Impact on TFUEL: All transactions and computations will be paid for in TFUEL, enhancing its network utility. A portion of the fees will be burned, while the rest will be distributed among node operators, supporting the token's price.
2️⃣ Crypto Gaming (2026)
The Concept: One of Theta's main areas of focus in 2026 is the Web3 gaming sector. New gaming projects are launching where players can earn real rewards for in-game achievements.
Impact on TFUEL: Players will withdraw rewards directly in TFUEL, creating a steady stream of transactions. The more active players the platform attracts, the higher the demand for the token will be.
3️⃣ Partnerships and institutional support
Essence: Theta continues to expand its ecosystem through collaborations with major technology and crypto companies (e.g., the partnership with ZAN to develop EdgeCloud).
Impact on TFUEL: Attracting corporate partners increases overall EdgeCloud usage. Higher network load translates to a greater volume of TFUEL burning and stable payouts to stakers.
⚠️ Summary: Theta Fuel remains directly linked to the activity and popularity of the Theta Network. The launch of AI tools, the expansion of the gaming segment, and partnerships in 2026 create a solid foundation for growth.
🚀 The Future of Theta Fuel ($TFUEL ): 3 Key Growth Factors for 2026
Theta Fuel ($TFUEL ) remains the native "fuel" of the Theta Network, and significant technological upgrades lie ahead. Here are the main drivers that could positively impact TFUEL's value and demand in 2026:
1️⃣ Generative AI (Early 2026)
The Concept: The network is introducing support for Large Language Models (LLMs). Developers and companies will be able to deploy and train AI models using decentralized computing power.
Impact on TFUEL: All transactions and computations will be paid for in TFUEL, enhancing its network utility. A portion of the fees will be burned, while the rest will be distributed among node operators, supporting the token's price.
2️⃣ Crypto Gaming (2026)
The Concept: One of Theta's main areas of focus in 2026 is the Web3 gaming sector. New gaming projects are launching where players can earn real rewards for in-game achievements.
Impact on TFUEL: Players will withdraw rewards directly in TFUEL, creating a steady stream of transactions. The more active players the platform attracts, the higher the demand for the token will be.
3️⃣ Partnerships and institutional support
Essence: Theta continues to expand its ecosystem through collaborations with major technology and crypto companies (e.g., the partnership with ZAN to develop EdgeCloud).
Impact on TFUEL: Attracting corporate partners increases overall EdgeCloud usage. Higher network load translates to a greater volume of TFUEL burning and stable payouts to stakers.
⚠️ Summary: Theta Fuel remains directly linked to the activity and popularity of the Theta Network. The launch of AI tools, the expansion of the gaming segment, and partnerships in 2026 create a solid foundation for growth.
1
35
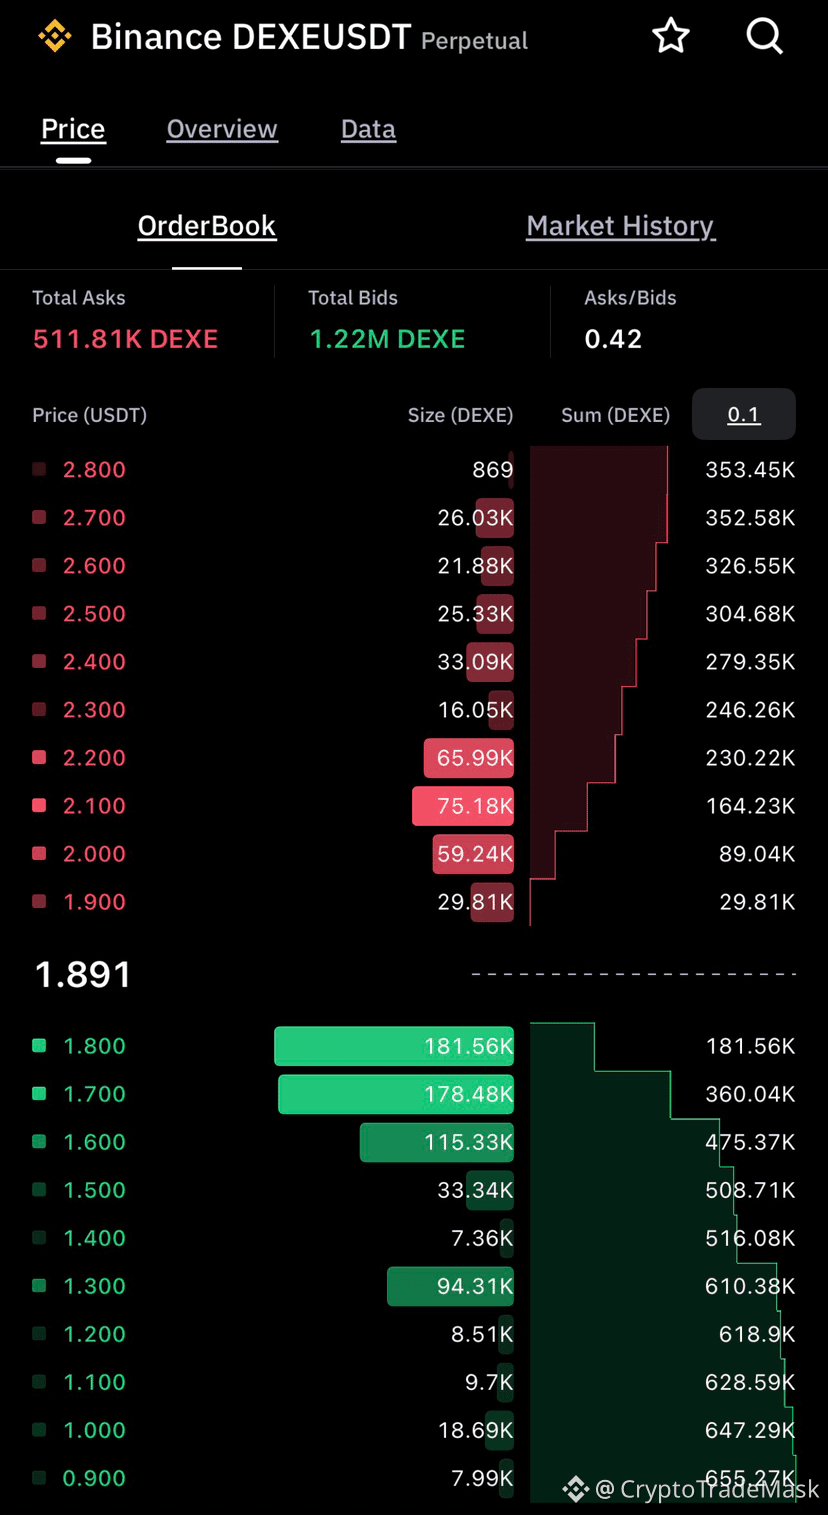
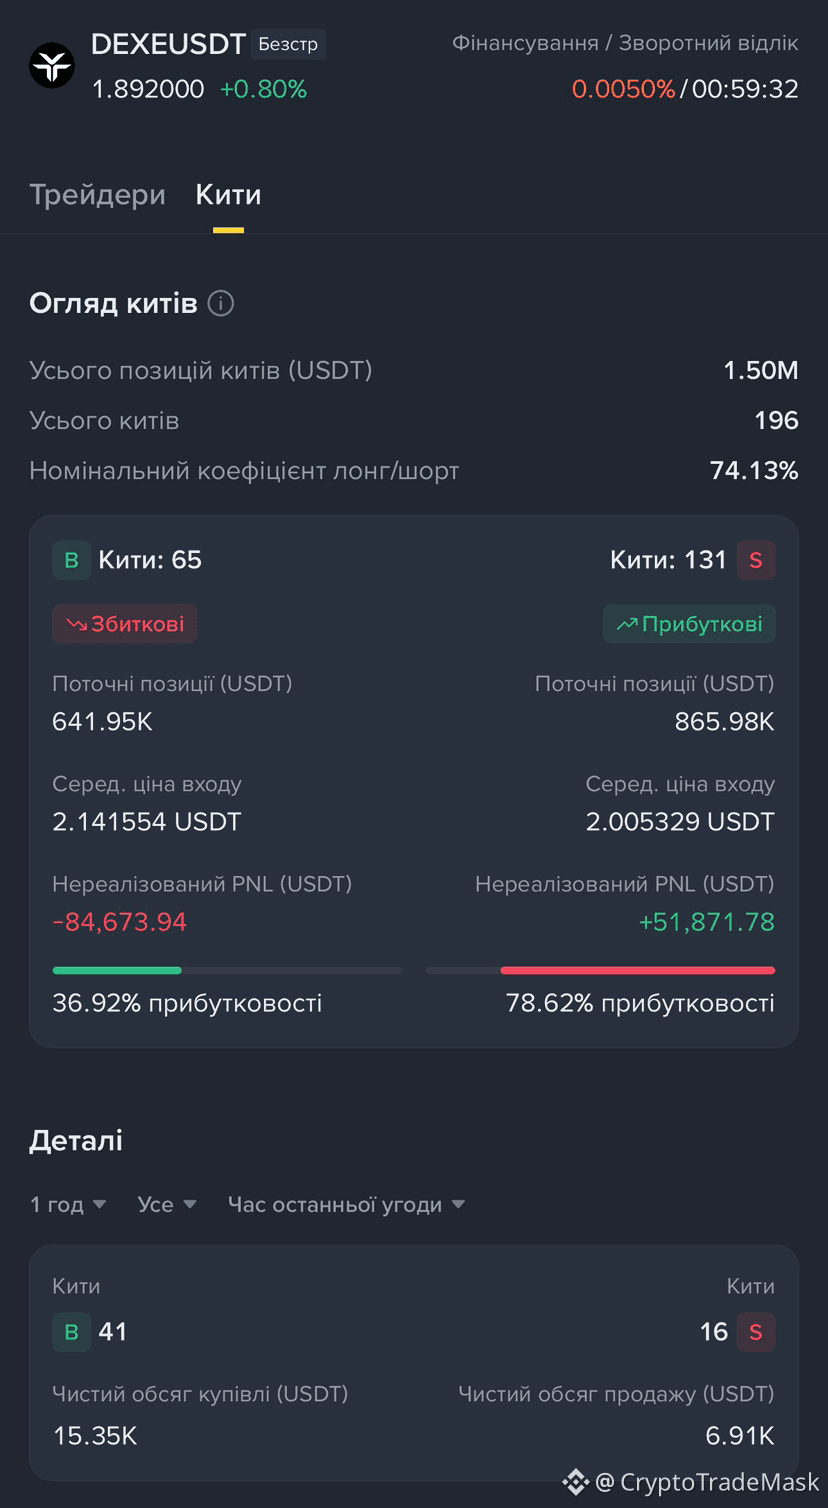
🚀 $DEXE /USDT: Order Book and Whale Position Analysis
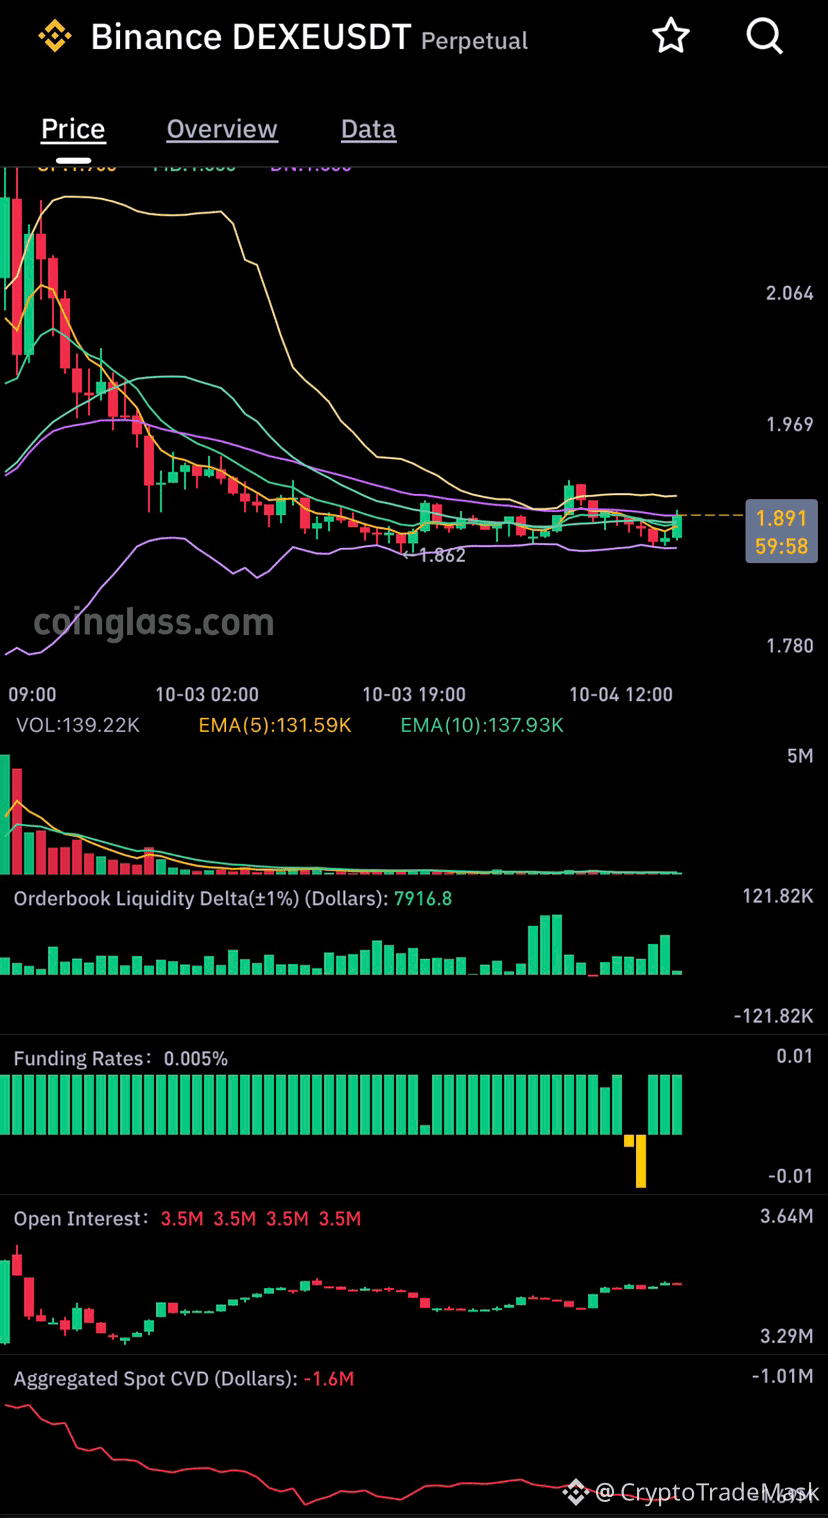
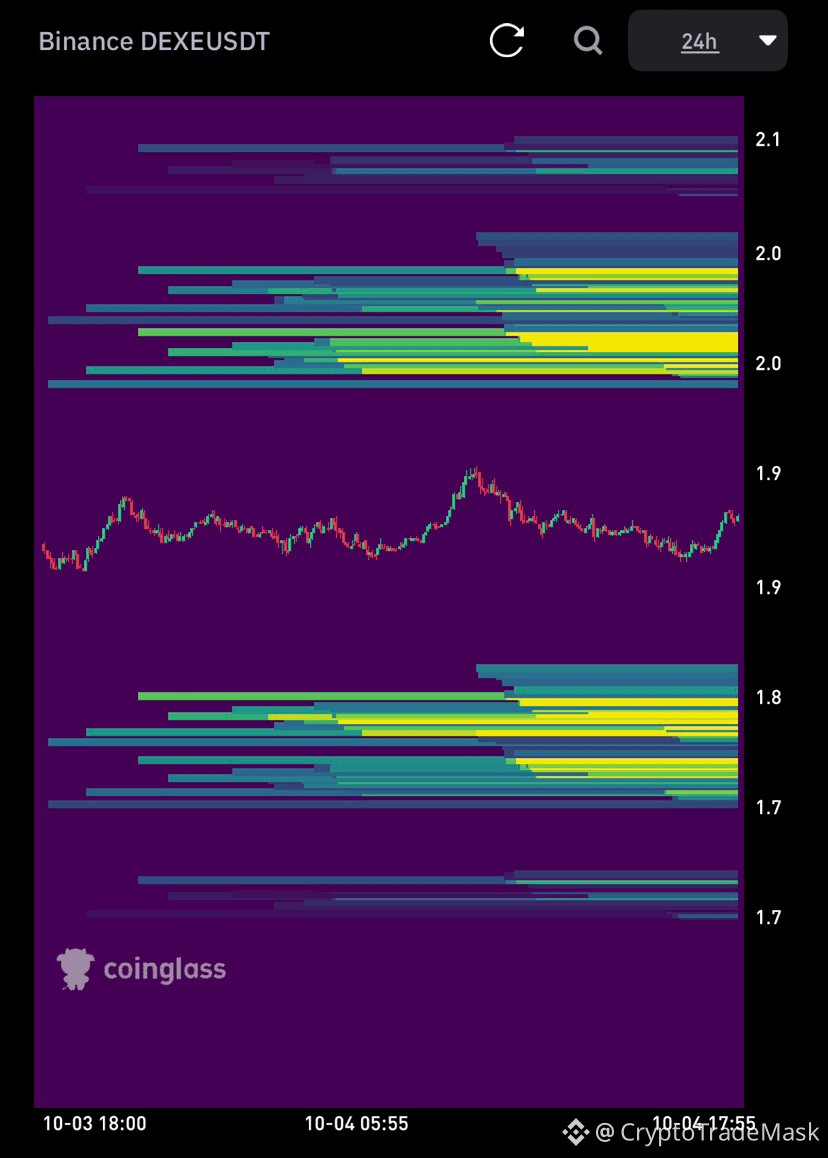
DEXE is trading within a tight range of $1.80 -$2.00. Analysis of liquidity and the actions of major players indicates clear boundaries for this sideways movement:
📊 What the metrics show:
Support: A strong buyer zone has formed on the heatmap in the $1.75 - $1.80 range.
Resistance: Over 130 whales hold short positions with an average entry price of ~$2.005 (78% in profit), creating a powerful sell wall at the $1.98 – $2.05 level.
Delta & OI: Spot CVD remains negative, while Open Interest has stabilized (~3.64M) - the market is awaiting momentum.
🚦 Trading Scenarios:
🟢 LONG (from the lower boundary):
Entry: $1.800 - $1.820
Take-profits: $1.890 / $1.970
Stop-loss: $1.745
🔴 SHORT (from the resistance zone):
Entry: $1.970 - $2.000
Take-profits: $1.890 / $1.810
Stop-loss: $2.055
⚠️ Priority: Trade the range boundaries while strictly adhering to risk management.
{future}(DEXEUSDT)
🚀 $DEXE /USDT: Order Book and Whale Position Analysis
DEXE is trading within a tight range of $1.80 -$2.00. Analysis of liquidity and the actions of major players indicates clear boundaries for this sideways movement:
📊 What the metrics show:
Support: A strong buyer zone has formed on the heatmap in the $1.75 - $1.80 range.
Resistance: Over 130 whales hold short positions with an average entry price of ~$2.005 (78% in profit), creating a powerful sell wall at the $1.98 – $2.05 level.
Delta & OI: Spot CVD remains negative, while Open Interest has stabilized (~3.64M) - the market is awaiting momentum.
🚦 Trading Scenarios:
🟢 LONG (from the lower boundary):
Entry: $1.800 - $1.820
Take-profits: $1.890 / $1.970
Stop-loss: $1.745
🔴 SHORT (from the resistance zone):
Entry: $1.970 - $2.000
Take-profits: $1.890 / $1.810
Stop-loss: $2.055
⚠️ Priority: Trade the range boundaries while strictly adhering to risk management.
DEXE is trading within a tight range of $1.80 -$2.00. Analysis of liquidity and the actions of major players indicates clear boundaries for this sideways movement:
📊 What the metrics show:
Support: A strong buyer zone has formed on the heatmap in the $1.75 - $1.80 range.
Resistance: Over 130 whales hold short positions with an average entry price of ~$2.005 (78% in profit), creating a powerful sell wall at the $1.98 – $2.05 level.
Delta & OI: Spot CVD remains negative, while Open Interest has stabilized (~3.64M) - the market is awaiting momentum.
🚦 Trading Scenarios:
🟢 LONG (from the lower boundary):
Entry: $1.800 - $1.820
Take-profits: $1.890 / $1.970
Stop-loss: $1.745
🔴 SHORT (from the resistance zone):
Entry: $1.970 - $2.000
Take-profits: $1.890 / $1.810
Stop-loss: $2.055
⚠️ Priority: Trade the range boundaries while strictly adhering to risk management.
37
#hacks
🚨 September saw a record number of crypto hacks: losses surged by 462%
According to security firm PeckShieldAlert, there were 55 major breaches in September, with total losses reaching a staggering $766.49 million—a 462% increase compared to August ($136.3 million).
🔍 Key incidents of the month and top YTD offenders:
• Bitget: ~$387 million — a new record high for losses this year.
• Liquid Network: ~$320 million ($285 million of which was recovered).
• MEV bot front-run: $7.81 million (fully recovered).
• Duelbits: $7 million.
• Payment Processor V2: $6.6 million ($3.4 million recovered).
• DCENT Wallet: $6.57 million.
• Astroport: $4.9 million.
• Drop: $4.4 million.
• Near Intents: $3.865 million — according to ZachXBT, a hot wallet on BSC experienced anomalous outflows. Funds were withdrawn via KuCoin and converted to BTC; the attacker's address is linked to the North Korean group Lazarus Group.
• NostraFinance: $3.5 million.
• Nomic nBTC Bridge: $3.15 million.
⚠️ Conclusion: While on-chain detectives and protocols manage to recover some funds, hacker activity—particularly by state-sponsored groups like Lazarus—has reached critical levels.
#hacks
🚨 September saw a record number of crypto hacks: losses surged by 462%
According to security firm PeckShieldAlert, there were 55 major breaches in September, with total losses reaching a staggering $766.49 million—a 462% increase compared to August ($136.3 million).
🔍 Key incidents of the month and top YTD offenders:
• Bitget: ~$387 million — a new record high for losses this year.
• Liquid Network: ~$320 million ($285 million of which was recovered).
• MEV bot front-run: $7.81 million (fully recovered).
• Duelbits: $7 million.
• Payment Processor V2: $6.6 million ($3.4 million recovered).
• DCENT Wallet: $6.57 million.
• Astroport: $4.9 million.
• Drop: $4.4 million.
• Near Intents: $3.865 million — according to ZachXBT, a hot wallet on BSC experienced anomalous outflows. Funds were withdrawn via KuCoin and converted to BTC; the attacker's address is linked to the North Korean group Lazarus Group.
• NostraFinance: $3.5 million.
• Nomic nBTC Bridge: $3.15 million.
⚠️ Conclusion: While on-chain detectives and protocols manage to recover some funds, hacker activity—particularly by state-sponsored groups like Lazarus—has reached critical levels.
🚨 September saw a record number of crypto hacks: losses surged by 462%
According to security firm PeckShieldAlert, there were 55 major breaches in September, with total losses reaching a staggering $766.49 million—a 462% increase compared to August ($136.3 million).
🔍 Key incidents of the month and top YTD offenders:
• Bitget: ~$387 million — a new record high for losses this year.
• Liquid Network: ~$320 million ($285 million of which was recovered).
• MEV bot front-run: $7.81 million (fully recovered).
• Duelbits: $7 million.
• Payment Processor V2: $6.6 million ($3.4 million recovered).
• DCENT Wallet: $6.57 million.
• Astroport: $4.9 million.
• Drop: $4.4 million.
• Near Intents: $3.865 million — according to ZachXBT, a hot wallet on BSC experienced anomalous outflows. Funds were withdrawn via KuCoin and converted to BTC; the attacker's address is linked to the North Korean group Lazarus Group.
• NostraFinance: $3.5 million.
• Nomic nBTC Bridge: $3.15 million.
⚠️ Conclusion: While on-chain detectives and protocols manage to recover some funds, hacker activity—particularly by state-sponsored groups like Lazarus—has reached critical levels.

29
#Ripple
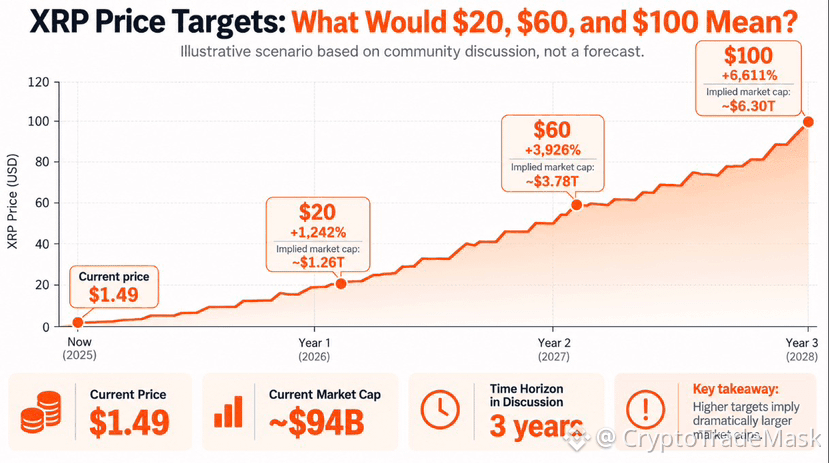
🚀 $100 for $XRP in 3 years: a realistic scenario or financial utopianism?
Analyst and developer Vincent Van Code has reignited the debate around XRP, claiming the token could hit the $100+ mark within the next three years.
His main argument: the market doesn't price in long-term prospects instantly. Investor confidence grows gradually, so $XRP will likely follow a "saw-tooth" trend-much like Bitcoin and Ethereum did back when no one yet believed in their success.
📊 What does this mean in terms of numbers?
XRP is currently trading around $1.49 with a market cap of ~$94 billion (based on a circulating supply of ~63 billion XRP).
• XRP at $20 ➡️ market cap of ~$1.26 trillion (on par with current Bitcoin or top tech giants).
• XRP at $100 ➡️ market cap of ~$6.3 trillion.
This would make XRP one of the world's largest financial assets, surpassing the combined market capitalization of many global giants.
🧠 Two opposing market philosophies:
1️⃣ The critics' stance (including former Ripple CTO David Schwartz): If institutional investors truly saw a realistic path to such scale, the market would have priced it in already, and XRP wouldn't be trading below $2.
2️⃣ Vincent Van Code's stance: Conviction and adoption build in waves. Building liquidity and institutional trust is a gradual process, not an overnight surge.
🎯 Alternative analyst targets:
A more conservative-yet still bullish-scenario from Ali Martinez points to $60; however, for this rally to kick off, XRP must first decisively close a monthly candle above the historical resistance level of $3.66.
{future}(XRPUSDT)
#Ripple
🚀 $100 for $XRP in 3 years: a realistic scenario or financial utopianism?
Analyst and developer Vincent Van Code has reignited the debate around XRP, claiming the token could hit the $100+ mark within the next three years.
His main argument: the market doesn't price in long-term prospects instantly. Investor confidence grows gradually, so $XRP will likely follow a "saw-tooth" trend-much like Bitcoin and Ethereum did back when no one yet believed in their success.
📊 What does this mean in terms of numbers?
XRP is currently trading around $1.49 with a market cap of ~$94 billion (based on a circulating supply of ~63 billion XRP).
• XRP at $20 ➡️ market cap of ~$1.26 trillion (on par with current Bitcoin or top tech giants).
• XRP at $100 ➡️ market cap of ~$6.3 trillion.
This would make XRP one of the world's largest financial assets, surpassing the combined market capitalization of many global giants.
🧠 Two opposing market philosophies:
1️⃣ The critics' stance (including former Ripple CTO David Schwartz): If institutional investors truly saw a realistic path to such scale, the market would have priced it in already, and XRP wouldn't be trading below $2.
2️⃣ Vincent Van Code's stance: Conviction and adoption build in waves. Building liquidity and institutional trust is a gradual process, not an overnight surge.
🎯 Alternative analyst targets:
A more conservative-yet still bullish-scenario from Ali Martinez points to $60; however, for this rally to kick off, XRP must first decisively close a monthly candle above the historical resistance level of $3.66.
🚀 $100 for $XRP in 3 years: a realistic scenario or financial utopianism?
Analyst and developer Vincent Van Code has reignited the debate around XRP, claiming the token could hit the $100+ mark within the next three years.
His main argument: the market doesn't price in long-term prospects instantly. Investor confidence grows gradually, so $XRP will likely follow a "saw-tooth" trend-much like Bitcoin and Ethereum did back when no one yet believed in their success.
📊 What does this mean in terms of numbers?
XRP is currently trading around $1.49 with a market cap of ~$94 billion (based on a circulating supply of ~63 billion XRP).
• XRP at $20 ➡️ market cap of ~$1.26 trillion (on par with current Bitcoin or top tech giants).
• XRP at $100 ➡️ market cap of ~$6.3 trillion.
This would make XRP one of the world's largest financial assets, surpassing the combined market capitalization of many global giants.
🧠 Two opposing market philosophies:
1️⃣ The critics' stance (including former Ripple CTO David Schwartz): If institutional investors truly saw a realistic path to such scale, the market would have priced it in already, and XRP wouldn't be trading below $2.
2️⃣ Vincent Van Code's stance: Conviction and adoption build in waves. Building liquidity and institutional trust is a gradual process, not an overnight surge.
🎯 Alternative analyst targets:
A more conservative-yet still bullish-scenario from Ali Martinez points to $60; however, for this rally to kick off, XRP must first decisively close a monthly candle above the historical resistance level of $3.66.
46
#Clrcle
🚀 Circle ($CRCL ): The Institutional Bridge Between Wall Street and Web3
While the market discusses the latest altcoin surges, one of the most interesting assets at the intersection of TradFi and DeFi is quietly strengthening its position. We are talking about Circle Internet Group (NYSE / RWA: CRCL)—the company behind USDC, the world's second-largest stablecoin.
Why is CRCL attracting increasing attention from analysts and institutional investors? Here are the key points and metrics:
📊 Why is Circle a fundamental play?
1. Transparency and Regulation: Unlike offshore competitors, Circle prioritizes full regulatory compliance (US laws, European MiCA). This makes USDC the top choice for banks and corporations.
2. Cash-Generating Business Model: Circle earns interest on the reserves backing USDC (short-term US Treasury bonds and cash deposits).
3. Ecosystem Integration: Through protocols like CCTP (Cross-Chain Transfer Protocol) and direct partnerships with banking providers, Circle is gradually becoming a foundational payment rail for global transfers.
📊 Current Status and Figures
Asset Format: On traditional markets, it exists as company stock; in the DeFi space, as tokenized shares (Real World Assets / RWA).
Market Valuation: ~$22 billion (shares trading in the $80–$83 range).
Key Driver: Growth in USDC market capitalization and the onboarding of banking clients.
⚠️ What to consider before buying?
Sensitivity to Fed rates: A loosening of monetary policy and lower interest rates in the US reduce bond yields, directly impacting the company's net income.
Banking competition: Major financial giants are developing their own settlement coins and banking solutions for instant payments.
‼️ Verdict
$CRCL is neither a speculative memecoin nor a high-risk DEX token; rather, it represents a fundamental bet on the institutional adoption of cryptocurrency. For those seeking exposure to the crypto market through a classic business model with real revenue, this asset is definitely worth a spot on your watchlist.
{future}(CRCLUSDT)
#Clrcle
🚀 Circle ($CRCL ): The Institutional Bridge Between Wall Street and Web3
While the market discusses the latest altcoin surges, one of the most interesting assets at the intersection of TradFi and DeFi is quietly strengthening its position. We are talking about Circle Internet Group (NYSE / RWA: CRCL)—the company behind USDC, the world's second-largest stablecoin.
Why is CRCL attracting increasing attention from analysts and institutional investors? Here are the key points and metrics:
📊 Why is Circle a fundamental play?
1. Transparency and Regulation: Unlike offshore competitors, Circle prioritizes full regulatory compliance (US laws, European MiCA). This makes USDC the top choice for banks and corporations.
2. Cash-Generating Business Model: Circle earns interest on the reserves backing USDC (short-term US Treasury bonds and cash deposits).
3. Ecosystem Integration: Through protocols like CCTP (Cross-Chain Transfer Protocol) and direct partnerships with banking providers, Circle is gradually becoming a foundational payment rail for global transfers.
📊 Current Status and Figures
Asset Format: On traditional markets, it exists as company stock; in the DeFi space, as tokenized shares (Real World Assets / RWA).
Market Valuation: ~$22 billion (shares trading in the $80–$83 range).
Key Driver: Growth in USDC market capitalization and the onboarding of banking clients.
⚠️ What to consider before buying?
Sensitivity to Fed rates: A loosening of monetary policy and lower interest rates in the US reduce bond yields, directly impacting the company's net income.
Banking competition: Major financial giants are developing their own settlement coins and banking solutions for instant payments.
‼️ Verdict
$CRCL is neither a speculative memecoin nor a high-risk DEX token; rather, it represents a fundamental bet on the institutional adoption of cryptocurrency. For those seeking exposure to the crypto market through a classic business model with real revenue, this asset is definitely worth a spot on your watchlist.
🚀 Circle ($CRCL ): The Institutional Bridge Between Wall Street and Web3
While the market discusses the latest altcoin surges, one of the most interesting assets at the intersection of TradFi and DeFi is quietly strengthening its position. We are talking about Circle Internet Group (NYSE / RWA: CRCL)—the company behind USDC, the world's second-largest stablecoin.
Why is CRCL attracting increasing attention from analysts and institutional investors? Here are the key points and metrics:
📊 Why is Circle a fundamental play?
1. Transparency and Regulation: Unlike offshore competitors, Circle prioritizes full regulatory compliance (US laws, European MiCA). This makes USDC the top choice for banks and corporations.
2. Cash-Generating Business Model: Circle earns interest on the reserves backing USDC (short-term US Treasury bonds and cash deposits).
3. Ecosystem Integration: Through protocols like CCTP (Cross-Chain Transfer Protocol) and direct partnerships with banking providers, Circle is gradually becoming a foundational payment rail for global transfers.
📊 Current Status and Figures
Asset Format: On traditional markets, it exists as company stock; in the DeFi space, as tokenized shares (Real World Assets / RWA).
Market Valuation: ~$22 billion (shares trading in the $80–$83 range).
Key Driver: Growth in USDC market capitalization and the onboarding of banking clients.
⚠️ What to consider before buying?
Sensitivity to Fed rates: A loosening of monetary policy and lower interest rates in the US reduce bond yields, directly impacting the company's net income.
Banking competition: Major financial giants are developing their own settlement coins and banking solutions for instant payments.
‼️ Verdict
$CRCL is neither a speculative memecoin nor a high-risk DEX token; rather, it represents a fundamental bet on the institutional adoption of cryptocurrency. For those seeking exposure to the crypto market through a classic business model with real revenue, this asset is definitely worth a spot on your watchlist.
467

Article
October storm or calm? The macroeconomic calendar and crypto events of the week (October 5–11)The first full week of October sets up the cryptocurrency market for a test of endurance. After a dynamic start to the autumn, traders and investors closely watch the signal flags coming from the United States: from the state of the services sector to internal risks associated with large token unlocks.
October storm or calm? The macroeconomic calendar and crypto events of the week (October 5–11)
The first full week of October sets up the cryptocurrency market for a test of endurance. After a dynamic start to the autumn, traders and investors closely watch the signal flags coming from the United States: from the state of the services sector to internal risks associated with large token unlocks.
87
#CryptoMarkets
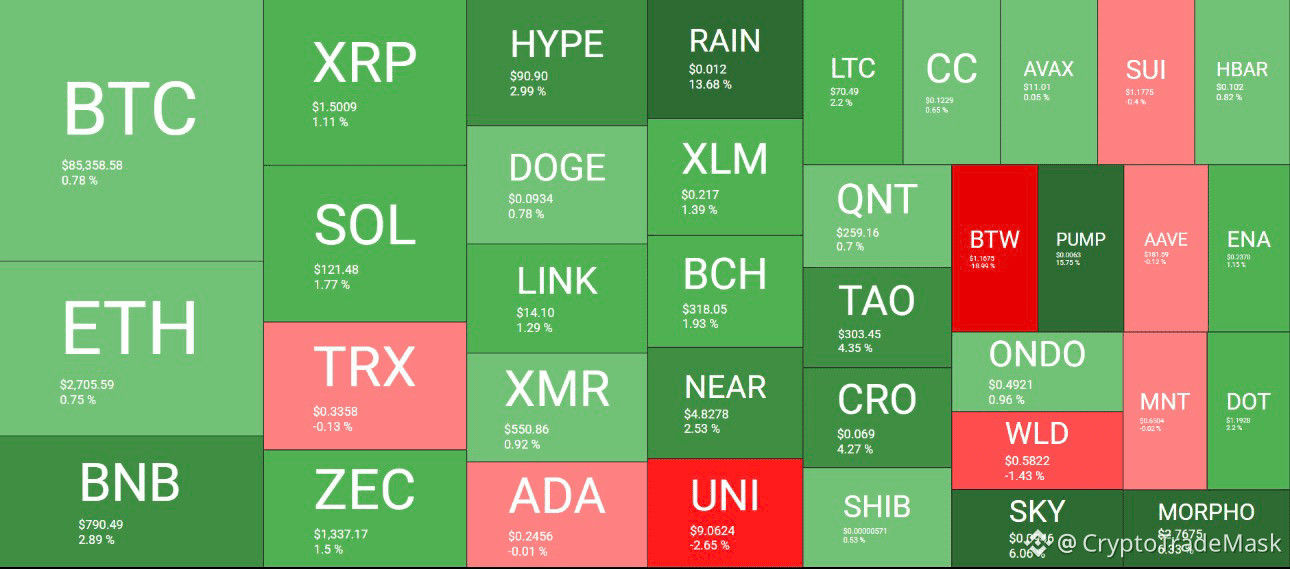
🚀 #pump surges (+16%) and Bitcoin returns to $85K: weekend recap
After a volatile and exhausting week, the crypto market has shifted into recovery mode. Over the last 24 hours, total market capitalization added approximately $30 billion, reaching $2.91 trillion.
🔑 Weekend highlights:
➡️ Bitcoin (BTC) back above $85,000:
After sharp turbulence on Friday triggered by a weak US labor market report (BTC initially spiked above $87,000 before dropping sharply below $84,000), the bulls regained control. The price is currently holding above $85,000 again.
• BTC market cap: $1.71 trillion
• BTC dominance: 59%
➡️ Altcoins in the green:
#ETH : testing resistance near $2,700
#xrp : heading toward $1.50 (+1.1%)
#bnb : approaching $800 (+2.9%)
Positive momentum is also seen in $HYPE (+3%, >$90), CRO, $NEAR , and $TAO (up to +4.5%).
Top gainers of the day:
• PUMP: +16% (to $0.0063)
• RAIN: +14%
Significant gains are also being shown by ZRO and AERO.
📈 The market is demonstrating resilience following a work week packed with macroeconomic data (PCE and NFP).
{future}(TAOUSDT)
{future}(NEARUSDT)
{future}(HYPEUSDT)
#CryptoMarkets
🚀 #pump surges (+16%) and Bitcoin returns to $85K: weekend recap
After a volatile and exhausting week, the crypto market has shifted into recovery mode. Over the last 24 hours, total market capitalization added approximately $30 billion, reaching $2.91 trillion.
🔑 Weekend highlights:
➡️ Bitcoin (BTC) back above $85,000:
After sharp turbulence on Friday triggered by a weak US labor market report (BTC initially spiked above $87,000 before dropping sharply below $84,000), the bulls regained control. The price is currently holding above $85,000 again.
• BTC market cap: $1.71 trillion
• BTC dominance: 59%
➡️ Altcoins in the green:
#ETH : testing resistance near $2,700
#xrp : heading toward $1.50 (+1.1%)
#bnb : approaching $800 (+2.9%)
Positive momentum is also seen in $HYPE (+3%, >$90), CRO, $NEAR , and $TAO (up to +4.5%).
Top gainers of the day:
• PUMP: +16% (to $0.0063)
• RAIN: +14%
Significant gains are also being shown by ZRO and AERO.
📈 The market is demonstrating resilience following a work week packed with macroeconomic data (PCE and NFP).
🚀 #pump surges (+16%) and Bitcoin returns to $85K: weekend recap
After a volatile and exhausting week, the crypto market has shifted into recovery mode. Over the last 24 hours, total market capitalization added approximately $30 billion, reaching $2.91 trillion.
🔑 Weekend highlights:
➡️ Bitcoin (BTC) back above $85,000:
After sharp turbulence on Friday triggered by a weak US labor market report (BTC initially spiked above $87,000 before dropping sharply below $84,000), the bulls regained control. The price is currently holding above $85,000 again.
• BTC market cap: $1.71 trillion
• BTC dominance: 59%
➡️ Altcoins in the green:
#ETH : testing resistance near $2,700
#xrp : heading toward $1.50 (+1.1%)
#bnb : approaching $800 (+2.9%)
Positive momentum is also seen in $HYPE (+3%, >$90), CRO, $NEAR , and $TAO (up to +4.5%).
Top gainers of the day:
• PUMP: +16% (to $0.0063)
• RAIN: +14%
Significant gains are also being shown by ZRO and AERO.
📈 The market is demonstrating resilience following a work week packed with macroeconomic data (PCE and NFP).
23
Partly True
#concrete
🚀 Key Developments for the Concrete $CT Token: A Detailed Breakdown
The Concrete project team has announced major news that will shape the future of the CT token. Here is a summary of the key points and an analysis of what this means for the market.
➡️ CT Tokenomics Update (Effective September 2, 2026)
What happened: An updated document has been released, formalizing the link between the Concrete ecosystem and the CT token.
Allocation details:
35% — Ecosystem
28% — Community
22% — Investors
15% — Foundation
Impact: Transparent allocation reduces fears of market manipulation, while the focus on the community and ecosystem encourages long-term holding (HODL).
➡️ Launch on Binance Alpha (Effective September 30, 2026)
What happened: The CT Token Generation Event (TGE) coincides with a launch on Binance Alpha at 08:00 UTC. Simultaneously, Coinbase has added the token to its listing roadmap.
Impact: Launching on Binance Alpha ensures an immediate influx of liquidity and attracts significant trader attention. Anticipation of a potential full listing on Coinbase creates an additional positive FOMO effect.
➡️ CT/USDT trading launch on OKX (starting September 30, 2026)
What happened: OKX has opened spot trading for the CT/USDT pair with a phased rollout of trading and withdrawals (deposits opened at 04:00 UTC; trading began at 10:00 UTC).
Impact: Listing on another top-tier exchange significantly expands the token's accessibility to international investors and reduces the spread.
⚠️ Summary:
The CT token from Concrete is off to a strong start. Simultaneous support from major exchange giants, $1.2 billion in raised funds, and robust tokenomics make this project one of the most exciting releases of the autumn.
{future}(CTUSDT)
#concrete
🚀 Key Developments for the Concrete $CT Token: A Detailed Breakdown
The Concrete project team has announced major news that will shape the future of the CT token. Here is a summary of the key points and an analysis of what this means for the market.
➡️ CT Tokenomics Update (Effective September 2, 2026)
What happened: An updated document has been released, formalizing the link between the Concrete ecosystem and the CT token.
Allocation details:
35% — Ecosystem
28% — Community
22% — Investors
15% — Foundation
Impact: Transparent allocation reduces fears of market manipulation, while the focus on the community and ecosystem encourages long-term holding (HODL).
➡️ Launch on Binance Alpha (Effective September 30, 2026)
What happened: The CT Token Generation Event (TGE) coincides with a launch on Binance Alpha at 08:00 UTC. Simultaneously, Coinbase has added the token to its listing roadmap.
Impact: Launching on Binance Alpha ensures an immediate influx of liquidity and attracts significant trader attention. Anticipation of a potential full listing on Coinbase creates an additional positive FOMO effect.
➡️ CT/USDT trading launch on OKX (starting September 30, 2026)
What happened: OKX has opened spot trading for the CT/USDT pair with a phased rollout of trading and withdrawals (deposits opened at 04:00 UTC; trading began at 10:00 UTC).
Impact: Listing on another top-tier exchange significantly expands the token's accessibility to international investors and reduces the spread.
⚠️ Summary:
The CT token from Concrete is off to a strong start. Simultaneous support from major exchange giants, $1.2 billion in raised funds, and robust tokenomics make this project one of the most exciting releases of the autumn.
🚀 Key Developments for the Concrete $CT Token: A Detailed Breakdown
The Concrete project team has announced major news that will shape the future of the CT token. Here is a summary of the key points and an analysis of what this means for the market.
➡️ CT Tokenomics Update (Effective September 2, 2026)
What happened: An updated document has been released, formalizing the link between the Concrete ecosystem and the CT token.
Allocation details:
35% — Ecosystem
28% — Community
22% — Investors
15% — Foundation
Impact: Transparent allocation reduces fears of market manipulation, while the focus on the community and ecosystem encourages long-term holding (HODL).
➡️ Launch on Binance Alpha (Effective September 30, 2026)
What happened: The CT Token Generation Event (TGE) coincides with a launch on Binance Alpha at 08:00 UTC. Simultaneously, Coinbase has added the token to its listing roadmap.
Impact: Launching on Binance Alpha ensures an immediate influx of liquidity and attracts significant trader attention. Anticipation of a potential full listing on Coinbase creates an additional positive FOMO effect.
➡️ CT/USDT trading launch on OKX (starting September 30, 2026)
What happened: OKX has opened spot trading for the CT/USDT pair with a phased rollout of trading and withdrawals (deposits opened at 04:00 UTC; trading began at 10:00 UTC).
Impact: Listing on another top-tier exchange significantly expands the token's accessibility to international investors and reduces the spread.
⚠️ Summary:
The CT token from Concrete is off to a strong start. Simultaneous support from major exchange giants, $1.2 billion in raised funds, and robust tokenomics make this project one of the most exciting releases of the autumn.
3
1
584
#Fidelity
🚀 Bitcoin at $300,000 by 2029: A breakdown of the forecast by a Fidelity analyst
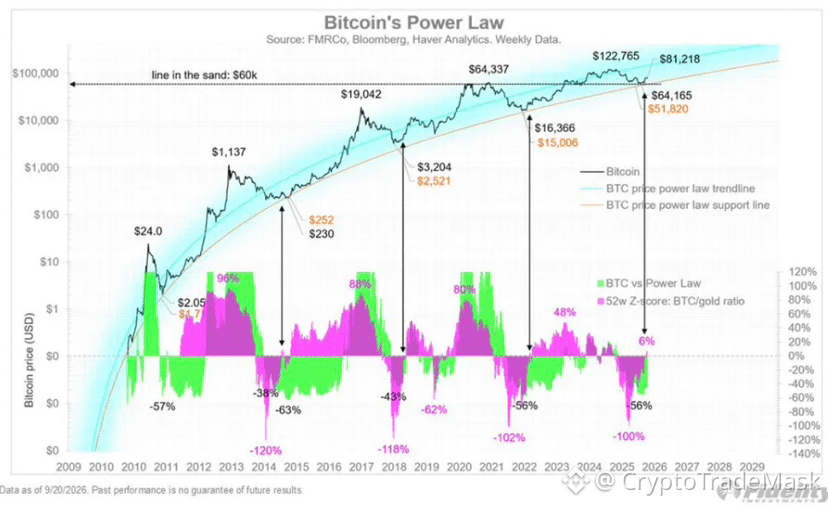
Jurrien Timmer, Director of Global Macro at Fidelity, has published an updated forecast for Bitcoin. He believes that holding key price levels signals the start of a new bull cycle, with a target of $300,000 by 2029.
Given the current $BTC price (around $85,000), this target implies a potential increase of approximately 3.5 times (+253%).
🔑 What is the analysis based on?
1. Power-Law Model:
Timmer relies on a logarithmic model of BTC's long-term growth. The model shows that after the price held fundamental support around the $60,000 level (with a local low recorded at $64,165), Bitcoin is returning to its upward trend.
2. Relative strength indicator against gold:
The Bitcoin/Gold ratio (52-week Z-score) has moved into positive territory (recovering from -100% to +6%). This confirms that BTC is once again outperforming gold in terms of price dynamics.
⚠️ What should be kept in mind?
➡️ This is an analytical model, not an official company forecast: Timmer is outlining a mathematical trajectory based on past cycles rather than providing a guarantee from Fidelity Investments.
➡️ The $60,000 level is critical: According to the analyst, only by holding this zone can the bullish scenario remain viable; a sustained drop below it would break the model.
➡️ The math requires real demand: While charts indicate potential, reaching $300k requires steady capital inflows (particularly via spot Bitcoin ETFs) and further global adoption of the asset.
🎯 Bottom line:
Timmer’s forecast is not a guarantee of "easy gains," but rather a mathematical benchmark for long-term investors. Key triggers to watch right now include: maintaining the $60k support level, performance relative to gold, and ETF inflow volumes.
{future}(BTCUSDT)
#Fidelity
🚀 Bitcoin at $300,000 by 2029: A breakdown of the forecast by a Fidelity analyst
Jurrien Timmer, Director of Global Macro at Fidelity, has published an updated forecast for Bitcoin. He believes that holding key price levels signals the start of a new bull cycle, with a target of $300,000 by 2029.
Given the current $BTC price (around $85,000), this target implies a potential increase of approximately 3.5 times (+253%).
🔑 What is the analysis based on?
1. Power-Law Model:
Timmer relies on a logarithmic model of BTC's long-term growth. The model shows that after the price held fundamental support around the $60,000 level (with a local low recorded at $64,165), Bitcoin is returning to its upward trend.
2. Relative strength indicator against gold:
The Bitcoin/Gold ratio (52-week Z-score) has moved into positive territory (recovering from -100% to +6%). This confirms that BTC is once again outperforming gold in terms of price dynamics.
⚠️ What should be kept in mind?
➡️ This is an analytical model, not an official company forecast: Timmer is outlining a mathematical trajectory based on past cycles rather than providing a guarantee from Fidelity Investments.
➡️ The $60,000 level is critical: According to the analyst, only by holding this zone can the bullish scenario remain viable; a sustained drop below it would break the model.
➡️ The math requires real demand: While charts indicate potential, reaching $300k requires steady capital inflows (particularly via spot Bitcoin ETFs) and further global adoption of the asset.
🎯 Bottom line:
Timmer’s forecast is not a guarantee of "easy gains," but rather a mathematical benchmark for long-term investors. Key triggers to watch right now include: maintaining the $60k support level, performance relative to gold, and ETF inflow volumes.
🚀 Bitcoin at $300,000 by 2029: A breakdown of the forecast by a Fidelity analyst
Jurrien Timmer, Director of Global Macro at Fidelity, has published an updated forecast for Bitcoin. He believes that holding key price levels signals the start of a new bull cycle, with a target of $300,000 by 2029.
Given the current $BTC price (around $85,000), this target implies a potential increase of approximately 3.5 times (+253%).
🔑 What is the analysis based on?
1. Power-Law Model:
Timmer relies on a logarithmic model of BTC's long-term growth. The model shows that after the price held fundamental support around the $60,000 level (with a local low recorded at $64,165), Bitcoin is returning to its upward trend.
2. Relative strength indicator against gold:
The Bitcoin/Gold ratio (52-week Z-score) has moved into positive territory (recovering from -100% to +6%). This confirms that BTC is once again outperforming gold in terms of price dynamics.
⚠️ What should be kept in mind?
➡️ This is an analytical model, not an official company forecast: Timmer is outlining a mathematical trajectory based on past cycles rather than providing a guarantee from Fidelity Investments.
➡️ The $60,000 level is critical: According to the analyst, only by holding this zone can the bullish scenario remain viable; a sustained drop below it would break the model.
➡️ The math requires real demand: While charts indicate potential, reaching $300k requires steady capital inflows (particularly via spot Bitcoin ETFs) and further global adoption of the asset.
🎯 Bottom line:
Timmer’s forecast is not a guarantee of "easy gains," but rather a mathematical benchmark for long-term investors. Key triggers to watch right now include: maintaining the $60k support level, performance relative to gold, and ETF inflow volumes.
27
Article
🚀 Stablecoins don’t take dollars out of banks, but make loans more expensive: How it works?Most critics of stablecoins believe that cryptocurrency simply «sucks out» trillions of dollars from the traditional banking system. But if you dig into the mechanics, the money doesn’t disappear—it just changes its «address» and owner.
‼️ So why do traditional bankers keep sounding the alarm? 🧐
🚀 Stablecoins don’t take dollars out of banks, but make loans more expensive: How it works?
Most critics of stablecoins believe that cryptocurrency simply «sucks out» trillions of dollars from the traditional banking system. But if you dig into the mechanics, the money doesn’t disappear—it just changes its «address» and owner.
‼️ So why do traditional bankers keep sounding the alarm? 🧐
‼️ So why do traditional bankers keep sounding the alarm? 🧐
1
1
76
#losing ⚠️
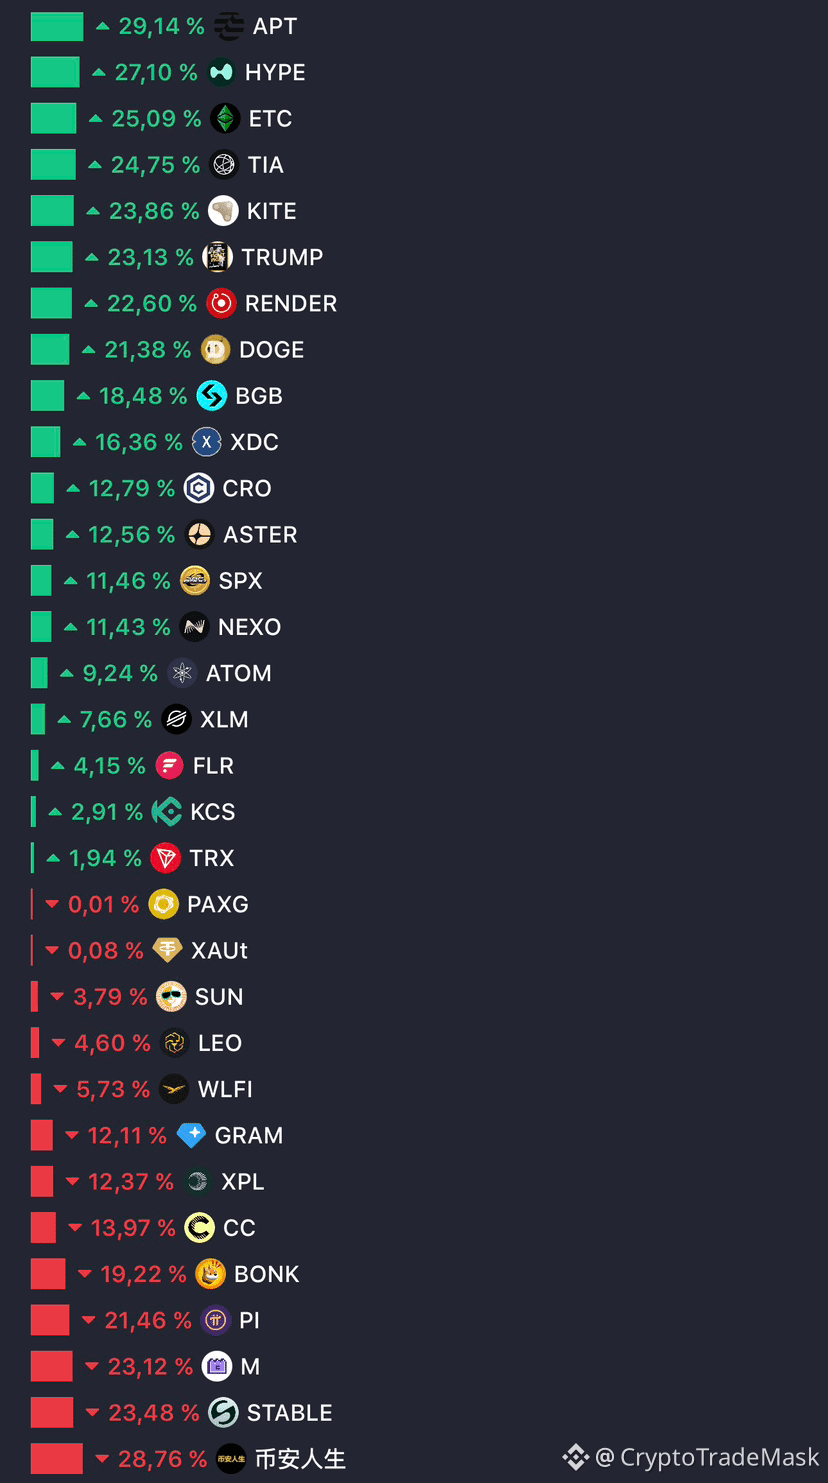
📉🔥 Top 30 Underperformers of the Last 90 Days! 🔥📉
$币安人生 $STABLE $M
The Worst Results and Drops You Can't Ignore.
Who's in the Underdogs? 👀
{future}(MUSDT)
{future}(STABLEUSDT)
{future}(币安人生USDT)
#losing ⚠️
📉🔥 Top 30 Underperformers of the Last 90 Days! 🔥📉
$币安人生 $STABLE $M
The Worst Results and Drops You Can't Ignore.
Who's in the Underdogs? 👀
📉🔥 Top 30 Underperformers of the Last 90 Days! 🔥📉
$币安人生 $STABLE $M
The Worst Results and Drops You Can't Ignore.
Who's in the Underdogs? 👀
101
#Growth 🚀
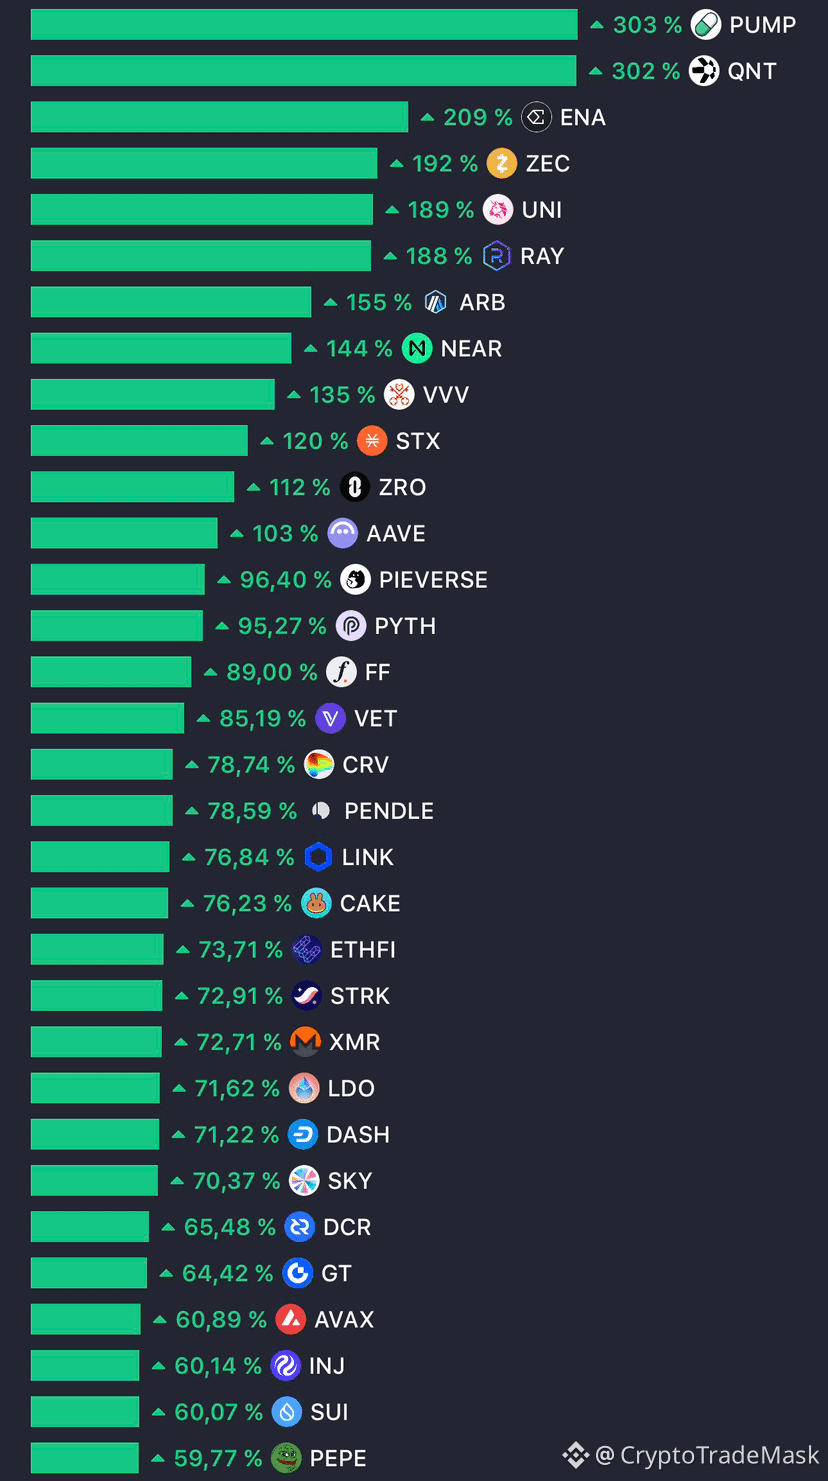
📈🔥 Top 30 indicators for the last 90 days! 🔥📈
$PUMP $QNT $ENA
Growth, dynamics and the strongest trends - all in one list.
Who's in the top? 👀
{future}(ENAUSDT)
{future}(QNTUSDT)
{future}(PUMPUSDT)
#Growth 🚀
📈🔥 Top 30 indicators for the last 90 days! 🔥📈
$PUMP $QNT $ENA
Growth, dynamics and the strongest trends - all in one list.
Who's in the top? 👀
📈🔥 Top 30 indicators for the last 90 days! 🔥📈
$PUMP $QNT $ENA
Growth, dynamics and the strongest trends - all in one list.
Who's in the top? 👀
201
Log in to explore more content
Join global crypto users on Binance Square
⚡️ Get latest and useful information about crypto.
💬 Trusted by the world’s largest crypto exchange.
👍 Discover real insights from verified creators.
Email / Phone number
Trending Topics
BinanceLaunchesBinanceIntelligence
32,252 views
398 Discussing
🚨 BINANCE JUST PUT AI DIRECTLY INSIDE THE EXCHANGE — AND THIS COULD CHANGE HOW RETAIL TRADES.
Binance has officially launched Binance Intelligence, a new AI layer built into the Binance ecosystem. It combines three products:
Binance AI for everyday users,
Binance AI Pro for automated trading workflows,
and Agent OS for developers building financial agents.
The part traders should care about?
Binance AI can surface market briefs, smart alerts, PnL recaps and personalized information, while AI Pro is designed to turn a plain-English trading idea into a visual strategy workflow.
That means the next phase of exchange competition may not be:
lowest fees vs deepest liquidity.
It could be:
who gives traders the best AI execution layer.
If Binance Intelligence actually drives heavier user activity, automated strategies and higher trading frequency, watch $BNB first.
AI adoption ↑
→ Binance engagement ↑
→ trading activity ↑
→ ecosystem narrative strengthens.
The catalyst I’d watch now:
global rollout + AI Pro launch + measurable user adoption.
Because once AI stops just telling you what the market is doing…
…and starts helping build the trade itself?
That’s when this gets much bigger than another chatbot. 👀
#binancelaunchesbinanceintelligence #EvernorthXRPTreasuryCompletesSPACMerger #ADAGains10%Above$0.27 #ETHUp70%InQ3ButLiquidityFalls #EthStakingExitQueueHits2026High
KimHotbae
·20 Likes
·24.6k views
EvernorthXRPTreasuryCompletesSPACMerger
28,878 views
270 Discussing
ADAGains10%Above$0.27
30,166 views
205 Discussing