
Peter_Parker0
19.3k Posts

Peter_Parker0
 Square Verified
Report
Block User
Crypto trader|Market sniper Spot & Futures| TA wizard | Risk-first Altcoin gems|Bullish vibes only #CryptoTrading $BTC|Twitter|Cryptocobain032 KITE:659646
Open Trade
Frequent Trader
2.7 Years
740 Following
45.8K+ Followers
49.0K+ Liked
Posts
Portfolio
All
Quotes
Videos
Live
📍 $STXB – Bullish Momentum Setup
STX is showing bullish momentum after pushing through the $0.3441 liquidation level. Buyers could maintain control if price holds above $0.3400.
Support: $0.3400
Resistance: $0.3510
🎯 Targets:
TP1: $0.3510
TP2: $0.3580
⚠️ Invalidation:
A breakdown below $0.3360 could weaken the bullish structure and trigger a correction toward $0.3280.
#HKSFCPlansToRestrictCryptoAndExchangeTerms #HKSFCPlansToRestrictCryptoAndExchangeTerms #WillAnthropicListOnTime #CPITestsDecemberRateOutlook #WillUS-IranTensionsBoostSafe-HavenDemand?
📍 $STXB – Bullish Momentum Setup
STX is showing bullish momentum after pushing through the $0.3441 liquidation level. Buyers could maintain control if price holds above $0.3400.
Support: $0.3400
Resistance: $0.3510
🎯 Targets:
TP1: $0.3510
TP2: $0.3580
⚠️ Invalidation:
A breakdown below $0.3360 could weaken the bullish structure and trigger a correction toward $0.3280.
#HKSFCPlansToRestrictCryptoAndExchangeTerms #HKSFCPlansToRestrictCryptoAndExchangeTerms #WillAnthropicListOnTime #CPITestsDecemberRateOutlook #WillUS-IranTensionsBoostSafe-HavenDemand?
STX is showing bullish momentum after pushing through the $0.3441 liquidation level. Buyers could maintain control if price holds above $0.3400.
Support: $0.3400
Resistance: $0.3510
🎯 Targets:
TP1: $0.3510
TP2: $0.3580
⚠️ Invalidation:
A breakdown below $0.3360 could weaken the bullish structure and trigger a correction toward $0.3280.
#HKSFCPlansToRestrictCryptoAndExchangeTerms #HKSFCPlansToRestrictCryptoAndExchangeTerms #WillAnthropicListOnTime #CPITestsDecemberRateOutlook #WillUS-IranTensionsBoostSafe-HavenDemand?
23
🚀 $AIOT – Bullish Breakout Structure
AIOT is showing positive momentum after pushing above the $0.11404 liquidation level. Holding above $0.1125 could keep buyers in control.
Support: $0.1125
Resistance: $0.1165
🎯 Targets:
TP1: $0.1165
TP2: $0.1190
⚠️ Invalidation:
A breakdown below $0.1105 could trigger bearish pressure, opening a correction toward $0.1075.
#CPITestsDecemberRateOutlook #WillUS-IranTensionsBoostSafe-HavenDemand? #WillAnthropicListOnTime #WillAnthropicListOnTime #WillAnthropicListOnTime
🚀 $AIOT – Bullish Breakout Structure
AIOT is showing positive momentum after pushing above the $0.11404 liquidation level. Holding above $0.1125 could keep buyers in control.
Support: $0.1125
Resistance: $0.1165
🎯 Targets:
TP1: $0.1165
TP2: $0.1190
⚠️ Invalidation:
A breakdown below $0.1105 could trigger bearish pressure, opening a correction toward $0.1075.
#CPITestsDecemberRateOutlook #WillUS-IranTensionsBoostSafe-HavenDemand? #WillAnthropicListOnTime #WillAnthropicListOnTime #WillAnthropicListOnTime
AIOT is showing positive momentum after pushing above the $0.11404 liquidation level. Holding above $0.1125 could keep buyers in control.
Support: $0.1125
Resistance: $0.1165
🎯 Targets:
TP1: $0.1165
TP2: $0.1190
⚠️ Invalidation:
A breakdown below $0.1105 could trigger bearish pressure, opening a correction toward $0.1075.
#CPITestsDecemberRateOutlook #WillUS-IranTensionsBoostSafe-HavenDemand? #WillAnthropicListOnTime #WillAnthropicListOnTime #WillAnthropicListOnTime
263
🎯 $ARIA – Bullish Continuation Setup
ARIA is attempting to maintain its bullish structure after moving through the $0.15919 level. Buyers need to defend $0.1565 to sustain upward momentum.
Support: $0.1565
Resistance: $0.1630
🎯 Targets:
TP1: $0.1630
TP2: $0.1670
⚠️ Invalidation:
A breakdown below $0.1535 could weaken the recovery structure and expose $0.1490.
#HKSFCPlansToRestrictCryptoAndExchangeTerms #TradFiForBeginners #WillAnthropicListOnTime #JobsReportRaisesHikeOdds #WillAnthropicListOnTime
🎯 $ARIA – Bullish Continuation Setup
ARIA is attempting to maintain its bullish structure after moving through the $0.15919 level. Buyers need to defend $0.1565 to sustain upward momentum.
Support: $0.1565
Resistance: $0.1630
🎯 Targets:
TP1: $0.1630
TP2: $0.1670
⚠️ Invalidation:
A breakdown below $0.1535 could weaken the recovery structure and expose $0.1490.
#HKSFCPlansToRestrictCryptoAndExchangeTerms #TradFiForBeginners #WillAnthropicListOnTime #JobsReportRaisesHikeOdds #WillAnthropicListOnTime
ARIA is attempting to maintain its bullish structure after moving through the $0.15919 level. Buyers need to defend $0.1565 to sustain upward momentum.
Support: $0.1565
Resistance: $0.1630
🎯 Targets:
TP1: $0.1630
TP2: $0.1670
⚠️ Invalidation:
A breakdown below $0.1535 could weaken the recovery structure and expose $0.1490.
#HKSFCPlansToRestrictCryptoAndExchangeTerms #TradFiForBeginners #WillAnthropicListOnTime #JobsReportRaisesHikeOdds #WillAnthropicListOnTime
167
📍 $ONE – Bullish Recovery Setup
ONE is showing early bullish momentum after pushing through the $0.00197 liquidation level. Holding above $0.00194 could support another upward move.
Support: $0.00194
Resistance: $0.00201
🎯 Targets:
TP1: $0.00201
TP2: $0.00205
⚠️ Invalidation:
A breakdown below $0.00191 could shift momentum toward sellers, exposing $0.00187.
#TradFiForBeginners #WillUS-IranTensionsBoostSafe-HavenDemand? #CPITestsDecemberRateOutlook #JobsReportRaisesHikeOdds #WillUS-IranTensionsBoostSafe-HavenDemand?
📍 $ONE – Bullish Recovery Setup
ONE is showing early bullish momentum after pushing through the $0.00197 liquidation level. Holding above $0.00194 could support another upward move.
Support: $0.00194
Resistance: $0.00201
🎯 Targets:
TP1: $0.00201
TP2: $0.00205
⚠️ Invalidation:
A breakdown below $0.00191 could shift momentum toward sellers, exposing $0.00187.
#TradFiForBeginners #WillUS-IranTensionsBoostSafe-HavenDemand? #CPITestsDecemberRateOutlook #JobsReportRaisesHikeOdds #WillUS-IranTensionsBoostSafe-HavenDemand?
ONE is showing early bullish momentum after pushing through the $0.00197 liquidation level. Holding above $0.00194 could support another upward move.
Support: $0.00194
Resistance: $0.00201
🎯 Targets:
TP1: $0.00201
TP2: $0.00205
⚠️ Invalidation:
A breakdown below $0.00191 could shift momentum toward sellers, exposing $0.00187.
#TradFiForBeginners #WillUS-IranTensionsBoostSafe-HavenDemand? #CPITestsDecemberRateOutlook #JobsReportRaisesHikeOdds #WillUS-IranTensionsBoostSafe-HavenDemand?
240
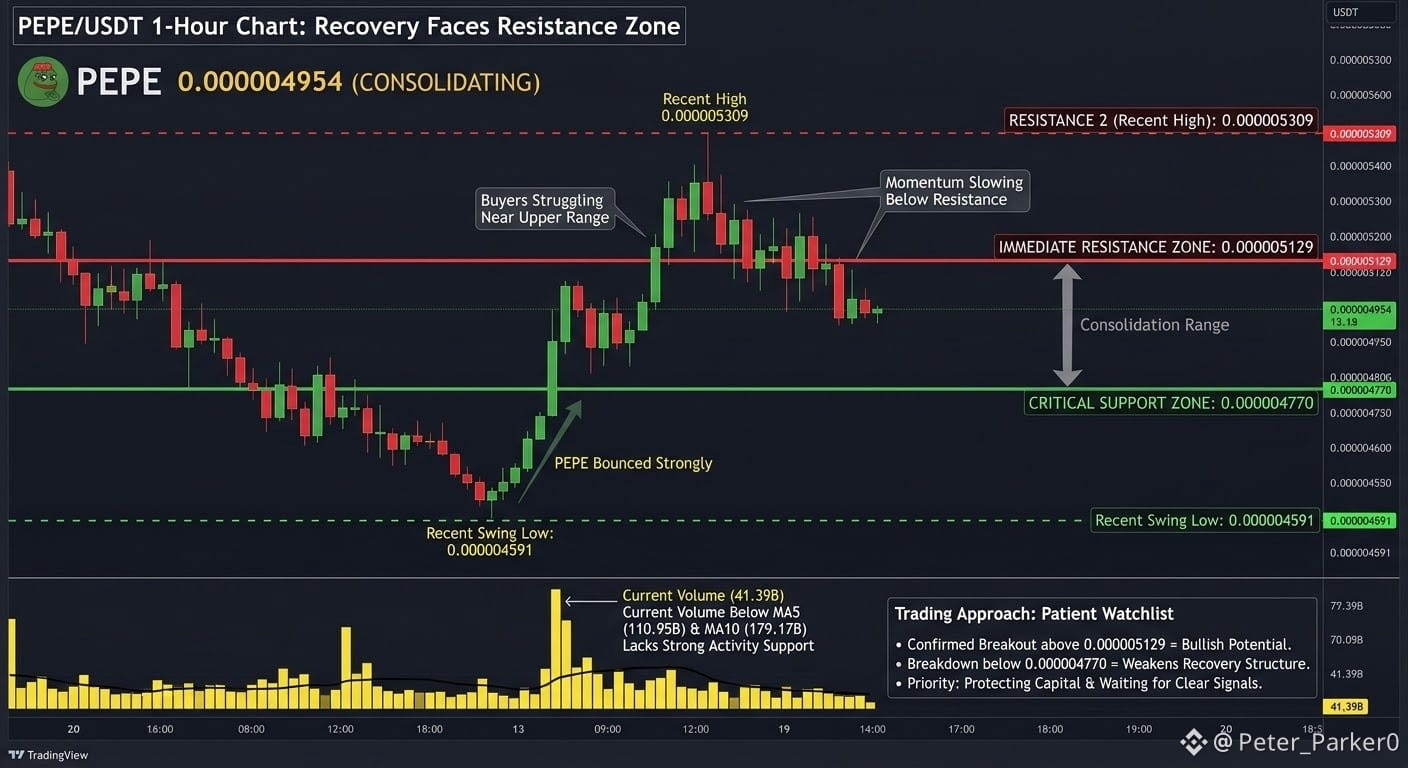
I’m watching PEPE/USDT closely on the 1-hour chart because the recent recovery is showing some interesting price action, but buyers still have an important resistance zone to overcome. What caught my attention is how PEPE bounced strongly from its recent swing low but has struggled to maintain momentum near the upper range.
PEPE is currently trading around 0.000004954, after recovering from the recent low of 0.000004591 and reaching a high of 0.000005309. The structure has improved compared with the previous decline, but recent candles suggest buyers are losing some short-term momentum. Price is now consolidating around 0.00000495.
From my technical perspective, 0.000004770 is an important nearby support area, while 0.000005129 and 0.000005309 are the resistance levels I'm monitoring. A clean breakout above the first resistance could open the door for another attempt at the recent high. However, rejection around this zone could bring sellers back into control.
Volume also deserves attention. Current volume is approximately 41.39B, below the displayed MA5 of 110.95B and MA10 of 179.17B. This suggests the latest price movement is not yet supported by strong trading activity.
I'm not interested in chasing green candles here. Entering before confirmation could expose traders to a sudden rejection or another liquidity sweep.
Trading approach: I'm keeping PEPE on my watchlist rather than forcing an entry. A confirmed breakout above 0.000005129 could offer a bullish opportunity, while a breakdown below 0.000004770 would weaken the recovery structure. Exact entry, stop-loss and take-profit levels need further confirmation rather than guesswork.
My priority is protecting capital and waiting for a clear signal. No setup is guaranteed, especially during volatile market conditions.
What's your view? Can PEPE reclaim 0.000005309, or are sellers preparing another rejection?
$PEPE
{spot}(PEPEUSDT)
#USMidterms-WhatAreMarketsExpecting? #USOctoberNFP-AreRateCutsStillPossible #Binance98PercentReplenished #BTCRebounds80K #BinanceReopensWithdrawalsForMoreAssets
I’m watching PEPE/USDT closely on the 1-hour chart because the recent recovery is showing some interesting price action, but buyers still have an important resistance zone to overcome. What caught my attention is how PEPE bounced strongly from its recent swing low but has struggled to maintain momentum near the upper range.
PEPE is currently trading around 0.000004954, after recovering from the recent low of 0.000004591 and reaching a high of 0.000005309. The structure has improved compared with the previous decline, but recent candles suggest buyers are losing some short-term momentum. Price is now consolidating around 0.00000495.
From my technical perspective, 0.000004770 is an important nearby support area, while 0.000005129 and 0.000005309 are the resistance levels I'm monitoring. A clean breakout above the first resistance could open the door for another attempt at the recent high. However, rejection around this zone could bring sellers back into control.
Volume also deserves attention. Current volume is approximately 41.39B, below the displayed MA5 of 110.95B and MA10 of 179.17B. This suggests the latest price movement is not yet supported by strong trading activity.
I'm not interested in chasing green candles here. Entering before confirmation could expose traders to a sudden rejection or another liquidity sweep.
Trading approach: I'm keeping PEPE on my watchlist rather than forcing an entry. A confirmed breakout above 0.000005129 could offer a bullish opportunity, while a breakdown below 0.000004770 would weaken the recovery structure. Exact entry, stop-loss and take-profit levels need further confirmation rather than guesswork.
My priority is protecting capital and waiting for a clear signal. No setup is guaranteed, especially during volatile market conditions.
What's your view? Can PEPE reclaim 0.000005309, or are sellers preparing another rejection?
$PEPE
#USMidterms-WhatAreMarketsExpecting? #USOctoberNFP-AreRateCutsStillPossible #Binance98PercentReplenished #BTCRebounds80K #BinanceReopensWithdrawalsForMoreAssets
PEPE is currently trading around 0.000004954, after recovering from the recent low of 0.000004591 and reaching a high of 0.000005309. The structure has improved compared with the previous decline, but recent candles suggest buyers are losing some short-term momentum. Price is now consolidating around 0.00000495.
From my technical perspective, 0.000004770 is an important nearby support area, while 0.000005129 and 0.000005309 are the resistance levels I'm monitoring. A clean breakout above the first resistance could open the door for another attempt at the recent high. However, rejection around this zone could bring sellers back into control.
Volume also deserves attention. Current volume is approximately 41.39B, below the displayed MA5 of 110.95B and MA10 of 179.17B. This suggests the latest price movement is not yet supported by strong trading activity.
I'm not interested in chasing green candles here. Entering before confirmation could expose traders to a sudden rejection or another liquidity sweep.
Trading approach: I'm keeping PEPE on my watchlist rather than forcing an entry. A confirmed breakout above 0.000005129 could offer a bullish opportunity, while a breakdown below 0.000004770 would weaken the recovery structure. Exact entry, stop-loss and take-profit levels need further confirmation rather than guesswork.
My priority is protecting capital and waiting for a clear signal. No setup is guaranteed, especially during volatile market conditions.
What's your view? Can PEPE reclaim 0.000005309, or are sellers preparing another rejection?
$PEPE
#USMidterms-WhatAreMarketsExpecting? #USOctoberNFP-AreRateCutsStillPossible #Binance98PercentReplenished #BTCRebounds80K #BinanceReopensWithdrawalsForMoreAssets
1
76
30D trade $BTC 1.2K USDT
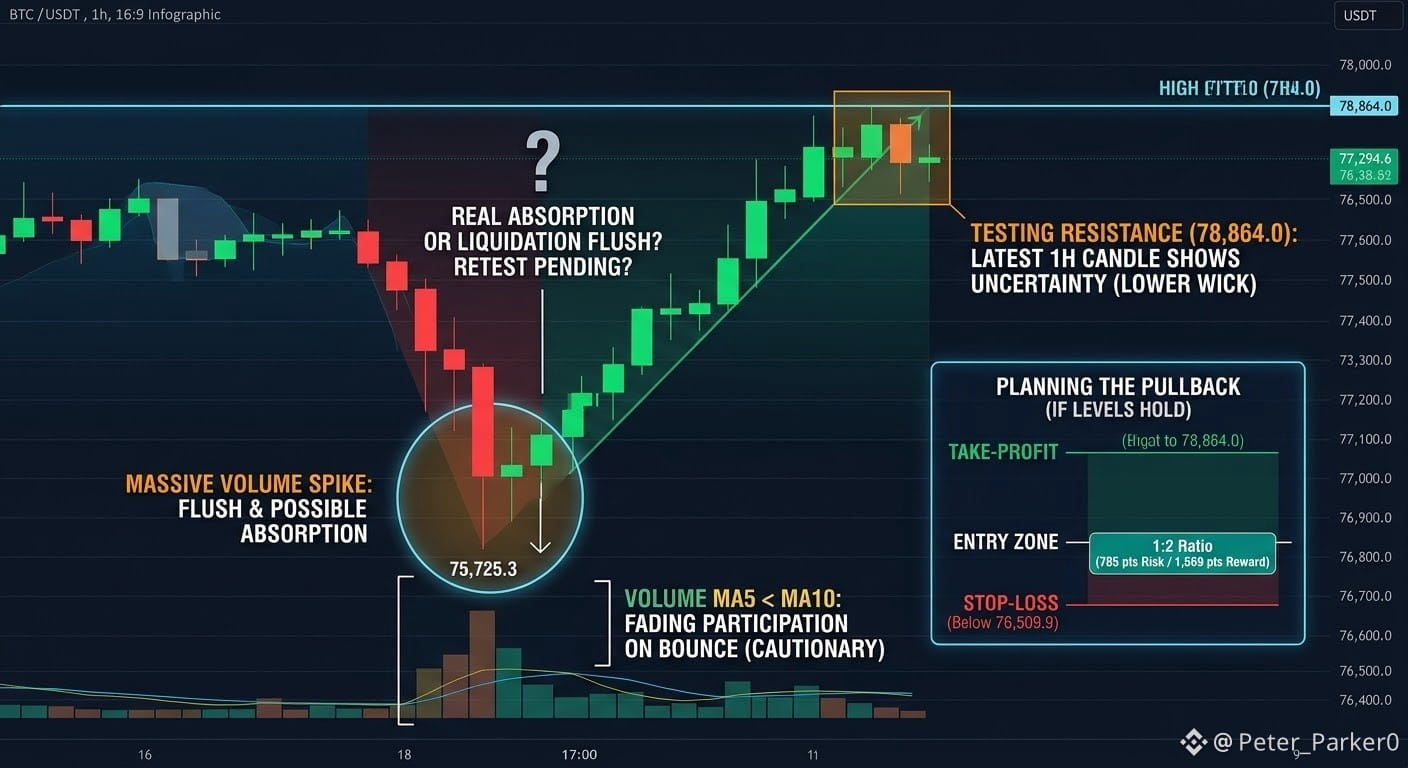
Honestly, the thing that stopped me on this BTC/USDT 1h chart is how fast the dump got erased. Price flushed down to 75,725.3 and now it's sitting around 78,288, up roughly 1.11% on the day. That's a hard V shape to ignore.
Zooming out, it looks like a range with a nasty wick at the bottom. The recent high is 78,864.0, and the low at 75,725.3 came with a big volume spike. Sometimes that's buyers absorbing the selling, sometimes it's just a flush. I can't tell yet. The bounce has been strong, but the latest candle is red with a lower wick, so buyers are getting tested right under resistance.
On indicators, volume MA5 (392.438) is under MA10 (463.773), which tells me participation is cooling as price climbs. A push into 78,864.0 on fading volume makes me cautious. Support I'm watching: 77,294.6 first, then 76,509.9. Until I see a close above 78,864.0, I treat it as resistance.
This is the spot where chasing hurts. Buying a green candle right under resistance usually means a bad entry and a stop that's too wide to be sensible. I'd rather miss a move than force one.
If I were planning it using only levels from this chart, I'd wait for a pullback:
Entry zone: around 77,294.6
Stop-loss: below 76,509.9
Take-profit: 78,864.0
Risk is about 785 points for roughly 1,569 points of reward, so about 1:2.
I'd want to see price hold 77,294.6 and react bullishly, or a clean 1h close above 78,864.0 with volume picking up. A close below 76,509.9 and the idea is dead.
None of this is certain, and Bitcoin can flip on you quickly. Keep size small and protect your capital first.
Do you think that wick at 75,725.3 was real absorption, or just a liquidation flush that gets retested?
$BTC
Honestly, the thing that stopped me on this BTC/USDT 1h chart is how fast the dump got erased. Price flushed down to 75,725.3 and now it's sitting around 78,288, up roughly 1.11% on the day. That's a hard V shape to ignore.
Zooming out, it looks like a range with a nasty wick at the bottom. The recent high is 78,864.0, and the low at 75,725.3 came with a big volume spike. Sometimes that's buyers absorbing the selling, sometimes it's just a flush. I can't tell yet. The bounce has been strong, but the latest candle is red with a lower wick, so buyers are getting tested right under resistance.
On indicators, volume MA5 (392.438) is under MA10 (463.773), which tells me participation is cooling as price climbs. A push into 78,864.0 on fading volume makes me cautious. Support I'm watching: 77,294.6 first, then 76,509.9. Until I see a close above 78,864.0, I treat it as resistance.
This is the spot where chasing hurts. Buying a green candle right under resistance usually means a bad entry and a stop that's too wide to be sensible. I'd rather miss a move than force one.
If I were planning it using only levels from this chart, I'd wait for a pullback:
Entry zone: around 77,294.6
Stop-loss: below 76,509.9
Take-profit: 78,864.0
Risk is about 785 points for roughly 1,569 points of reward, so about 1:2.
I'd want to see price hold 77,294.6 and react bullishly, or a clean 1h close above 78,864.0 with volume picking up. A close below 76,509.9 and the idea is dead.
None of this is certain, and Bitcoin can flip on you quickly. Keep size small and protect your capital first.
Do you think that wick at 75,725.3 was real absorption, or just a liquidation flush that gets retested?
$BTC
Zooming out, it looks like a range with a nasty wick at the bottom. The recent high is 78,864.0, and the low at 75,725.3 came with a big volume spike. Sometimes that's buyers absorbing the selling, sometimes it's just a flush. I can't tell yet. The bounce has been strong, but the latest candle is red with a lower wick, so buyers are getting tested right under resistance.
On indicators, volume MA5 (392.438) is under MA10 (463.773), which tells me participation is cooling as price climbs. A push into 78,864.0 on fading volume makes me cautious. Support I'm watching: 77,294.6 first, then 76,509.9. Until I see a close above 78,864.0, I treat it as resistance.
This is the spot where chasing hurts. Buying a green candle right under resistance usually means a bad entry and a stop that's too wide to be sensible. I'd rather miss a move than force one.
If I were planning it using only levels from this chart, I'd wait for a pullback:
Entry zone: around 77,294.6
Stop-loss: below 76,509.9
Take-profit: 78,864.0
Risk is about 785 points for roughly 1,569 points of reward, so about 1:2.
I'd want to see price hold 77,294.6 and react bullishly, or a clean 1h close above 78,864.0 with volume picking up. A close below 76,509.9 and the idea is dead.
None of this is certain, and Bitcoin can flip on you quickly. Keep size small and protect your capital first.
Do you think that wick at 75,725.3 was real absorption, or just a liquidation flush that gets retested?
$BTC
1
127
🔥 TACUSDT - VIP MARKET SIGNAL
Price: $0.001065
24H Change: -2.47%
📉 MARKET STRUCTURE:
Sellers are maintaining pressure. Buyers need to defend support before another recovery attempt.
🟢 SUPPORT ZONES:
S1: $0.001040
S2: $0.001015
🔴 RESISTANCE ZONES:
R1: $0.001085
R2: $0.001110
🎯 NEXT TARGET: $0.001015
⚡ TRADE OUTLOOK:
Below S1, bearish momentum could accelerate.
A breakout above R1 may trigger recovery.
Trade carefully. Protect your capital.
$TAC
{future}(TACUSDT)
#BinanceReopensWithdrawalsForMoreAssets #BinanceIncidentReport #AMDBeatsExpectations-AINarrativeContinues
#BinanceReopensWithdrawalsForMoreAssets
🔥 TACUSDT - VIP MARKET SIGNAL
Price: $0.001065
24H Change: -2.47%
📉 MARKET STRUCTURE:
Sellers are maintaining pressure. Buyers need to defend support before another recovery attempt.
🟢 SUPPORT ZONES:
S1: $0.001040
S2: $0.001015
🔴 RESISTANCE ZONES:
R1: $0.001085
R2: $0.001110
🎯 NEXT TARGET: $0.001015
⚡ TRADE OUTLOOK:
Below S1, bearish momentum could accelerate.
A breakout above R1 may trigger recovery.
Trade carefully. Protect your capital.
$TAC
#BinanceReopensWithdrawalsForMoreAssets #BinanceIncidentReport #AMDBeatsExpectations-AINarrativeContinues
#BinanceReopensWithdrawalsForMoreAssets
Price: $0.001065
24H Change: -2.47%
📉 MARKET STRUCTURE:
Sellers are maintaining pressure. Buyers need to defend support before another recovery attempt.
🟢 SUPPORT ZONES:
S1: $0.001040
S2: $0.001015
🔴 RESISTANCE ZONES:
R1: $0.001085
R2: $0.001110
🎯 NEXT TARGET: $0.001015
⚡ TRADE OUTLOOK:
Below S1, bearish momentum could accelerate.
A breakout above R1 may trigger recovery.
Trade carefully. Protect your capital.
$TAC
#BinanceReopensWithdrawalsForMoreAssets #BinanceIncidentReport #AMDBeatsExpectations-AINarrativeContinues
#BinanceReopensWithdrawalsForMoreAssets
479
🔥 $ETH USDT - VIP MARKET SIGNAL
Price: $2,327.35
24H Change: +2.42%
📈 MARKET STRUCTURE:
ETH is showing positive momentum. Buyers are attempting to extend the recovery.
🟢 SUPPORT ZONES:
S1: $2,290
S2: $2,250
🔴 RESISTANCE ZONES:
R1: $2,365
R2: $2,410
🎯 NEXT TARGET: $2,410
⚡ TRADE OUTLOOK:
A breakout above R1 could push ETH toward R2.
Losing S1 may weaken bullish momentum.
Stay disciplined.
#BinanceReopensWithdrawalsForMoreAssets #HongKongToLicenseVirtualAssetCustodyAndAdvisory #BinanceIncidentReport #USMidterms-WhatAreMarketsExpecting?
🔥 $ETH USDT - VIP MARKET SIGNAL
Price: $2,327.35
24H Change: +2.42%
📈 MARKET STRUCTURE:
ETH is showing positive momentum. Buyers are attempting to extend the recovery.
🟢 SUPPORT ZONES:
S1: $2,290
S2: $2,250
🔴 RESISTANCE ZONES:
R1: $2,365
R2: $2,410
🎯 NEXT TARGET: $2,410
⚡ TRADE OUTLOOK:
A breakout above R1 could push ETH toward R2.
Losing S1 may weaken bullish momentum.
Stay disciplined.
#BinanceReopensWithdrawalsForMoreAssets #HongKongToLicenseVirtualAssetCustodyAndAdvisory #BinanceIncidentReport #USMidterms-WhatAreMarketsExpecting?
Price: $2,327.35
24H Change: +2.42%
📈 MARKET STRUCTURE:
ETH is showing positive momentum. Buyers are attempting to extend the recovery.
🟢 SUPPORT ZONES:
S1: $2,290
S2: $2,250
🔴 RESISTANCE ZONES:
R1: $2,365
R2: $2,410
🎯 NEXT TARGET: $2,410
⚡ TRADE OUTLOOK:
A breakout above R1 could push ETH toward R2.
Losing S1 may weaken bullish momentum.
Stay disciplined.
#BinanceReopensWithdrawalsForMoreAssets #HongKongToLicenseVirtualAssetCustodyAndAdvisory #BinanceIncidentReport #USMidterms-WhatAreMarketsExpecting?
1
42
Holding $BTC 0.2 USDT
🔥 $BTC USDT - VIP MARKET SIGNAL
Price: $78,543.90
24H Change: +1.82%
📈 MARKET STRUCTURE:
Bitcoin is holding positive momentum. The next major test is whether buyers can overcome nearby resistance.
🟢 SUPPORT ZONES:
S1: $77,800
S2: $76,900
🔴 RESISTANCE ZONES:
R1: $79,200
R2: $80,000
🎯 NEXT TARGET: $80,000
⚡ TRADE OUTLOOK:
Above R1, bullish continuation becomes possible.
Below S1, downside pressure could increase.
Watch the breakout.#BinanceReopensWithdrawalsForMoreAssets #HongKongToLicenseVirtualAssetCustodyAndAdvisory #BinanceIncidentReport #USOctoberNFP-AreRateCutsStillPossible
🔥 $BTC USDT - VIP MARKET SIGNAL
Price: $78,543.90
24H Change: +1.82%
📈 MARKET STRUCTURE:
Bitcoin is holding positive momentum. The next major test is whether buyers can overcome nearby resistance.
🟢 SUPPORT ZONES:
S1: $77,800
S2: $76,900
🔴 RESISTANCE ZONES:
R1: $79,200
R2: $80,000
🎯 NEXT TARGET: $80,000
⚡ TRADE OUTLOOK:
Above R1, bullish continuation becomes possible.
Below S1, downside pressure could increase.
Watch the breakout.#BinanceReopensWithdrawalsForMoreAssets #HongKongToLicenseVirtualAssetCustodyAndAdvisory #BinanceIncidentReport #USOctoberNFP-AreRateCutsStillPossible
Price: $78,543.90
24H Change: +1.82%
📈 MARKET STRUCTURE:
Bitcoin is holding positive momentum. The next major test is whether buyers can overcome nearby resistance.
🟢 SUPPORT ZONES:
S1: $77,800
S2: $76,900
🔴 RESISTANCE ZONES:
R1: $79,200
R2: $80,000
🎯 NEXT TARGET: $80,000
⚡ TRADE OUTLOOK:
Above R1, bullish continuation becomes possible.
Below S1, downside pressure could increase.
Watch the breakout.#BinanceReopensWithdrawalsForMoreAssets #HongKongToLicenseVirtualAssetCustodyAndAdvisory #BinanceIncidentReport #USOctoberNFP-AreRateCutsStillPossible
53
🔥 $XRP USDT - VIP MARKET SIGNAL
Price: $1.29149
24H Change: +2.65%
📈 MARKET STRUCTURE:
XRP is showing strong relative momentum. Buyers are attempting to maintain control as price approaches resistance.
🟢 SUPPORT ZONES:
S1: $1.270
S2: $1.250
🔴 RESISTANCE ZONES:
R1: $1.310
R2: $1.340
🎯 NEXT TARGET: $1.340
⚡ TRADE OUTLOOK:
A successful R1 breakout could extend the recovery.
A breakdown below S1 may shift momentum toward sellers.
Trade smart. Manage risk.
#BinanceReopensWithdrawalsForMoreAssets #HongKongToLicenseVirtualAssetCustodyAndAdvisory #BinanceIncidentReport #USOctoberNFP-AreRateCutsStillPossible
🔥 $XRP USDT - VIP MARKET SIGNAL
Price: $1.29149
24H Change: +2.65%
📈 MARKET STRUCTURE:
XRP is showing strong relative momentum. Buyers are attempting to maintain control as price approaches resistance.
🟢 SUPPORT ZONES:
S1: $1.270
S2: $1.250
🔴 RESISTANCE ZONES:
R1: $1.310
R2: $1.340
🎯 NEXT TARGET: $1.340
⚡ TRADE OUTLOOK:
A successful R1 breakout could extend the recovery.
A breakdown below S1 may shift momentum toward sellers.
Trade smart. Manage risk.
#BinanceReopensWithdrawalsForMoreAssets #HongKongToLicenseVirtualAssetCustodyAndAdvisory #BinanceIncidentReport #USOctoberNFP-AreRateCutsStillPossible
Price: $1.29149
24H Change: +2.65%
📈 MARKET STRUCTURE:
XRP is showing strong relative momentum. Buyers are attempting to maintain control as price approaches resistance.
🟢 SUPPORT ZONES:
S1: $1.270
S2: $1.250
🔴 RESISTANCE ZONES:
R1: $1.310
R2: $1.340
🎯 NEXT TARGET: $1.340
⚡ TRADE OUTLOOK:
A successful R1 breakout could extend the recovery.
A breakdown below S1 may shift momentum toward sellers.
Trade smart. Manage risk.
#BinanceReopensWithdrawalsForMoreAssets #HongKongToLicenseVirtualAssetCustodyAndAdvisory #BinanceIncidentReport #USOctoberNFP-AreRateCutsStillPossible
130
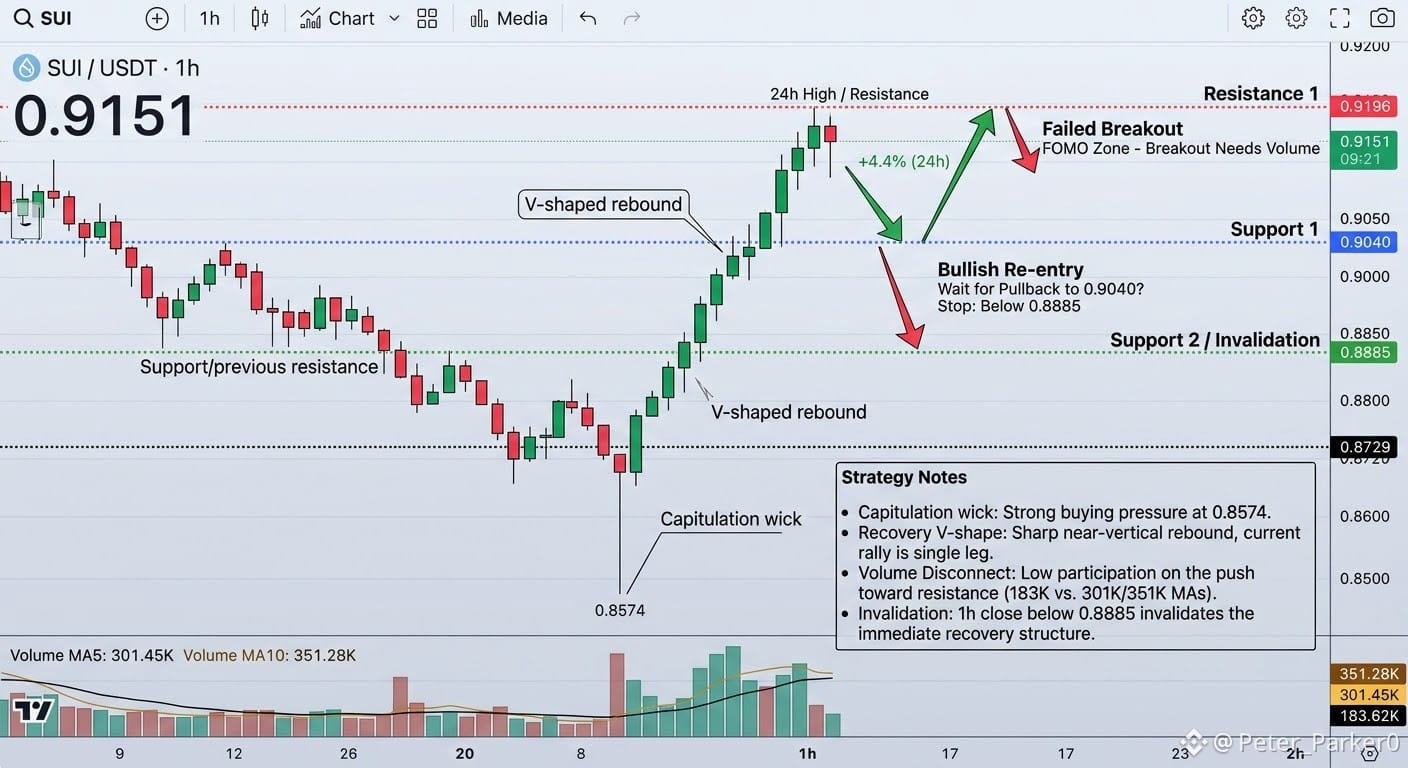
The $SUI /USDT 1h chart caught my eye because of how sharp the recovery is. That long wick down to 0.8574 was bought aggressively, and price has since climbed in a near-vertical staircase to a high of 0.9196.
Structurally, SUI spent the early part of this window making lower highs and lower lows, bleeding down through the 0.8885 and 0.8729 areas. The wick to 0.8574 looks like a capitulation flush, followed by a clear V-shaped rebound. Price is now at 0.9151, up about 4.4% on the day and sitting just under the 24h high. That's a recovery, but so far it's only one leg.
On volume, the current reading is 183.62K against a MA5 of 301.45K and a MA10 of 351.28K. The candle is still forming, so that may change, but right now the push toward resistance isn't backed by above-average participation. That's worth watching. The 0.9196 high is the immediate ceiling, and 0.9040 and 0.8885 are the nearest supports below.
This is exactly where FOMO gets expensive. Buying a stretched green candle right under resistance means a tight reaction zone and a stop that's far away. If the breakout fails, late buyers become the liquidity.
A more patient plan would be a pullback entry near 0.9040, with a stop below 0.8885 and a first target at 0.9196. That's roughly a 1:1 reward-to-risk, which isn't compelling. I won't invent targets beyond 0.9196 because the chart doesn't show a clear level there. The setup only improves if price breaks 0.9196 and holds it on a retest, ideally with volume finally picking up.
Invalidation is simple: a 1h close below 0.8885 puts the recovery structure in doubt.
None of this is certain, and a fast bounce can reverse just as fast. Size positions so a stop-out is manageable.
Do you see this as the start of a real trend shift, or a relief rally into resistance that needs a retest first?
#37thQuarterlyBNBBurnRemoves1.64MillionBNB #BinanceReopensWithdrawalsForMoreAssets #AMDBeatsExpectations-AINarrativeContinues #USOctoberNFP-AreRateCutsStillPossible #USMidterms-WhatAreMarketsExpecting?
The $SUI /USDT 1h chart caught my eye because of how sharp the recovery is. That long wick down to 0.8574 was bought aggressively, and price has since climbed in a near-vertical staircase to a high of 0.9196.
Structurally, SUI spent the early part of this window making lower highs and lower lows, bleeding down through the 0.8885 and 0.8729 areas. The wick to 0.8574 looks like a capitulation flush, followed by a clear V-shaped rebound. Price is now at 0.9151, up about 4.4% on the day and sitting just under the 24h high. That's a recovery, but so far it's only one leg.
On volume, the current reading is 183.62K against a MA5 of 301.45K and a MA10 of 351.28K. The candle is still forming, so that may change, but right now the push toward resistance isn't backed by above-average participation. That's worth watching. The 0.9196 high is the immediate ceiling, and 0.9040 and 0.8885 are the nearest supports below.
This is exactly where FOMO gets expensive. Buying a stretched green candle right under resistance means a tight reaction zone and a stop that's far away. If the breakout fails, late buyers become the liquidity.
A more patient plan would be a pullback entry near 0.9040, with a stop below 0.8885 and a first target at 0.9196. That's roughly a 1:1 reward-to-risk, which isn't compelling. I won't invent targets beyond 0.9196 because the chart doesn't show a clear level there. The setup only improves if price breaks 0.9196 and holds it on a retest, ideally with volume finally picking up.
Invalidation is simple: a 1h close below 0.8885 puts the recovery structure in doubt.
None of this is certain, and a fast bounce can reverse just as fast. Size positions so a stop-out is manageable.
Do you see this as the start of a real trend shift, or a relief rally into resistance that needs a retest first?
#37thQuarterlyBNBBurnRemoves1.64MillionBNB #BinanceReopensWithdrawalsForMoreAssets #AMDBeatsExpectations-AINarrativeContinues #USOctoberNFP-AreRateCutsStillPossible #USMidterms-WhatAreMarketsExpecting?
Structurally, SUI spent the early part of this window making lower highs and lower lows, bleeding down through the 0.8885 and 0.8729 areas. The wick to 0.8574 looks like a capitulation flush, followed by a clear V-shaped rebound. Price is now at 0.9151, up about 4.4% on the day and sitting just under the 24h high. That's a recovery, but so far it's only one leg.
On volume, the current reading is 183.62K against a MA5 of 301.45K and a MA10 of 351.28K. The candle is still forming, so that may change, but right now the push toward resistance isn't backed by above-average participation. That's worth watching. The 0.9196 high is the immediate ceiling, and 0.9040 and 0.8885 are the nearest supports below.
This is exactly where FOMO gets expensive. Buying a stretched green candle right under resistance means a tight reaction zone and a stop that's far away. If the breakout fails, late buyers become the liquidity.
A more patient plan would be a pullback entry near 0.9040, with a stop below 0.8885 and a first target at 0.9196. That's roughly a 1:1 reward-to-risk, which isn't compelling. I won't invent targets beyond 0.9196 because the chart doesn't show a clear level there. The setup only improves if price breaks 0.9196 and holds it on a retest, ideally with volume finally picking up.
Invalidation is simple: a 1h close below 0.8885 puts the recovery structure in doubt.
None of this is certain, and a fast bounce can reverse just as fast. Size positions so a stop-out is manageable.
Do you see this as the start of a real trend shift, or a relief rally into resistance that needs a retest first?
#37thQuarterlyBNBBurnRemoves1.64MillionBNB #BinanceReopensWithdrawalsForMoreAssets #AMDBeatsExpectations-AINarrativeContinues #USOctoberNFP-AreRateCutsStillPossible #USMidterms-WhatAreMarketsExpecting?
261
Log in to explore more content
Join global crypto users on Binance Square
⚡️ Get latest and useful information about crypto.
💬 Trusted by the world’s largest crypto exchange.
👍 Discover real insights from verified creators.
Email / Phone number
Trending Topics
JobsReportRaisesHikeOdds
285,016 views
2,213 Discussing
TradFi News | US Adds 165,000 Jobs in October, More Than Double the 65,000 Forecast, as Unemployment Falls to 4.1%
Binance News
·38 Likes
·23.3k views
CPITestsDecemberRateOutlook
34,062 views
430 Discussing
BitcoinRebounds$75KAsChipsLead
23,193 views
232 Discussing