

Anonymous who
170 Posts

Anonymous who
Report
Block User
Trader with 8 years of experience, I share my real strategies. Welcome to my world!
Open Trade
High-Frequency Trader
5.7 Years
8 Following
427 Followers
393 Liked
Posts
Portfolio
All
Quotes
·
--
Bearish
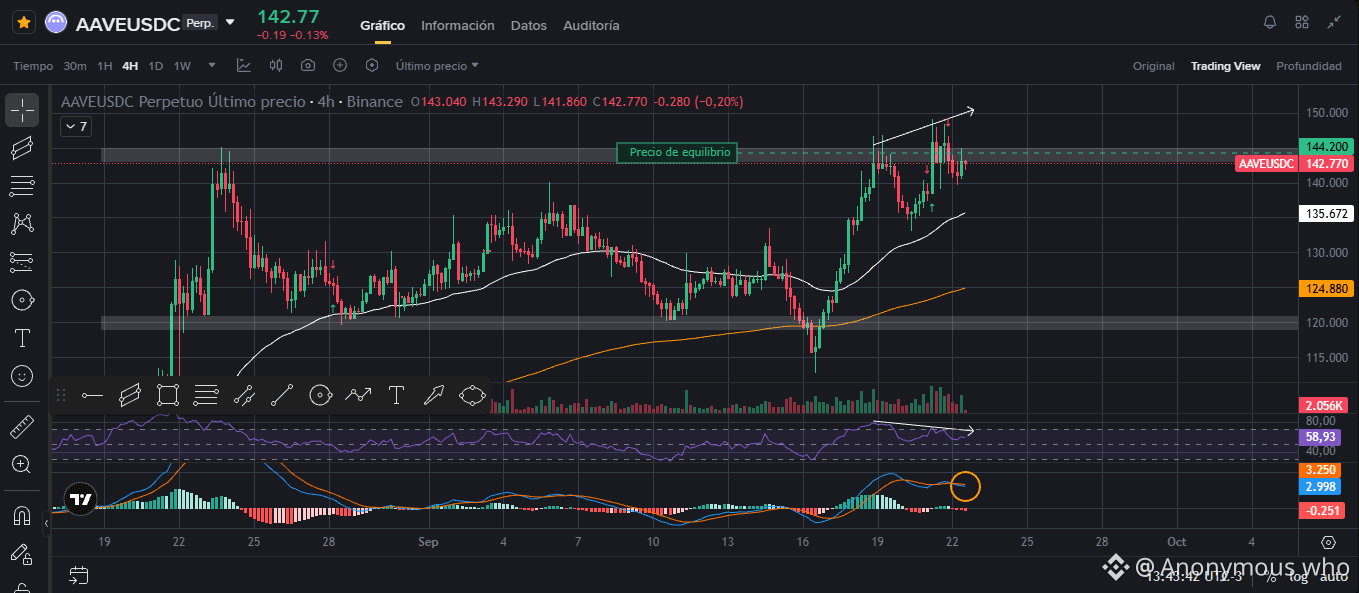
Align the range structure with the exhaustion of momentum on intermediate timeframes allows us to build setups with a clear statistical edge. Here’s the technical breakdown of my short position in $AAVE . 📊
{future}(AAVEUSDT)
🚨 Range Structure and Extremes (4H): AAVE price has reached the top (resistance) of a consolidated sideways channel, at 145 resistance. Arrival at this supply zone happens with the RSI in overbought territory, which prints a clear bearish divergence—signaling that the current bullish move is rising mostly on inertia and shows clear signs of exhaustion.
Momentum Confirmation: To the RSI divergence, we add a bearish MACD crossover, confirming the loss of buying strength and increasing the odds of a downward turn toward the middle or lower part of the range.
Efficient Execution (Maker vs. Taker): The entry was executed via a Sell Limit order at $144.2. Capturing the exact level with a limit order not only optimizes the Risk/Reward ratio (RR), but also reduces the impact of fees by acting as a Maker in the order book.
🎯 The Play / Execution Strategy: We’re looking for a corrective move toward the range’s internal support levels. We set Take Profit 1 (TP1) at $139, a key demand retest area, with a Stop Loss set at $148 above the range highs to invalidate the structure in case of a breakout. 🛡️
Do you see AAVE respecting the sideways resistance to target $139, or do you think buyers will force the breakout above $148? I’ll read your thoughts in the comments. 👇
#AAVE #Trading #TechnicalAnalysis #TradingSignals #DYOR
Align the range structure with the exhaustion of momentum on intermediate timeframes allows us to build setups with a clear statistical edge. Here’s the technical breakdown of my short position in $AAVE . 📊
🚨 Range Structure and Extremes (4H): AAVE price has reached the top (resistance) of a consolidated sideways channel, at 145 resistance. Arrival at this supply zone happens with the RSI in overbought territory, which prints a clear bearish divergence—signaling that the current bullish move is rising mostly on inertia and shows clear signs of exhaustion.
Momentum Confirmation: To the RSI divergence, we add a bearish MACD crossover, confirming the loss of buying strength and increasing the odds of a downward turn toward the middle or lower part of the range.
Efficient Execution (Maker vs. Taker): The entry was executed via a Sell Limit order at $144.2. Capturing the exact level with a limit order not only optimizes the Risk/Reward ratio (RR), but also reduces the impact of fees by acting as a Maker in the order book.
🎯 The Play / Execution Strategy: We’re looking for a corrective move toward the range’s internal support levels. We set Take Profit 1 (TP1) at $139, a key demand retest area, with a Stop Loss set at $148 above the range highs to invalidate the structure in case of a breakout. 🛡️
Do you see AAVE respecting the sideways resistance to target $139, or do you think buyers will force the breakout above $148? I’ll read your thoughts in the comments. 👇
#AAVE #Trading #TechnicalAnalysis #TradingSignals #DYOR
199
·
--
Bearish
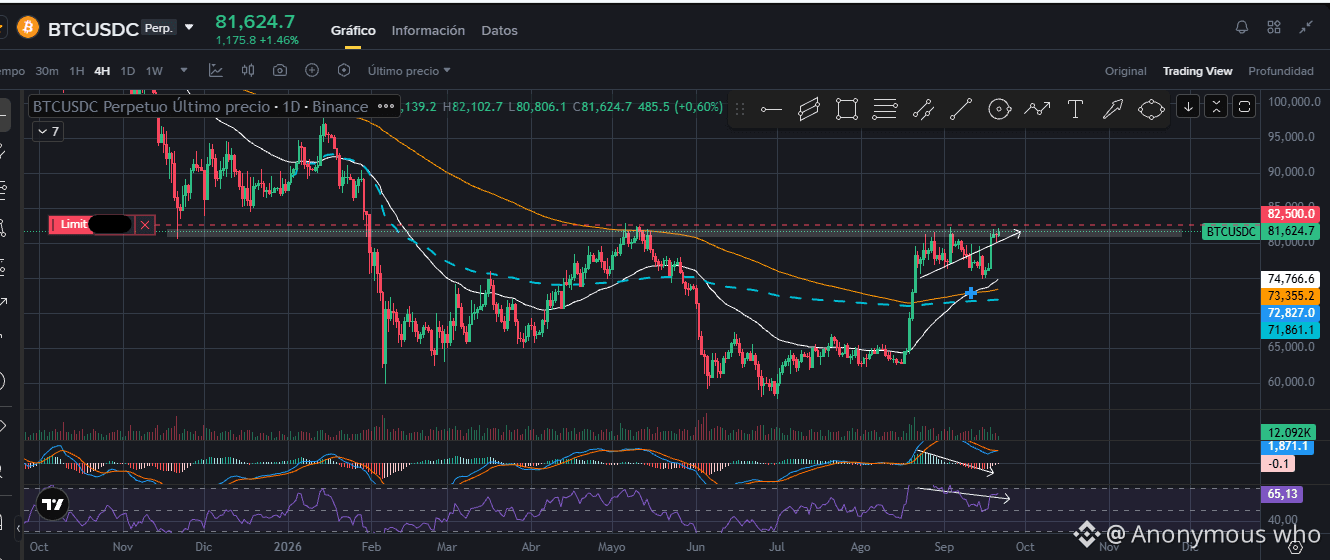
Analysis of the limit sell setup in order. Let me share the analysis behind my limit order in short for #Bitcoin . 📊
🚨Wyckoff Distribution Pattern (1D): After an aggressive bullish impulse, price entered a sideways range in a key area of relative highs. This price action matches the typical phases of Wyckoff distribution, anticipating a correction due to buyer exhaustion.
📉Quad Technical Confluence (4H):
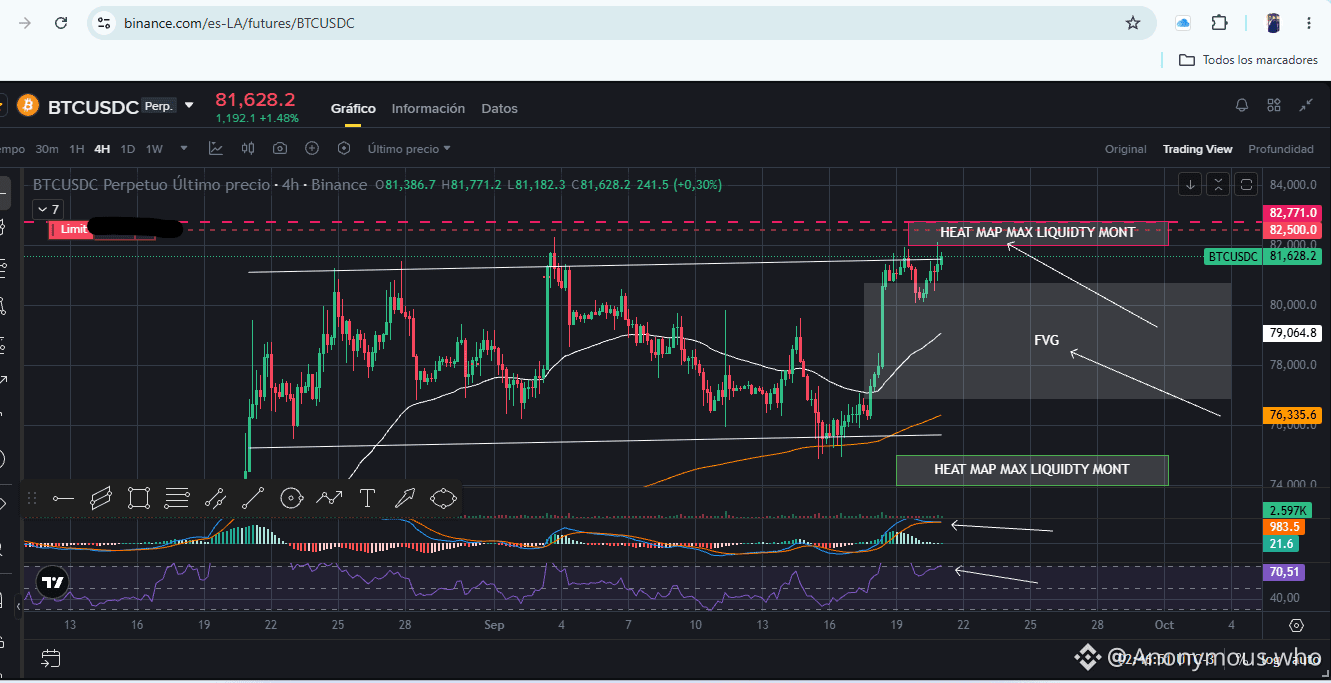
RSI: In an extended overbought area.
MACD: Near a bearish crossover for confirmation.
Inefficiency: The recent move left an FVG (Fair Value Gap) on 4H, which will act as a magnet for the correction.
IMPORTANT: Massive Liquidity: Direct test to the Heatmap L3 Monthly liquidity.
The Play / Execution Strategy: Limit Sell Order / Short set at $82,500. Stop Loss adjusted to $83,000 (above the liquidity). The first take-profit target (TP 1) is placed at $78,000 to close part of the position in the prior demand zone. 🛡️
Do you see $BTC distributing in this highs area, or do you think it will break $83,000 forcefully? Te
{spot}(BTCUSDT)
I read in the comments. 👇
Analysis of the limit sell setup in order. Let me share the analysis behind my limit order in short for #Bitcoin . 📊
🚨Wyckoff Distribution Pattern (1D): After an aggressive bullish impulse, price entered a sideways range in a key area of relative highs. This price action matches the typical phases of Wyckoff distribution, anticipating a correction due to buyer exhaustion.
📉Quad Technical Confluence (4H):
RSI: In an extended overbought area.
MACD: Near a bearish crossover for confirmation.
Inefficiency: The recent move left an FVG (Fair Value Gap) on 4H, which will act as a magnet for the correction.
IMPORTANT: Massive Liquidity: Direct test to the Heatmap L3 Monthly liquidity.
The Play / Execution Strategy: Limit Sell Order / Short set at $82,500. Stop Loss adjusted to $83,000 (above the liquidity). The first take-profit target (TP 1) is placed at $78,000 to close part of the position in the prior demand zone. 🛡️
Do you see $BTC distributing in this highs area, or do you think it will break $83,000 forcefully? Te
I read in the comments. 👇
155
·
--
Bullish
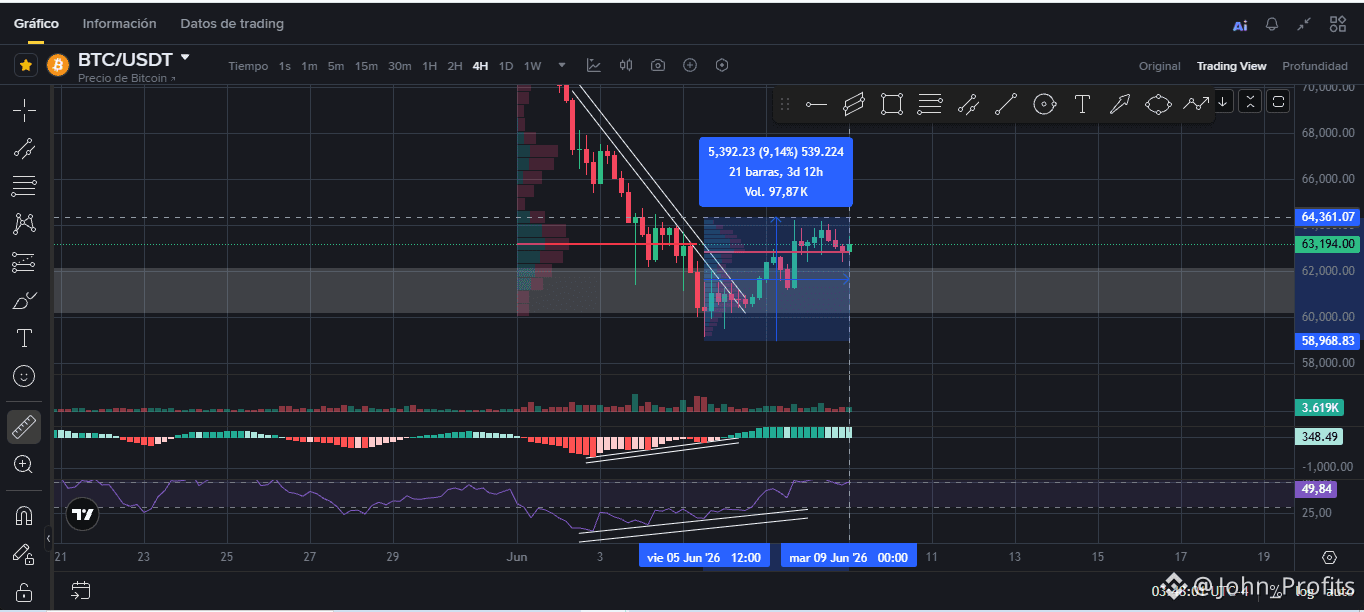
The log and analysis of #Bitcoin is playing out just as we predicted! The market validated our order flow reading combined with confluence of indicators, and the absorption at $60,000 worked perfectly, driving the price up nearly 9% from the low. 🎯
⚡Confirmation of Divergence: The current bounce is no coincidence; it was anticipated by the bullish divergence on the 4H chart that we identified at this macro support and structural relative low. Those who check the original post will see that the entry was projected in real-time before the move.
Key Pivot Zone $BTC ($63,000): The price is now consolidating in a critical zone: $63,000. This level represents the POC (Point of Control) of the Volume Profile from the last two significant moves. As long as the price stays above this wall, buyers retain control.
Next Target: If the $63,000 zone is successfully defended, the projection remains solid towards our next liquidity magnet at around $70,000.
The Play / Execution Strategy: With a return of almost 8% on board, professional management dictates securing partial profits and protecting capital. I'm keeping the rest of the position active with a price action Stop Loss. If the POC at $63k acts as a floor, the path is clear to $70k. 🛡️
Did you secure partials with me on this bounce or are you still waiting for $70,000 without taking profits? You can see the initial analysis in the pinned post. 👇
#Bitcoin #Trading #TechnicalAnalysi #TradingSignals #DYOR
{spot}(BTCUSDT)
The log and analysis of #Bitcoin is playing out just as we predicted! The market validated our order flow reading combined with confluence of indicators, and the absorption at $60,000 worked perfectly, driving the price up nearly 9% from the low. 🎯
⚡Confirmation of Divergence: The current bounce is no coincidence; it was anticipated by the bullish divergence on the 4H chart that we identified at this macro support and structural relative low. Those who check the original post will see that the entry was projected in real-time before the move.
Key Pivot Zone $BTC ($63,000): The price is now consolidating in a critical zone: $63,000. This level represents the POC (Point of Control) of the Volume Profile from the last two significant moves. As long as the price stays above this wall, buyers retain control.
Next Target: If the $63,000 zone is successfully defended, the projection remains solid towards our next liquidity magnet at around $70,000.
The Play / Execution Strategy: With a return of almost 8% on board, professional management dictates securing partial profits and protecting capital. I'm keeping the rest of the position active with a price action Stop Loss. If the POC at $63k acts as a floor, the path is clear to $70k. 🛡️
Did you secure partials with me on this bounce or are you still waiting for $70,000 without taking profits? You can see the initial analysis in the pinned post. 👇
#Bitcoin #Trading #TechnicalAnalysi #TradingSignals #DYOR
Anonymous who
·
--
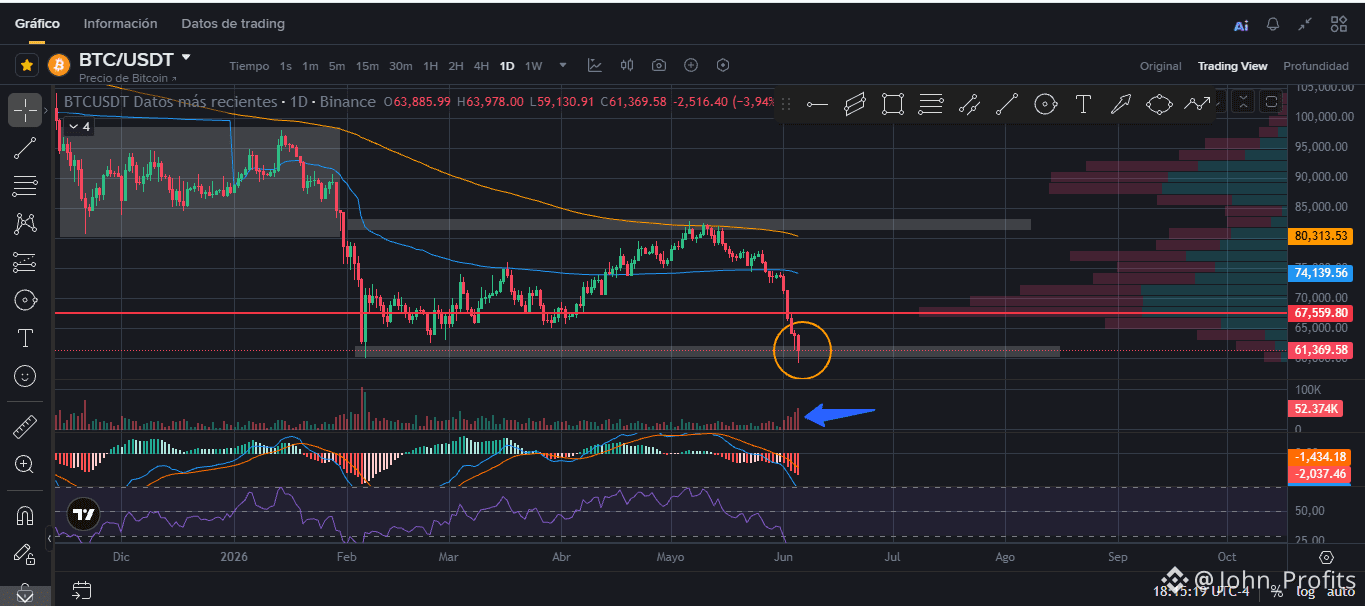
BullishIdentifying retail capitulation zones and institutional absorption is key to getting ahead of major market turns.
I'm sharing the technical map behind my limit buy order in Spot at $BTC 60k and my plan to look for Long positions in futures. 📊
🚨Institutional Absorption (1D): The price dropped sharply to the psychological and technical support at $60,000. What's interesting here is the volume: a massive spike was printed, but the price stopped falling. This indicates strong absorption by passive buyers (limit orders) that halted aggressive market sellers in their tracks.
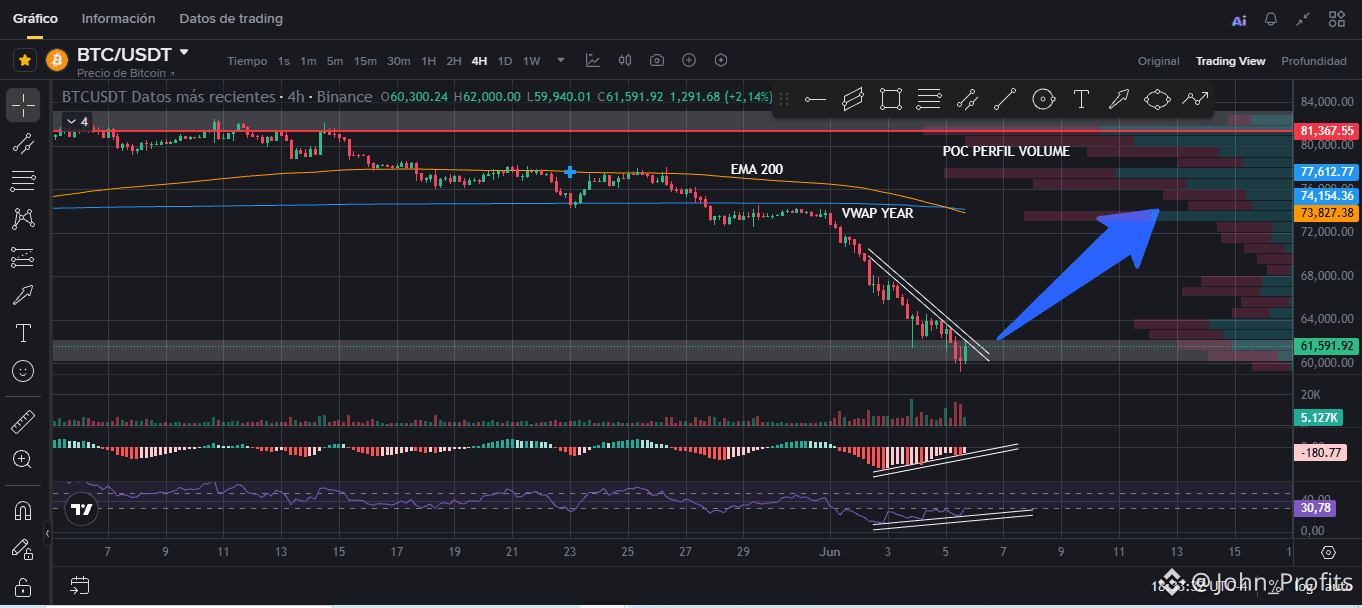
⚡Confluence and Reversal (4H): Dropping to the 4-hour chart, the structure confirms seller exhaustion. The price aligns exactly with the LVA (Low Value Area) of the Volume Profile and shows a clear bullish divergence in both the MACD and RSI. Technically, the odds point to a rebound through mean reversion.
Targets and Liquidity Magnets: The first macro target is at the $72,000 zone, where two massive liquidity magnets converge: the 200 EMA and the Annual VWAP. Once we reach that level, we will evaluate price action under two scenarios:
Optimistic Scenario: Enough strength to target the main POC in the $81,000 zone and liquidate the bears.
Range Scenario: A rejection at $72,000 for a shallower correction before retesting the low liquidity.
🔥The Play / Execution Strategy: Spot order executed at $60,000. For futures, I will wait for confirmation triggers on lower timeframes while keeping a tight Stop Loss below the daily spike low. The arrow is already set, and the risk/reward ratio is excellent. 🛡️
$72,000? Share your plan in the comments. 👇
#Bitcoin #Trading #TechnicalAnalysis #OrderFlow #DYOR
257
·
--
Bullish
Identifying retail capitulation zones and institutional absorption is key to getting ahead of major market turns.
I'm sharing the technical map behind my limit buy order in Spot at $BTC 60k and my plan to look for Long positions in futures. 📊
🚨Institutional Absorption (1D): The price dropped sharply to the psychological and technical support at $60,000. What's interesting here is the volume: a massive spike was printed, but the price stopped falling. This indicates strong absorption by passive buyers (limit orders) that halted aggressive market sellers in their tracks.
⚡Confluence and Reversal (4H): Dropping to the 4-hour chart, the structure confirms seller exhaustion. The price aligns exactly with the LVA (Low Value Area) of the Volume Profile and shows a clear bullish divergence in both the MACD and RSI. Technically, the odds point to a rebound through mean reversion.
Targets and Liquidity Magnets: The first macro target is at the $72,000 zone, where two massive liquidity magnets converge: the 200 EMA and the Annual VWAP. Once we reach that level, we will evaluate price action under two scenarios:
Optimistic Scenario: Enough strength to target the main POC in the $81,000 zone and liquidate the bears.
Range Scenario: A rejection at $72,000 for a shallower correction before retesting the low liquidity.
🔥The Play / Execution Strategy: Spot order executed at $60,000. For futures, I will wait for confirmation triggers on lower timeframes while keeping a tight Stop Loss below the daily spike low. The arrow is already set, and the risk/reward ratio is excellent. 🛡️
$72,000? Share your plan in the comments. 👇
#Bitcoin #Trading #TechnicalAnalysis #OrderFlow #DYOR
{future}(BTCUSDT)
Identifying retail capitulation zones and institutional absorption is key to getting ahead of major market turns.
I'm sharing the technical map behind my limit buy order in Spot at $BTC 60k and my plan to look for Long positions in futures. 📊
🚨Institutional Absorption (1D): The price dropped sharply to the psychological and technical support at $60,000. What's interesting here is the volume: a massive spike was printed, but the price stopped falling. This indicates strong absorption by passive buyers (limit orders) that halted aggressive market sellers in their tracks.
⚡Confluence and Reversal (4H): Dropping to the 4-hour chart, the structure confirms seller exhaustion. The price aligns exactly with the LVA (Low Value Area) of the Volume Profile and shows a clear bullish divergence in both the MACD and RSI. Technically, the odds point to a rebound through mean reversion.
Targets and Liquidity Magnets: The first macro target is at the $72,000 zone, where two massive liquidity magnets converge: the 200 EMA and the Annual VWAP. Once we reach that level, we will evaluate price action under two scenarios:
Optimistic Scenario: Enough strength to target the main POC in the $81,000 zone and liquidate the bears.
Range Scenario: A rejection at $72,000 for a shallower correction before retesting the low liquidity.
🔥The Play / Execution Strategy: Spot order executed at $60,000. For futures, I will wait for confirmation triggers on lower timeframes while keeping a tight Stop Loss below the daily spike low. The arrow is already set, and the risk/reward ratio is excellent. 🛡️
$72,000? Share your plan in the comments. 👇
#Bitcoin #Trading #TechnicalAnalysis #OrderFlow #DYOR
1
1
255
·
--
Bearish
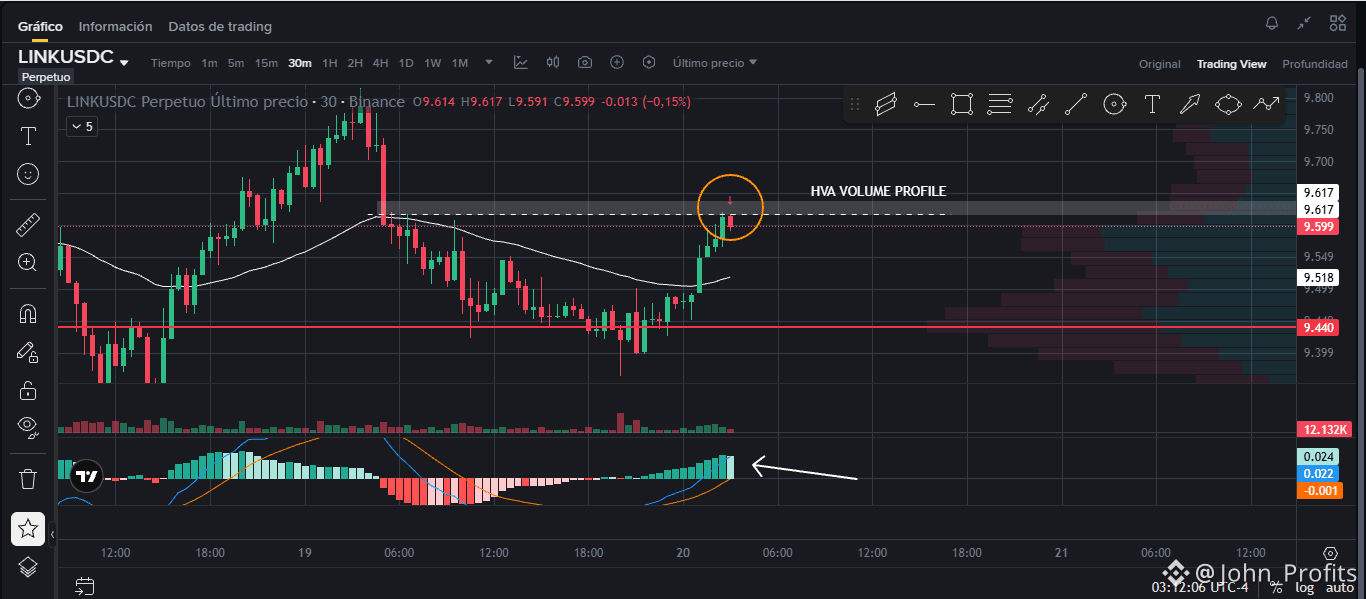
Managing risk through multi-timeframe analysis allows for technical precision in volatile markets. I'm sharing the technical details of my short entry for $LINK . 📊
Confluence Zones (30M): After a strong bullish impulse, the price halted exactly at the resistance of $9,622. This level coincides with the HVA (High Volume Area) of the Volume Profile, a zone of high institutional order density. The MACD has already printed its first deceleration bar. My bias is bearish.
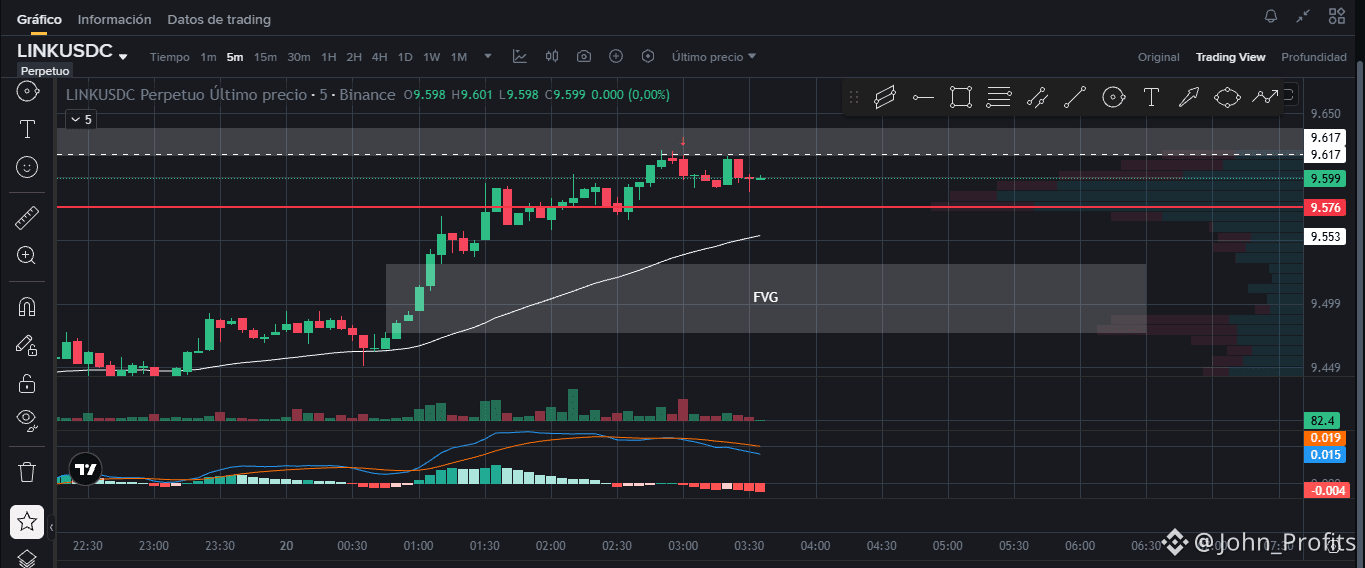
Entry Trigger (5M): Dropping down to 5 minutes, the loss of momentum was confirmed with a bearish cross on the MACD and rejection in the key zone. Although this is a premature entry, the operational benefit is direct: it allows for a tight Stop Loss placement.
Projection & Mitigation: The market seeks to correct imbalances. The main technical target is for the price to retrace to mitigate the fresh FVG (Fair Value Gap) left on the 5M, aiming for the $9.5 zone.
The Play / Execution Strategy:
Short position executed based on technical analysis (resistance) with confluence from the HVA and the MACD cross in a lower timeframe. The Stop Loss is placed tight just above the high at $9.625 to maximize the R:R ratio. Target set at $9.5 🛡️
Do you prefer to anticipate the move with a tight Stop Loss like in this setup, or do you wait for a formal structural break? I look forward to your thoughts below. 👇
#Chainlink #Trading #TechnicalAnalysis #TradingSignals #dyor
{spot}(LINKUSDT)
Managing risk through multi-timeframe analysis allows for technical precision in volatile markets. I'm sharing the technical details of my short entry for $LINK . 📊
Confluence Zones (30M): After a strong bullish impulse, the price halted exactly at the resistance of $9,622. This level coincides with the HVA (High Volume Area) of the Volume Profile, a zone of high institutional order density. The MACD has already printed its first deceleration bar. My bias is bearish.
Entry Trigger (5M): Dropping down to 5 minutes, the loss of momentum was confirmed with a bearish cross on the MACD and rejection in the key zone. Although this is a premature entry, the operational benefit is direct: it allows for a tight Stop Loss placement.
Projection & Mitigation: The market seeks to correct imbalances. The main technical target is for the price to retrace to mitigate the fresh FVG (Fair Value Gap) left on the 5M, aiming for the $9.5 zone.
The Play / Execution Strategy:
Short position executed based on technical analysis (resistance) with confluence from the HVA and the MACD cross in a lower timeframe. The Stop Loss is placed tight just above the high at $9.625 to maximize the R:R ratio. Target set at $9.5 🛡️
Do you prefer to anticipate the move with a tight Stop Loss like in this setup, or do you wait for a formal structural break? I look forward to your thoughts below. 👇
#Chainlink #Trading #TechnicalAnalysis #TradingSignals #dyor
1
233
·
--
Bullish
⏳ Waiting is also trading.
In trading, knowing how to wait can be more profitable than any technical strategy.
Waiting for the price, structure, your "buy low" zone or "sell high" zone, and your mind to align.
Waiting for the market to speak to you… and not forcing what does not yet exist.
📉 Entering too early is not anticipation, it is anxiety.
📈 Having the patience to let the trade come to you is a skill that few master.
"Money is made by waiting, not trading."
— Jesse Livermore, world trading reference
That phrase is not just philosophy, it is emotional management and tactical precision.
Patience filters out the noise, reduces mistakes, and strengthens your discipline.
It is what separates the reactive trader from the professional trader.
💬 Do you know how to wait, or does the market make you anxious?$BTC
I read you.
3
201
·
--
Bullish
Close $ZEC with almost a 1000% profit. Click the post below on how to set up the trade.
What do you think of this analysis?
#TradingCommunity #TradingSignals
Close $ZEC with almost a 1000% profit. Click the post below on how to set up the trade.
What do you think of this analysis?
#TradingCommunity #TradingSignals
What do you think of this analysis?
#TradingCommunity #TradingSignals
Anonymous who
·
--
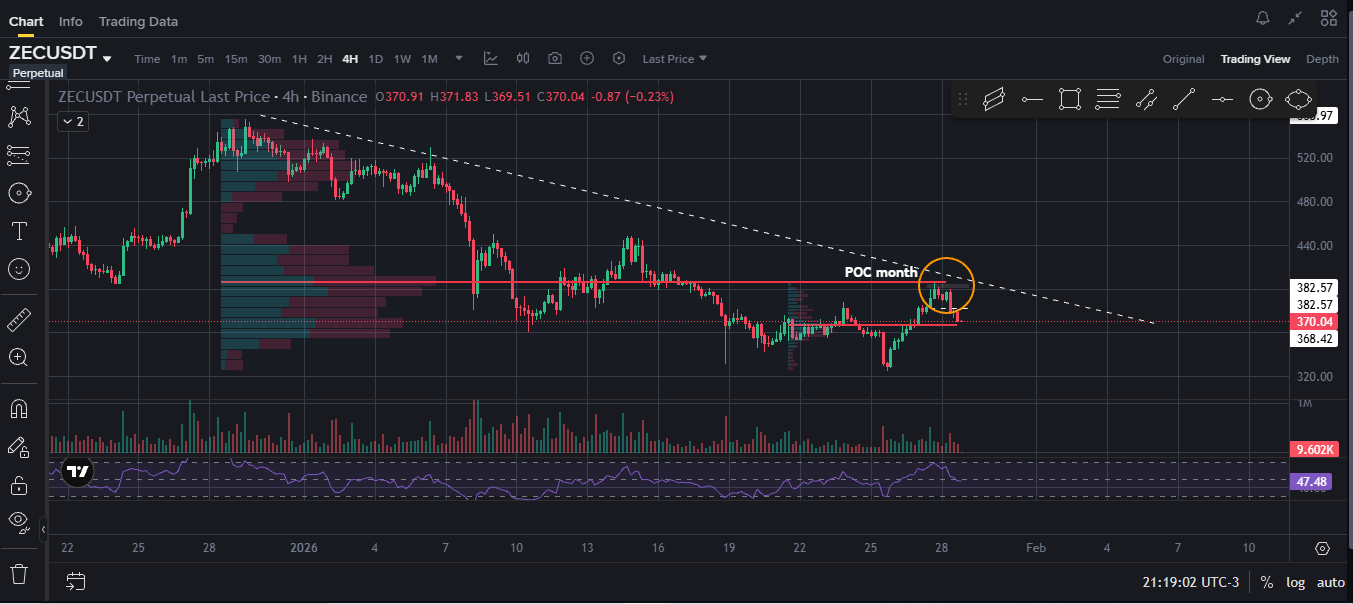
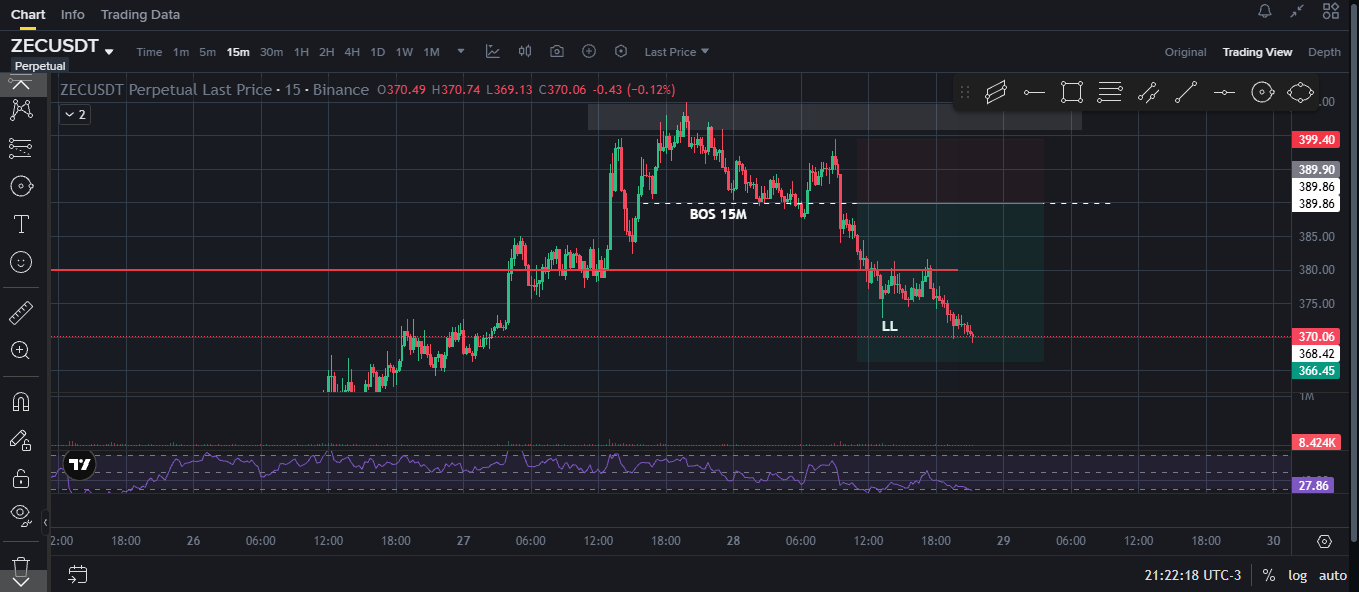
BearishMake a short film at $ZEC
I'm sharing the summary of the analysis for the setup. No signals, just real structure and technical context.
🔍 What did I see on the chart?
— In 4H, the price approaches the monthly POC and the upper part of a downward channel
— This confluence makes me think of a possible reversal, especially when adding an overbought RSI
— The structure indicates that the momentum could be losing strength
📉 In 15M:
— The price clearly rejects the area of $400, which also acts as a psychological resistance ("zeros") leaving a consolidation area that I hope will act as resistance for the SL
— A bearish Break of Structure (BOS) and an internal Lower Low (LL) are formed ➤ that was my entry trigger
🎯 TP1: before the weekly POC, at $366
🛡️ SL: already moved to Break Even (BE) after confirmation of the movement by leaving a new LL
💬 What do you think of this setup?
#TradingSignals #TradingCommunity
1
686
·
--
Bullish
🟠 Bitcoin is not broken. It is doing what it was created to do: resist.
Many see it only as a volatile asset, but few understand its essence:
Bitcoin is not a bet. It is a programmed store of value.
🔐 It does not depend on banks.
🛑 It cannot be censored.
💰 No one can print more.
🧮 Its supply is limited to 21 million… and over 93% has already been mined.
That changes everything.
In a world where currencies are devalued, the currency that has been the world's store of value is in a steep decline, the Trump administration pressures for tax cuts, central banks adjust in their favor, and inflation eats away at savings, Bitcoin does not adjust: it holds steady.
📉 And the price drops?
They are part of the cycle. They do not invalidate it; they confirm it.
Historically, every major pullback has been followed by new highs.
Not because it's magic, but because its proposition has not changed:
Scarcity, decentralization, and time.
When other assets crumble in the face of uncertainty, Bitcoin gains relevance.
That’s why many see it as “digital gold,” but with unique advantages:
✅ Easier to transfer
✅ More divisible
✅ More accessible
✅ More transparent
💡 If you understand its logic, the drops no longer look like losses…
They look like discounted opportunities.
💬 How do you face the pullbacks of $BTC ?
#BTC
Do you accumulate, hold, or keep waiting for a perfect entry?
Share your strategy👇 I’m reading. #TradingCommunity
{spot}(BTCUSDT)
{future}(BTCUSDT)
🟠 Bitcoin is not broken. It is doing what it was created to do: resist.
Many see it only as a volatile asset, but few understand its essence:
Bitcoin is not a bet. It is a programmed store of value.
🔐 It does not depend on banks.
🛑 It cannot be censored.
💰 No one can print more.
🧮 Its supply is limited to 21 million… and over 93% has already been mined.
That changes everything.
In a world where currencies are devalued, the currency that has been the world's store of value is in a steep decline, the Trump administration pressures for tax cuts, central banks adjust in their favor, and inflation eats away at savings, Bitcoin does not adjust: it holds steady.
📉 And the price drops?
They are part of the cycle. They do not invalidate it; they confirm it.
Historically, every major pullback has been followed by new highs.
Not because it's magic, but because its proposition has not changed:
Scarcity, decentralization, and time.
When other assets crumble in the face of uncertainty, Bitcoin gains relevance.
That’s why many see it as “digital gold,” but with unique advantages:
✅ Easier to transfer
✅ More divisible
✅ More accessible
✅ More transparent
💡 If you understand its logic, the drops no longer look like losses…
They look like discounted opportunities.
💬 How do you face the pullbacks of $BTC ?
#BTC
Do you accumulate, hold, or keep waiting for a perfect entry?
Share your strategy👇 I’m reading. #TradingCommunity
2
192
Log in to explore more content
Join global crypto users on Binance Square
⚡️ Get latest and useful information about crypto.
💬 Trusted by the world’s largest crypto exchange.
👍 Discover real insights from verified creators.
Email / Phone number