
定投30年
120 Posts

定投30年
Report
Block User
一个普通程序员,坚持定投比特币,记录财富增长的全过程
Open Trade
Frequent Trader
6.3 Months
5 Following
3 Followers
1 Liked
Posts
Portfolio
All
Videos
·
--
$ARB is one of the few major coins trading in the green today.
Binance data as of 22:04 (Beijing time): $ARB spot was around 0.1686 USDT, up 3.56% over 24 hours; over the same period, $BTC was around 75,719, down 4.91%. ARB rebounded about 12.3% from its intraday low of 0.1501 and is now near its high of 0.1699.
The futures side is worth a closer look: ARBUSDT perpetual open interest (in tokens) rose from about 226 million at 17:00 to about 244 million at 22:00, an increase of roughly 8% in five hours. The funding rate is 0.01%, right around its default level. But in the past few hours, the taker buy/sell ratio has stayed below 1. During the 21:00 hour, taker sells totaled about 12.09 million tokens versus roughly 8.6 million in taker buys.
Prices are rising and positions are growing, but taker flow still leans toward selling. This suggests that some traders are adding to positions during the rally, while others are taking profits through market sells. For spot, relative strength is all you need to watch; in futures, don't treat a "green move against the trend" as a one-way signal.
Data from Binance spot tickers and public futures endpoints. Not investment advice.
$ARB $BTC
$ARB is one of the few major coins trading in the green today.
Binance data as of 22:04 (Beijing time): $ARB spot was around 0.1686 USDT, up 3.56% over 24 hours; over the same period, $BTC was around 75,719, down 4.91%. ARB rebounded about 12.3% from its intraday low of 0.1501 and is now near its high of 0.1699.
The futures side is worth a closer look: ARBUSDT perpetual open interest (in tokens) rose from about 226 million at 17:00 to about 244 million at 22:00, an increase of roughly 8% in five hours. The funding rate is 0.01%, right around its default level. But in the past few hours, the taker buy/sell ratio has stayed below 1. During the 21:00 hour, taker sells totaled about 12.09 million tokens versus roughly 8.6 million in taker buys.
Prices are rising and positions are growing, but taker flow still leans toward selling. This suggests that some traders are adding to positions during the rally, while others are taking profits through market sells. For spot, relative strength is all you need to watch; in futures, don't treat a "green move against the trend" as a one-way signal.
Data from Binance spot tickers and public futures endpoints. Not investment advice.
$ARB $BTC
Binance data as of 22:04 (Beijing time): $ARB spot was around 0.1686 USDT, up 3.56% over 24 hours; over the same period, $BTC was around 75,719, down 4.91%. ARB rebounded about 12.3% from its intraday low of 0.1501 and is now near its high of 0.1699.
The futures side is worth a closer look: ARBUSDT perpetual open interest (in tokens) rose from about 226 million at 17:00 to about 244 million at 22:00, an increase of roughly 8% in five hours. The funding rate is 0.01%, right around its default level. But in the past few hours, the taker buy/sell ratio has stayed below 1. During the 21:00 hour, taker sells totaled about 12.09 million tokens versus roughly 8.6 million in taker buys.
Prices are rising and positions are growing, but taker flow still leans toward selling. This suggests that some traders are adding to positions during the rally, while others are taking profits through market sells. For spot, relative strength is all you need to watch; in futures, don't treat a "green move against the trend" as a one-way signal.
Data from Binance spot tickers and public futures endpoints. Not investment advice.
$ARB $BTC
4
·
--
When watching $BTC, don’t focus on just one price move.
As of 20:21 Beijing time, the current price on Binance was 76,211.74 USDT, down about 4.9% over 24 hours. But from 75,615.55 at 15:00 to the current price, it has rebounded about 0.79%.
A rebound within a downtrend is not the same as a trend reversal.
For spot trading, you can buy in batches at your own pace. For futures, calculate your liquidation distance first. The current price is still about 5.16% below the 24-hour high of 80,180.01.
Market data source: Binance public spot market and 1-hour candlesticks, snapshot at 20:21. For market information only; not investment advice.
When watching $BTC , don’t focus on just one price move.
As of 20:21 Beijing time, the current price on Binance was 76,211.74 USDT, down about 4.9% over 24 hours. But from 75,615.55 at 15:00 to the current price, it has rebounded about 0.79%.
A rebound within a downtrend is not the same as a trend reversal.
For spot trading, you can buy in batches at your own pace. For futures, calculate your liquidation distance first. The current price is still about 5.16% below the 24-hour high of 80,180.01.
Market data source: Binance public spot market and 1-hour candlesticks, snapshot at 20:21. For market information only; not investment advice.
As of 20:21 Beijing time, the current price on Binance was 76,211.74 USDT, down about 4.9% over 24 hours. But from 75,615.55 at 15:00 to the current price, it has rebounded about 0.79%.
A rebound within a downtrend is not the same as a trend reversal.
For spot trading, you can buy in batches at your own pace. For futures, calculate your liquidation distance first. The current price is still about 5.16% below the 24-hour high of 80,180.01.
Market data source: Binance public spot market and 1-hour candlesticks, snapshot at 20:21. For market information only; not investment advice.
93
·
--
Invest the same $10,000 each year in the S&P 500 for 30 years, with just one difference: the management fee.
Invest at the beginning of each year from 1996 through the end of 2025 (including dividends).
Index fund with a 0.03% fee:
Principal: $300,000
End of 2005 → $137,000
End of 2015 → $451,000
End of 2025 → $2,027,000
Fund with a 1.5% fee:
Principal: $300,000
End of 2005 → $125,000
End of 2015 → $377,000
End of 2025 → $1,508,000
That’s a difference of just 1.47% per year, but after 30 years you end up with $519,000 less.
The amount lost is far more than the principal.
That money goes to the fund companies.
Data: Slickcharts S&P 500 annual total returns. Fees deducted annually. Taxes, exchange rates, and inflation not included. Past performance does not guarantee future results. This is not investment advice.
Invest the same $10,000 each year in the S&P 500 for 30 years, with just one difference: the management fee.
Invest at the beginning of each year from 1996 through the end of 2025 (including dividends).
Index fund with a 0.03% fee:
Principal: $300,000
End of 2005 → $137,000
End of 2015 → $451,000
End of 2025 → $2,027,000
Fund with a 1.5% fee:
Principal: $300,000
End of 2005 → $125,000
End of 2015 → $377,000
End of 2025 → $1,508,000
That’s a difference of just 1.47% per year, but after 30 years you end up with $519,000 less.
The amount lost is far more than the principal.
That money goes to the fund companies.
Data: Slickcharts S&P 500 annual total returns. Fees deducted annually. Taxes, exchange rates, and inflation not included. Past performance does not guarantee future results. This is not investment advice.
Invest at the beginning of each year from 1996 through the end of 2025 (including dividends).
Index fund with a 0.03% fee:
Principal: $300,000
End of 2005 → $137,000
End of 2015 → $451,000
End of 2025 → $2,027,000
Fund with a 1.5% fee:
Principal: $300,000
End of 2005 → $125,000
End of 2015 → $377,000
End of 2025 → $1,508,000
That’s a difference of just 1.47% per year, but after 30 years you end up with $519,000 less.
The amount lost is far more than the principal.
That money goes to the fund companies.
Data: Slickcharts S&P 500 annual total returns. Fees deducted annually. Taxes, exchange rates, and inflation not included. Past performance does not guarantee future results. This is not investment advice.
25
·
--
Invest 10 years earlier, then stop—or start 10 years later and keep investing until today: who ends up with more?
Invest $10,000 at the beginning of each year in the S&P 500 (including dividends), through the end of 2025.
Started in 1995, invested for 10 years, then never added another dollar:
Principal: $100,000
End of 2004 → $152,000
End of 2008 → $123,000
End of 2019 → $554,000
End of 2025 → $1.288 million
Started in 2005, invested every year for 21 years without missing a year:
Principal: $210,000
End of 2008 → $29,000 (with $40,000 invested so far)
End of 2013 → $151,000
End of 2019 → $393,000
End of 2025 → $1.016 million
They invested twice as much principal, yet ended up $272,000 behind.
Twenty-one years of persistence couldn't catch up with someone else's 10-year head start.
Most people can't stick with it for even 21 years.
Data: Slickcharts annual total returns for the S&P 500; investments made at the beginning of each year. Excludes taxes, fees, currency effects, and inflation. Past performance does not guarantee future results. This is not investment advice.
#定投 #标普500 #USStocks
Invest 10 years earlier, then stop—or start 10 years later and keep investing until today: who ends up with more?
Invest $10,000 at the beginning of each year in the S&P 500 (including dividends), through the end of 2025.
Started in 1995, invested for 10 years, then never added another dollar:
Principal: $100,000
End of 2004 → $152,000
End of 2008 → $123,000
End of 2019 → $554,000
End of 2025 → $1.288 million
Started in 2005, invested every year for 21 years without missing a year:
Principal: $210,000
End of 2008 → $29,000 (with $40,000 invested so far)
End of 2013 → $151,000
End of 2019 → $393,000
End of 2025 → $1.016 million
They invested twice as much principal, yet ended up $272,000 behind.
Twenty-one years of persistence couldn't catch up with someone else's 10-year head start.
Most people can't stick with it for even 21 years.
Data: Slickcharts annual total returns for the S&P 500; investments made at the beginning of each year. Excludes taxes, fees, currency effects, and inflation. Past performance does not guarantee future results. This is not investment advice.
#定投 #标普500 #USStocks
Invest $10,000 at the beginning of each year in the S&P 500 (including dividends), through the end of 2025.
Started in 1995, invested for 10 years, then never added another dollar:
Principal: $100,000
End of 2004 → $152,000
End of 2008 → $123,000
End of 2019 → $554,000
End of 2025 → $1.288 million
Started in 2005, invested every year for 21 years without missing a year:
Principal: $210,000
End of 2008 → $29,000 (with $40,000 invested so far)
End of 2013 → $151,000
End of 2019 → $393,000
End of 2025 → $1.016 million
They invested twice as much principal, yet ended up $272,000 behind.
Twenty-one years of persistence couldn't catch up with someone else's 10-year head start.
Most people can't stick with it for even 21 years.
Data: Slickcharts annual total returns for the S&P 500; investments made at the beginning of each year. Excludes taxes, fees, currency effects, and inflation. Past performance does not guarantee future results. This is not investment advice.
#定投 #标普500 #USStocks
18
·
--
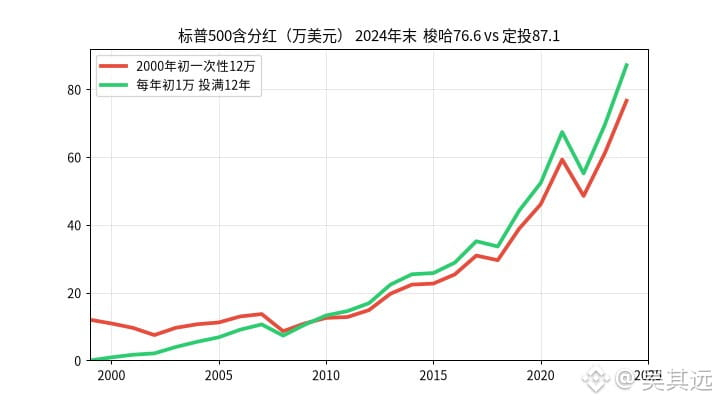
Dollar-cost averaging isn’t about making more money; it’s about still having ammunition when the market is at its peak.
At the start of 2000, invest the same $120,000 in the S&P 500 (including dividends).
The person who invested it all at once:
End of 2000 → $109,000
End of 2002 → $75,000
End of 2005 → $112,000
End of 2008 → $86,000
End of 2011 → $128,000
The person who invested $10,000 at the start of each year for 12 years:
End of 2000: invested $10,000 → $9,000
End of 2002: invested $30,000 → $21,000
End of 2005: invested $60,000 → $68,000
End of 2008: invested $90,000 → $73,000
End of 2011: invested $120,000 → $146,000
End of 2024 → $871,000
(The all-at-once investor had $766,000 at the end of 2024.)
The all-at-once investor was still in the red at the end of 2009 ($109,000).
The dollar-cost averager was hit hard in 2008, but had pulled ahead by 2010.
Same $120,000 initial investment, but a difference of $105,000.
Data: Slickcharts annual total returns for the S&P 500; investments made at the start of each year; taxes, fees, and exchange rates not included. Past performance does not guarantee future results. This is not investment advice.
#定投 #标普500 #USStocks
Dollar-cost averaging isn’t about making more money; it’s about still having ammunition when the market is at its peak.
At the start of 2000, invest the same $120,000 in the S&P 500 (including dividends).
The person who invested it all at once:
End of 2000 → $109,000
End of 2002 → $75,000
End of 2005 → $112,000
End of 2008 → $86,000
End of 2011 → $128,000
The person who invested $10,000 at the start of each year for 12 years:
End of 2000: invested $10,000 → $9,000
End of 2002: invested $30,000 → $21,000
End of 2005: invested $60,000 → $68,000
End of 2008: invested $90,000 → $73,000
End of 2011: invested $120,000 → $146,000
End of 2024 → $871,000
(The all-at-once investor had $766,000 at the end of 2024.)
The all-at-once investor was still in the red at the end of 2009 ($109,000).
The dollar-cost averager was hit hard in 2008, but had pulled ahead by 2010.
Same $120,000 initial investment, but a difference of $105,000.
Data: Slickcharts annual total returns for the S&P 500; investments made at the start of each year; taxes, fees, and exchange rates not included. Past performance does not guarantee future results. This is not investment advice.
#定投 #标普500 #USStocks
At the start of 2000, invest the same $120,000 in the S&P 500 (including dividends).
The person who invested it all at once:
End of 2000 → $109,000
End of 2002 → $75,000
End of 2005 → $112,000
End of 2008 → $86,000
End of 2011 → $128,000
The person who invested $10,000 at the start of each year for 12 years:
End of 2000: invested $10,000 → $9,000
End of 2002: invested $30,000 → $21,000
End of 2005: invested $60,000 → $68,000
End of 2008: invested $90,000 → $73,000
End of 2011: invested $120,000 → $146,000
End of 2024 → $871,000
(The all-at-once investor had $766,000 at the end of 2024.)
The all-at-once investor was still in the red at the end of 2009 ($109,000).
The dollar-cost averager was hit hard in 2008, but had pulled ahead by 2010.
Same $120,000 initial investment, but a difference of $105,000.
Data: Slickcharts annual total returns for the S&P 500; investments made at the start of each year; taxes, fees, and exchange rates not included. Past performance does not guarantee future results. This is not investment advice.
#定投 #标普500 #USStocks
21
·
--
Starting in 2007, invest $10,000 at the beginning of each year in the S&P 500 (including dividends).
In 2008, it fell 37%, and the $20,000 in the account shrank to $13,000.
Two people went their separate ways that year.
The one who stopped investing regularly and switched to holding cash:
End of 2009: Contributions $30,000 → $26,000
End of 2012: Contributions $60,000 → $62,000
End of 2016: Contributions $100,000 → $118,000
End of 2020: Contributions $140,000 → $189,000
End of 2024: Contributions $180,000 → $275,000
The one who gritted their teeth and kept investing regularly:
End of 2009: Contributions $30,000 → $29,000
End of 2012: Contributions $60,000 → $77,000
End of 2016: Contributions $100,000 → $183,000
End of 2020: Contributions $140,000 → $393,000
End of 2024: Contributions $180,000 → $712,000
Both put in $180,000, but the difference was $437,000.
The turning point was not stopping in early 2009.
Based on the S&P 500’s annual total returns including dividends, with investments made at the beginning of each year. Cash earns 0% interest. Taxes and exchange rates are excluded. Past performance does not indicate future results and this is not investment advice.
#定投 #标普500 #USStocks
Starting in 2007, invest $10,000 at the beginning of each year in the S&P 500 (including dividends).
In 2008, it fell 37%, and the $20,000 in the account shrank to $13,000.
Two people went their separate ways that year.
The one who stopped investing regularly and switched to holding cash:
End of 2009: Contributions $30,000 → $26,000
End of 2012: Contributions $60,000 → $62,000
End of 2016: Contributions $100,000 → $118,000
End of 2020: Contributions $140,000 → $189,000
End of 2024: Contributions $180,000 → $275,000
The one who gritted their teeth and kept investing regularly:
End of 2009: Contributions $30,000 → $29,000
End of 2012: Contributions $60,000 → $77,000
End of 2016: Contributions $100,000 → $183,000
End of 2020: Contributions $140,000 → $393,000
End of 2024: Contributions $180,000 → $712,000
Both put in $180,000, but the difference was $437,000.
The turning point was not stopping in early 2009.
Based on the S&P 500’s annual total returns including dividends, with investments made at the beginning of each year. Cash earns 0% interest. Taxes and exchange rates are excluded. Past performance does not indicate future results and this is not investment advice.
#定投 #标普500 #USStocks
In 2008, it fell 37%, and the $20,000 in the account shrank to $13,000.
Two people went their separate ways that year.
The one who stopped investing regularly and switched to holding cash:
End of 2009: Contributions $30,000 → $26,000
End of 2012: Contributions $60,000 → $62,000
End of 2016: Contributions $100,000 → $118,000
End of 2020: Contributions $140,000 → $189,000
End of 2024: Contributions $180,000 → $275,000
The one who gritted their teeth and kept investing regularly:
End of 2009: Contributions $30,000 → $29,000
End of 2012: Contributions $60,000 → $77,000
End of 2016: Contributions $100,000 → $183,000
End of 2020: Contributions $140,000 → $393,000
End of 2024: Contributions $180,000 → $712,000
Both put in $180,000, but the difference was $437,000.
The turning point was not stopping in early 2009.
Based on the S&P 500’s annual total returns including dividends, with investments made at the beginning of each year. Cash earns 0% interest. Taxes and exchange rates are excluded. Past performance does not indicate future results and this is not investment advice.
#定投 #标普500 #USStocks
14
·
--
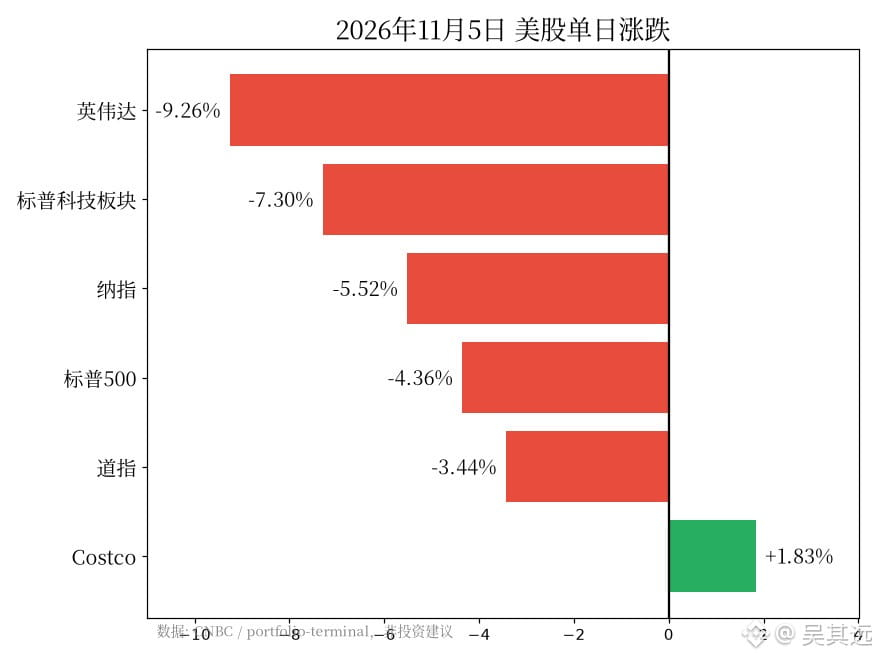
Thursday, November 5: one day on Wall Street
Nasdaq -5.52%
S&P 500 -4.36%
Dow -3.44%
Nvidia -9.26%
S&P tech sector -7.30%, its worst day since March 2020
The Magnificent Seven lost over $1 trillion in market value in a single day
Meanwhile, on the other side:
Costco +1.83%
416 NYSE stocks rose, while 2,344 fell
Nvidia is down for the year, -2.6%
The S&P closed at 7353.73, just 5.95% below its October 6 record high
The Nasdaq is more than 10% below its October 6 high, entering correction territory
The tech sector had its worst day since March 2020, while the S&P is still just 6% off its high.
Those panicking are the ones who went all-in chasing AI. Those investing a fixed amount in the S&P every month bought near the lowest closing price since July 29.
Data: CNBC, portfolio-terminal closing statistics for November 5. Not investment advice.
#美股 #英伟达 #Nasdaq
Thursday, November 5: one day on Wall Street
Nasdaq -5.52%
S&P 500 -4.36%
Dow -3.44%
Nvidia -9.26%
S&P tech sector -7.30%, its worst day since March 2020
The Magnificent Seven lost over $1 trillion in market value in a single day
Meanwhile, on the other side:
Costco +1.83%
416 NYSE stocks rose, while 2,344 fell
Nvidia is down for the year, -2.6%
The S&P closed at 7353.73, just 5.95% below its October 6 record high
The Nasdaq is more than 10% below its October 6 high, entering correction territory
The tech sector had its worst day since March 2020, while the S&P is still just 6% off its high.
Those panicking are the ones who went all-in chasing AI. Those investing a fixed amount in the S&P every month bought near the lowest closing price since July 29.
Data: CNBC, portfolio-terminal closing statistics for November 5. Not investment advice.
#美股 #英伟达 #Nasdaq
Nasdaq -5.52%
S&P 500 -4.36%
Dow -3.44%
Nvidia -9.26%
S&P tech sector -7.30%, its worst day since March 2020
The Magnificent Seven lost over $1 trillion in market value in a single day
Meanwhile, on the other side:
Costco +1.83%
416 NYSE stocks rose, while 2,344 fell
Nvidia is down for the year, -2.6%
The S&P closed at 7353.73, just 5.95% below its October 6 record high
The Nasdaq is more than 10% below its October 6 high, entering correction territory
The tech sector had its worst day since March 2020, while the S&P is still just 6% off its high.
Those panicking are the ones who went all-in chasing AI. Those investing a fixed amount in the S&P every month bought near the lowest closing price since July 29.
Data: CNBC, portfolio-terminal closing statistics for November 5. Not investment advice.
#美股 #英伟达 #Nasdaq
59
·
--
Someone who went all in on the S&P 500 with 120,000 at the start of 2000:
End of 2000: 109,000
End of 2001: 96,000
End of 2002: 75,000
End of 2006: 130,000
End of 2008: 86,000
End of 2010: 126,000
End of 2013: 197,000
The same 120,000, invested in 10,000 installments at the start of each year:
End of 2000: 9,000 (10,000 invested)
End of 2002: 21,000 (30,000 invested)
End of 2006: 91,000 (70,000 invested)
End of 2008: 73,000 (90,000 invested)
End of 2010: 133,000 (110,000 invested)
End of 2013: 224,000 (all 120,000 invested)
It pulled ahead in 2010 and stayed ahead after that.
But this is cherry-picking the worst possible starting point. Vanguard statistics show that from 1976 to 2022, lump-sum investing outperformed dollar-cost averaging about 68% of the time.
Dollar-cost averaging wins by helping you stay invested, not through the math.
Data: Slickcharts S&P 500 annual total returns (including dividends), compounded annually based on year-end figures. Not investment advice.
#定投 #标普500 #USstocks
Someone who went all in on the S&P 500 with 120,000 at the start of 2000:
End of 2000: 109,000
End of 2001: 96,000
End of 2002: 75,000
End of 2006: 130,000
End of 2008: 86,000
End of 2010: 126,000
End of 2013: 197,000
The same 120,000, invested in 10,000 installments at the start of each year:
End of 2000: 9,000 (10,000 invested)
End of 2002: 21,000 (30,000 invested)
End of 2006: 91,000 (70,000 invested)
End of 2008: 73,000 (90,000 invested)
End of 2010: 133,000 (110,000 invested)
End of 2013: 224,000 (all 120,000 invested)
It pulled ahead in 2010 and stayed ahead after that.
But this is cherry-picking the worst possible starting point. Vanguard statistics show that from 1976 to 2022, lump-sum investing outperformed dollar-cost averaging about 68% of the time.
Dollar-cost averaging wins by helping you stay invested, not through the math.
Data: Slickcharts S&P 500 annual total returns (including dividends), compounded annually based on year-end figures. Not investment advice.
#定投 #标普500 #USstocks
End of 2000: 109,000
End of 2001: 96,000
End of 2002: 75,000
End of 2006: 130,000
End of 2008: 86,000
End of 2010: 126,000
End of 2013: 197,000
The same 120,000, invested in 10,000 installments at the start of each year:
End of 2000: 9,000 (10,000 invested)
End of 2002: 21,000 (30,000 invested)
End of 2006: 91,000 (70,000 invested)
End of 2008: 73,000 (90,000 invested)
End of 2010: 133,000 (110,000 invested)
End of 2013: 224,000 (all 120,000 invested)
It pulled ahead in 2010 and stayed ahead after that.
But this is cherry-picking the worst possible starting point. Vanguard statistics show that from 1976 to 2022, lump-sum investing outperformed dollar-cost averaging about 68% of the time.
Dollar-cost averaging wins by helping you stay invested, not through the math.
Data: Slickcharts S&P 500 annual total returns (including dividends), compounded annually based on year-end figures. Not investment advice.
#定投 #标普500 #USstocks
38
·
--
Someone at the dinner table always complains: “This fund’s net asset value has more than doubled in ten years. I’ve held it for years—how come I’ve only made this much?”
The fund didn’t lie. Its net asset value assumes you put in a lump sum and leave it alone for ten years. Your account reflects every time you couldn’t resist tinkering.
Chase the rally, sell in a downturn, then switch to two hot sectors along the way—and the same fund can end up delivering two very different returns.
Brother, has your account’s actual return beaten the fund you bought?
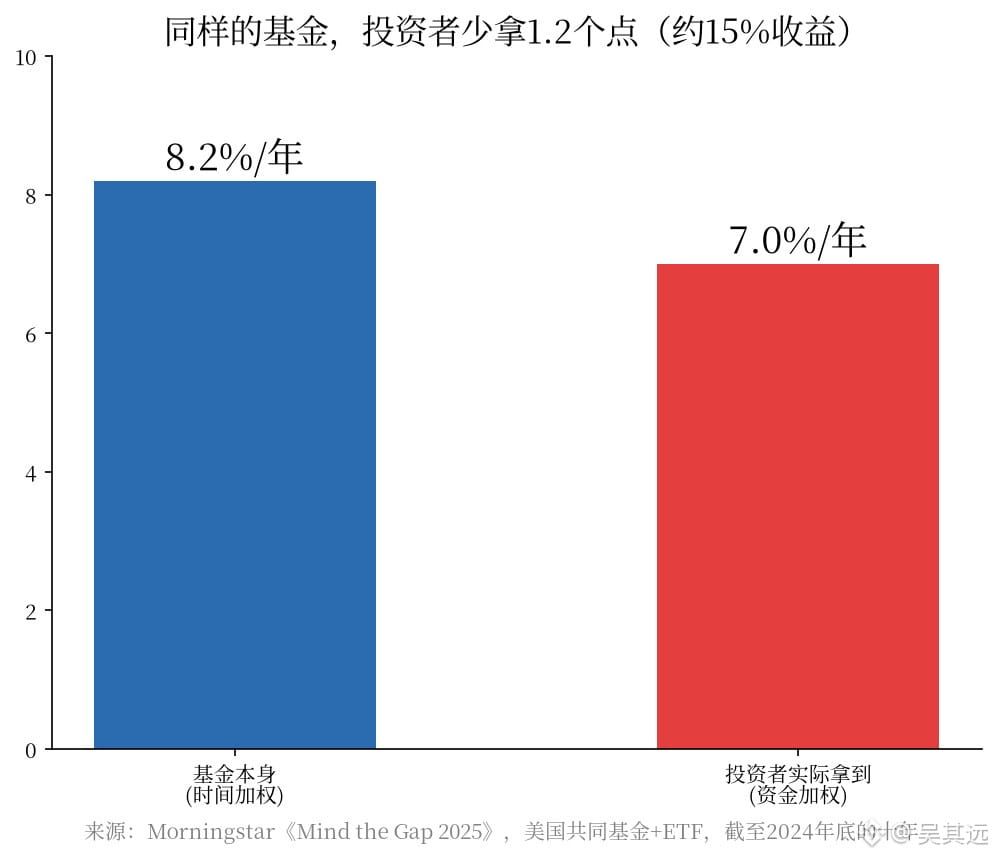
Here’s the rest. Morningstar’s 2025 Mind the Gap study tracked more than 25,000 U.S. funds and ETFs. Over the ten years through the end of 2024, the funds themselves returned 8.2% annualized, while investors’ returns—calculated from the actual money they put in and took out—were 7.0% annualized. That’s a gap of 1.2 percentage points a year, roughly 15% of the funds’ total return gone.
The breakdown stings even more. Sector and thematic funds had the biggest gap. Investors in allocation funds that mix stocks and bonds captured nearly 97% of the returns. The more exciting the investment, the harder it is for people to stay the course.
But let’s be clear about the caveats. Morningstar itself says that normal practices like investing a fixed amount from each paycheck and periodically rebalancing can also create a gap. So you can’t chalk the whole figure up to “dumb retail investors making mistakes.”
So when you’re investing regularly, keep a steady hand. Avoid impulsive trades, don’t stop when the market falls, and don’t pile in to chase gains when it rises. This is not investment advice.
#定投 #基金 #U.S. stocks
Someone at the dinner table always complains: “This fund’s net asset value has more than doubled in ten years. I’ve held it for years—how come I’ve only made this much?”
The fund didn’t lie. Its net asset value assumes you put in a lump sum and leave it alone for ten years. Your account reflects every time you couldn’t resist tinkering.
Chase the rally, sell in a downturn, then switch to two hot sectors along the way—and the same fund can end up delivering two very different returns.
Brother, has your account’s actual return beaten the fund you bought?
Here’s the rest. Morningstar’s 2025 Mind the Gap study tracked more than 25,000 U.S. funds and ETFs. Over the ten years through the end of 2024, the funds themselves returned 8.2% annualized, while investors’ returns—calculated from the actual money they put in and took out—were 7.0% annualized. That’s a gap of 1.2 percentage points a year, roughly 15% of the funds’ total return gone.
The breakdown stings even more. Sector and thematic funds had the biggest gap. Investors in allocation funds that mix stocks and bonds captured nearly 97% of the returns. The more exciting the investment, the harder it is for people to stay the course.
But let’s be clear about the caveats. Morningstar itself says that normal practices like investing a fixed amount from each paycheck and periodically rebalancing can also create a gap. So you can’t chalk the whole figure up to “dumb retail investors making mistakes.”
So when you’re investing regularly, keep a steady hand. Avoid impulsive trades, don’t stop when the market falls, and don’t pile in to chase gains when it rises. This is not investment advice.
#定投 #基金 #U.S. stocks
The fund didn’t lie. Its net asset value assumes you put in a lump sum and leave it alone for ten years. Your account reflects every time you couldn’t resist tinkering.
Chase the rally, sell in a downturn, then switch to two hot sectors along the way—and the same fund can end up delivering two very different returns.
Brother, has your account’s actual return beaten the fund you bought?
Here’s the rest. Morningstar’s 2025 Mind the Gap study tracked more than 25,000 U.S. funds and ETFs. Over the ten years through the end of 2024, the funds themselves returned 8.2% annualized, while investors’ returns—calculated from the actual money they put in and took out—were 7.0% annualized. That’s a gap of 1.2 percentage points a year, roughly 15% of the funds’ total return gone.
The breakdown stings even more. Sector and thematic funds had the biggest gap. Investors in allocation funds that mix stocks and bonds captured nearly 97% of the returns. The more exciting the investment, the harder it is for people to stay the course.
But let’s be clear about the caveats. Morningstar itself says that normal practices like investing a fixed amount from each paycheck and periodically rebalancing can also create a gap. So you can’t chalk the whole figure up to “dumb retail investors making mistakes.”
So when you’re investing regularly, keep a steady hand. Avoid impulsive trades, don’t stop when the market falls, and don’t pile in to chase gains when it rises. This is not investment advice.
#定投 #基金 #U.S. stocks
·
--
The Nasdaq plunged 5.52% overnight. The sell-off was driven by election results; the Fed was just a bystander this time.
At Thursday’s close in the U.S., the S&P 500 fell 4.36%, the Nasdaq dropped 5.52%, and the Dow slid 3.44%—the biggest one-day losses for all three indexes since April 2025. After the midterm elections, Democrats took control of Congress, and some called for a nationwide halt to data center construction. The market began worrying that AI capital spending would slow, and chip and tech stocks led the sell-off.
What made me pause was that Fed officials were still calling for further rate hikes at a “measured pace” that day, yet the two-year Treasury yield fell 11 basis points, while the 10-year yield dropped to around 4.84%. The futures market’s odds of a December rate hike also fell from over 80% to around 70%.
Investors would rather buy bonds than stick with tech stocks. For the first time, politics has put the AI investment story that has powered the U.S. stock market over the past two years on pause. Building fewer data centers could ease inflationary pressure, which could in turn have a different effect on rate-hike expectations.
October’s nonfarm payrolls report is also due tonight, with 65,000 new jobs expected.
Bro, do you think this is the start of the AI bubble losing air, or another chance to get in? Let’s discuss in the comments.
(Data from publicly available reports by Xinhua Finance, Cailian Press, Zhitong Finance, and others. This is not investment advice.)
#美股 #美联储 #AI
The Nasdaq plunged 5.52% overnight. The sell-off was driven by election results; the Fed was just a bystander this time.
At Thursday’s close in the U.S., the S&P 500 fell 4.36%, the Nasdaq dropped 5.52%, and the Dow slid 3.44%—the biggest one-day losses for all three indexes since April 2025. After the midterm elections, Democrats took control of Congress, and some called for a nationwide halt to data center construction. The market began worrying that AI capital spending would slow, and chip and tech stocks led the sell-off.
What made me pause was that Fed officials were still calling for further rate hikes at a “measured pace” that day, yet the two-year Treasury yield fell 11 basis points, while the 10-year yield dropped to around 4.84%. The futures market’s odds of a December rate hike also fell from over 80% to around 70%.
Investors would rather buy bonds than stick with tech stocks. For the first time, politics has put the AI investment story that has powered the U.S. stock market over the past two years on pause. Building fewer data centers could ease inflationary pressure, which could in turn have a different effect on rate-hike expectations.
October’s nonfarm payrolls report is also due tonight, with 65,000 new jobs expected.
Bro, do you think this is the start of the AI bubble losing air, or another chance to get in? Let’s discuss in the comments.
(Data from publicly available reports by Xinhua Finance, Cailian Press, Zhitong Finance, and others. This is not investment advice.)
#美股 #美联储 #AI
At Thursday’s close in the U.S., the S&P 500 fell 4.36%, the Nasdaq dropped 5.52%, and the Dow slid 3.44%—the biggest one-day losses for all three indexes since April 2025. After the midterm elections, Democrats took control of Congress, and some called for a nationwide halt to data center construction. The market began worrying that AI capital spending would slow, and chip and tech stocks led the sell-off.
What made me pause was that Fed officials were still calling for further rate hikes at a “measured pace” that day, yet the two-year Treasury yield fell 11 basis points, while the 10-year yield dropped to around 4.84%. The futures market’s odds of a December rate hike also fell from over 80% to around 70%.
Investors would rather buy bonds than stick with tech stocks. For the first time, politics has put the AI investment story that has powered the U.S. stock market over the past two years on pause. Building fewer data centers could ease inflationary pressure, which could in turn have a different effect on rate-hike expectations.
October’s nonfarm payrolls report is also due tonight, with 65,000 new jobs expected.
Bro, do you think this is the start of the AI bubble losing air, or another chance to get in? Let’s discuss in the comments.
(Data from publicly available reports by Xinhua Finance, Cailian Press, Zhitong Finance, and others. This is not investment advice.)
#美股 #美联储 #AI
2
·
--
It wasn’t until my 10th year of dollar-cost averaging that I realized the “buy more as it falls to lower your average cost” strategy had basically stopped working.
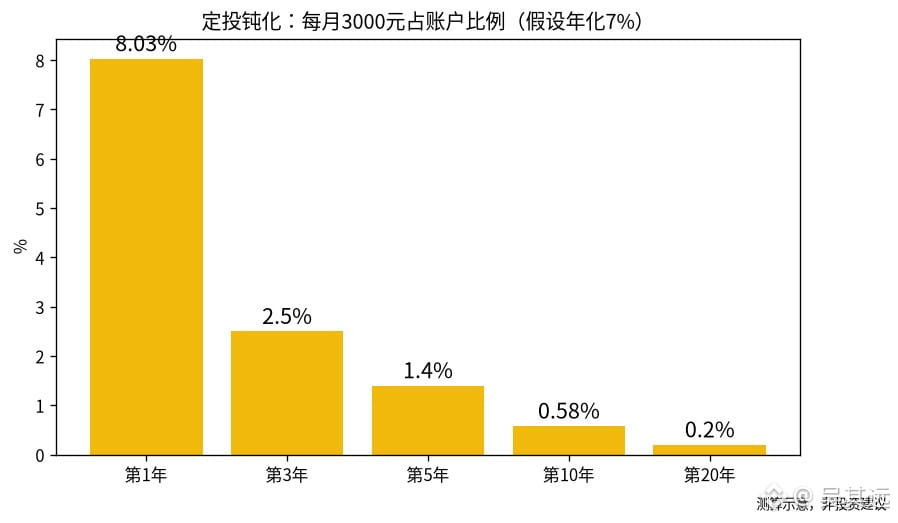
I ran the numbers assuming a monthly investment of 3,000 yuan and an annualized return of 7%, and looked at what share of the account each new monthly contribution represented:
· Year 1: one month’s contribution was about 8% of the account;
· Year 3: about 2.5%;
· Year 5: about 1.4%;
· Year 10: about 0.58%;
· Year 20: just about 0.2%.
By year 10, the account would be worth about 520,000 yuan. A 20% drawdown would mean a loss of just over 100,000 yuan—and at 3,000 yuan a month, it would take 34 months of contributions to offset that. By year 20, the account would be worth about 1.53 million yuan. The same 20% drop would take 100 months to offset.
This is what people often call “dollar-cost averaging losing its impact.” In the early years, each new contribution can noticeably lower your average cost. But over time, the account starts to resemble a lump-sum holding, with its ups and downs driven mostly by the money already invested.
So these days, I think what really matters in the later years of dollar-cost averaging is your stock-bond allocation, whether to rebalance, and when you’ll need the money—not adding a few hundred yuan more this month.
Bro, what do you think—should you keep investing the same amount on autopilot in the later years, or start adjusting your holdings? Let’s talk in the comments.
(This is an illustrative calculation based on assumptions. It does not represent the actual returns of any fund and is not investment advice.)
#定投 #基金 #LongTermism
It wasn’t until my 10th year of dollar-cost averaging that I realized the “buy more as it falls to lower your average cost” strategy had basically stopped working.
I ran the numbers assuming a monthly investment of 3,000 yuan and an annualized return of 7%, and looked at what share of the account each new monthly contribution represented:
· Year 1: one month’s contribution was about 8% of the account;
· Year 3: about 2.5%;
· Year 5: about 1.4%;
· Year 10: about 0.58%;
· Year 20: just about 0.2%.
By year 10, the account would be worth about 520,000 yuan. A 20% drawdown would mean a loss of just over 100,000 yuan—and at 3,000 yuan a month, it would take 34 months of contributions to offset that. By year 20, the account would be worth about 1.53 million yuan. The same 20% drop would take 100 months to offset.
This is what people often call “dollar-cost averaging losing its impact.” In the early years, each new contribution can noticeably lower your average cost. But over time, the account starts to resemble a lump-sum holding, with its ups and downs driven mostly by the money already invested.
So these days, I think what really matters in the later years of dollar-cost averaging is your stock-bond allocation, whether to rebalance, and when you’ll need the money—not adding a few hundred yuan more this month.
Bro, what do you think—should you keep investing the same amount on autopilot in the later years, or start adjusting your holdings? Let’s talk in the comments.
(This is an illustrative calculation based on assumptions. It does not represent the actual returns of any fund and is not investment advice.)
#定投 #基金 #LongTermism
I ran the numbers assuming a monthly investment of 3,000 yuan and an annualized return of 7%, and looked at what share of the account each new monthly contribution represented:
· Year 1: one month’s contribution was about 8% of the account;
· Year 3: about 2.5%;
· Year 5: about 1.4%;
· Year 10: about 0.58%;
· Year 20: just about 0.2%.
By year 10, the account would be worth about 520,000 yuan. A 20% drawdown would mean a loss of just over 100,000 yuan—and at 3,000 yuan a month, it would take 34 months of contributions to offset that. By year 20, the account would be worth about 1.53 million yuan. The same 20% drop would take 100 months to offset.
This is what people often call “dollar-cost averaging losing its impact.” In the early years, each new contribution can noticeably lower your average cost. But over time, the account starts to resemble a lump-sum holding, with its ups and downs driven mostly by the money already invested.
So these days, I think what really matters in the later years of dollar-cost averaging is your stock-bond allocation, whether to rebalance, and when you’ll need the money—not adding a few hundred yuan more this month.
Bro, what do you think—should you keep investing the same amount on autopilot in the later years, or start adjusting your holdings? Let’s talk in the comments.
(This is an illustrative calculation based on assumptions. It does not represent the actual returns of any fund and is not investment advice.)
#定投 #基金 #LongTermism
2
·
--
A colleague asked me: “It’s only a 1.4% management fee plus custody fee per year. Is it really worth being so stingy?”
I ran the numbers for him. Suppose two funds have the same annualized return before fees—7%:
· Invest 3,000 yuan every month for 30 years, for a total principal of 1.08 million yuan;
· With a total annual fee of 1.4%, you’d end up with about 2.73 million yuan after 30 years;
· With a total annual fee of 0.2%, you’d end up with about 3.4 million yuan after 30 years.
That’s a difference of about 670,000 yuan—nearly 60% of the principal. A 1.2-percentage-point gap in fees, compounded over 30 years, eats up about 20% of your final assets.
Where does the 1.4% come from? After China’s public fund fee reform in 2023, the cap for newly launched actively managed equity funds was set at 1.2% for management fees and 0.2% for custody fees, adding up to exactly 1.4%. Many broad-market index funds charge around 0.15% + 0.05%.
He asked again: “But actively managed funds can outperform the index.” They can—but they’d need to consistently outperform by 1.2 percentage points every year for 30 years just to break even.
Regular investing is all about the long term, and fees take the biggest toll over the long term too. The longer you leave it, the more this hidden leak drains away.
What about you—when buying a fund, do you look at the fees first, or how much it gained last year? Let’s talk in the comments.
(These calculations are illustrative assumptions only. They do not represent the actual returns of any fund and are not investment advice.)
#定投 #基金 #Long-term mindset
A colleague asked me: “It’s only a 1.4% management fee plus custody fee per year. Is it really worth being so stingy?”
I ran the numbers for him. Suppose two funds have the same annualized return before fees—7%:
· Invest 3,000 yuan every month for 30 years, for a total principal of 1.08 million yuan;
· With a total annual fee of 1.4%, you’d end up with about 2.73 million yuan after 30 years;
· With a total annual fee of 0.2%, you’d end up with about 3.4 million yuan after 30 years.
That’s a difference of about 670,000 yuan—nearly 60% of the principal. A 1.2-percentage-point gap in fees, compounded over 30 years, eats up about 20% of your final assets.
Where does the 1.4% come from? After China’s public fund fee reform in 2023, the cap for newly launched actively managed equity funds was set at 1.2% for management fees and 0.2% for custody fees, adding up to exactly 1.4%. Many broad-market index funds charge around 0.15% + 0.05%.
He asked again: “But actively managed funds can outperform the index.” They can—but they’d need to consistently outperform by 1.2 percentage points every year for 30 years just to break even.
Regular investing is all about the long term, and fees take the biggest toll over the long term too. The longer you leave it, the more this hidden leak drains away.
What about you—when buying a fund, do you look at the fees first, or how much it gained last year? Let’s talk in the comments.
(These calculations are illustrative assumptions only. They do not represent the actual returns of any fund and are not investment advice.)
#定投 #基金 #Long-term mindset
I ran the numbers for him. Suppose two funds have the same annualized return before fees—7%:
· Invest 3,000 yuan every month for 30 years, for a total principal of 1.08 million yuan;
· With a total annual fee of 1.4%, you’d end up with about 2.73 million yuan after 30 years;
· With a total annual fee of 0.2%, you’d end up with about 3.4 million yuan after 30 years.
That’s a difference of about 670,000 yuan—nearly 60% of the principal. A 1.2-percentage-point gap in fees, compounded over 30 years, eats up about 20% of your final assets.
Where does the 1.4% come from? After China’s public fund fee reform in 2023, the cap for newly launched actively managed equity funds was set at 1.2% for management fees and 0.2% for custody fees, adding up to exactly 1.4%. Many broad-market index funds charge around 0.15% + 0.05%.
He asked again: “But actively managed funds can outperform the index.” They can—but they’d need to consistently outperform by 1.2 percentage points every year for 30 years just to break even.
Regular investing is all about the long term, and fees take the biggest toll over the long term too. The longer you leave it, the more this hidden leak drains away.
What about you—when buying a fund, do you look at the fees first, or how much it gained last year? Let’s talk in the comments.
(These calculations are illustrative assumptions only. They do not represent the actual returns of any fund and are not investment advice.)
#定投 #基金 #Long-term mindset
2
·
--
Splitting a year-end bonus you already have into 12 monthly installments is probably just paying for peace of mind.
Let’s look at the data first. Vanguard’s 2023 study, “Cost averaging: Invest now or temporarily hold your cash?”, compared one-year outcomes in global equities (MSCI World, 1976–2022):
· Investing a lump sum outperformed investing it over three months about 68% of the time;
· The longer the period over which investments were spread (3, 6, or 12 months), the more often lump-sum investing came out ahead, with results ranging from 61.6% to 73.7% across different markets;
· The real advantage of spreading out investments came in the worst 5% of market outcomes: an all-equity portfolio did about 3.6% better.
A lot of people treat “dollar-cost averaging” and “investing in installments” as the same thing. With salary-based investing, you don’t really have a choice: the money comes in each month, and you invest it as soon as it arrives. In that sense, you’re investing each installment as a lump sum. But if you already have a sum of cash on hand and still split it into 12 parts, some of your money is left waiting on the sidelines, giving up the risk premium for that period.
So does investing in installments serve no purpose? Not at all. It can help ease the regret of “buying just before a big drop.” Vanguard itself acknowledges that for people who are especially afraid of losses and might sell everything as soon as the market falls, investing in installments is better than staying in cash.
So the real question to ask yourself is: Is that peace of mind worth the 68%?
Hey, what would you do with the money you have on hand—invest it all at once or spread it out? Tell us why in the comments.
(Personal observation, based on publicly available research. Past performance is not indicative of future results and this is not investment advice.)
#定投 #资产配置 #Long-termism
Splitting a year-end bonus you already have into 12 monthly installments is probably just paying for peace of mind.
Let’s look at the data first. Vanguard’s 2023 study, “Cost averaging: Invest now or temporarily hold your cash?”, compared one-year outcomes in global equities (MSCI World, 1976–2022):
· Investing a lump sum outperformed investing it over three months about 68% of the time;
· The longer the period over which investments were spread (3, 6, or 12 months), the more often lump-sum investing came out ahead, with results ranging from 61.6% to 73.7% across different markets;
· The real advantage of spreading out investments came in the worst 5% of market outcomes: an all-equity portfolio did about 3.6% better.
A lot of people treat “dollar-cost averaging” and “investing in installments” as the same thing. With salary-based investing, you don’t really have a choice: the money comes in each month, and you invest it as soon as it arrives. In that sense, you’re investing each installment as a lump sum. But if you already have a sum of cash on hand and still split it into 12 parts, some of your money is left waiting on the sidelines, giving up the risk premium for that period.
So does investing in installments serve no purpose? Not at all. It can help ease the regret of “buying just before a big drop.” Vanguard itself acknowledges that for people who are especially afraid of losses and might sell everything as soon as the market falls, investing in installments is better than staying in cash.
So the real question to ask yourself is: Is that peace of mind worth the 68%?
Hey, what would you do with the money you have on hand—invest it all at once or spread it out? Tell us why in the comments.
(Personal observation, based on publicly available research. Past performance is not indicative of future results and this is not investment advice.)
#定投 #资产配置 #Long-termism
Let’s look at the data first. Vanguard’s 2023 study, “Cost averaging: Invest now or temporarily hold your cash?”, compared one-year outcomes in global equities (MSCI World, 1976–2022):
· Investing a lump sum outperformed investing it over three months about 68% of the time;
· The longer the period over which investments were spread (3, 6, or 12 months), the more often lump-sum investing came out ahead, with results ranging from 61.6% to 73.7% across different markets;
· The real advantage of spreading out investments came in the worst 5% of market outcomes: an all-equity portfolio did about 3.6% better.
A lot of people treat “dollar-cost averaging” and “investing in installments” as the same thing. With salary-based investing, you don’t really have a choice: the money comes in each month, and you invest it as soon as it arrives. In that sense, you’re investing each installment as a lump sum. But if you already have a sum of cash on hand and still split it into 12 parts, some of your money is left waiting on the sidelines, giving up the risk premium for that period.
So does investing in installments serve no purpose? Not at all. It can help ease the regret of “buying just before a big drop.” Vanguard itself acknowledges that for people who are especially afraid of losses and might sell everything as soon as the market falls, investing in installments is better than staying in cash.
So the real question to ask yourself is: Is that peace of mind worth the 68%?
Hey, what would you do with the money you have on hand—invest it all at once or spread it out? Tell us why in the comments.
(Personal observation, based on publicly available research. Past performance is not indicative of future results and this is not investment advice.)
#定投 #资产配置 #Long-termism
2
·
--
I’ll make a bet: half the people doing regular investments who come across this post won’t stick with it for 10 years.
Let’s look at the numbers. Using Morningstar data, Baron calculated rolling monthly returns for the S&P 500 Total Return Index (January 1926 to September 2025):
· 1-year holding period: about a 76% chance of making money; worst period: -67.56%
· 10-year holding period: about 95%; worst annualized period: -4.95%
· 20-year holding period: 100%; even the worst annualized period returned 1.89%
· 30-year holding period: 100%; worst annualized period: 7.80%
People love arguing about when to buy, what to buy, and whether to wait for a pullback. The data gives a simpler answer: stretch the time horizon to 20 years, and historically there hasn’t been a single losing period.
What matters more to me is something else. The odds and the potential payoff are both on your side—but this table assumes you stay invested the whole time. In reality, regular investors have to weather drawdowns of 30% or more, like in 2008 and 2020. In 2022, the market also fell by more than 20%. Your account stays in the red for months, and everyone around you is urging you to cut your losses. Many people lose in the third year, on some night when they’re tempted to call it quits. That 100% in the table no longer has anything to do with them.
So my bet isn’t on the market—it’s on human nature. The market will probably deliver; people will probably get off the ride first.
Brother, are you betting you can stay invested for the full 20 years? Leave a year in the comments, and let’s compare notes in ten years.
(Personal observation, based on publicly available historical data. Past performance does not guarantee future results and is not investment advice.)
#定投 #标普500 #LongTermism
I’ll make a bet: half the people doing regular investments who come across this post won’t stick with it for 10 years.
Let’s look at the numbers. Using Morningstar data, Baron calculated rolling monthly returns for the S&P 500 Total Return Index (January 1926 to September 2025):
· 1-year holding period: about a 76% chance of making money; worst period: -67.56%
· 10-year holding period: about 95%; worst annualized period: -4.95%
· 20-year holding period: 100%; even the worst annualized period returned 1.89%
· 30-year holding period: 100%; worst annualized period: 7.80%
People love arguing about when to buy, what to buy, and whether to wait for a pullback. The data gives a simpler answer: stretch the time horizon to 20 years, and historically there hasn’t been a single losing period.
What matters more to me is something else. The odds and the potential payoff are both on your side—but this table assumes you stay invested the whole time. In reality, regular investors have to weather drawdowns of 30% or more, like in 2008 and 2020. In 2022, the market also fell by more than 20%. Your account stays in the red for months, and everyone around you is urging you to cut your losses. Many people lose in the third year, on some night when they’re tempted to call it quits. That 100% in the table no longer has anything to do with them.
So my bet isn’t on the market—it’s on human nature. The market will probably deliver; people will probably get off the ride first.
Brother, are you betting you can stay invested for the full 20 years? Leave a year in the comments, and let’s compare notes in ten years.
(Personal observation, based on publicly available historical data. Past performance does not guarantee future results and is not investment advice.)
#定投 #标普500 #LongTermism
Let’s look at the numbers. Using Morningstar data, Baron calculated rolling monthly returns for the S&P 500 Total Return Index (January 1926 to September 2025):
· 1-year holding period: about a 76% chance of making money; worst period: -67.56%
· 10-year holding period: about 95%; worst annualized period: -4.95%
· 20-year holding period: 100%; even the worst annualized period returned 1.89%
· 30-year holding period: 100%; worst annualized period: 7.80%
People love arguing about when to buy, what to buy, and whether to wait for a pullback. The data gives a simpler answer: stretch the time horizon to 20 years, and historically there hasn’t been a single losing period.
What matters more to me is something else. The odds and the potential payoff are both on your side—but this table assumes you stay invested the whole time. In reality, regular investors have to weather drawdowns of 30% or more, like in 2008 and 2020. In 2022, the market also fell by more than 20%. Your account stays in the red for months, and everyone around you is urging you to cut your losses. Many people lose in the third year, on some night when they’re tempted to call it quits. That 100% in the table no longer has anything to do with them.
So my bet isn’t on the market—it’s on human nature. The market will probably deliver; people will probably get off the ride first.
Brother, are you betting you can stay invested for the full 20 years? Leave a year in the comments, and let’s compare notes in ten years.
(Personal observation, based on publicly available historical data. Past performance does not guarantee future results and is not investment advice.)
#定投 #标普500 #LongTermism
18
·
--
You invest in QQQ regularly because of tech?
Many people assume: Nasdaq = tech, tech = QQQ. Take it one step further: a purer tech-sector ETF is VGT (Vanguard Information Technology). If you put the same amount into one of them, what exactly are you betting on?
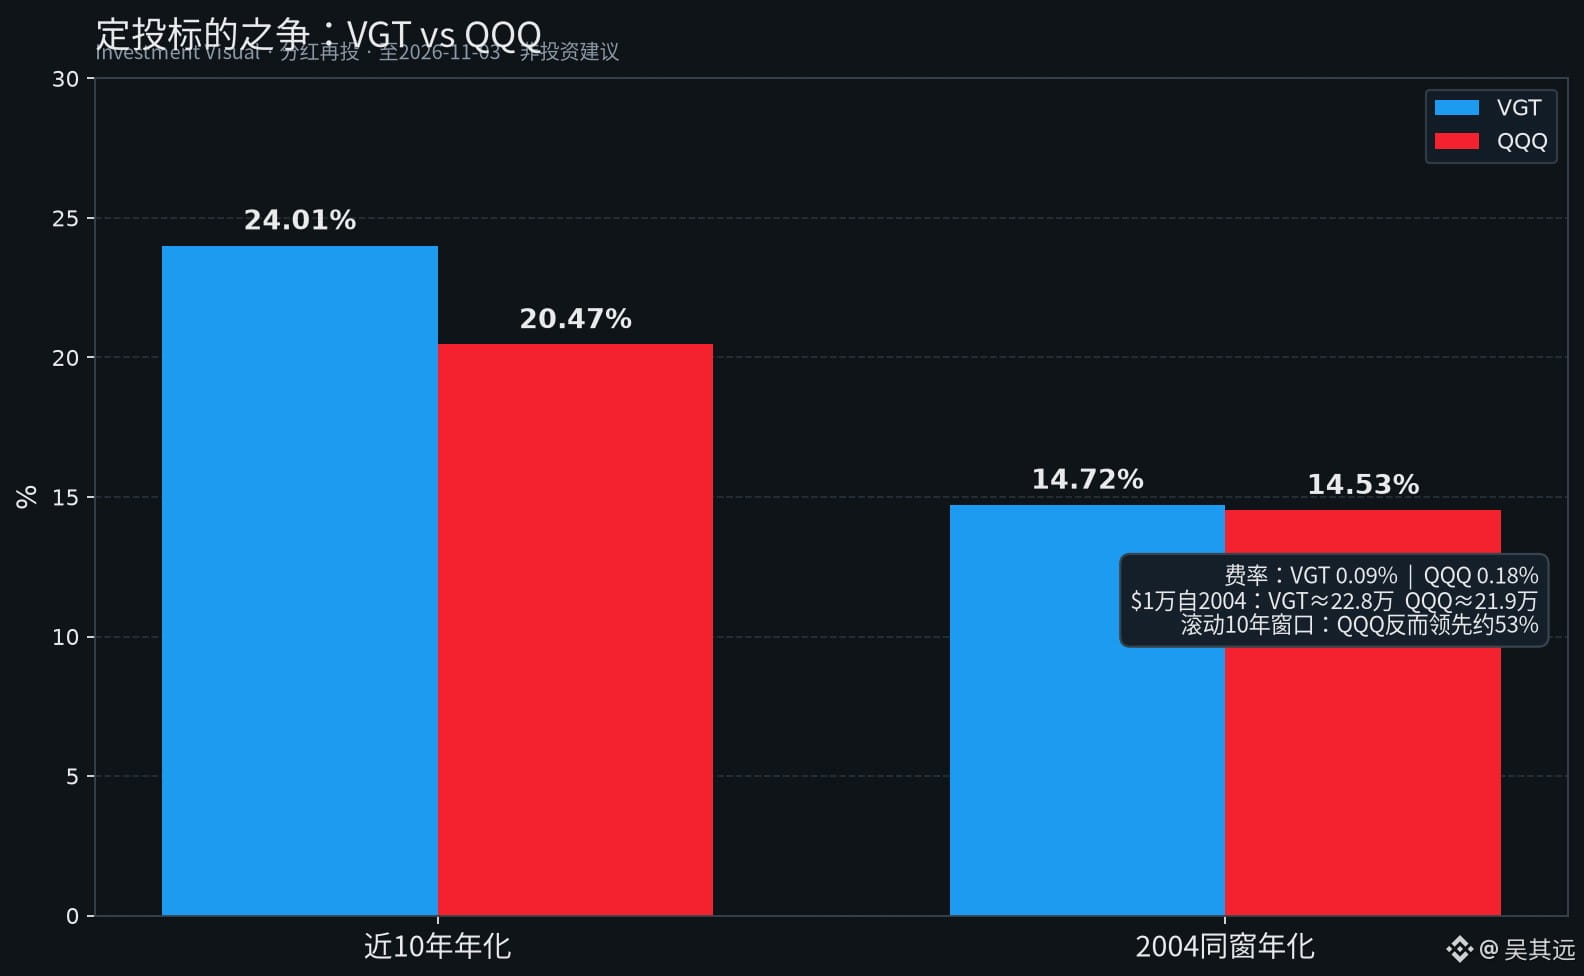
Here’s what publicly available backtests show (Investment Visual, daily closing prices with dividends reinvested, through 2026-11-03):
· Annualized return over the past 10 years: VGT about 24.01%, QQQ about 20.47%—a gap of roughly 3.5 percentage points
· From the same starting line on 2004-01-30 to today: VGT about 14.72%, QQQ about 14.53%—virtually a tie
· $10,000 invested then would be worth today: about $228,000 in VGT, $219,000 in QQQ
· Expense ratio: VGT 0.09%, QQQ 0.18% (half as much)
· Across rolling 10-year periods: QQQ actually came out ahead about 53% of the time
A common misconception is treating “who performed better over the past decade” as “which one should I invest in going forward.” VGT has had the edge over the past decade, but over the full period since they both began, the two have been neck and neck; in rolling periods, QQQ often pulls ahead. The debate over which fund to choose often comes down to the end of the sample period, not an inherent structural advantage.
One level deeper: QQQ tracks the Nasdaq-100 (which includes non-tech sectors such as consumer stocks), while VGT tracks the information technology sector. Both sound tech-focused, but their risk exposures are not the same. Investing discipline answers “Should I keep contributing?”; “Which fund should I contribute to?” is another question—which are you betting on: a Nasdaq basket, or a more concentrated group of tech stocks?
Which side are you on? Sticking with QQQ, or taking a serious look at VGT?
(Personal observations based on public data; not investment advice.)
#定投 #ETF #USStocks
You invest in QQQ regularly because of tech?
Many people assume: Nasdaq = tech, tech = QQQ. Take it one step further: a purer tech-sector ETF is VGT (Vanguard Information Technology). If you put the same amount into one of them, what exactly are you betting on?
Here’s what publicly available backtests show (Investment Visual, daily closing prices with dividends reinvested, through 2026-11-03):
· Annualized return over the past 10 years: VGT about 24.01%, QQQ about 20.47%—a gap of roughly 3.5 percentage points
· From the same starting line on 2004-01-30 to today: VGT about 14.72%, QQQ about 14.53%—virtually a tie
· $10,000 invested then would be worth today: about $228,000 in VGT, $219,000 in QQQ
· Expense ratio: VGT 0.09%, QQQ 0.18% (half as much)
· Across rolling 10-year periods: QQQ actually came out ahead about 53% of the time
A common misconception is treating “who performed better over the past decade” as “which one should I invest in going forward.” VGT has had the edge over the past decade, but over the full period since they both began, the two have been neck and neck; in rolling periods, QQQ often pulls ahead. The debate over which fund to choose often comes down to the end of the sample period, not an inherent structural advantage.
One level deeper: QQQ tracks the Nasdaq-100 (which includes non-tech sectors such as consumer stocks), while VGT tracks the information technology sector. Both sound tech-focused, but their risk exposures are not the same. Investing discipline answers “Should I keep contributing?”; “Which fund should I contribute to?” is another question—which are you betting on: a Nasdaq basket, or a more concentrated group of tech stocks?
Which side are you on? Sticking with QQQ, or taking a serious look at VGT?
(Personal observations based on public data; not investment advice.)
#定投 #ETF #USStocks
Many people assume: Nasdaq = tech, tech = QQQ. Take it one step further: a purer tech-sector ETF is VGT (Vanguard Information Technology). If you put the same amount into one of them, what exactly are you betting on?
Here’s what publicly available backtests show (Investment Visual, daily closing prices with dividends reinvested, through 2026-11-03):
· Annualized return over the past 10 years: VGT about 24.01%, QQQ about 20.47%—a gap of roughly 3.5 percentage points
· From the same starting line on 2004-01-30 to today: VGT about 14.72%, QQQ about 14.53%—virtually a tie
· $10,000 invested then would be worth today: about $228,000 in VGT, $219,000 in QQQ
· Expense ratio: VGT 0.09%, QQQ 0.18% (half as much)
· Across rolling 10-year periods: QQQ actually came out ahead about 53% of the time
A common misconception is treating “who performed better over the past decade” as “which one should I invest in going forward.” VGT has had the edge over the past decade, but over the full period since they both began, the two have been neck and neck; in rolling periods, QQQ often pulls ahead. The debate over which fund to choose often comes down to the end of the sample period, not an inherent structural advantage.
One level deeper: QQQ tracks the Nasdaq-100 (which includes non-tech sectors such as consumer stocks), while VGT tracks the information technology sector. Both sound tech-focused, but their risk exposures are not the same. Investing discipline answers “Should I keep contributing?”; “Which fund should I contribute to?” is another question—which are you betting on: a Nasdaq basket, or a more concentrated group of tech stocks?
Which side are you on? Sticking with QQQ, or taking a serious look at VGT?
(Personal observations based on public data; not investment advice.)
#定投 #ETF #USStocks
116
·
--
Let’s start with two figures (JPMorgan Asset Management, S&P 500, 2005-01-03 to 2024-12-31):
If you stayed invested with $10,000, it would have grown to about $71,750 by the end, an annualized return of about 10.4%.
Miss the 10 best trading days, and you’d have just $32,871, an annualized return of about 6.1%.
Miss 60 more days, and you’d have $4,712, an annualized return of -3.7%—you wouldn’t even preserve your principal.
Many people think they can avoid the pitfalls by getting out during sharp drops and resuming dollar-cost averaging once things settle down.
The same study also found that 7 of the 10 best days in the past 20 years fell within two weeks of the 10 worst days. March 12, 2020 was the second-worst day of that year; the very next day was the second-best.
You exit to avoid the big down days, but the timing window catches the big up days too. Dollar-cost averaging keeps you invested through that window—your contribution goes out on payday, and even on the night of a crash. You’re naturally there for the rebound rallies that often cluster together. Averaging out your cost is just a byproduct.
Would you keep contributing, or get out first?
#定投 #美股 #S&P
Let’s start with two figures (JPMorgan Asset Management, S&P 500, 2005-01-03 to 2024-12-31):
If you stayed invested with $10,000, it would have grown to about $71,750 by the end, an annualized return of about 10.4%.
Miss the 10 best trading days, and you’d have just $32,871, an annualized return of about 6.1%.
Miss 60 more days, and you’d have $4,712, an annualized return of -3.7%—you wouldn’t even preserve your principal.
Many people think they can avoid the pitfalls by getting out during sharp drops and resuming dollar-cost averaging once things settle down.
The same study also found that 7 of the 10 best days in the past 20 years fell within two weeks of the 10 worst days. March 12, 2020 was the second-worst day of that year; the very next day was the second-best.
You exit to avoid the big down days, but the timing window catches the big up days too. Dollar-cost averaging keeps you invested through that window—your contribution goes out on payday, and even on the night of a crash. You’re naturally there for the rebound rallies that often cluster together. Averaging out your cost is just a byproduct.
Would you keep contributing, or get out first?
#定投 #美股 #S&P
If you stayed invested with $10,000, it would have grown to about $71,750 by the end, an annualized return of about 10.4%.
Miss the 10 best trading days, and you’d have just $32,871, an annualized return of about 6.1%.
Miss 60 more days, and you’d have $4,712, an annualized return of -3.7%—you wouldn’t even preserve your principal.
Many people think they can avoid the pitfalls by getting out during sharp drops and resuming dollar-cost averaging once things settle down.
The same study also found that 7 of the 10 best days in the past 20 years fell within two weeks of the 10 worst days. March 12, 2020 was the second-worst day of that year; the very next day was the second-best.
You exit to avoid the big down days, but the timing window catches the big up days too. Dollar-cost averaging keeps you invested through that window—your contribution goes out on payday, and even on the night of a crash. You’re naturally there for the rebound rallies that often cluster together. Averaging out your cost is just a byproduct.
Would you keep contributing, or get out first?
#定投 #美股 #S&P
11
·
--
Someone in the conference room flung their phone: "Isn't Bitcoin digital gold? Why is it falling along with the Nasdaq?"
The screen showed it clearly: Nasdaq -5.52%. Bitcoin closed at around $75,969 on Coinbase on Thursday, down about 5.5%—its lowest close since September 15. The gold column beside it: up about 0.6% on the day, to around $4,094 an ounce.
CoinDesk put it bluntly: Gold did what Bitcoin bulls have always hoped Bitcoin would do—it rose as risk assets fell.
The deeper point: this wasn't a one-off. When risk appetite dries up, Bitcoin tends to act like a high-beta tech stock first, and "digital gold" later. The safe-haven narrative sounds good; the tape is more honest.
Are you buying Bitcoin as a safe haven, or as a high-beta asset?
#比特币 #数字黄金 #Crypto
Someone in the conference room flung their phone: "Isn't Bitcoin digital gold? Why is it falling along with the Nasdaq?"
The screen showed it clearly: Nasdaq -5.52%. Bitcoin closed at around $75,969 on Coinbase on Thursday, down about 5.5%—its lowest close since September 15. The gold column beside it: up about 0.6% on the day, to around $4,094 an ounce.
CoinDesk put it bluntly: Gold did what Bitcoin bulls have always hoped Bitcoin would do—it rose as risk assets fell.
The deeper point: this wasn't a one-off. When risk appetite dries up, Bitcoin tends to act like a high-beta tech stock first, and "digital gold" later. The safe-haven narrative sounds good; the tape is more honest.
Are you buying Bitcoin as a safe haven, or as a high-beta asset?
#比特币 #数字黄金 #Crypto
The screen showed it clearly: Nasdaq -5.52%. Bitcoin closed at around $75,969 on Coinbase on Thursday, down about 5.5%—its lowest close since September 15. The gold column beside it: up about 0.6% on the day, to around $4,094 an ounce.
CoinDesk put it bluntly: Gold did what Bitcoin bulls have always hoped Bitcoin would do—it rose as risk assets fell.
The deeper point: this wasn't a one-off. When risk appetite dries up, Bitcoin tends to act like a high-beta tech stock first, and "digital gold" later. The safe-haven narrative sounds good; the tape is more honest.
Are you buying Bitcoin as a safe haven, or as a high-beta asset?
#比特币 #数字黄金 #Crypto
109
·
--
In a nutshell: the returns a fund earns and the returns its investors earn are two different things.
Morningstar’s *Mind the Gap 2025* report looked at U.S. mutual funds and ETFs over the ten years through the end of 2024. Funds returned 8.2% annualized, but investors earned only 7.0% based on their actual buying and selling. That 1.2-percentage-point gap each year amounts to about 15% of the total return.
People assume that dollar-cost averaging automatically protects them from this trap. It’s not that simple. The report itself notes that even good habits like investing a set amount from each paycheck every month and rebalancing regularly can lead to a gap. What really widens it is adding money when prices are rising and cashing out during a crash.
One level deeper: the gap was largest for sector and thematic funds, and smallest for allocation funds, where investors captured nearly 97% of returns. The more exciting the product, the harder it is for people to keep their hands off it.
So what dollar-cost averaging really needs to guard against isn’t a market downturn—it’s you, on the night the market falls.
Which kind are you?
#定投 #基金 #U.S.Stocks
In a nutshell: the returns a fund earns and the returns its investors earn are two different things.
Morningstar’s *Mind the Gap 2025* report looked at U.S. mutual funds and ETFs over the ten years through the end of 2024. Funds returned 8.2% annualized, but investors earned only 7.0% based on their actual buying and selling. That 1.2-percentage-point gap each year amounts to about 15% of the total return.
People assume that dollar-cost averaging automatically protects them from this trap. It’s not that simple. The report itself notes that even good habits like investing a set amount from each paycheck every month and rebalancing regularly can lead to a gap. What really widens it is adding money when prices are rising and cashing out during a crash.
One level deeper: the gap was largest for sector and thematic funds, and smallest for allocation funds, where investors captured nearly 97% of returns. The more exciting the product, the harder it is for people to keep their hands off it.
So what dollar-cost averaging really needs to guard against isn’t a market downturn—it’s you, on the night the market falls.
Which kind are you?
#定投 #基金 #U.S.Stocks
Morningstar’s *Mind the Gap 2025* report looked at U.S. mutual funds and ETFs over the ten years through the end of 2024. Funds returned 8.2% annualized, but investors earned only 7.0% based on their actual buying and selling. That 1.2-percentage-point gap each year amounts to about 15% of the total return.
People assume that dollar-cost averaging automatically protects them from this trap. It’s not that simple. The report itself notes that even good habits like investing a set amount from each paycheck every month and rebalancing regularly can lead to a gap. What really widens it is adding money when prices are rising and cashing out during a crash.
One level deeper: the gap was largest for sector and thematic funds, and smallest for allocation funds, where investors captured nearly 97% of returns. The more exciting the product, the harder it is for people to keep their hands off it.
So what dollar-cost averaging really needs to guard against isn’t a market downturn—it’s you, on the night the market falls.
Which kind are you?
#定投 #基金 #U.S.Stocks
Log in to explore more content
Join global crypto users on Binance Square
⚡️ Get latest and useful information about crypto.
💬 Trusted by the world’s largest crypto exchange.
👍 Discover real insights from verified creators.
Email / Phone number
Trending Topics
JobsReportRaisesHikeOdds
3,725 views
162 Discussing
TradFi News | US Adds 165,000 Jobs in October, More Than Double the 65,000 Forecast, as Unemployment Falls to 4.1%
Binance News
·6 Likes
·4.7k views
US Data Center Rules May Constrain AI Expansion
875 views
29 Discussing
CanUSStocksReboundAfterNonfarmPayrolls?
15,930 views
413 Discussing