
James_BNB
21.7k Posts

James_BNB
Report
Block User
Trader || Community Builder || BNB Holder || @JamestraderBNB
High-Frequency Trader
4 Years
119 Following
17.3K+ Followers
67.2K+ Liked
Posts
All
Quotes
Videos
PINNED
·
--
Bearish
Road to $10M is officially open! 🚀
This is where I’ll be sharing my highest-quality trading signals, valuable market insights, and nearly 20 years of experience in the markets.
No unnecessary noise. Just real trading experience, quality setups, and the journey toward our million-dollar goal.
Let’s build something big together! 🔥
👉 The membership fee is $499 for a one-time payment, or $999 for a 7-day trial before paying.
👉 Join here : [https://app.binance.com/uni-qr/B6Jdno71](https://app.binance.com/uni-qr/B6Jdno71)
👇 Want to pay less than $999 while still gaining access to high-quality opportunities? See the instructions below
Road to $10M is officially open! 🚀
This is where I’ll be sharing my highest-quality trading signals, valuable market insights, and nearly 20 years of experience in the markets.
No unnecessary noise. Just real trading experience, quality setups, and the journey toward our million-dollar goal.
Let’s build something big together! 🔥
👉 The membership fee is $499 for a one-time payment, or $999 for a 7-day trial before paying.
👉 Join here : https://app.binance.com/uni-qr/B6Jdno71
👇 Want to pay less than $999 while still gaining access to high-quality opportunities? See the instructions below
This is where I’ll be sharing my highest-quality trading signals, valuable market insights, and nearly 20 years of experience in the markets.
No unnecessary noise. Just real trading experience, quality setups, and the journey toward our million-dollar goal.
Let’s build something big together! 🔥
👉 The membership fee is $499 for a one-time payment, or $999 for a 7-day trial before paying.
👉 Join here : https://app.binance.com/uni-qr/B6Jdno71
👇 Want to pay less than $999 while still gaining access to high-quality opportunities? See the instructions below

33
10
936
·
--
A business trip to New York, but I always make time to appreciate the city beyond the meetings. 🇺🇸
Flying over Manhattan in a helicopter just as the sun sets, watching the skyline slowly come alive with millions of lights. The Empire State Building, the Hudson River, and the endless cityscape look absolutely breathtaking from above.
Some views remind you why the journey is worth it. A beautiful evening in NYC.
A business trip to New York, but I always make time to appreciate the city beyond the meetings. 🇺🇸
Flying over Manhattan in a helicopter just as the sun sets, watching the skyline slowly come alive with millions of lights. The Empire State Building, the Hudson River, and the endless cityscape look absolutely breathtaking from above.
Some views remind you why the journey is worth it. A beautiful evening in NYC.
Flying over Manhattan in a helicopter just as the sun sets, watching the skyline slowly come alive with millions of lights. The Empire State Building, the Hudson River, and the endless cityscape look absolutely breathtaking from above.
Some views remind you why the journey is worth it. A beautiful evening in NYC.
3
10
1.2k
·
--
The next four weeks could be the most important period of this entire cycle for $BTC. I don’t think I can emphasize that enough.
Q4 weakness has always been part of the broader expectation.
Looking back at both 2018 and 2022, we saw significant risk-off moves toward the end of the year before the market began to stabilize and recover.
However, what makes this cycle more fragile is that Bitcoin broke below previous weekly and monthly swing highs toward the end of Q3. This was something we hadn’t seen in either of the previous cycles.
The current correction now puts those previous breakouts at risk of becoming a macro fakeout, potentially triggering what I call the Trapped Position Law.
What matters most right now is whether market makers have enough order book liquidity to absorb selling pressure and defend the range lows.
If they can, Bitcoin has a chance to establish a higher low and preserve the broader expansion structure.
If not, losing this support zone would invalidate the argument that we’re simply experiencing a healthy correction within an ongoing expansion phase. At that point, a much deeper reversal becomes a serious possibility.
My broader expectation remains that most of this weakness will play out toward the end of Q4.
Of course, that doesn’t mean January has to produce a straight vertical rally. But there’s an important historical detail worth remembering: neither of the previous cycles made a new cycle low in January.
Both previous cycles also experienced expansion during Q1.
* 2019: We saw an initial expansion followed by a period of consolidation before momentum accelerated in Q2.
* 2023: The expansion was considerably stronger right from the beginning of the year.
Sentiment will probably become increasingly bearish if we spend another few weeks trading lower.
But as long as Bitcoin manages to defend this support zone and establish a higher low, I believe this period could present a significant accumulation opportunity ahead of the potential 2027 rally.
The next four weeks could be the most important period of this entire cycle for $BTC. I don’t think I can emphasize that enough.
Q4 weakness has always been part of the broader expectation.
Looking back at both 2018 and 2022, we saw significant risk-off moves toward the end of the year before the market began to stabilize and recover.
However, what makes this cycle more fragile is that Bitcoin broke below previous weekly and monthly swing highs toward the end of Q3. This was something we hadn’t seen in either of the previous cycles.
The current correction now puts those previous breakouts at risk of becoming a macro fakeout, potentially triggering what I call the Trapped Position Law.
What matters most right now is whether market makers have enough order book liquidity to absorb selling pressure and defend the range lows.
If they can, Bitcoin has a chance to establish a higher low and preserve the broader expansion structure.
If not, losing this support zone would invalidate the argument that we’re simply experiencing a healthy correction within an ongoing expansion phase. At that point, a much deeper reversal becomes a serious possibility.
My broader expectation remains that most of this weakness will play out toward the end of Q4.
Of course, that doesn’t mean January has to produce a straight vertical rally. But there’s an important historical detail worth remembering: neither of the previous cycles made a new cycle low in January.
Both previous cycles also experienced expansion during Q1.
* 2019: We saw an initial expansion followed by a period of consolidation before momentum accelerated in Q2.
* 2023: The expansion was considerably stronger right from the beginning of the year.
Sentiment will probably become increasingly bearish if we spend another few weeks trading lower.
But as long as Bitcoin manages to defend this support zone and establish a higher low, I believe this period could present a significant accumulation opportunity ahead of the potential 2027 rally.
Q4 weakness has always been part of the broader expectation.
Looking back at both 2018 and 2022, we saw significant risk-off moves toward the end of the year before the market began to stabilize and recover.
However, what makes this cycle more fragile is that Bitcoin broke below previous weekly and monthly swing highs toward the end of Q3. This was something we hadn’t seen in either of the previous cycles.
The current correction now puts those previous breakouts at risk of becoming a macro fakeout, potentially triggering what I call the Trapped Position Law.
What matters most right now is whether market makers have enough order book liquidity to absorb selling pressure and defend the range lows.
If they can, Bitcoin has a chance to establish a higher low and preserve the broader expansion structure.
If not, losing this support zone would invalidate the argument that we’re simply experiencing a healthy correction within an ongoing expansion phase. At that point, a much deeper reversal becomes a serious possibility.
My broader expectation remains that most of this weakness will play out toward the end of Q4.
Of course, that doesn’t mean January has to produce a straight vertical rally. But there’s an important historical detail worth remembering: neither of the previous cycles made a new cycle low in January.
Both previous cycles also experienced expansion during Q1.
* 2019: We saw an initial expansion followed by a period of consolidation before momentum accelerated in Q2.
* 2023: The expansion was considerably stronger right from the beginning of the year.
Sentiment will probably become increasingly bearish if we spend another few weeks trading lower.
But as long as Bitcoin manages to defend this support zone and establish a higher low, I believe this period could present a significant accumulation opportunity ahead of the potential 2027 rally.
James_BNB
·
--
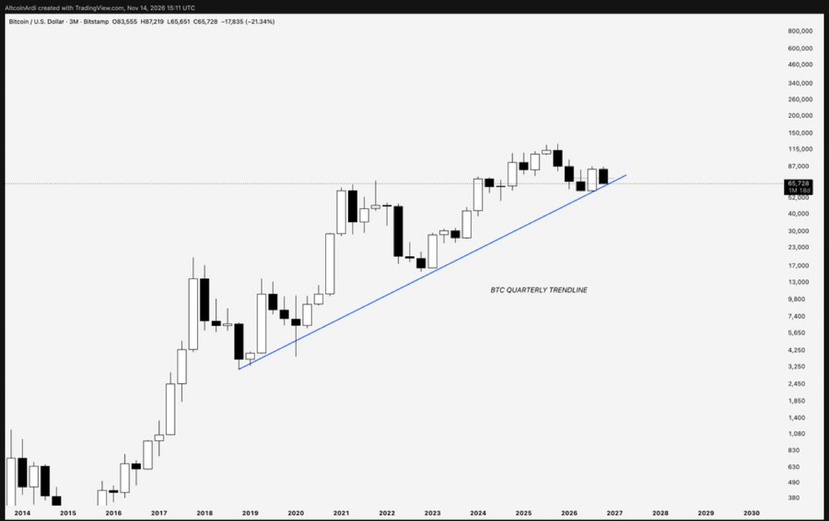
Almost nobody seems to be talking about this, but this could be one of the most important technical charts for $BTC right now.
An eight-year trendline dating back to when Bitcoin was trading around $3,000.
It connects the bear market lows of 2018 and 2022, and now we’re testing it again on both the monthly and quarterly timeframes.
The implications are massive.
If Bitcoin loses this trendline, bulls need to reclaim it quickly. Otherwise, we could be looking at a much deeper correction, potentially pushing BTC below $57K.
Remember:
The higher the timeframe, the bigger the breakdown.
This is a level the market simply cannot afford to ignore.
An eight-year trendline dating back to when Bitcoin was trading around $3,000.
It connects the bear market lows of 2018 and 2022, and now we’re testing it again on both the monthly and quarterly timeframes.
The implications are massive.
If Bitcoin loses this trendline, bulls need to reclaim it quickly. Otherwise, we could be looking at a much deeper correction, potentially pushing BTC below $57K.
Remember:
The higher the timeframe, the bigger the breakdown.
This is a level the market simply cannot afford to ignore.
5
827
·
--
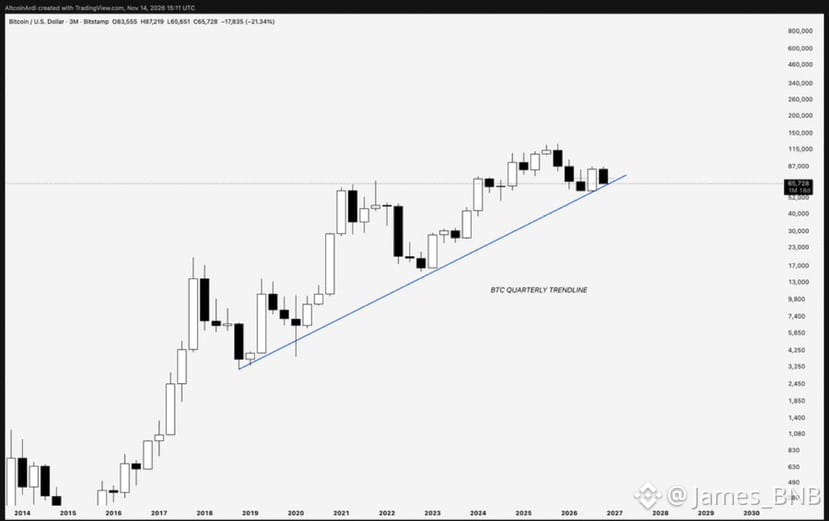
Almost nobody seems to be talking about this, but this could be one of the most important technical charts for $BTC right now.
An eight-year trendline dating back to when Bitcoin was trading around $3,000.
It connects the bear market lows of 2018 and 2022, and now we’re testing it again on both the monthly and quarterly timeframes.
The implications are massive.
If Bitcoin loses this trendline, bulls need to reclaim it quickly. Otherwise, we could be looking at a much deeper correction, potentially pushing BTC below $57K.
Remember:
The higher the timeframe, the bigger the breakdown.
This is a level the market simply cannot afford to ignore.
{future}(BTCUSDT)
Almost nobody seems to be talking about this, but this could be one of the most important technical charts for $BTC right now.
An eight-year trendline dating back to when Bitcoin was trading around $3,000.
It connects the bear market lows of 2018 and 2022, and now we’re testing it again on both the monthly and quarterly timeframes.
The implications are massive.
If Bitcoin loses this trendline, bulls need to reclaim it quickly. Otherwise, we could be looking at a much deeper correction, potentially pushing BTC below $57K.
Remember:
The higher the timeframe, the bigger the breakdown.
This is a level the market simply cannot afford to ignore.
An eight-year trendline dating back to when Bitcoin was trading around $3,000.
It connects the bear market lows of 2018 and 2022, and now we’re testing it again on both the monthly and quarterly timeframes.
The implications are massive.
If Bitcoin loses this trendline, bulls need to reclaim it quickly. Otherwise, we could be looking at a much deeper correction, potentially pushing BTC below $57K.
Remember:
The higher the timeframe, the bigger the breakdown.
This is a level the market simply cannot afford to ignore.
1
4
1.3k
·
--
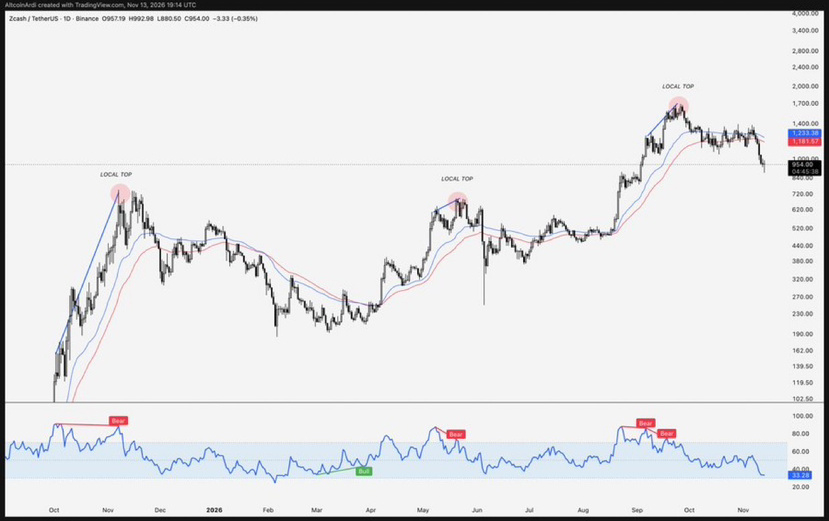
$ZEC daily RSI divergence has an impressive track record of identifying macro turning points.
Over the past 12 months, bearish RSI divergence has marked all three of its major tops.
Every time Zcash printed an expansive higher high while RSI formed a lower high, a local top followed, eventually leading to a broader macro correction.
The opposite has also played out. Bullish RSI divergence has previously appeared near the beginning of major markup phases.
That’s why I’m paying close attention to this correction.
If a macro bullish divergence starts developing on the daily chart, it could provide an early indication that ZEC is preparing for its next expansion phase.
For now, patience. I want to see confirmation rather than anticipate the bottom.
{future}(ZECUSDT)
$ZEC daily RSI divergence has an impressive track record of identifying macro turning points.
Over the past 12 months, bearish RSI divergence has marked all three of its major tops.
Every time Zcash printed an expansive higher high while RSI formed a lower high, a local top followed, eventually leading to a broader macro correction.
The opposite has also played out. Bullish RSI divergence has previously appeared near the beginning of major markup phases.
That’s why I’m paying close attention to this correction.
If a macro bullish divergence starts developing on the daily chart, it could provide an early indication that ZEC is preparing for its next expansion phase.
For now, patience. I want to see confirmation rather than anticipate the bottom.
Over the past 12 months, bearish RSI divergence has marked all three of its major tops.
Every time Zcash printed an expansive higher high while RSI formed a lower high, a local top followed, eventually leading to a broader macro correction.
The opposite has also played out. Bullish RSI divergence has previously appeared near the beginning of major markup phases.
That’s why I’m paying close attention to this correction.
If a macro bullish divergence starts developing on the daily chart, it could provide an early indication that ZEC is preparing for its next expansion phase.
For now, patience. I want to see confirmation rather than anticipate the bottom.
2
4
1.5k
·
--
Bearish
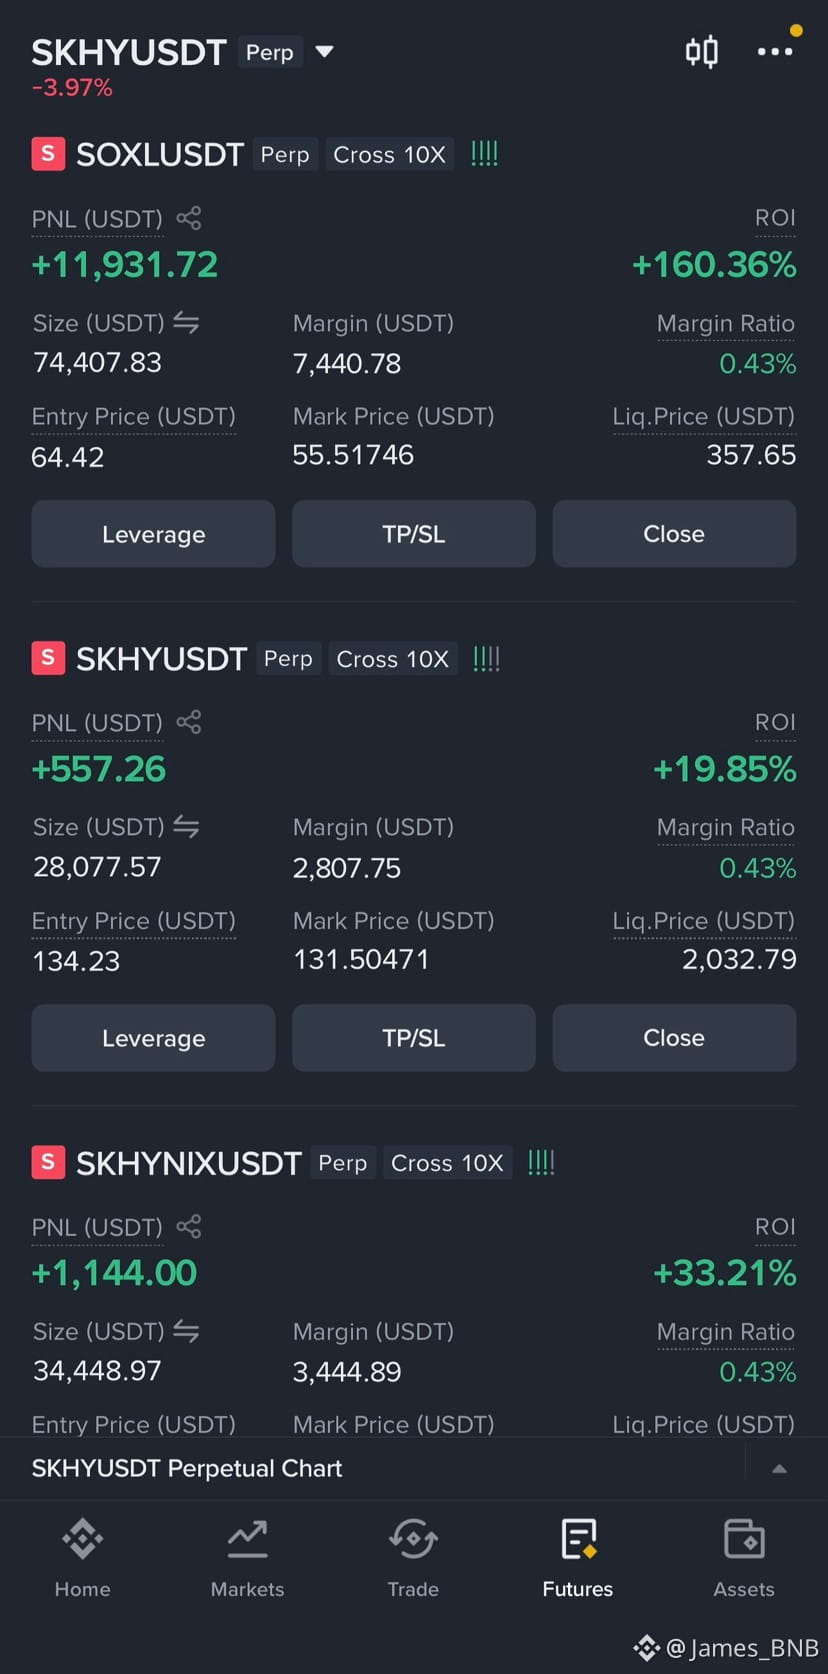
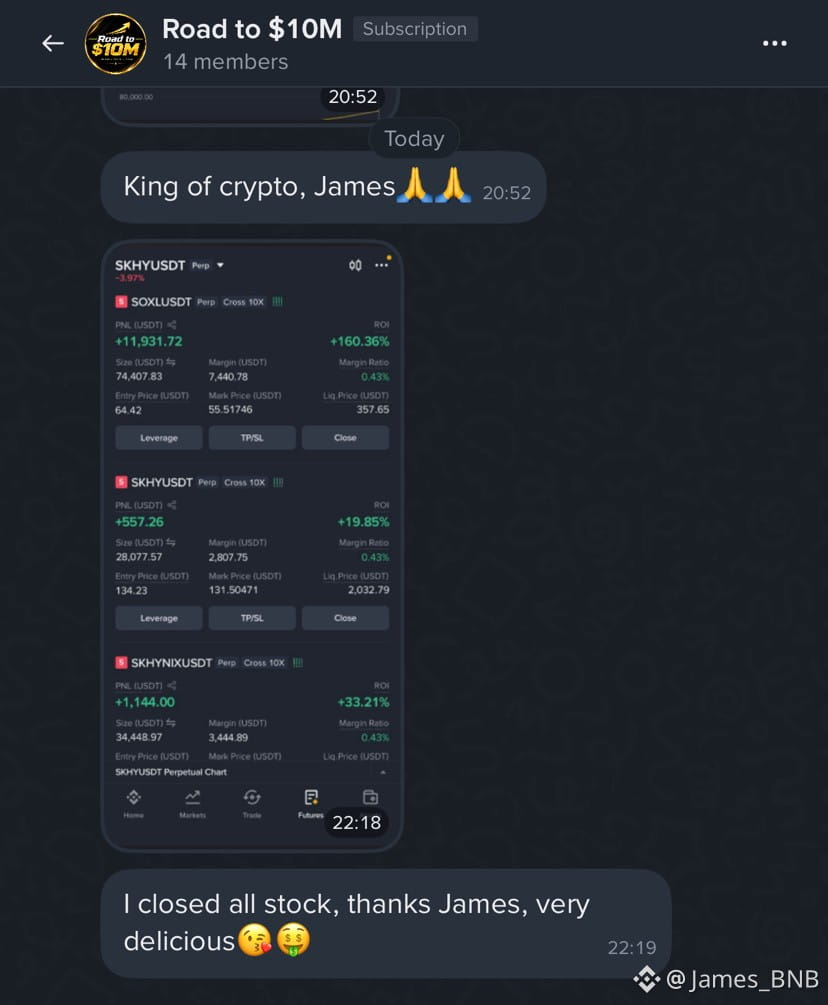
crazy profit🤯$SOXL $SKHY $SKHYNIX
{future}(SKHYNIXUSDT)
{future}(SKHYUSDT)
{future}(SOXLUSDT)
crazy profit🤯$SOXL $SKHY $SKHYNIX
James_BNB
·
--
Bearish$SOXL big short round 2 now, thanks James later
entry 64-69
short $SOXL 👇
entry 64-69
short $SOXL 👇
3
7
2.5k
Log in to explore more content
Join global crypto users on Binance Square
⚡️ Get latest and useful information about crypto.
💬 Trusted by the world’s largest crypto exchange.
👍 Discover real insights from verified creators.
Email / Phone number
Trending Topics
WhoWillSucceedJensenHuangatNvidia?
163,234 views
1,615 Discussing
Nvidia Says No CEO Talks Underway as "Stand With Jensen" Petition Tops 77,900 Signatures
Binance News
·33 Likes
·60.5k views
WhatWillDriveCryptoandStocks’NextRebound?
562,558 views
3,450 Discussing
BitcoinActiveSupplyInProfitDropsBelow45%
71,922 views
693 Discussing