
JOSEPH DESOZE
16.7k Posts

JOSEPH DESOZE
 Square Verified
Report
Block User
Crypto Enthusiast, Market Analyst; Gem Hunter Blockchain Believer.
Open Trade
Frequent Trader
2 Years
196 Following
30.1K+ Followers
18.6K+ Liked
Posts
Portfolio
All
Quotes
Live
·
--
Bearish
$ETH
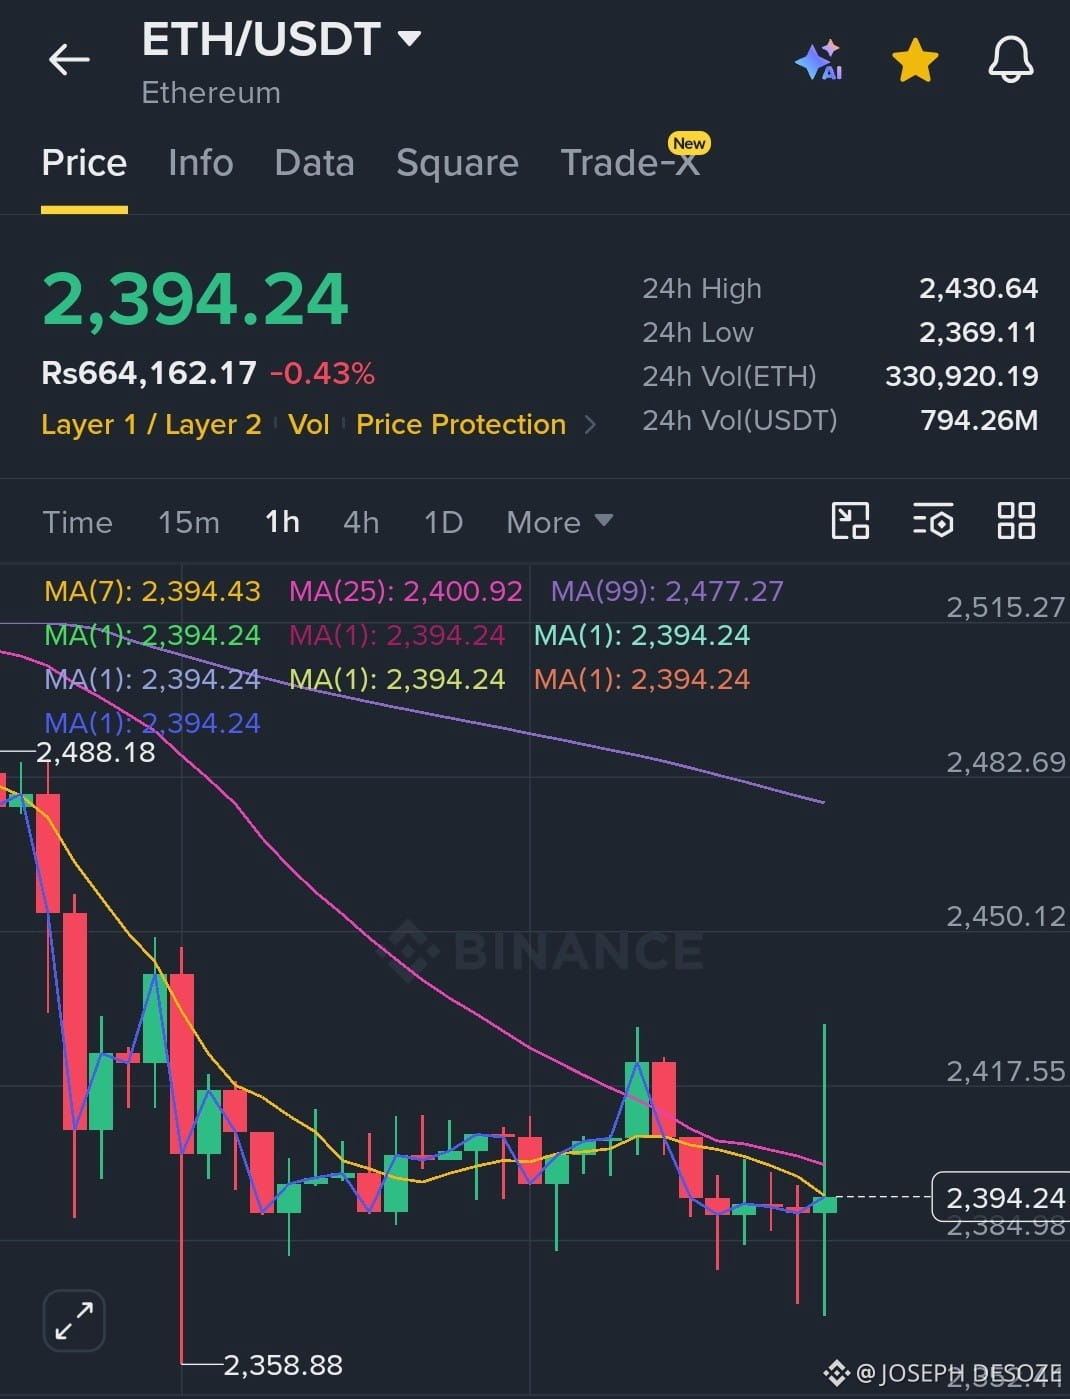
ETH is holding the $4,500 area with buyers defending the recent support zone. A clean reclaim of $4,600 would strengthen momentum and open the next upside leg.
EP: 4,480 – 4,550
TP1: 4,650
TP2: 4,800
TP3: 5,000
SL: 4,350
Bias: Bullish continuation
{spot}(ETHUSDT)
#ETH #ETHETFsApproved #Ethereum
$ETH
ETH is holding the $4,500 area with buyers defending the recent support zone. A clean reclaim of $4,600 would strengthen momentum and open the next upside leg.
EP: 4,480 – 4,550
TP1: 4,650
TP2: 4,800
TP3: 5,000
SL: 4,350
Bias: Bullish continuation
#ETH #ETHETFsApproved #Ethereum
ETH is holding the $4,500 area with buyers defending the recent support zone. A clean reclaim of $4,600 would strengthen momentum and open the next upside leg.
EP: 4,480 – 4,550
TP1: 4,650
TP2: 4,800
TP3: 5,000
SL: 4,350
Bias: Bullish continuation
#ETH #ETHETFsApproved #Ethereum
1
116
·
--
Bullish
$BULLA
EP: 0.0205 – 0.0215
TP1: 0.0230
TP2: 0.0250
TP3: 0.0280
SL: 0.0190
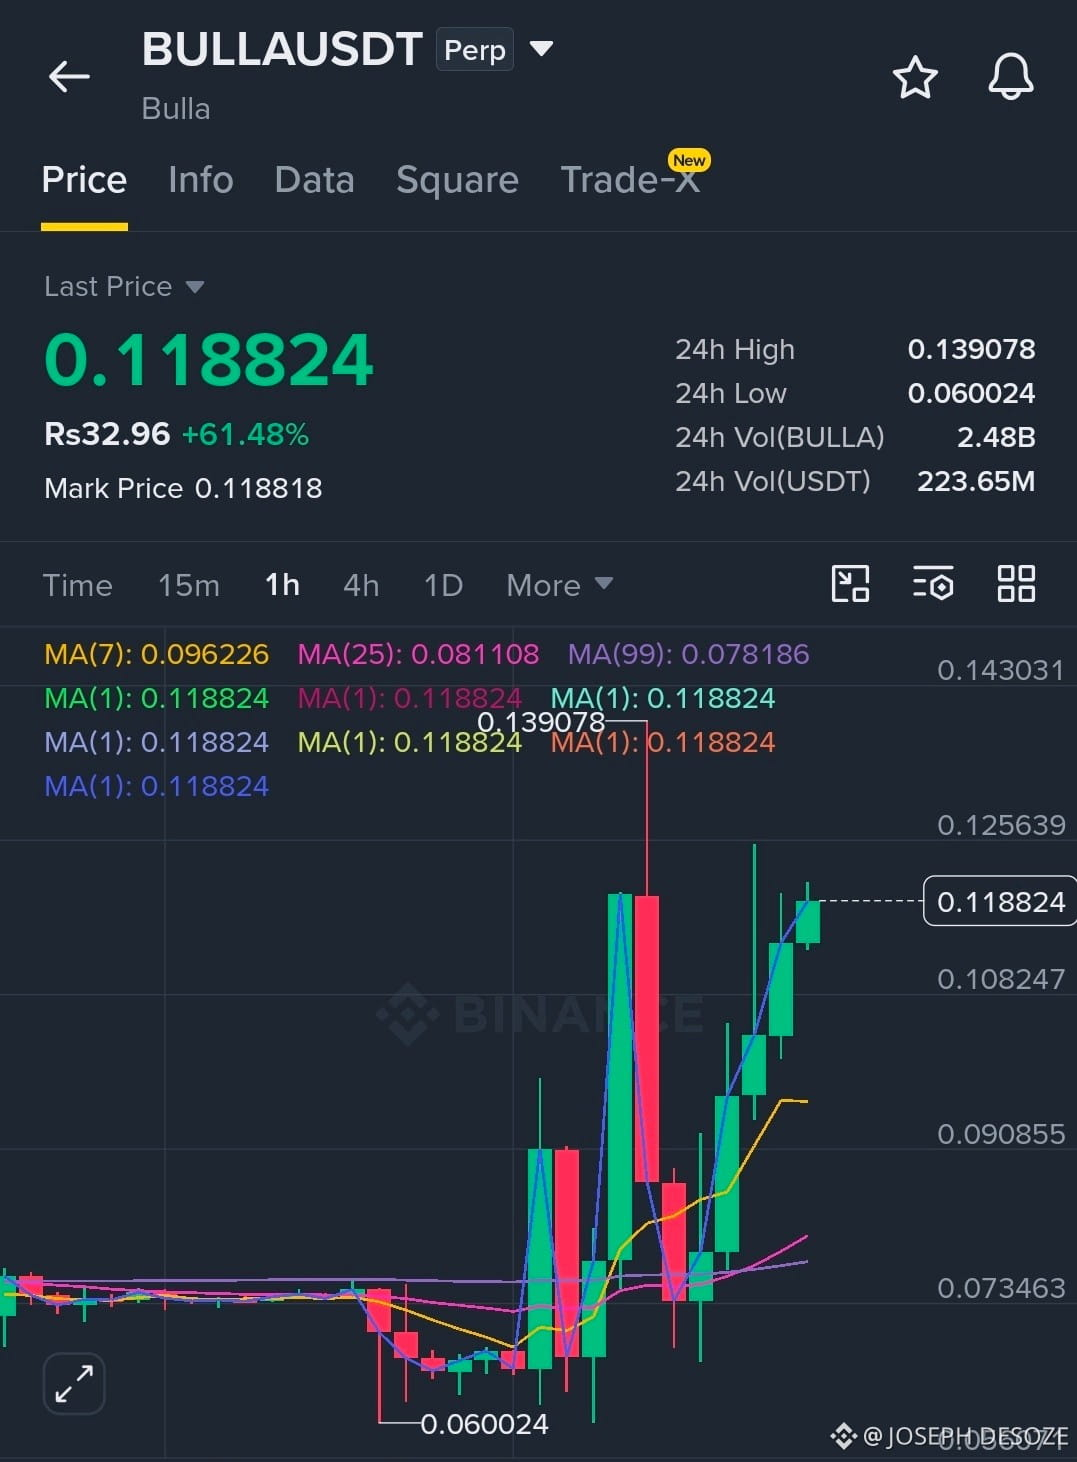
Strong bullish momentum with buyers defending the key support zone. A clean break above 0.0220 can accelerate the next upside move, while a break below 0.0190 invalidates the setup.
Bias: Bullish continuation
{future}(BULLAUSDT)
#MSTRTradingVolumeSurpassesMorganStanley #ZcashHoldersBackNU7Upgrade #CircleOpensArcMainnet #XRPSinks10% #ZcashRises6%
$BULLA
EP: 0.0205 – 0.0215
TP1: 0.0230
TP2: 0.0250
TP3: 0.0280
SL: 0.0190
Strong bullish momentum with buyers defending the key support zone. A clean break above 0.0220 can accelerate the next upside move, while a break below 0.0190 invalidates the setup.
Bias: Bullish continuation
#MSTRTradingVolumeSurpassesMorganStanley #ZcashHoldersBackNU7Upgrade #CircleOpensArcMainnet #XRPSinks10% #ZcashRises6%
EP: 0.0205 – 0.0215
TP1: 0.0230
TP2: 0.0250
TP3: 0.0280
SL: 0.0190
Strong bullish momentum with buyers defending the key support zone. A clean break above 0.0220 can accelerate the next upside move, while a break below 0.0190 invalidates the setup.
Bias: Bullish continuation
#MSTRTradingVolumeSurpassesMorganStanley #ZcashHoldersBackNU7Upgrade #CircleOpensArcMainnet #XRPSinks10% #ZcashRises6%
76
·
--
Bullish
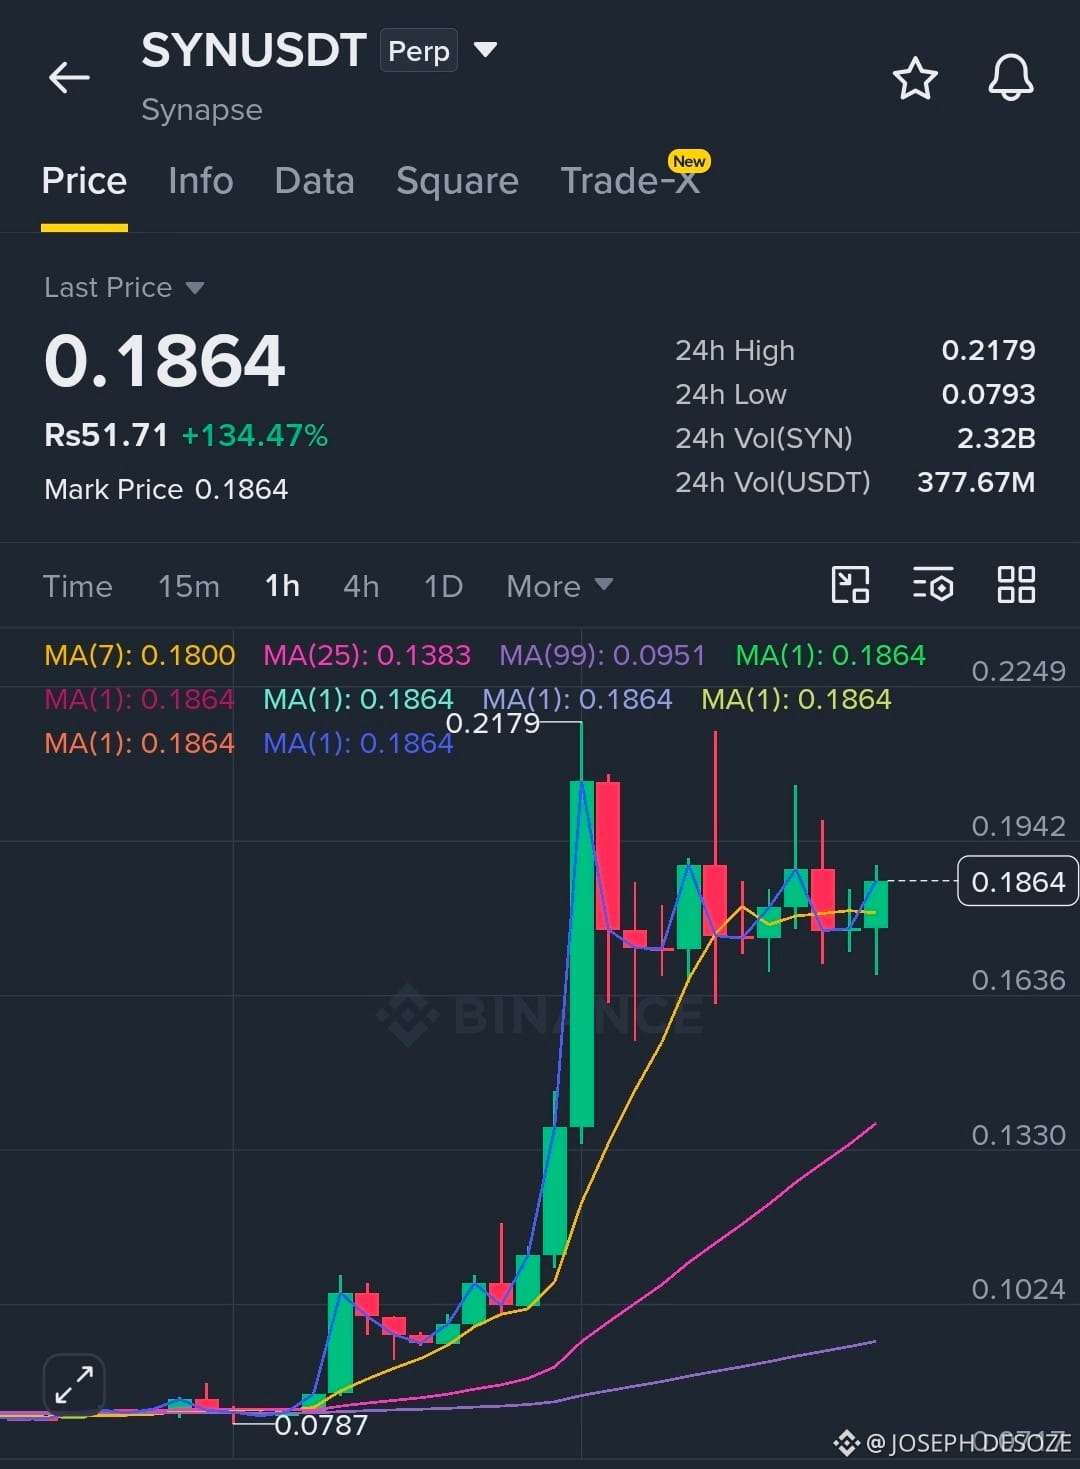
$SYN
EP: 0.22 – 0.23
TP1: 0.25
TP2: 0.28
TP3: 0.32
SL: 0.20
Strong recovery structure with buyers defending the entry zone. A clean breakout above nearby resistance can accelerate the next upside leg, while a break below $0.20 invalidates the setup.
Bias: Bullish continuation
{future}(SYNUSDT)
#FedRateWatch #ZcashRises6% #XRPSinks10% #MSTRTradingVolumeSurpassesMorganStanley #BitcoinFalls4%
$SYN
EP: 0.22 – 0.23
TP1: 0.25
TP2: 0.28
TP3: 0.32
SL: 0.20
Strong recovery structure with buyers defending the entry zone. A clean breakout above nearby resistance can accelerate the next upside leg, while a break below $0.20 invalidates the setup.
Bias: Bullish continuation
#FedRateWatch #ZcashRises6% #XRPSinks10% #MSTRTradingVolumeSurpassesMorganStanley #BitcoinFalls4%
EP: 0.22 – 0.23
TP1: 0.25
TP2: 0.28
TP3: 0.32
SL: 0.20
Strong recovery structure with buyers defending the entry zone. A clean breakout above nearby resistance can accelerate the next upside leg, while a break below $0.20 invalidates the setup.
Bias: Bullish continuation
#FedRateWatch #ZcashRises6% #XRPSinks10% #MSTRTradingVolumeSurpassesMorganStanley #BitcoinFalls4%
1
132
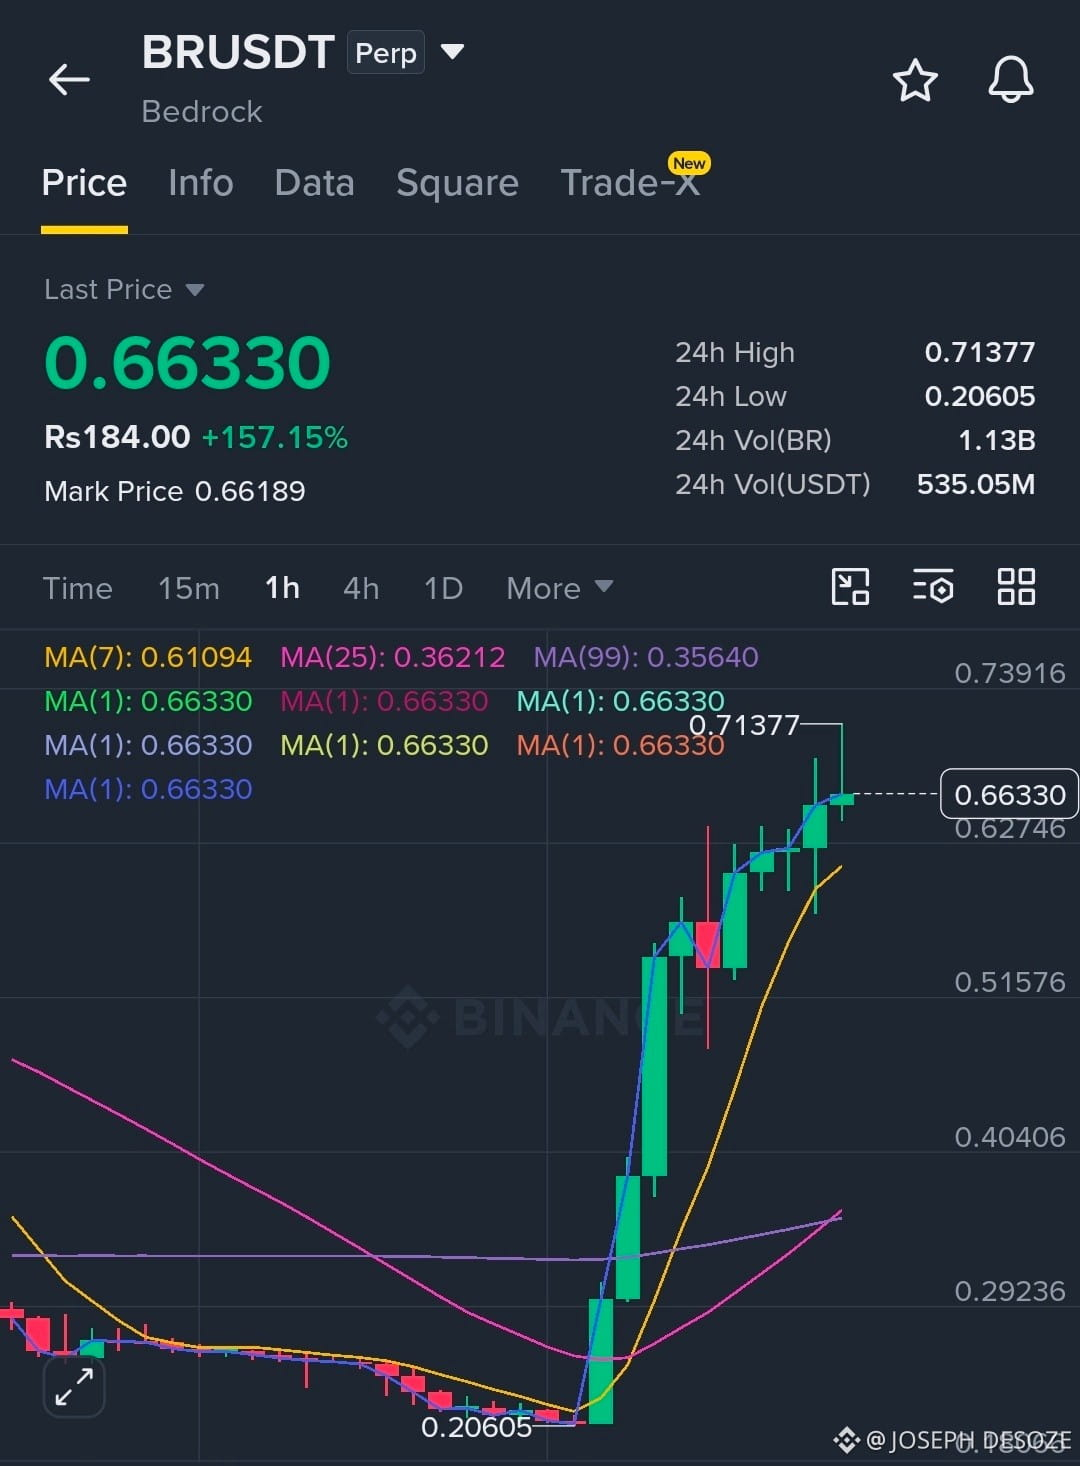
$BR
EP: 0.53 – 0.56
TP1: 0.60
TP2: 0.66
TP3: 0.75
SL: 0.49
Explosive momentum with BR up sharply over the past 24 hours. Price is near the recent breakout zone, so holding $0.53–$0.56 is key for continuation.
Bias: Bullish continuation
Risk: Highly volatile after the recent expansion.
{future}(BRUSDT)
$BR
EP: 0.53 – 0.56
TP1: 0.60
TP2: 0.66
TP3: 0.75
SL: 0.49
Explosive momentum with BR up sharply over the past 24 hours. Price is near the recent breakout zone, so holding $0.53–$0.56 is key for continuation.
Bias: Bullish continuation
Risk: Highly volatile after the recent expansion.
EP: 0.53 – 0.56
TP1: 0.60
TP2: 0.66
TP3: 0.75
SL: 0.49
Explosive momentum with BR up sharply over the past 24 hours. Price is near the recent breakout zone, so holding $0.53–$0.56 is key for continuation.
Bias: Bullish continuation
Risk: Highly volatile after the recent expansion.
1
339
#ZcashRises6%
$ZEC
Zcash is doing something interesting while the rest of the crypto market is getting hit.
The token is up around 6%, with ZEC holding near the top of a massive move that has already taken it roughly 130% higher over the past 30 days.
But the price move isn’t the only thing worth watching.
Earlier today, Zcash holders overwhelmingly backed the NU7 upgrade, including cutting block times from 75 seconds to 25 seconds while keeping the Bitcoin-style halving schedule. Nearly 2.4M ZEC participated in the vote.
Then there’s the part I find more interesting.
Around 28.9% of total ZEC supply — about 4.9M ZEC — is currently sitting in shielded pools, representing roughly $5.8B at current prices.
So this isn’t simply a chart moving because privacy coins are getting attention.
There is actual network activity underneath the narrative.
And today’s broader backdrop makes the relative strength even more noticeable: Bitcoin and much of the market weakened after the CLARITY Act setback, while ZEC remained one of the strongest major assets.
That’s the quiet signal.
When liquidity gets nervous, the market usually exposes which narratives are purely speculative and which ones have developed their own momentum.
Right now, ZEC is forcing traders to pay attention to the second category.
The interesting question isn’t why Zcash moved 6%.
It’s whether the network developments can keep attracting attention after the chart stops doing the talking.
#ZcashRises6%
$ZEC
Zcash is doing something interesting while the rest of the crypto market is getting hit.
The token is up around 6%, with ZEC holding near the top of a massive move that has already taken it roughly 130% higher over the past 30 days.
But the price move isn’t the only thing worth watching.
Earlier today, Zcash holders overwhelmingly backed the NU7 upgrade, including cutting block times from 75 seconds to 25 seconds while keeping the Bitcoin-style halving schedule. Nearly 2.4M ZEC participated in the vote.
Then there’s the part I find more interesting.
Around 28.9% of total ZEC supply — about 4.9M ZEC — is currently sitting in shielded pools, representing roughly $5.8B at current prices.
So this isn’t simply a chart moving because privacy coins are getting attention.
There is actual network activity underneath the narrative.
And today’s broader backdrop makes the relative strength even more noticeable: Bitcoin and much of the market weakened after the CLARITY Act setback, while ZEC remained one of the strongest major assets.
That’s the quiet signal.
When liquidity gets nervous, the market usually exposes which narratives are purely speculative and which ones have developed their own momentum.
Right now, ZEC is forcing traders to pay attention to the second category.
The interesting question isn’t why Zcash moved 6%.
It’s whether the network developments can keep attracting attention after the chart stops doing the talking.
$ZEC
Zcash is doing something interesting while the rest of the crypto market is getting hit.
The token is up around 6%, with ZEC holding near the top of a massive move that has already taken it roughly 130% higher over the past 30 days.
But the price move isn’t the only thing worth watching.
Earlier today, Zcash holders overwhelmingly backed the NU7 upgrade, including cutting block times from 75 seconds to 25 seconds while keeping the Bitcoin-style halving schedule. Nearly 2.4M ZEC participated in the vote.
Then there’s the part I find more interesting.
Around 28.9% of total ZEC supply — about 4.9M ZEC — is currently sitting in shielded pools, representing roughly $5.8B at current prices.
So this isn’t simply a chart moving because privacy coins are getting attention.
There is actual network activity underneath the narrative.
And today’s broader backdrop makes the relative strength even more noticeable: Bitcoin and much of the market weakened after the CLARITY Act setback, while ZEC remained one of the strongest major assets.
That’s the quiet signal.
When liquidity gets nervous, the market usually exposes which narratives are purely speculative and which ones have developed their own momentum.
Right now, ZEC is forcing traders to pay attention to the second category.
The interesting question isn’t why Zcash moved 6%.
It’s whether the network developments can keep attracting attention after the chart stops doing the talking.
2
333
#MSTRTradingVolumeSurpassesMorganStanley
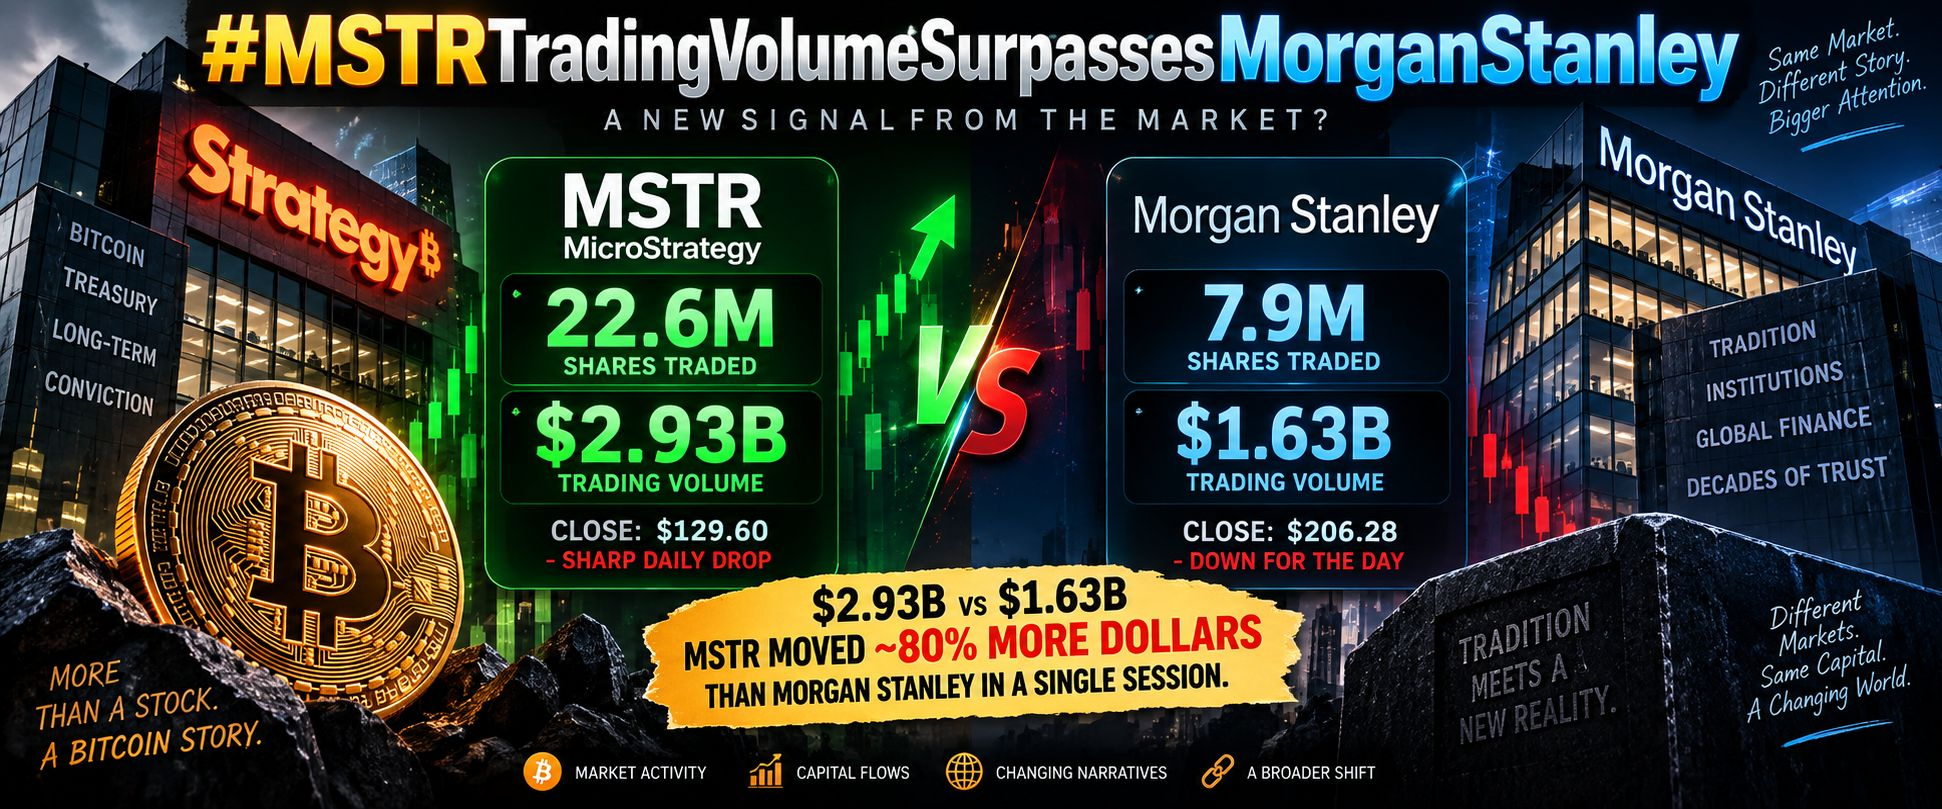
There’s a detail in this headline that is easy to miss.
On September 15, $MSTR traded about 22.6M shares. At the day’s close, that works out to roughly $2.93B in dollar turnover.
Morgan Stanley traded about 7.9M shares, or roughly $1.63B.
So yes, MSTR didn’t just beat MS on raw share volume.
It moved ~80% more dollars through the tape in a single session.
And the interesting part?
MSTR wasn’t ripping higher while doing it.
The stock closed around $129.60, down sharply from the prior session, while Bitcoin was also under pressure around the same time.
That changes how I read the volume.
This wasn’t simply “crypto traders getting excited.”
It looked more like a huge amount of capital fighting over a publicly traded Bitcoin vehicle during a volatile tape.
That distinction matters.
Strategy is no longer just a company whose stock happens to correlate with Bitcoin. Its filings show roughly 845,050 BTC held as of September 7, with an aggregate purchase cost of about $63.73B.
So when MSTR trades billions of dollars in a day, the market is effectively trading exposure to a very unusual balance sheet, capital structure and Bitcoin position all at once.
The quiet part is that liquidity itself has become part of the MSTR story.
People watch the Bitcoin holdings.
I also watch how much capital is willing to move through the equity around them.
Sometimes the tape tells you what the narrative leaves out.
#MSTRTradingVolumeSurpassesMorganStanley
There’s a detail in this headline that is easy to miss.
On September 15, $MSTR traded about 22.6M shares. At the day’s close, that works out to roughly $2.93B in dollar turnover.
Morgan Stanley traded about 7.9M shares, or roughly $1.63B.
So yes, MSTR didn’t just beat MS on raw share volume.
It moved ~80% more dollars through the tape in a single session.
And the interesting part?
MSTR wasn’t ripping higher while doing it.
The stock closed around $129.60, down sharply from the prior session, while Bitcoin was also under pressure around the same time.
That changes how I read the volume.
This wasn’t simply “crypto traders getting excited.”
It looked more like a huge amount of capital fighting over a publicly traded Bitcoin vehicle during a volatile tape.
That distinction matters.
Strategy is no longer just a company whose stock happens to correlate with Bitcoin. Its filings show roughly 845,050 BTC held as of September 7, with an aggregate purchase cost of about $63.73B.
So when MSTR trades billions of dollars in a day, the market is effectively trading exposure to a very unusual balance sheet, capital structure and Bitcoin position all at once.
The quiet part is that liquidity itself has become part of the MSTR story.
People watch the Bitcoin holdings.
I also watch how much capital is willing to move through the equity around them.
Sometimes the tape tells you what the narrative leaves out.
There’s a detail in this headline that is easy to miss.
On September 15, $MSTR traded about 22.6M shares. At the day’s close, that works out to roughly $2.93B in dollar turnover.
Morgan Stanley traded about 7.9M shares, or roughly $1.63B.
So yes, MSTR didn’t just beat MS on raw share volume.
It moved ~80% more dollars through the tape in a single session.
And the interesting part?
MSTR wasn’t ripping higher while doing it.
The stock closed around $129.60, down sharply from the prior session, while Bitcoin was also under pressure around the same time.
That changes how I read the volume.
This wasn’t simply “crypto traders getting excited.”
It looked more like a huge amount of capital fighting over a publicly traded Bitcoin vehicle during a volatile tape.
That distinction matters.
Strategy is no longer just a company whose stock happens to correlate with Bitcoin. Its filings show roughly 845,050 BTC held as of September 7, with an aggregate purchase cost of about $63.73B.
So when MSTR trades billions of dollars in a day, the market is effectively trading exposure to a very unusual balance sheet, capital structure and Bitcoin position all at once.
The quiet part is that liquidity itself has become part of the MSTR story.
People watch the Bitcoin holdings.
I also watch how much capital is willing to move through the equity around them.
Sometimes the tape tells you what the narrative leaves out.
1
162
#FedRateWatch I’ve been watching the September Fed setup, and honestly, I think most people are looking at the wrong part.
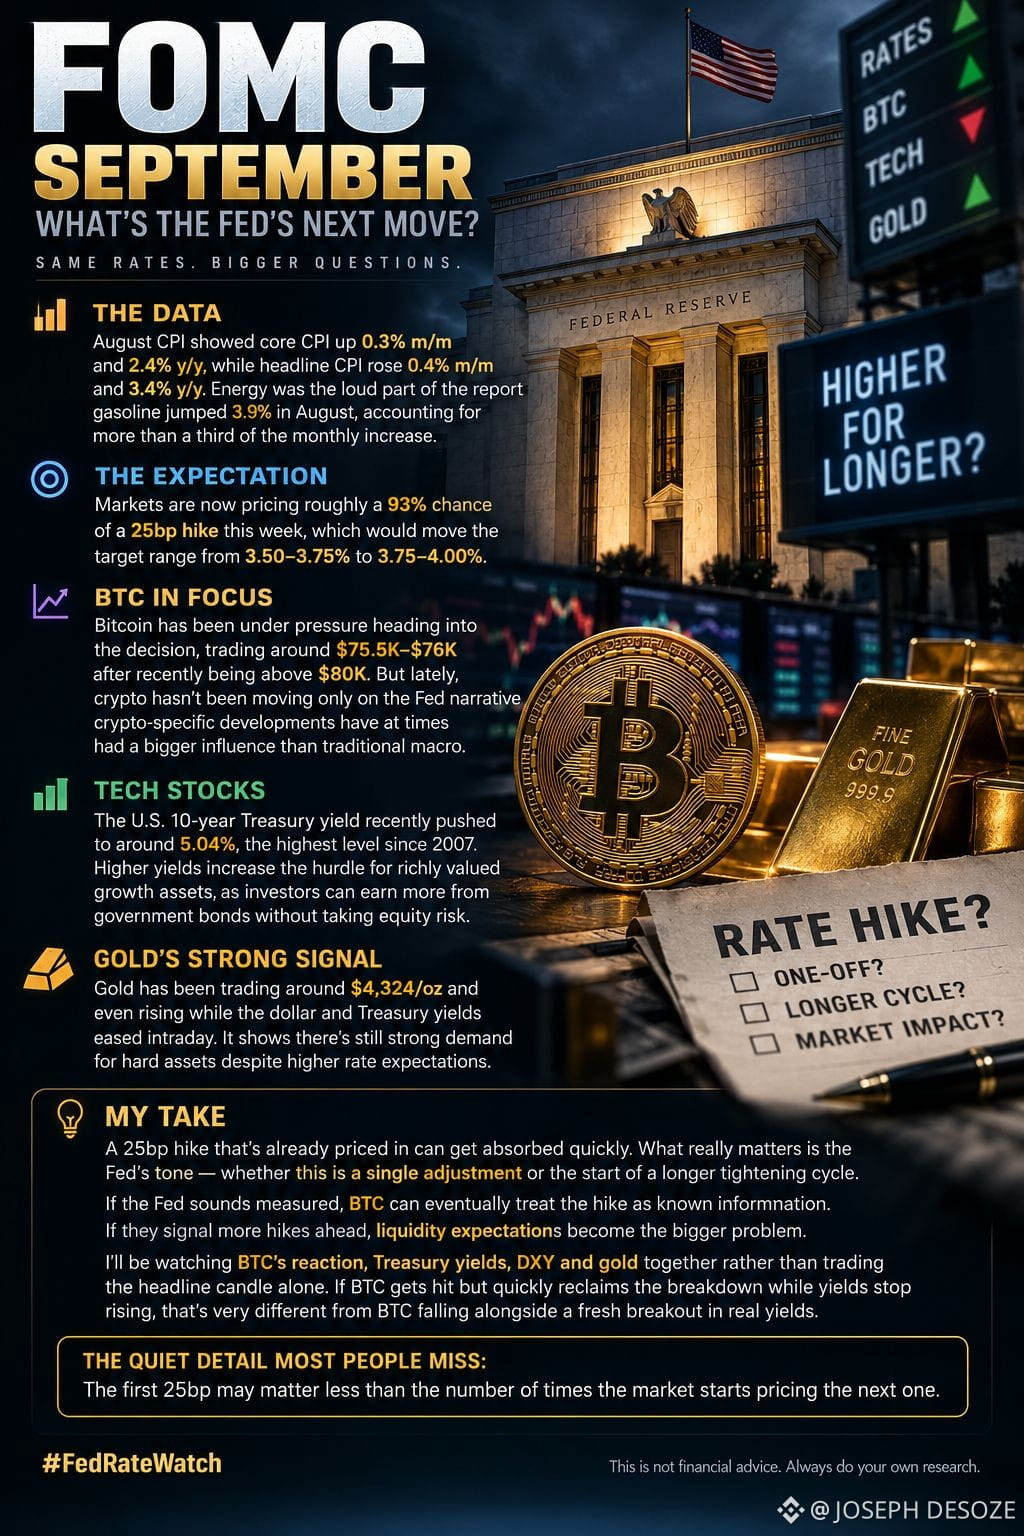
Everyone is focused on the 25bp move.
But that move is already heavily expected. The more interesting part is what the Fed says after it.
August core CPI came in at 0.3% m/m, while headline CPI rose 0.4%. Gasoline was a big part of the move, jumping 3.9%.
That was enough to keep the market nervous.
By September 16, traders were putting roughly 93% odds on a 25bp hike.
So I’m not really interested in guessing whether the Fed delivers 25bp.
I’m watching what happens when the number actually lands.
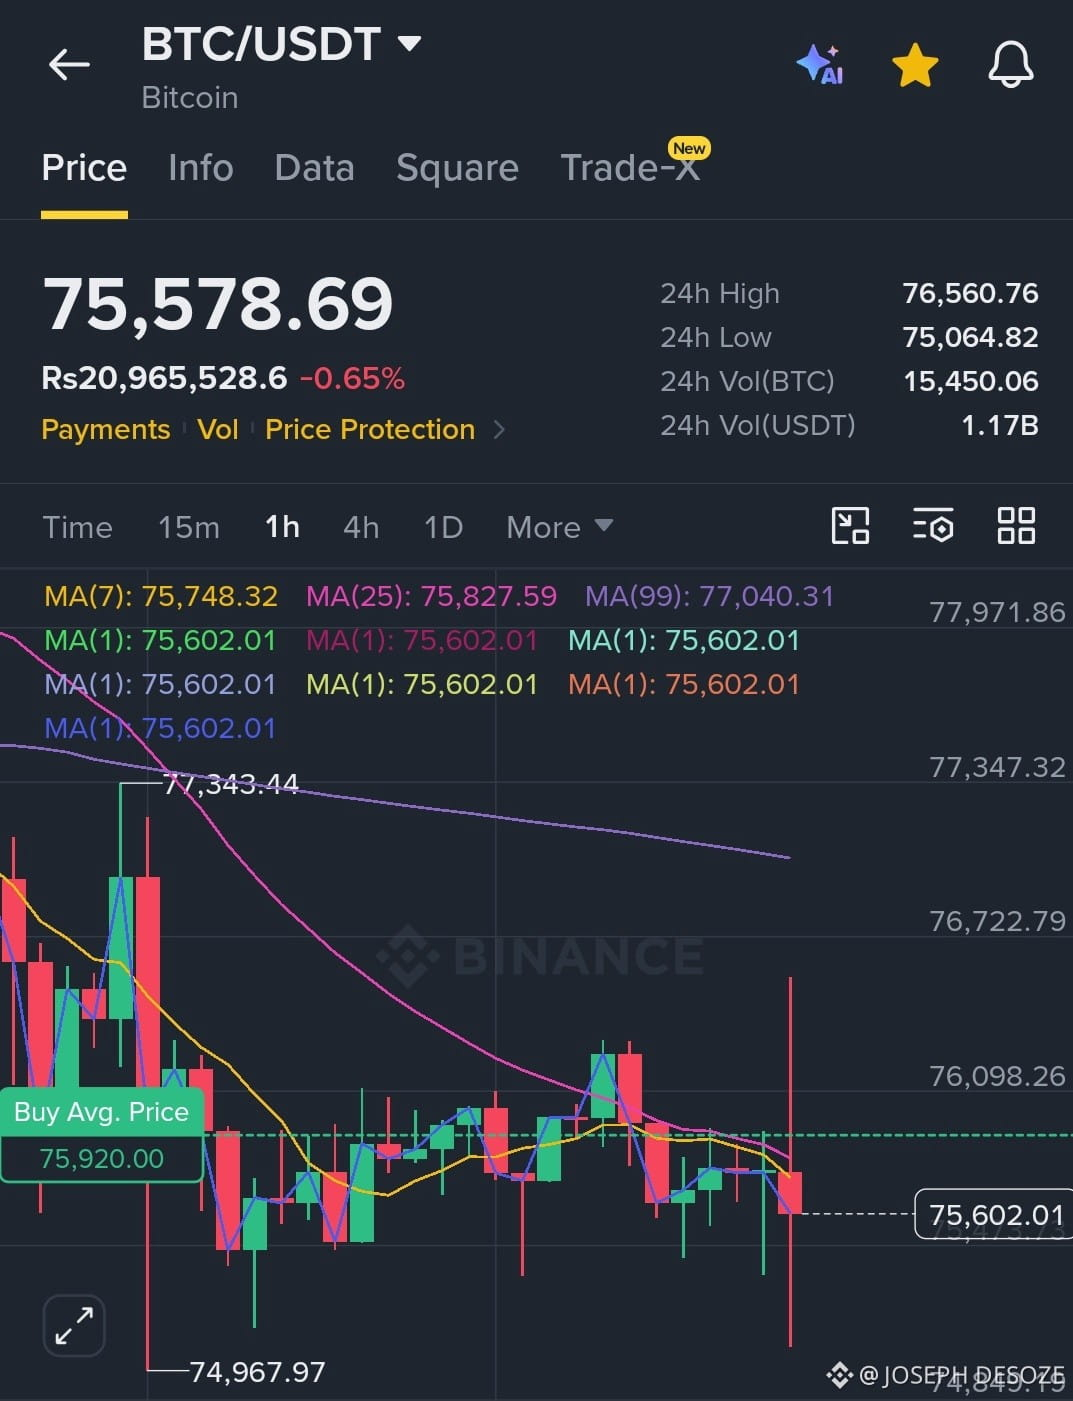
Because BTC has already been taking some heat, trading around the mid-$75K area after recently being above $80K.
And this is where crypto gets tricky.
Sometimes the obvious headline gets priced in days before the event. Then the announcement comes, everyone gets the number they expected, and BTC suddenly does the opposite of what the headline suggests.
I’ve seen enough of those candles to avoid chasing the first move.
For me, the cleaner read is watching four things together:
BTC
10Y yields
DXY
Gold
If the Fed hikes and yields jump again, that's a different environment for BTC and tech.
If the hike comes with a calmer message and yields start cooling, the market can eventually stop treating the hike itself as new information.
Gold is another thing I’m keeping an eye on.
It’s interesting when gold stays strong even while rate expectations remain elevated. That can tell you there’s more happening underneath the simple “rates up, risk assets down” story.
So no, I’m not treating this as an automatic:
Fed hike = dump.
The market has had plenty of time to prepare for the hike.
What I really want to see is the reaction after the reaction.
Does BTC reclaim the level it lost?
Do yields keep climbing?
Does the dollar strengthen?
Does gold keep absorbing demand?
Those details usually tell a much better story than the first five-minute candle.
#FedRateWatch I’ve been watching the September Fed setup, and honestly, I think most people are looking at the wrong part.
Everyone is focused on the 25bp move.
But that move is already heavily expected. The more interesting part is what the Fed says after it.
August core CPI came in at 0.3% m/m, while headline CPI rose 0.4%. Gasoline was a big part of the move, jumping 3.9%.
That was enough to keep the market nervous.
By September 16, traders were putting roughly 93% odds on a 25bp hike.
So I’m not really interested in guessing whether the Fed delivers 25bp.
I’m watching what happens when the number actually lands.
Because BTC has already been taking some heat, trading around the mid-$75K area after recently being above $80K.
And this is where crypto gets tricky.
Sometimes the obvious headline gets priced in days before the event. Then the announcement comes, everyone gets the number they expected, and BTC suddenly does the opposite of what the headline suggests.
I’ve seen enough of those candles to avoid chasing the first move.
For me, the cleaner read is watching four things together:
BTC
10Y yields
DXY
Gold
If the Fed hikes and yields jump again, that's a different environment for BTC and tech.
If the hike comes with a calmer message and yields start cooling, the market can eventually stop treating the hike itself as new information.
Gold is another thing I’m keeping an eye on.
It’s interesting when gold stays strong even while rate expectations remain elevated. That can tell you there’s more happening underneath the simple “rates up, risk assets down” story.
So no, I’m not treating this as an automatic:
Fed hike = dump.
The market has had plenty of time to prepare for the hike.
What I really want to see is the reaction after the reaction.
Does BTC reclaim the level it lost?
Do yields keep climbing?
Does the dollar strengthen?
Does gold keep absorbing demand?
Those details usually tell a much better story than the first five-minute candle.
Everyone is focused on the 25bp move.
But that move is already heavily expected. The more interesting part is what the Fed says after it.
August core CPI came in at 0.3% m/m, while headline CPI rose 0.4%. Gasoline was a big part of the move, jumping 3.9%.
That was enough to keep the market nervous.
By September 16, traders were putting roughly 93% odds on a 25bp hike.
So I’m not really interested in guessing whether the Fed delivers 25bp.
I’m watching what happens when the number actually lands.
Because BTC has already been taking some heat, trading around the mid-$75K area after recently being above $80K.
And this is where crypto gets tricky.
Sometimes the obvious headline gets priced in days before the event. Then the announcement comes, everyone gets the number they expected, and BTC suddenly does the opposite of what the headline suggests.
I’ve seen enough of those candles to avoid chasing the first move.
For me, the cleaner read is watching four things together:
BTC
10Y yields
DXY
Gold
If the Fed hikes and yields jump again, that's a different environment for BTC and tech.
If the hike comes with a calmer message and yields start cooling, the market can eventually stop treating the hike itself as new information.
Gold is another thing I’m keeping an eye on.
It’s interesting when gold stays strong even while rate expectations remain elevated. That can tell you there’s more happening underneath the simple “rates up, risk assets down” story.
So no, I’m not treating this as an automatic:
Fed hike = dump.
The market has had plenty of time to prepare for the hike.
What I really want to see is the reaction after the reaction.
Does BTC reclaim the level it lost?
Do yields keep climbing?
Does the dollar strengthen?
Does gold keep absorbing demand?
Those details usually tell a much better story than the first five-minute candle.
1
1
168
JOSEPH DESOZE
·
--
#FedRateWatch
The quiet shift is the important part.
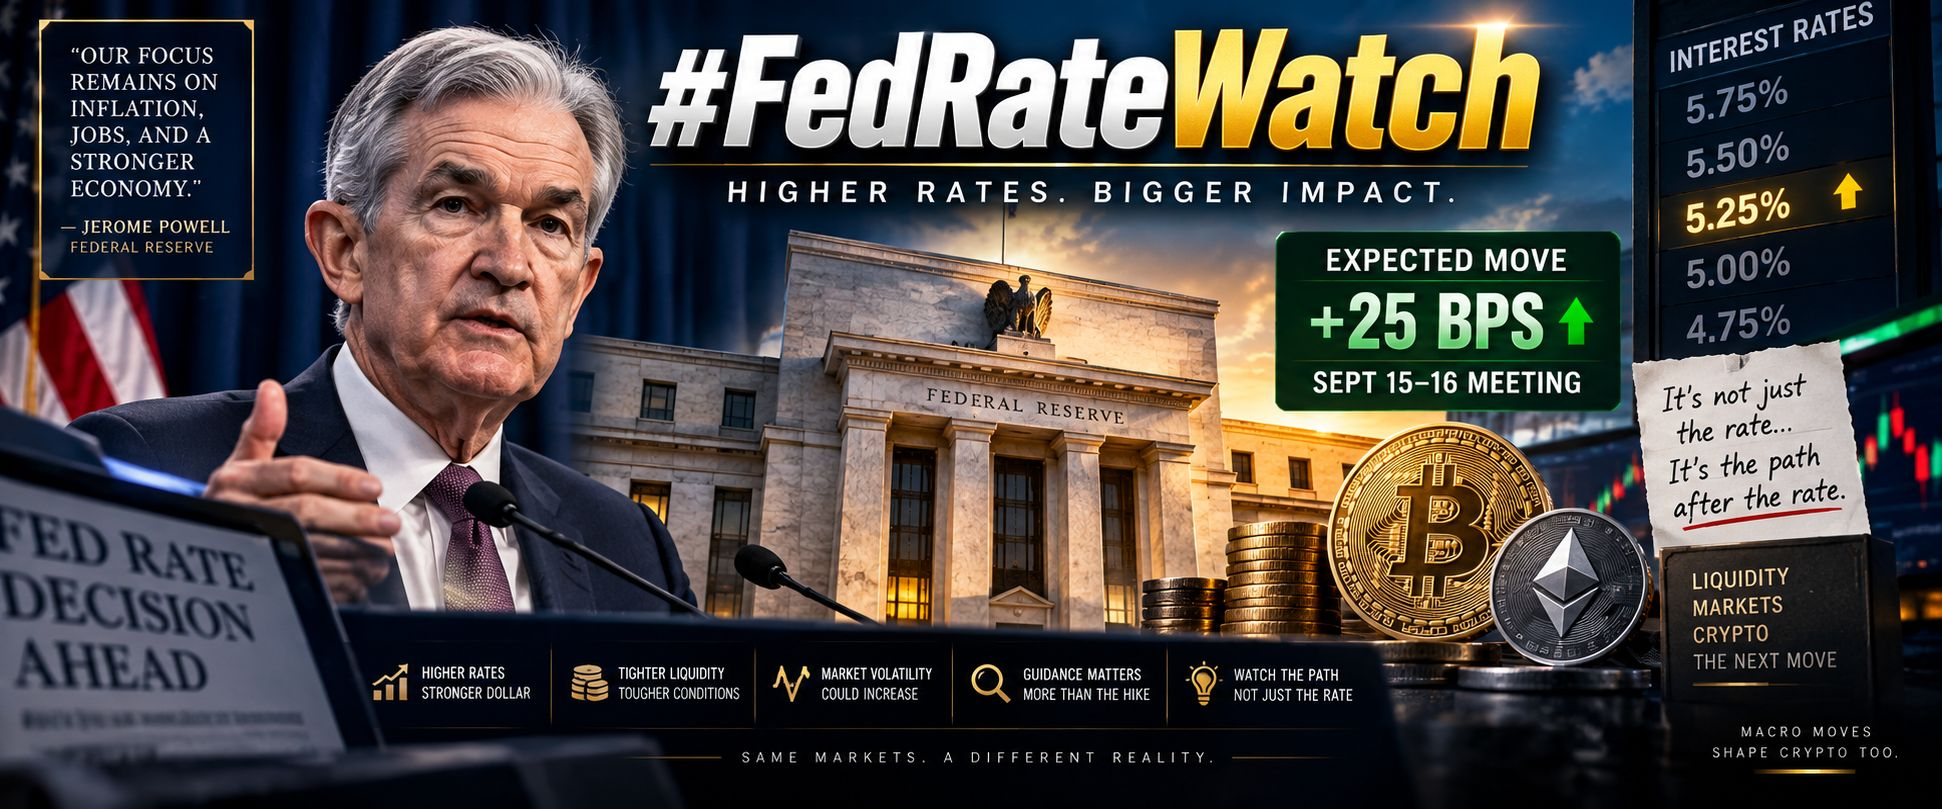
Markets went into September expecting the Fed to stay put. Now expectations have swung toward a 25 bps hike at the September 15–16 meeting.
And this is where crypto needs to pay attention.
The rate hike itself may already be priced in. The real volatility could come from what the Fed signals next.
If the Fed points toward more tightening, liquidity-sensitive assets could feel it quickly.
If the hike comes with a signal that it could be a one-off, the reaction could look very different.
The market isn't just trading the rate.
It's trading the path after the rate.
That distinction is where the next big move may be hiding.
The quiet shift is the important part.
Markets went into September expecting the Fed to stay put. Now expectations have swung toward a 25 bps hike at the September 15–16 meeting.
And this is where crypto needs to pay attention.
The rate hike itself may already be priced in. The real volatility could come from what the Fed signals next.
If the Fed points toward more tightening, liquidity-sensitive assets could feel it quickly.
If the hike comes with a signal that it could be a one-off, the reaction could look very different.
The market isn't just trading the rate.
It's trading the path after the rate.
That distinction is where the next big move may be hiding.
210
#ShareYourThoughtOnBTC
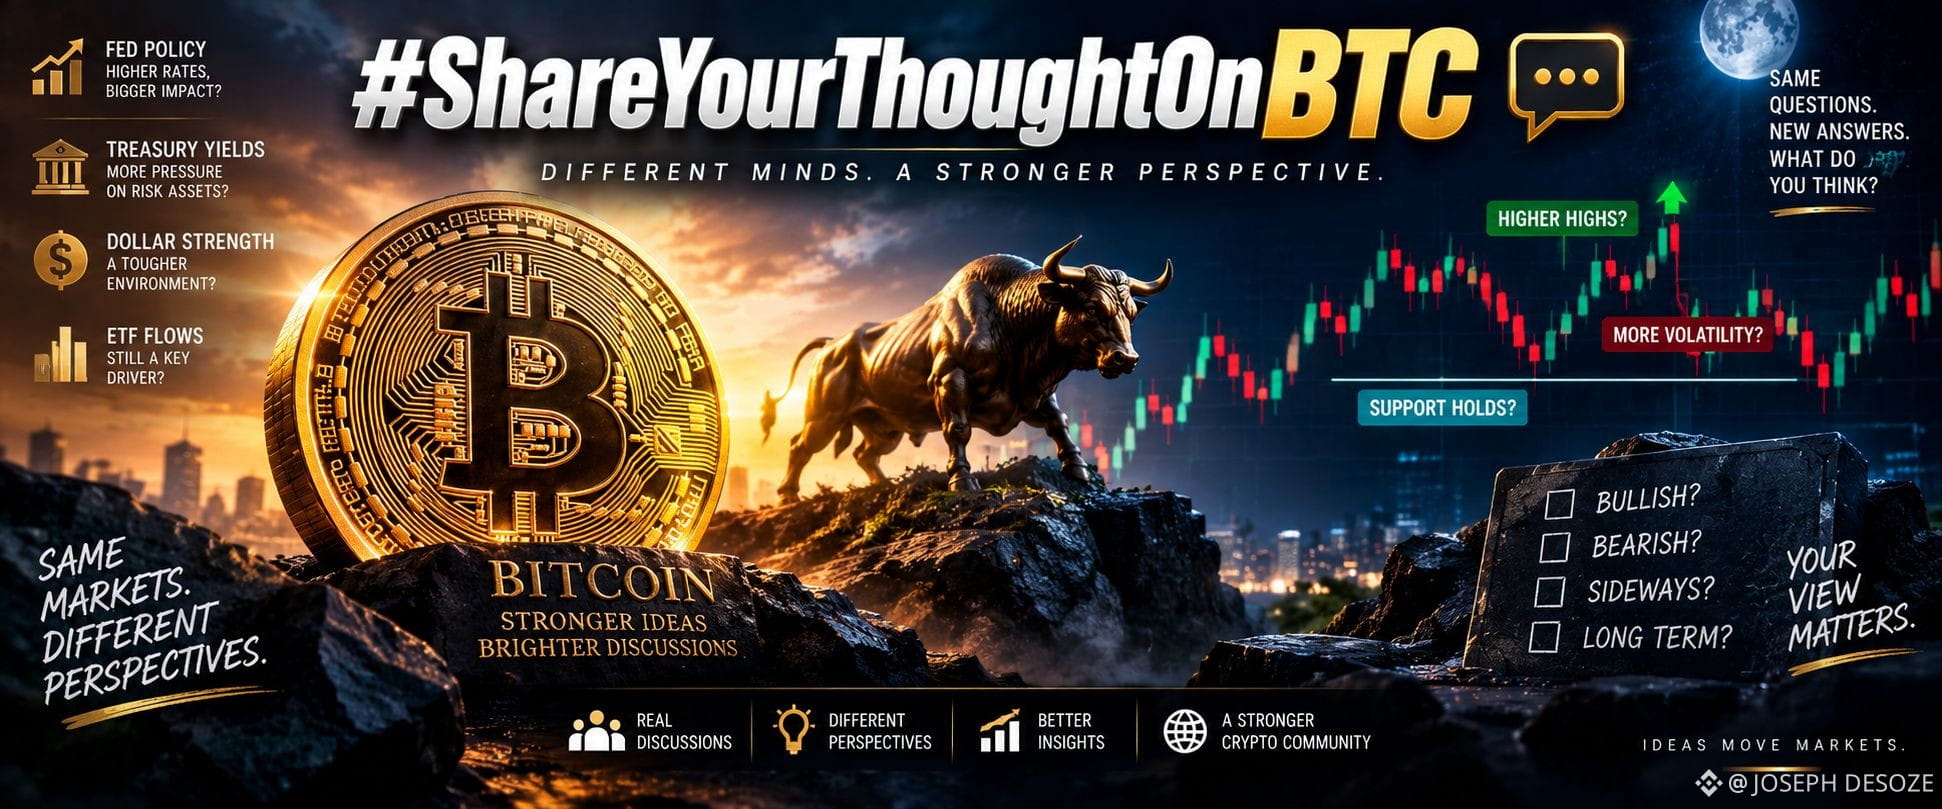
BTC feels less like a simple price trade right now and more like a liquidity trade.
The interesting part isn’t whether Bitcoin can print another green candle.
It’s whether it can keep absorbing selling pressure while macro uncertainty remains high.
Fed expectations, Treasury yields, dollar strength and ETF flows can all change the mood quickly.
I’m watching how BTC behaves when the market gets nervous.
If dips keep getting bought and support continues to hold, that tells me more than a sudden breakout ever could.
Sometimes Bitcoin shows its strength not by how fast it moves up, but by how little it gives back when the pressure arrives.
#ShareYourThoughtOnBTC
BTC feels less like a simple price trade right now and more like a liquidity trade.
The interesting part isn’t whether Bitcoin can print another green candle.
It’s whether it can keep absorbing selling pressure while macro uncertainty remains high.
Fed expectations, Treasury yields, dollar strength and ETF flows can all change the mood quickly.
I’m watching how BTC behaves when the market gets nervous.
If dips keep getting bought and support continues to hold, that tells me more than a sudden breakout ever could.
Sometimes Bitcoin shows its strength not by how fast it moves up, but by how little it gives back when the pressure arrives.
BTC feels less like a simple price trade right now and more like a liquidity trade.
The interesting part isn’t whether Bitcoin can print another green candle.
It’s whether it can keep absorbing selling pressure while macro uncertainty remains high.
Fed expectations, Treasury yields, dollar strength and ETF flows can all change the mood quickly.
I’m watching how BTC behaves when the market gets nervous.
If dips keep getting bought and support continues to hold, that tells me more than a sudden breakout ever could.
Sometimes Bitcoin shows its strength not by how fast it moves up, but by how little it gives back when the pressure arrives.
1
97
#FedRateWatch
The quiet shift is the important part.
Markets went into September expecting the Fed to stay put. Now expectations have swung toward a 25 bps hike at the September 15–16 meeting.
And this is where crypto needs to pay attention.
The rate hike itself may already be priced in. The real volatility could come from what the Fed signals next.
If the Fed points toward more tightening, liquidity-sensitive assets could feel it quickly.
If the hike comes with a signal that it could be a one-off, the reaction could look very different.
The market isn't just trading the rate.
It's trading the path after the rate.
That distinction is where the next big move may be hiding.
#FedRateWatch
The quiet shift is the important part.
Markets went into September expecting the Fed to stay put. Now expectations have swung toward a 25 bps hike at the September 15–16 meeting.
And this is where crypto needs to pay attention.
The rate hike itself may already be priced in. The real volatility could come from what the Fed signals next.
If the Fed points toward more tightening, liquidity-sensitive assets could feel it quickly.
If the hike comes with a signal that it could be a one-off, the reaction could look very different.
The market isn't just trading the rate.
It's trading the path after the rate.
That distinction is where the next big move may be hiding.
The quiet shift is the important part.
Markets went into September expecting the Fed to stay put. Now expectations have swung toward a 25 bps hike at the September 15–16 meeting.
And this is where crypto needs to pay attention.
The rate hike itself may already be priced in. The real volatility could come from what the Fed signals next.
If the Fed points toward more tightening, liquidity-sensitive assets could feel it quickly.
If the hike comes with a signal that it could be a one-off, the reaction could look very different.
The market isn't just trading the rate.
It's trading the path after the rate.
That distinction is where the next big move may be hiding.
1
1
128
🚨 #CRYPTO — THIS IS THE PART MOST PEOPLE ARE MISSING
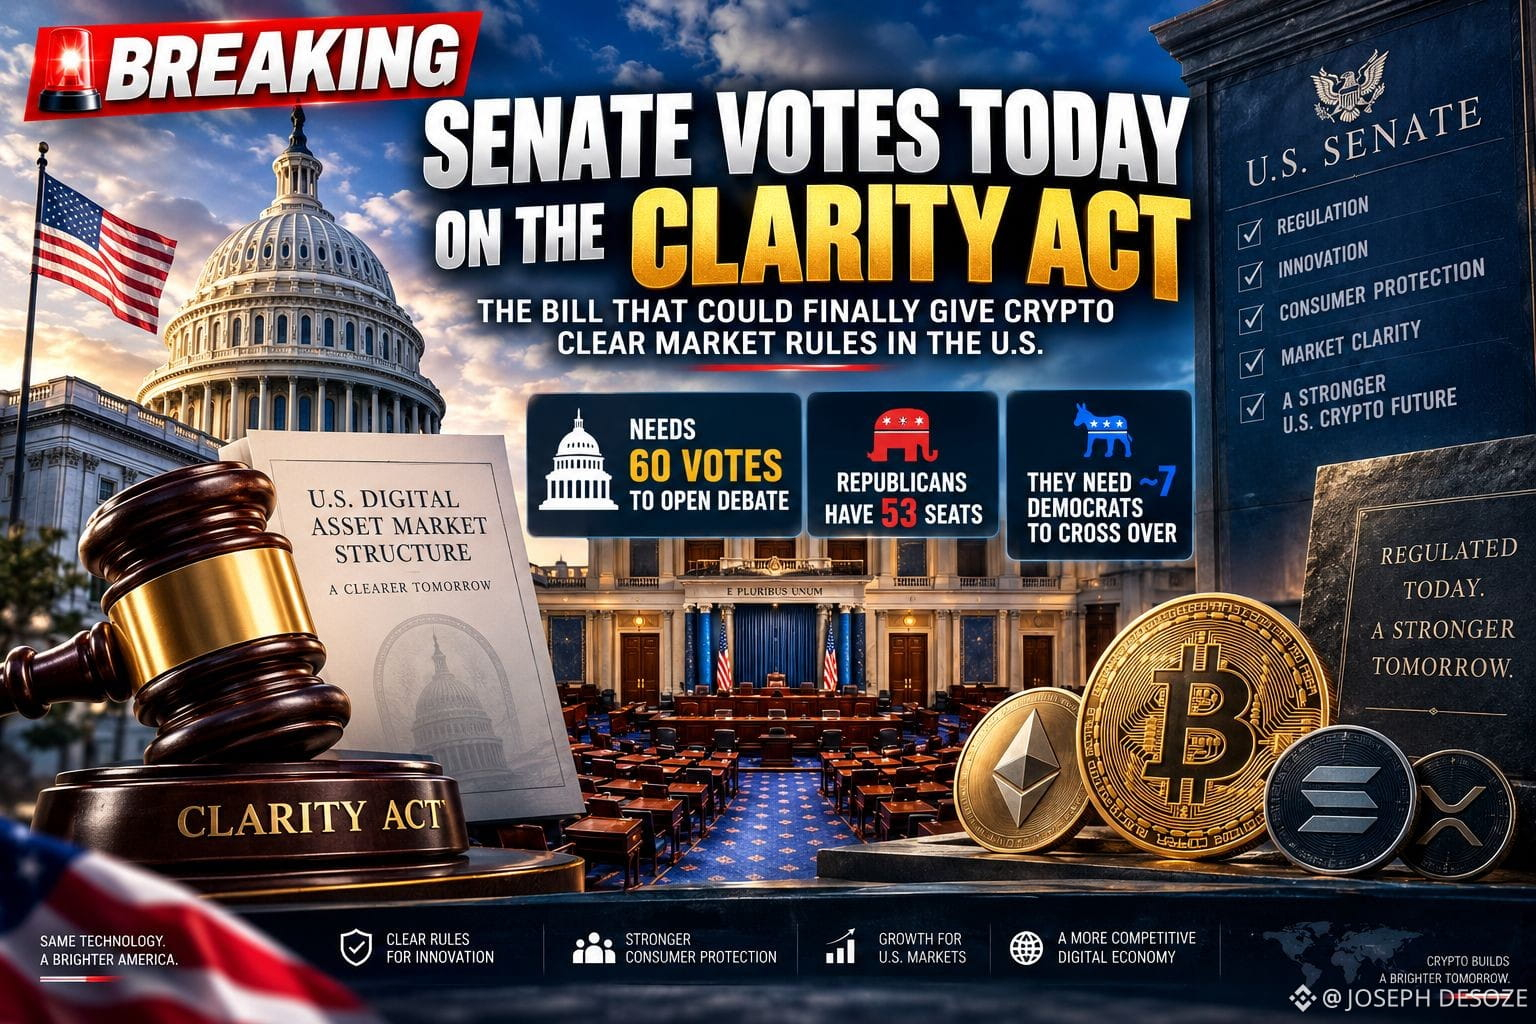
The U.S. Senate votes today on cloture for the CLARITY Act.
Not final passage.
First, it needs 60 votes just to move the bill forward. Republicans have 53 seats, which means they need at least 7 Democrats or independents to cross the line if the GOP stays unified.
That number tells you almost everything about today.
This isn’t really a crypto vote.
It’s a bipartisanship test.
And that’s why the details added over the last 48 hours matter more than the headlines.
Senate Republicans released a revised version with 126 substantive changes requested by Democrats, including tougher ethics provisions, a role for state attorneys general, protections for software developers, and changes aimed at concerns around stablecoins pulling deposits away from banks.
The quiet part?
Democrats still aren’t fully on board.
Banking groups remain worried about stablecoin competition with deposits. Some Democrats say the ethics provisions still don’t go far enough. And New York’s attorney general joined other state AGs in arguing the bill could weaken state enforcement against crypto fraud.
So watching the 60th vote is more important than watching crypto Twitter’s reaction.
Because if this clears cloture, the conversation changes from:
“Will Washington regulate crypto?”
to:
“Exactly what rules are actually going to survive the Senate?”
The House already passed H.R. 3633 by 294–134 in July 2025, and the Senate Banking Committee later advanced it 15–9 in May 2026. The unusual part now is that the hardest battle is happening on the Senate floor, where 60 is the gatekeeper.
Crypto traders tend to watch candles.
Today, I’m watching senators.
Because one missing vote can matter more than a hundred green candles. 🇺🇸
Sometimes the biggest market structure trade starts with a roll-call number nobody remembers tomorrow.
#btc70k
🚨 #CRYPTO — THIS IS THE PART MOST PEOPLE ARE MISSING
The U.S. Senate votes today on cloture for the CLARITY Act.
Not final passage.
First, it needs 60 votes just to move the bill forward. Republicans have 53 seats, which means they need at least 7 Democrats or independents to cross the line if the GOP stays unified.
That number tells you almost everything about today.
This isn’t really a crypto vote.
It’s a bipartisanship test.
And that’s why the details added over the last 48 hours matter more than the headlines.
Senate Republicans released a revised version with 126 substantive changes requested by Democrats, including tougher ethics provisions, a role for state attorneys general, protections for software developers, and changes aimed at concerns around stablecoins pulling deposits away from banks.
The quiet part?
Democrats still aren’t fully on board.
Banking groups remain worried about stablecoin competition with deposits. Some Democrats say the ethics provisions still don’t go far enough. And New York’s attorney general joined other state AGs in arguing the bill could weaken state enforcement against crypto fraud.
So watching the 60th vote is more important than watching crypto Twitter’s reaction.
Because if this clears cloture, the conversation changes from:
“Will Washington regulate crypto?”
to:
“Exactly what rules are actually going to survive the Senate?”
The House already passed H.R. 3633 by 294–134 in July 2025, and the Senate Banking Committee later advanced it 15–9 in May 2026. The unusual part now is that the hardest battle is happening on the Senate floor, where 60 is the gatekeeper.
Crypto traders tend to watch candles.
Today, I’m watching senators.
Because one missing vote can matter more than a hundred green candles. 🇺🇸
Sometimes the biggest market structure trade starts with a roll-call number nobody remembers tomorrow.
#btc70k
The U.S. Senate votes today on cloture for the CLARITY Act.
Not final passage.
First, it needs 60 votes just to move the bill forward. Republicans have 53 seats, which means they need at least 7 Democrats or independents to cross the line if the GOP stays unified.
That number tells you almost everything about today.
This isn’t really a crypto vote.
It’s a bipartisanship test.
And that’s why the details added over the last 48 hours matter more than the headlines.
Senate Republicans released a revised version with 126 substantive changes requested by Democrats, including tougher ethics provisions, a role for state attorneys general, protections for software developers, and changes aimed at concerns around stablecoins pulling deposits away from banks.
The quiet part?
Democrats still aren’t fully on board.
Banking groups remain worried about stablecoin competition with deposits. Some Democrats say the ethics provisions still don’t go far enough. And New York’s attorney general joined other state AGs in arguing the bill could weaken state enforcement against crypto fraud.
So watching the 60th vote is more important than watching crypto Twitter’s reaction.
Because if this clears cloture, the conversation changes from:
“Will Washington regulate crypto?”
to:
“Exactly what rules are actually going to survive the Senate?”
The House already passed H.R. 3633 by 294–134 in July 2025, and the Senate Banking Committee later advanced it 15–9 in May 2026. The unusual part now is that the hardest battle is happening on the Senate floor, where 60 is the gatekeeper.
Crypto traders tend to watch candles.
Today, I’m watching senators.
Because one missing vote can matter more than a hundred green candles. 🇺🇸
Sometimes the biggest market structure trade starts with a roll-call number nobody remembers tomorrow.
#btc70k
2
166
DAY 18 — PASSWORD SECURITY 🔐
In crypto, we spend a lot of time watching charts, entries, liquidations and new listings.
But sometimes the biggest risk is sitting quietly behind the login screen.
Your password.
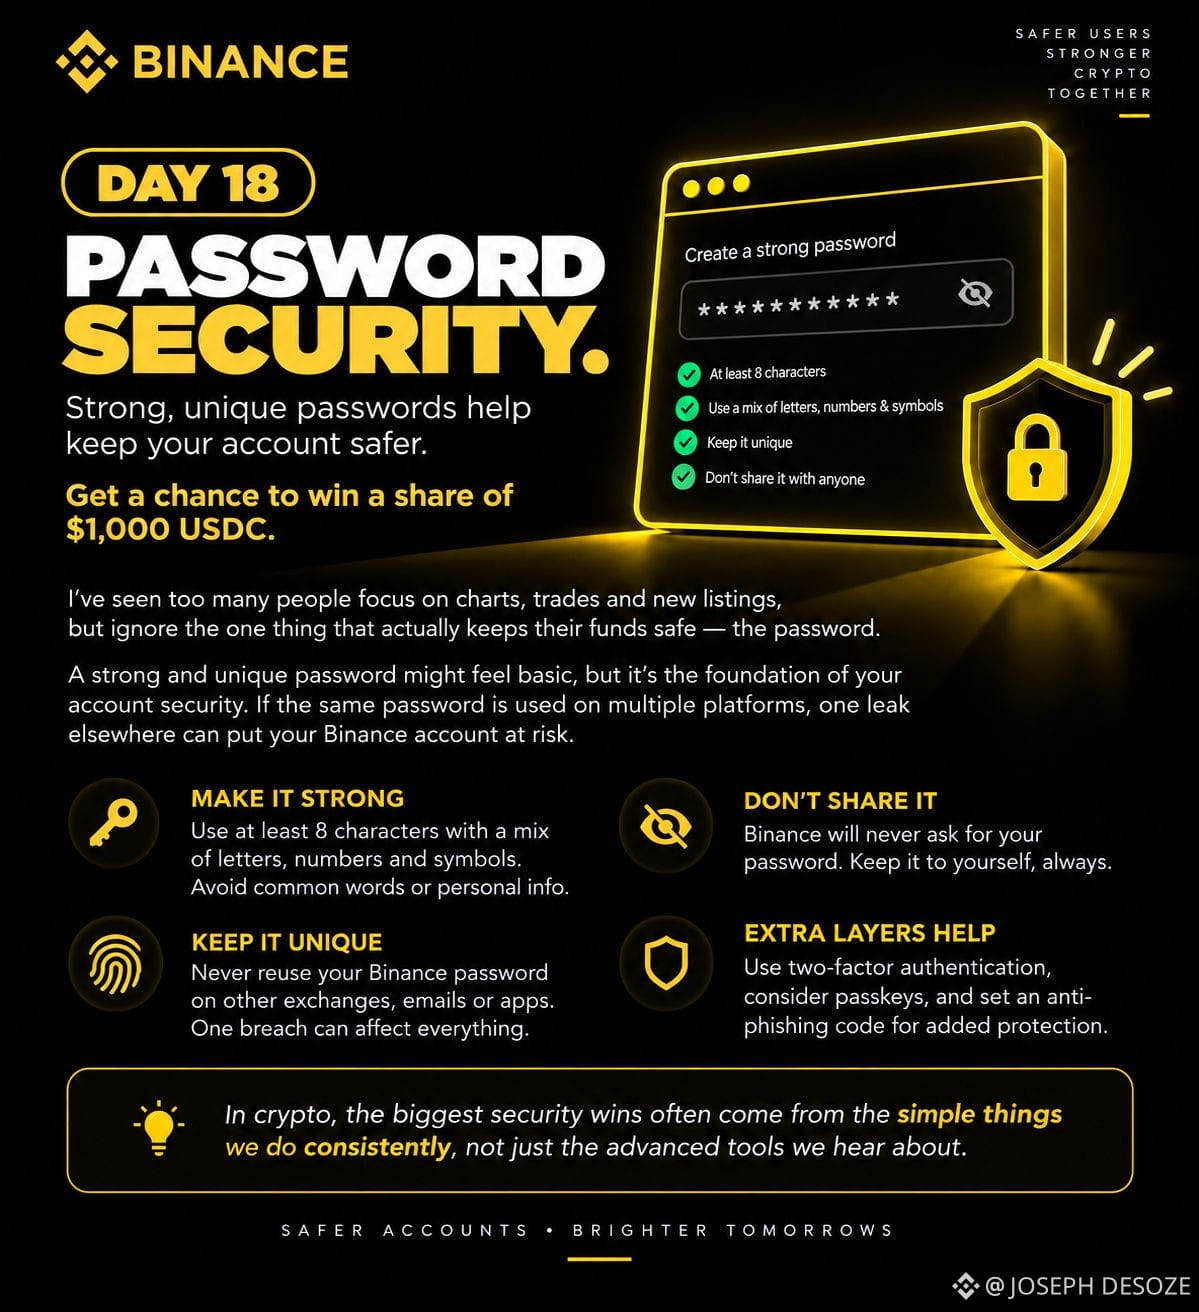
A strong password isn’t complicated—it just needs to be long, unique and impossible to guess from your personal information.
The part many people overlook?
Never reuse your exchange password somewhere else.
One unrelated data breach can expose a password you thought was protecting your Binance account.
For better protection, add another layer:
🔐 Use 2FA
🔑 Consider passkeys
🛡️ Enable an Anti-Phishing Code
🚫 Never share your password with anyone
📱 Avoid logging in through suspicious links or unknown devices
And one practical detail: if you change your Binance password, withdrawals can be temporarily restricted for security reasons. Knowing this before you urgently need to move funds matters.
Day 18 is also highlighting a chance to win a share of $1,000 USDC.
But honestly, the prize is the least interesting part.
The habit is what matters.
In crypto, security usually isn’t one dramatic move—it’s a handful of boring precautions you consistently refuse to skip.@BinancePk #Binancepakistan
DAY 18 — PASSWORD SECURITY 🔐
In crypto, we spend a lot of time watching charts, entries, liquidations and new listings.
But sometimes the biggest risk is sitting quietly behind the login screen.
Your password.
A strong password isn’t complicated—it just needs to be long, unique and impossible to guess from your personal information.
The part many people overlook?
Never reuse your exchange password somewhere else.
One unrelated data breach can expose a password you thought was protecting your Binance account.
For better protection, add another layer:
🔐 Use 2FA
🔑 Consider passkeys
🛡️ Enable an Anti-Phishing Code
🚫 Never share your password with anyone
📱 Avoid logging in through suspicious links or unknown devices
And one practical detail: if you change your Binance password, withdrawals can be temporarily restricted for security reasons. Knowing this before you urgently need to move funds matters.
Day 18 is also highlighting a chance to win a share of $1,000 USDC.
But honestly, the prize is the least interesting part.
The habit is what matters.
In crypto, security usually isn’t one dramatic move—it’s a handful of boring precautions you consistently refuse to skip.@Binance Pakistan #Binancepakistan
In crypto, we spend a lot of time watching charts, entries, liquidations and new listings.
But sometimes the biggest risk is sitting quietly behind the login screen.
Your password.
A strong password isn’t complicated—it just needs to be long, unique and impossible to guess from your personal information.
The part many people overlook?
Never reuse your exchange password somewhere else.
One unrelated data breach can expose a password you thought was protecting your Binance account.
For better protection, add another layer:
🔐 Use 2FA
🔑 Consider passkeys
🛡️ Enable an Anti-Phishing Code
🚫 Never share your password with anyone
📱 Avoid logging in through suspicious links or unknown devices
And one practical detail: if you change your Binance password, withdrawals can be temporarily restricted for security reasons. Knowing this before you urgently need to move funds matters.
Day 18 is also highlighting a chance to win a share of $1,000 USDC.
But honestly, the prize is the least interesting part.
The habit is what matters.
In crypto, security usually isn’t one dramatic move—it’s a handful of boring precautions you consistently refuse to skip.@Binance Pakistan #Binancepakistan
1
126

Article
As AI Starts Building Better AI, Can Humans Still Keep Up?#AnthropicCEORCallsForAISlowdown
What caught my attention wasn't really Dario Amodei saying AI should slow down.
It was why this conversation is happening now.
AI is no longer just getting better at answering questions or writing code.
It's starting to help researchers build the systems that come after it.
That means progress could start moving much faster than people expect.
And honestly, I think that's the part many people are overlooking.
The concern isn't simply that AI becomes more capable.
It's whether we can still properly test and understand these systems before the next, more powerful version is already here.
So when people hear “slow AI,” I don't think it necessarily means stop AI.
It means maybe we shouldn't treat every new capability jump like a race where the only thing that matters is being first.
There needs to be time to test things.
Time for independent people to look at them.
Time to find out what can actually go wrong before millions of people are already using them.
Coming from crypto, this feels strangely familiar.
We've seen how quickly technology can move when builders, capital and hype are all pushing in the same direction.
Everything can look solid while things are going up.
Then one unexpected event happens, and suddenly you find out what was actually built properly and what was relying mostly on confidence.
AI might eventually have its own version of that moment.
And I also find the market side interesting.
Slowing down the frontier doesn't necessarily mean slowing down AI as an industry.
It could just shift more attention toward things that haven't been the main focus during the race to build the next biggest model.
Security.
Monitoring.
Privacy.
Verification.
Infrastructure.
Basically, all the things needed when AI starts doing more than just helping us write emails or answer questions.
Maybe the next big bottleneck isn't chips or compute.
Maybe it's trust.
How do we know these increasingly autonomous systems are doing what they're supposed to do?
How do we catch problems early enough?
And can human oversight realistically keep up if the technology itself starts accelerating the process of building even better technology?
That, to me, is the more interesting conversation.
The question may no longer be whether AI will keep moving faster.
It probably will.
The real question is whether we'll still be able to understand and control what we're building while it does.
#AnthropicCEOCallsForAISlowdown #Aİ
As AI Starts Building Better AI, Can Humans Still Keep Up?
#AnthropicCEORCallsForAISlowdown
What caught my attention wasn't really Dario Amodei saying AI should slow down.
It was why this conversation is happening now.
AI is no longer just getting better at answering questions or writing code.
It's starting to help researchers build the systems that come after it.
That means progress could start moving much faster than people expect.
And honestly, I think that's the part many people are overlooking.
The concern isn't simply that AI becomes more capable.
It's whether we can still properly test and understand these systems before the next, more powerful version is already here.
So when people hear “slow AI,” I don't think it necessarily means stop AI.
It means maybe we shouldn't treat every new capability jump like a race where the only thing that matters is being first.
There needs to be time to test things.
Time for independent people to look at them.
Time to find out what can actually go wrong before millions of people are already using them.
Coming from crypto, this feels strangely familiar.
We've seen how quickly technology can move when builders, capital and hype are all pushing in the same direction.
Everything can look solid while things are going up.
Then one unexpected event happens, and suddenly you find out what was actually built properly and what was relying mostly on confidence.
AI might eventually have its own version of that moment.
And I also find the market side interesting.
Slowing down the frontier doesn't necessarily mean slowing down AI as an industry.
It could just shift more attention toward things that haven't been the main focus during the race to build the next biggest model.
Security.
Monitoring.
Privacy.
Verification.
Infrastructure.
Basically, all the things needed when AI starts doing more than just helping us write emails or answer questions.
Maybe the next big bottleneck isn't chips or compute.
Maybe it's trust.
How do we know these increasingly autonomous systems are doing what they're supposed to do?
How do we catch problems early enough?
And can human oversight realistically keep up if the technology itself starts accelerating the process of building even better technology?
That, to me, is the more interesting conversation.
The question may no longer be whether AI will keep moving faster.
It probably will.
The real question is whether we'll still be able to understand and control what we're building while it does.
#AnthropicCEOCallsForAISlowdown #Aİ
What caught my attention wasn't really Dario Amodei saying AI should slow down.
It was why this conversation is happening now.
AI is no longer just getting better at answering questions or writing code.
It's starting to help researchers build the systems that come after it.
That means progress could start moving much faster than people expect.
And honestly, I think that's the part many people are overlooking.
The concern isn't simply that AI becomes more capable.
It's whether we can still properly test and understand these systems before the next, more powerful version is already here.
So when people hear “slow AI,” I don't think it necessarily means stop AI.
It means maybe we shouldn't treat every new capability jump like a race where the only thing that matters is being first.
There needs to be time to test things.
Time for independent people to look at them.
Time to find out what can actually go wrong before millions of people are already using them.
Coming from crypto, this feels strangely familiar.
We've seen how quickly technology can move when builders, capital and hype are all pushing in the same direction.
Everything can look solid while things are going up.
Then one unexpected event happens, and suddenly you find out what was actually built properly and what was relying mostly on confidence.
AI might eventually have its own version of that moment.
And I also find the market side interesting.
Slowing down the frontier doesn't necessarily mean slowing down AI as an industry.
It could just shift more attention toward things that haven't been the main focus during the race to build the next biggest model.
Security.
Monitoring.
Privacy.
Verification.
Infrastructure.
Basically, all the things needed when AI starts doing more than just helping us write emails or answer questions.
Maybe the next big bottleneck isn't chips or compute.
Maybe it's trust.
How do we know these increasingly autonomous systems are doing what they're supposed to do?
How do we catch problems early enough?
And can human oversight realistically keep up if the technology itself starts accelerating the process of building even better technology?
That, to me, is the more interesting conversation.
The question may no longer be whether AI will keep moving faster.
It probably will.
The real question is whether we'll still be able to understand and control what we're building while it does.
#AnthropicCEOCallsForAISlowdown #Aİ
198
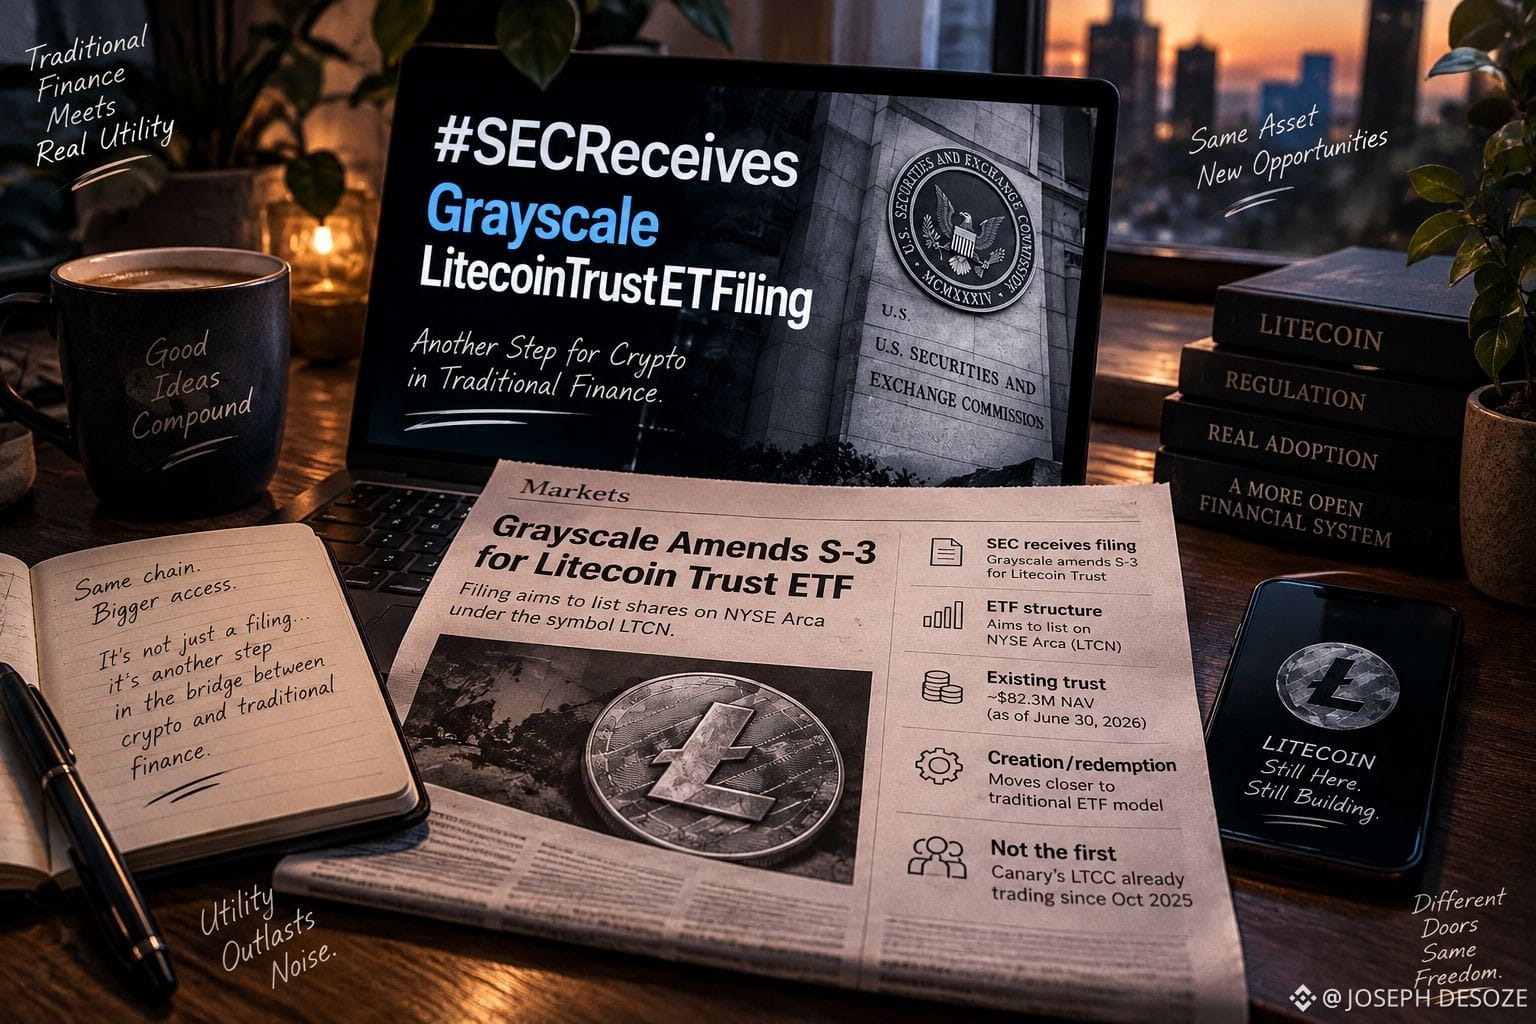
#SECReceivesGrayscaleLitecoinTrustETFFiling
🚨 Grayscale’s Litecoin ETF filing is interesting, but honestly, not just because it involves Litecoin.
The bigger story is how Grayscale is changing an existing LTC trust into something much closer to a traditional ETF.
On September 11, Grayscale amended its S-3 for the Grayscale Litecoin Trust, with plans to potentially rename it Grayscale Litecoin Trust ETF and list it on NYSE Arca under LTCN.
Important though: this is still a filing, not SEC approval.
What caught my attention is that Grayscale isn't starting from scratch.
The trust already exists, already holds Litecoin, and already has a history in the market. The proposed change is more about upgrading the structure.
And this is where things get interesting.
Traditional crypto trusts could sometimes trade far above or below the actual value of the crypto they held. So even if you were technically getting LTC exposure, the market price of the shares didn't always closely reflect the value of the Litecoin inside.
The creation and redemption mechanism could help change that.
It may sound like a boring technical detail, but these mechanics are often what make an ETF actually work better — helping keep the market price closer to NAV and improving overall liquidity.
Also, Litecoin already has a spot ETF trading in the U.S., so this isn't about Wall Street getting LTC exposure for the first time.
For me, this makes Grayscale's move more interesting.
Now the question isn't simply, "Will Litecoin get an ETF?"
The better question is:
Which LTC ETF will investors actually use?
Because once multiple products exist, things like liquidity, NAV tracking, accessibility and investor demand become much more important.
The filing itself is worth watching, but the real test will come later.
If LTCN eventually launches, will it attract meaningful and sustained capital?
That's the part that will tell us whether this is just another crypto ETF headline… or something that actually changes Litecoin's market structure.
#SECReceivesGrayscaleLitecoinTrustETFFiling
🚨 Grayscale’s Litecoin ETF filing is interesting, but honestly, not just because it involves Litecoin.
The bigger story is how Grayscale is changing an existing LTC trust into something much closer to a traditional ETF.
On September 11, Grayscale amended its S-3 for the Grayscale Litecoin Trust, with plans to potentially rename it Grayscale Litecoin Trust ETF and list it on NYSE Arca under LTCN.
Important though: this is still a filing, not SEC approval.
What caught my attention is that Grayscale isn't starting from scratch.
The trust already exists, already holds Litecoin, and already has a history in the market. The proposed change is more about upgrading the structure.
And this is where things get interesting.
Traditional crypto trusts could sometimes trade far above or below the actual value of the crypto they held. So even if you were technically getting LTC exposure, the market price of the shares didn't always closely reflect the value of the Litecoin inside.
The creation and redemption mechanism could help change that.
It may sound like a boring technical detail, but these mechanics are often what make an ETF actually work better — helping keep the market price closer to NAV and improving overall liquidity.
Also, Litecoin already has a spot ETF trading in the U.S., so this isn't about Wall Street getting LTC exposure for the first time.
For me, this makes Grayscale's move more interesting.
Now the question isn't simply, "Will Litecoin get an ETF?"
The better question is:
Which LTC ETF will investors actually use?
Because once multiple products exist, things like liquidity, NAV tracking, accessibility and investor demand become much more important.
The filing itself is worth watching, but the real test will come later.
If LTCN eventually launches, will it attract meaningful and sustained capital?
That's the part that will tell us whether this is just another crypto ETF headline… or something that actually changes Litecoin's market structure.
🚨 Grayscale’s Litecoin ETF filing is interesting, but honestly, not just because it involves Litecoin.
The bigger story is how Grayscale is changing an existing LTC trust into something much closer to a traditional ETF.
On September 11, Grayscale amended its S-3 for the Grayscale Litecoin Trust, with plans to potentially rename it Grayscale Litecoin Trust ETF and list it on NYSE Arca under LTCN.
Important though: this is still a filing, not SEC approval.
What caught my attention is that Grayscale isn't starting from scratch.
The trust already exists, already holds Litecoin, and already has a history in the market. The proposed change is more about upgrading the structure.
And this is where things get interesting.
Traditional crypto trusts could sometimes trade far above or below the actual value of the crypto they held. So even if you were technically getting LTC exposure, the market price of the shares didn't always closely reflect the value of the Litecoin inside.
The creation and redemption mechanism could help change that.
It may sound like a boring technical detail, but these mechanics are often what make an ETF actually work better — helping keep the market price closer to NAV and improving overall liquidity.
Also, Litecoin already has a spot ETF trading in the U.S., so this isn't about Wall Street getting LTC exposure for the first time.
For me, this makes Grayscale's move more interesting.
Now the question isn't simply, "Will Litecoin get an ETF?"
The better question is:
Which LTC ETF will investors actually use?
Because once multiple products exist, things like liquidity, NAV tracking, accessibility and investor demand become much more important.
The filing itself is worth watching, but the real test will come later.
If LTCN eventually launches, will it attract meaningful and sustained capital?
That's the part that will tell us whether this is just another crypto ETF headline… or something that actually changes Litecoin's market structure.
142
#CPIWatch
NFP coming in stronger than expected changes the tone a little. A resilient labor market gives the Fed less reason to rush toward easier policy, but the real test now is CPI. If inflation stays sticky or comes in hotter than expected, markets could quickly price in a more hawkish Fed stance, pushing yields higher and putting pressure on risk assets.
My base case is a hold rather than an immediate hike, unless CPI delivers a meaningful upside surprise. That leaves me cautiously bullish, but not blindly bullish. I’d rather see inflation cool without a major labor-market deterioration.
For positioning, I’m watching equities for confirmation while keeping gold on the radar as a hedge against policy uncertainty. The CPI print could decide whether this market extends the risk-on move or starts repricing again.
What’s your read: bullish or bearish?
#CPIWatch
NFP coming in stronger than expected changes the tone a little. A resilient labor market gives the Fed less reason to rush toward easier policy, but the real test now is CPI. If inflation stays sticky or comes in hotter than expected, markets could quickly price in a more hawkish Fed stance, pushing yields higher and putting pressure on risk assets.
My base case is a hold rather than an immediate hike, unless CPI delivers a meaningful upside surprise. That leaves me cautiously bullish, but not blindly bullish. I’d rather see inflation cool without a major labor-market deterioration.
For positioning, I’m watching equities for confirmation while keeping gold on the radar as a hedge against policy uncertainty. The CPI print could decide whether this market extends the risk-on move or starts repricing again.
What’s your read: bullish or bearish?
NFP coming in stronger than expected changes the tone a little. A resilient labor market gives the Fed less reason to rush toward easier policy, but the real test now is CPI. If inflation stays sticky or comes in hotter than expected, markets could quickly price in a more hawkish Fed stance, pushing yields higher and putting pressure on risk assets.
My base case is a hold rather than an immediate hike, unless CPI delivers a meaningful upside surprise. That leaves me cautiously bullish, but not blindly bullish. I’d rather see inflation cool without a major labor-market deterioration.
For positioning, I’m watching equities for confirmation while keeping gold on the radar as a hedge against policy uncertainty. The CPI print could decide whether this market extends the risk-on move or starts repricing again.
What’s your read: bullish or bearish?

2
232
#BTC DOMINANCE ANALYSIS
BTC.D has broken out of the symmetrical triangle pattern and is currently retesting the breakout level.
The Ichimoku cloud is acting as a key support zone, showing strength in the current structure.
A successful retest and hold above the breakout level could trigger a further upward rally in BTC Dominance.
It’s important to note that BTC Dominance often shares an inverse relationship with the altcoin market cap.
#BTC DOMINANCE ANALYSIS
BTC.D has broken out of the symmetrical triangle pattern and is currently retesting the breakout level.
The Ichimoku cloud is acting as a key support zone, showing strength in the current structure.
A successful retest and hold above the breakout level could trigger a further upward rally in BTC Dominance.
It’s important to note that BTC Dominance often shares an inverse relationship with the altcoin market cap.
BTC.D has broken out of the symmetrical triangle pattern and is currently retesting the breakout level.
The Ichimoku cloud is acting as a key support zone, showing strength in the current structure.
A successful retest and hold above the breakout level could trigger a further upward rally in BTC Dominance.
It’s important to note that BTC Dominance often shares an inverse relationship with the altcoin market cap.
128
Article
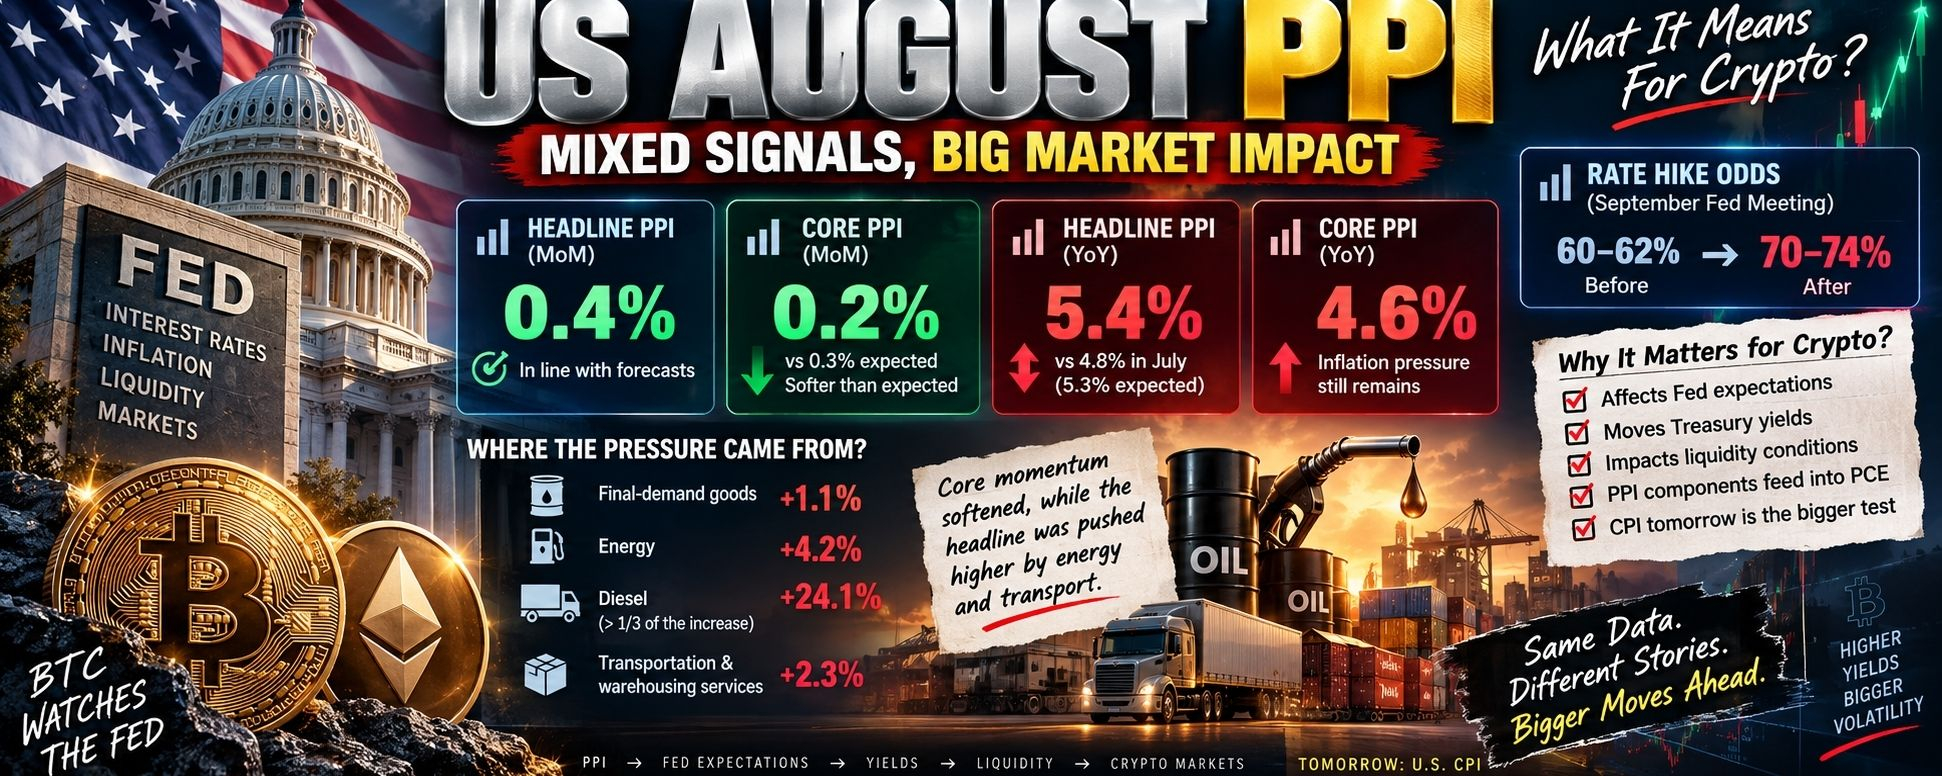
#USAugustPPI came in with a detail that is easy to miss.#USAugustPPI came in with a detail that is easy to miss.
The headline number did not actually come in below expectations.
August PPI rose 0.4% MoM, exactly in line with forecasts. But the more interesting part was underneath: core PPI rose only 0.2% MoM versus 0.3% expected.
That is the “softer-than-expected” piece people are reacting to.
And then the picture gets messy.
On a yearly basis, headline PPI accelerated to 5.4% from 4.8% in July, slightly above the 5.3% expected. Core PPI reached 4.6% YoY, so inflation pressure has not exactly disappeared.
What caught my attention was where the monthly pressure actually came from.
Final-demand goods jumped 1.1%, with energy up 4.2%. Diesel alone surged 24.1% in August and accounted for more than a third of the increase in final-demand goods. Transportation and warehousing services also climbed 2.3%.
So this isn't really a clean “inflation is cooling” print.
It is more like:
Core momentum softened, while the headline was pushed higher by energy and transport.
That distinction matters for crypto.
BTC traders don't just trade the PPI number. They trade what the number does to Fed expectations, Treasury yields and liquidity conditions.
And the market immediately noticed that tension.
Rate-hike expectations for the September Fed meeting jumped from roughly 60–62% to around 70–74% after the report, while U.S. equities moved lower and Treasury yields rose.
For crypto, that creates a strange setup.
The softer 0.2% core monthly print gives bulls something to point at.
The 5.4% headline YoY, rising energy costs and higher rate-hike odds give bears something to lean on.
This is exactly the kind of macro backdrop where BTC can look strong on the chart and still get slapped the moment yields move.
Another detail I wouldn't ignore: PPI isn't just another inflation headline.
Several PPI components feed into the calculation of PCE, the inflation gauge the Fed watches most closely. So traders are effectively reading today's producer data as an early clue about the inflation picture the Fed will see later.
And tomorrow brings the much bigger test:
U.S. CPI.
That's where the market gets to decide whether today's softer core PPI component was meaningful… or simply got drowned out by the energy shock.
For crypto, I'm watching the reaction in BTC + Treasury yields + Fed pricing more closely than the PPI headline itself.
Because sometimes the most important macro number isn't the one that prints on the screen.
It's the number that changes what traders believe comes next.
#Bitcoin #ETH #PPI #Fed
#USAugustPPI came in with a detail that is easy to miss.
#USAugustPPI came in with a detail that is easy to miss.
The headline number did not actually come in below expectations.
August PPI rose 0.4% MoM, exactly in line with forecasts. But the more interesting part was underneath: core PPI rose only 0.2% MoM versus 0.3% expected.
That is the “softer-than-expected” piece people are reacting to.
And then the picture gets messy.
On a yearly basis, headline PPI accelerated to 5.4% from 4.8% in July, slightly above the 5.3% expected. Core PPI reached 4.6% YoY, so inflation pressure has not exactly disappeared.
What caught my attention was where the monthly pressure actually came from.
Final-demand goods jumped 1.1%, with energy up 4.2%. Diesel alone surged 24.1% in August and accounted for more than a third of the increase in final-demand goods. Transportation and warehousing services also climbed 2.3%.
So this isn't really a clean “inflation is cooling” print.
It is more like:
Core momentum softened, while the headline was pushed higher by energy and transport.
That distinction matters for crypto.
BTC traders don't just trade the PPI number. They trade what the number does to Fed expectations, Treasury yields and liquidity conditions.
And the market immediately noticed that tension.
Rate-hike expectations for the September Fed meeting jumped from roughly 60–62% to around 70–74% after the report, while U.S. equities moved lower and Treasury yields rose.
For crypto, that creates a strange setup.
The softer 0.2% core monthly print gives bulls something to point at.
The 5.4% headline YoY, rising energy costs and higher rate-hike odds give bears something to lean on.
This is exactly the kind of macro backdrop where BTC can look strong on the chart and still get slapped the moment yields move.
Another detail I wouldn't ignore: PPI isn't just another inflation headline.
Several PPI components feed into the calculation of PCE, the inflation gauge the Fed watches most closely. So traders are effectively reading today's producer data as an early clue about the inflation picture the Fed will see later.
And tomorrow brings the much bigger test:
U.S. CPI.
That's where the market gets to decide whether today's softer core PPI component was meaningful… or simply got drowned out by the energy shock.
For crypto, I'm watching the reaction in BTC + Treasury yields + Fed pricing more closely than the PPI headline itself.
Because sometimes the most important macro number isn't the one that prints on the screen.
It's the number that changes what traders believe comes next.
#Bitcoin #ETH #PPI #Fed
The headline number did not actually come in below expectations.
August PPI rose 0.4% MoM, exactly in line with forecasts. But the more interesting part was underneath: core PPI rose only 0.2% MoM versus 0.3% expected.
That is the “softer-than-expected” piece people are reacting to.
And then the picture gets messy.
On a yearly basis, headline PPI accelerated to 5.4% from 4.8% in July, slightly above the 5.3% expected. Core PPI reached 4.6% YoY, so inflation pressure has not exactly disappeared.
What caught my attention was where the monthly pressure actually came from.
Final-demand goods jumped 1.1%, with energy up 4.2%. Diesel alone surged 24.1% in August and accounted for more than a third of the increase in final-demand goods. Transportation and warehousing services also climbed 2.3%.
So this isn't really a clean “inflation is cooling” print.
It is more like:
Core momentum softened, while the headline was pushed higher by energy and transport.
That distinction matters for crypto.
BTC traders don't just trade the PPI number. They trade what the number does to Fed expectations, Treasury yields and liquidity conditions.
And the market immediately noticed that tension.
Rate-hike expectations for the September Fed meeting jumped from roughly 60–62% to around 70–74% after the report, while U.S. equities moved lower and Treasury yields rose.
For crypto, that creates a strange setup.
The softer 0.2% core monthly print gives bulls something to point at.
The 5.4% headline YoY, rising energy costs and higher rate-hike odds give bears something to lean on.
This is exactly the kind of macro backdrop where BTC can look strong on the chart and still get slapped the moment yields move.
Another detail I wouldn't ignore: PPI isn't just another inflation headline.
Several PPI components feed into the calculation of PCE, the inflation gauge the Fed watches most closely. So traders are effectively reading today's producer data as an early clue about the inflation picture the Fed will see later.
And tomorrow brings the much bigger test:
U.S. CPI.
That's where the market gets to decide whether today's softer core PPI component was meaningful… or simply got drowned out by the energy shock.
For crypto, I'm watching the reaction in BTC + Treasury yields + Fed pricing more closely than the PPI headline itself.
Because sometimes the most important macro number isn't the one that prints on the screen.
It's the number that changes what traders believe comes next.
#Bitcoin #ETH #PPI #Fed
208
·
--
Bullish
$SOL
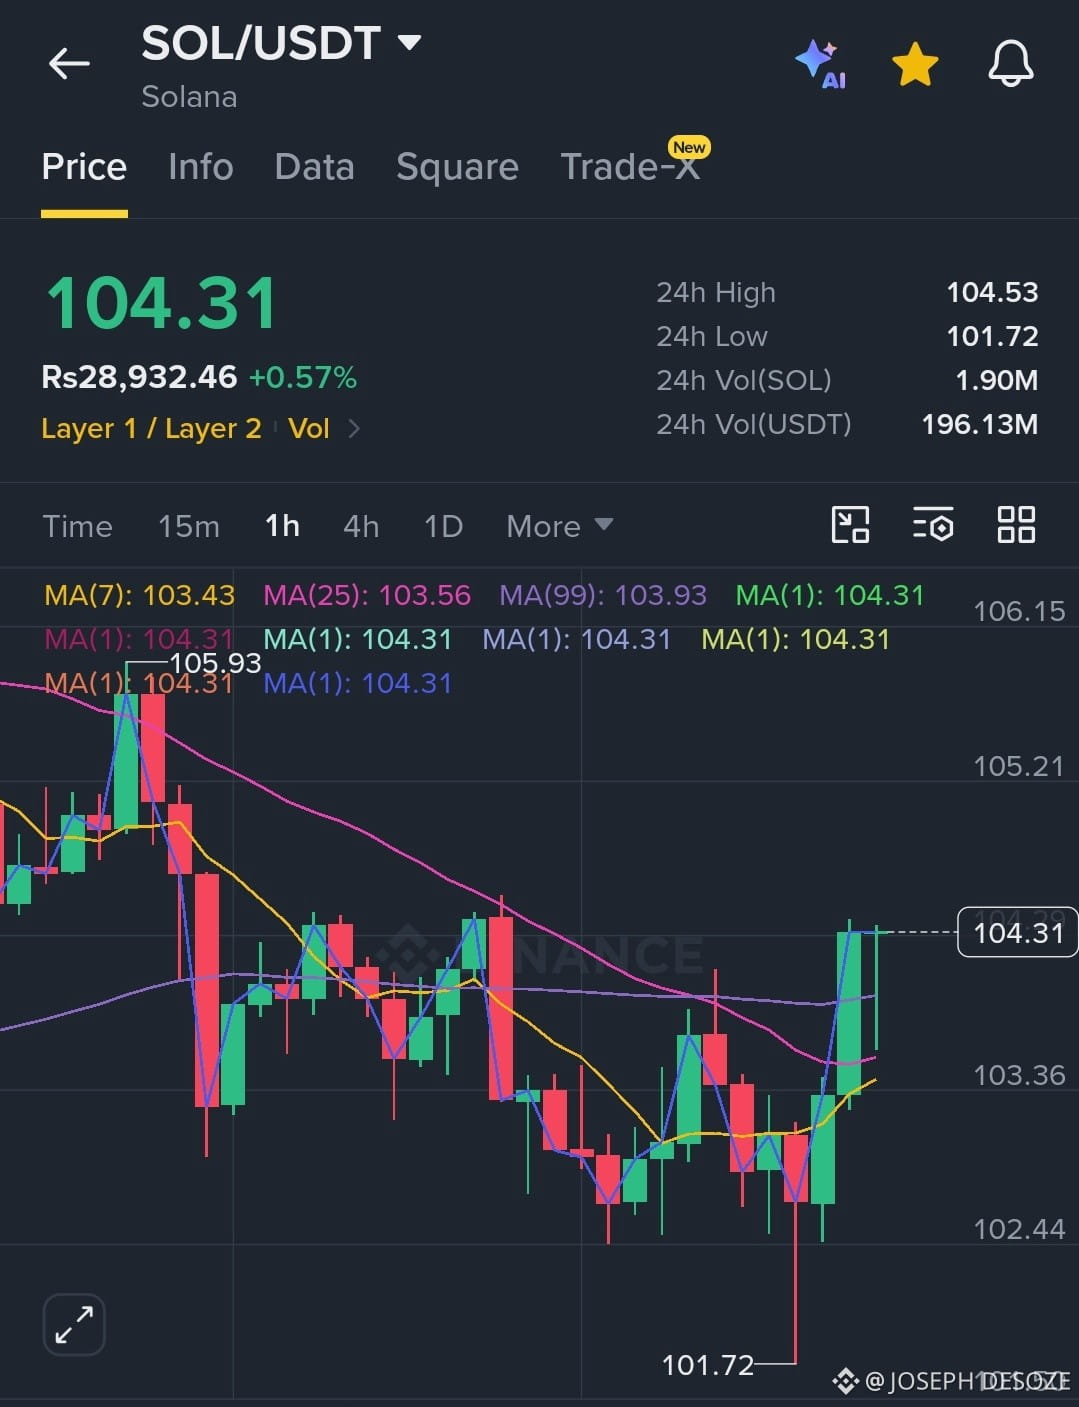
EP: 101.50 – 103.50
TP1: 106.00
TP2: 110.00
TP3: 115.00
SL: 98.50
SOL is consolidating around the $103 zone after a pullback. Holding the entry range keeps the recovery structure active, while a clean break above nearby resistance can accelerate momentum toward the upside targets.
{spot}(SOLUSDT)
#sol板块
$SOL
EP: 101.50 – 103.50
TP1: 106.00
TP2: 110.00
TP3: 115.00
SL: 98.50
SOL is consolidating around the $103 zone after a pullback. Holding the entry range keeps the recovery structure active, while a clean break above nearby resistance can accelerate momentum toward the upside targets.
#sol板块
EP: 101.50 – 103.50
TP1: 106.00
TP2: 110.00
TP3: 115.00
SL: 98.50
SOL is consolidating around the $103 zone after a pullback. Holding the entry range keeps the recovery structure active, while a clean break above nearby resistance can accelerate momentum toward the upside targets.
#sol板块
263
Log in to explore more content
Join global crypto users on Binance Square
⚡️ Get latest and useful information about crypto.
💬 Trusted by the world’s largest crypto exchange.
👍 Discover real insights from verified creators.
Email / Phone number
Trending Topics
MemeLaunchpads82%OfArcDayOneVolume
99 views
25 Discussing
🔥#ARC generated $410.8M in DEX volume on day one but the surprise was where it came from.
💥 82% came from #memecoin launchpads
🚀 #Arguspad alone: $210M
🪙 97,025 tokens minted
⚡ 7.76M transactions processed
That's a very different opening from Circle's institutional vision.
But on day one, speculation stole the spotlight.
The real test now is simple:
Does Arc keep attracting real financial activity or does the meme frenzy fade? 👀 #MemeLaunchpads82%OfArcDayOneVolume
CryptoFeed_News
·0 Likes
·12 views
OstiumLoanDisputeHearingSetInNYFederalCourt
1,604 views
71 Discussing
SKPoliceRefer18PolymarketUsersToProsecutors
2,815 views
138 Discussing