

ifreqs
2 Posts

ifreqs
Report
Block User
8 Following
5.4K+ Followers
647 Liked
Posts
·
--
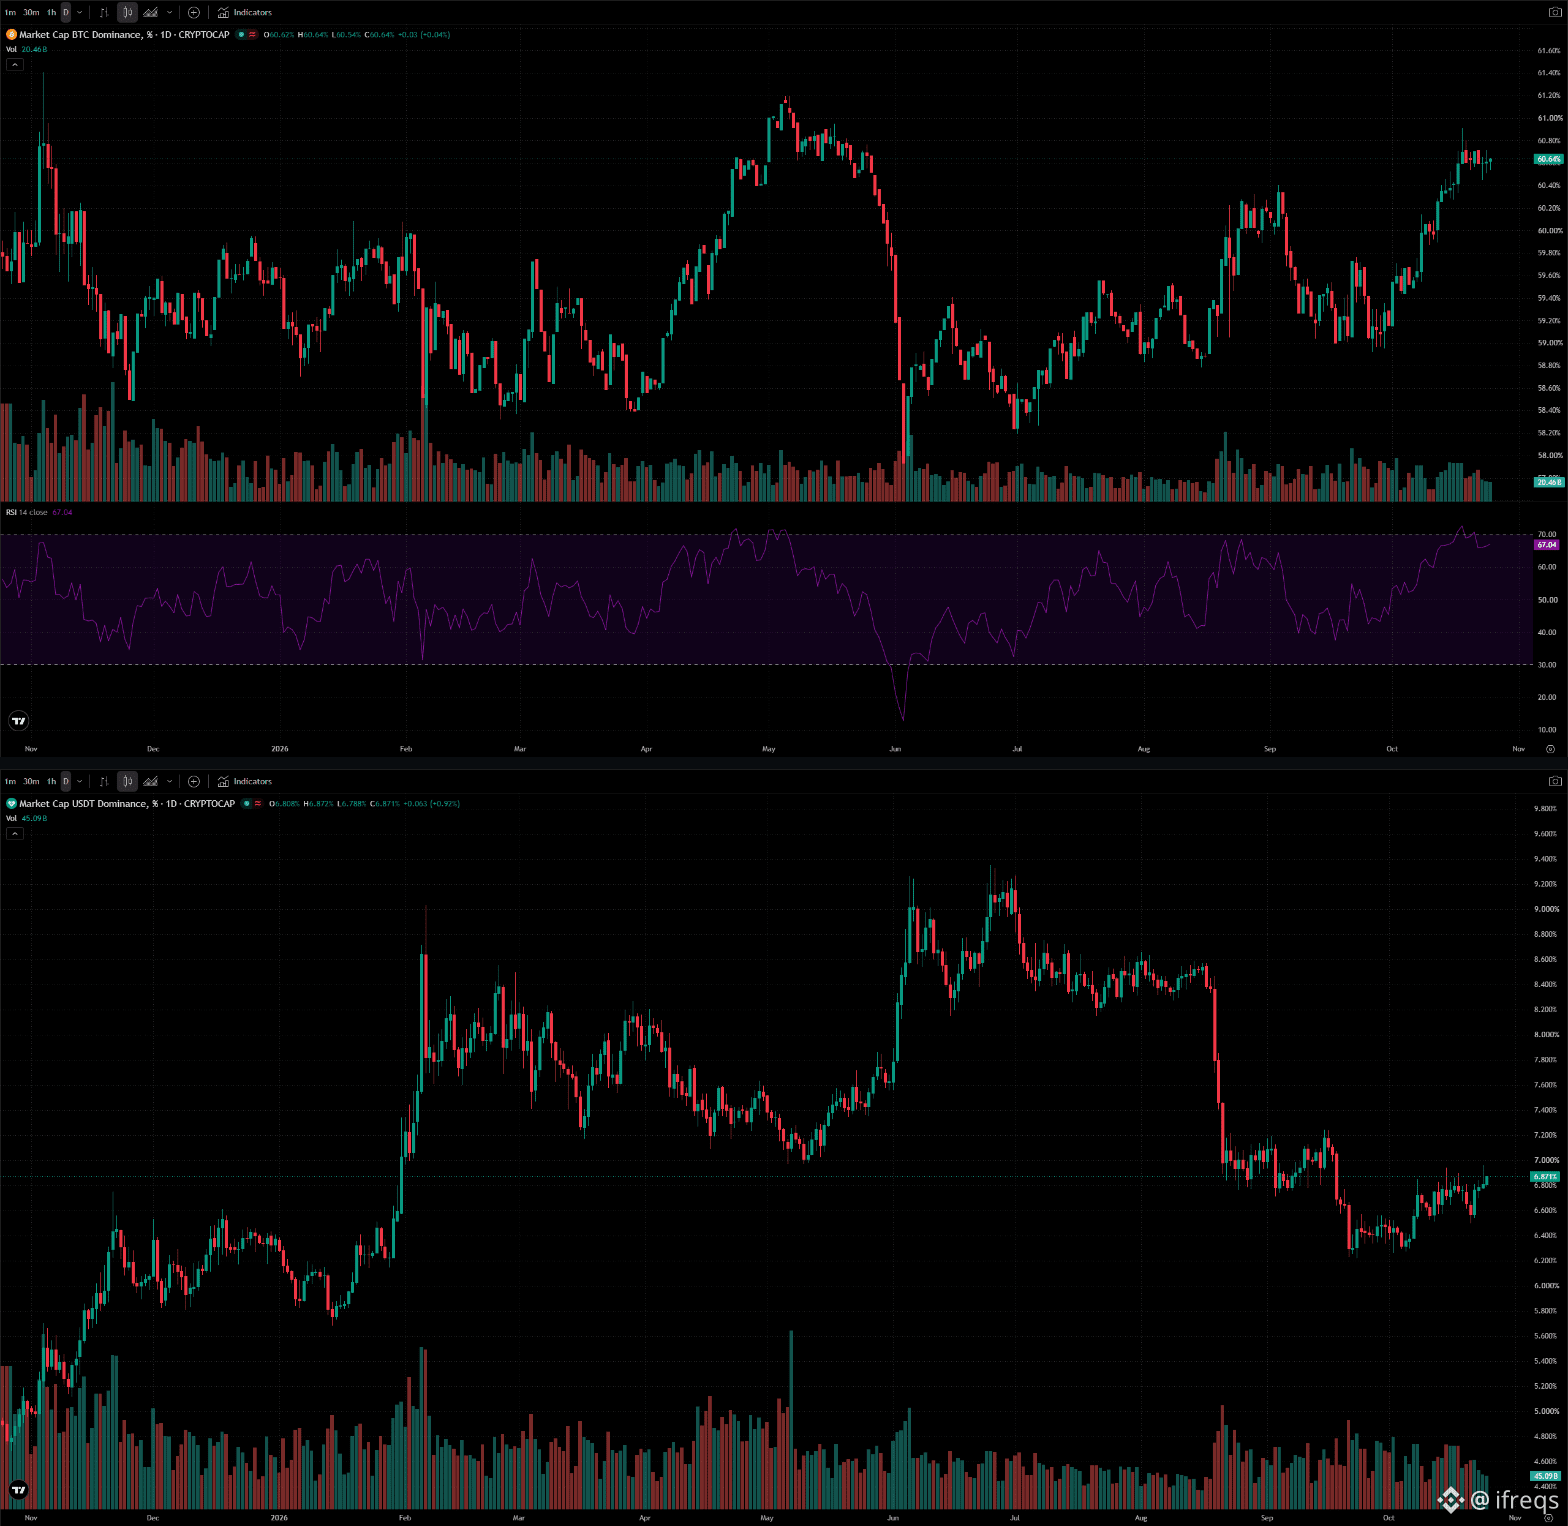
Bitcoin dominance is holding ~60.6%, a level last seen in late May. But $BTC is down 5% in 30 days. The share went up because everything else fell harder.
★ The chart (TradingView, BTC.D)
→ 60.6% now, up from 59.4% on Sep 24.
→ Above its 50-day (59.8%) and 200-day (59.6%) averages. RSI is 67, close to the 70 line.
→ The 1-year ceiling is ~61%: a 61.4% wick on Nov 4, 2025 and a 61.1% close on May 5, 2026.
★ Where the share came from (last 30 days)
→ BTC −5.0%. Total crypto market cap −7.0%. Everything except BTC −9.8%.
→ ETH/BTC −8.9% to 0.0290, RSI 25. $ETH dominance is down to 10.7%.
→ USDT dominance +6.7% to 6.87%. Stablecoins don't fall in a selloff, so their share rises by default.
★ The last two times BTC.D reached ~61%
→ Nov 2025: BTC.D fell from 60.8% to 59.1% by Nov 21 as BTC dropped 16%. USDT + USDC dominance rose 1.2 pts. ETH/BTC was flat.
→ May 2026: BTC.D fell from 61.1% to 57.9% by Jun 3 as BTC dropped 21%. USDT + USDC rose 1.8 pts. ETH/BTC −3%.
→ Both times, stablecoins took more than half of the share BTC lost, and ETH's share fell too.
→ Caveat: TradingView counts stablecoins in the total. Without USDT and USDC, BTC's share is ~67%. CoinGecko shows 60.1% because it tracks a different set of coins. And two tops aren't a pattern.
BTC.D is back at the ceiling with RSI near 70. If it rolls over again, is that an alt season, or another move into stablecoins?
150
Log in to explore more content
Join global crypto users on Binance Square
⚡️ Get latest and useful information about crypto.
💬 Trusted by the world’s largest crypto exchange.
👍 Discover real insights from verified creators.
Email / Phone number