
0xDryas
42 Posts

0xDryas
Report
Block User
不做方向判断。收益来自三类结构性错配:跨所同资产价差、资金费率期限结构、机制崩溃后的清算残留......
确定性来自机制失败,不来自情绪
(非投资建议)
11 Following
60 Followers
16 Liked
Posts
All
Quotes
·
--
The system detected 84 liquidation clusters in a 24h window. Breakdown by instrument: BTCUSD_PERP had the highest notional value of long liquidations. The chart shows the raw structure broken down by instrument—these are the system’s raw cumulative figures, with duplicate counts and no deduplication, pending cross-validation. I’m not making claims like “total market liquidations.” But the structure itself says enough: you can tell who’s bleeding before you know whether prices are rising or falling.
The system detected 84 liquidation clusters in a 24h window. Breakdown by instrument: BTCUSD_PERP had the highest notional value of long liquidations. The chart shows the raw structure broken down by instrument—these are the system’s raw cumulative figures, with duplicate counts and no deduplication, pending cross-validation. I’m not making claims like “total market liquidations.” But the structure itself says enough: you can tell who’s bleeding before you know whether prices are rising or falling.

298
·
--
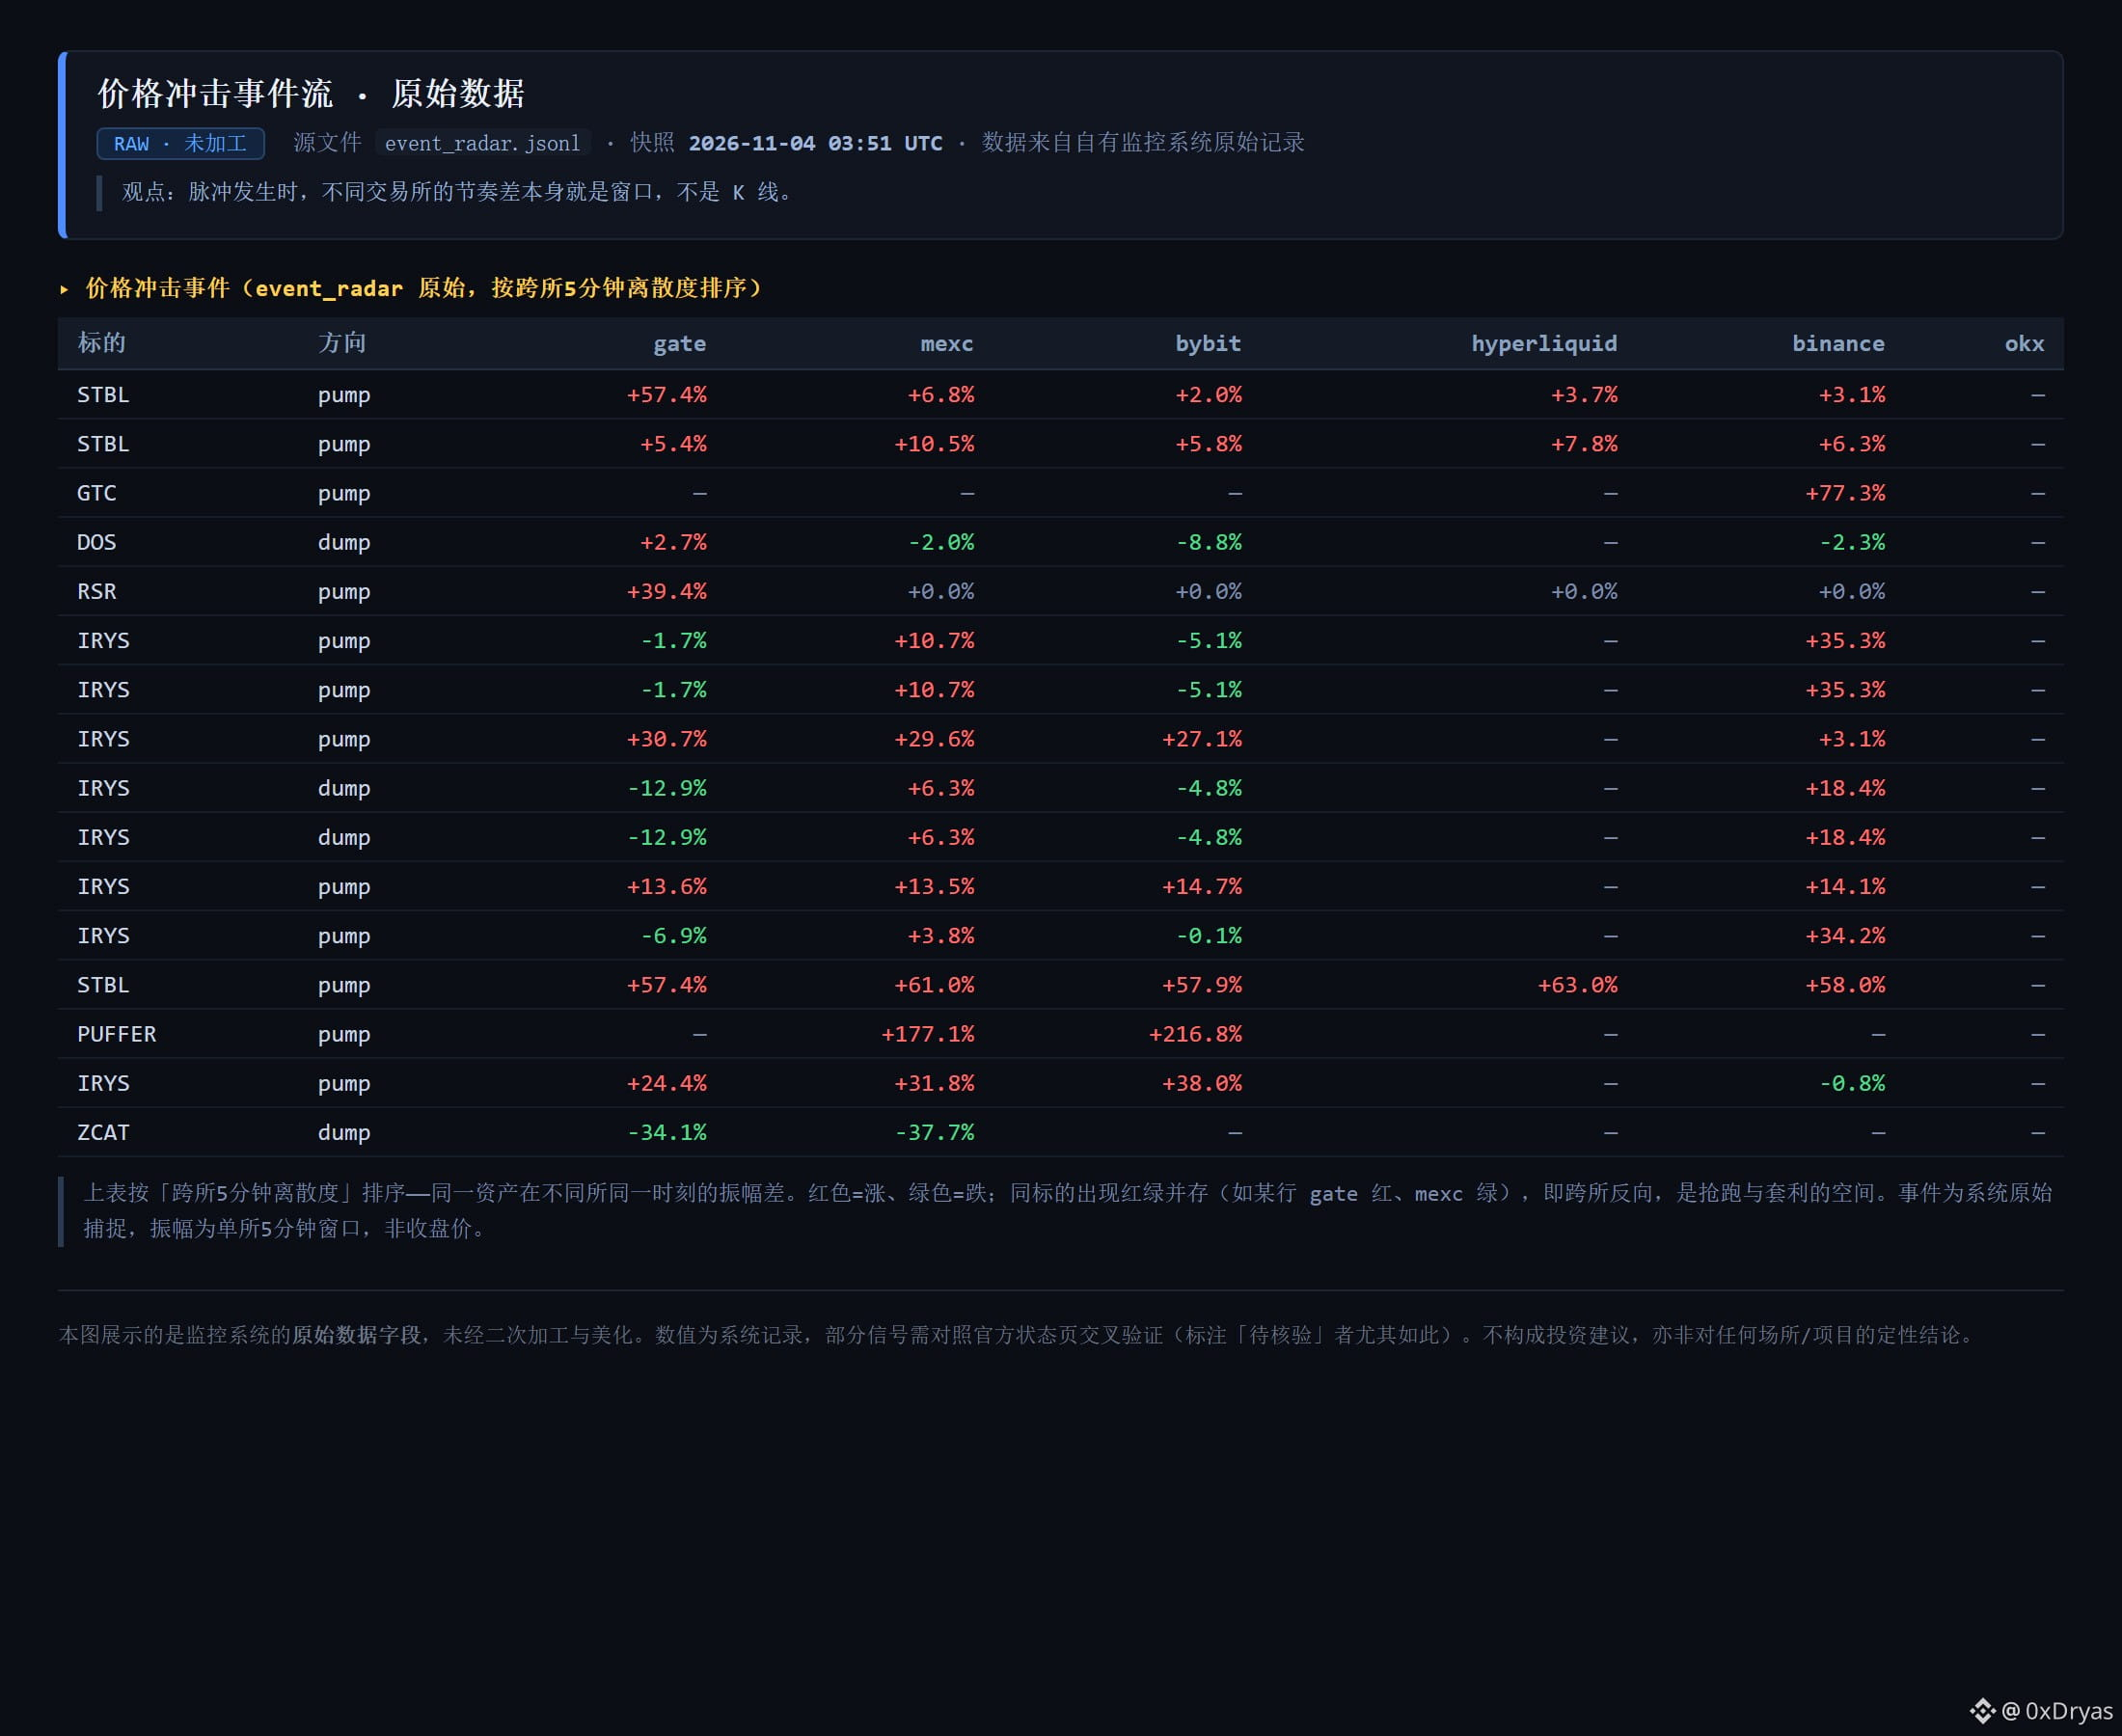
Many people chase pumps and dump on dips by watching candlestick charts; I pay more attention to differences in timing across exchanges. The system ranked them by “5-minute cross-exchange dispersion”: the same asset rising on gate while falling on mexc at the same time (for example, at one point IRYS was up 31.8% on mexc while down 0.8% on binance). This mix of red and green is where front-running and arbitrage opportunities arise.
Many people chase pumps and dump on dips by watching candlestick charts; I pay more attention to differences in timing across exchanges. The system ranked them by “5-minute cross-exchange dispersion”: the same asset rising on gate while falling on mexc at the same time (for example, at one point IRYS was up 31.8% on mexc while down 0.8% on binance). This mix of red and green is where front-running and arbitrage opportunities arise.
713
·
--
The strangest thing about today's market isn't the drop—it's the split.
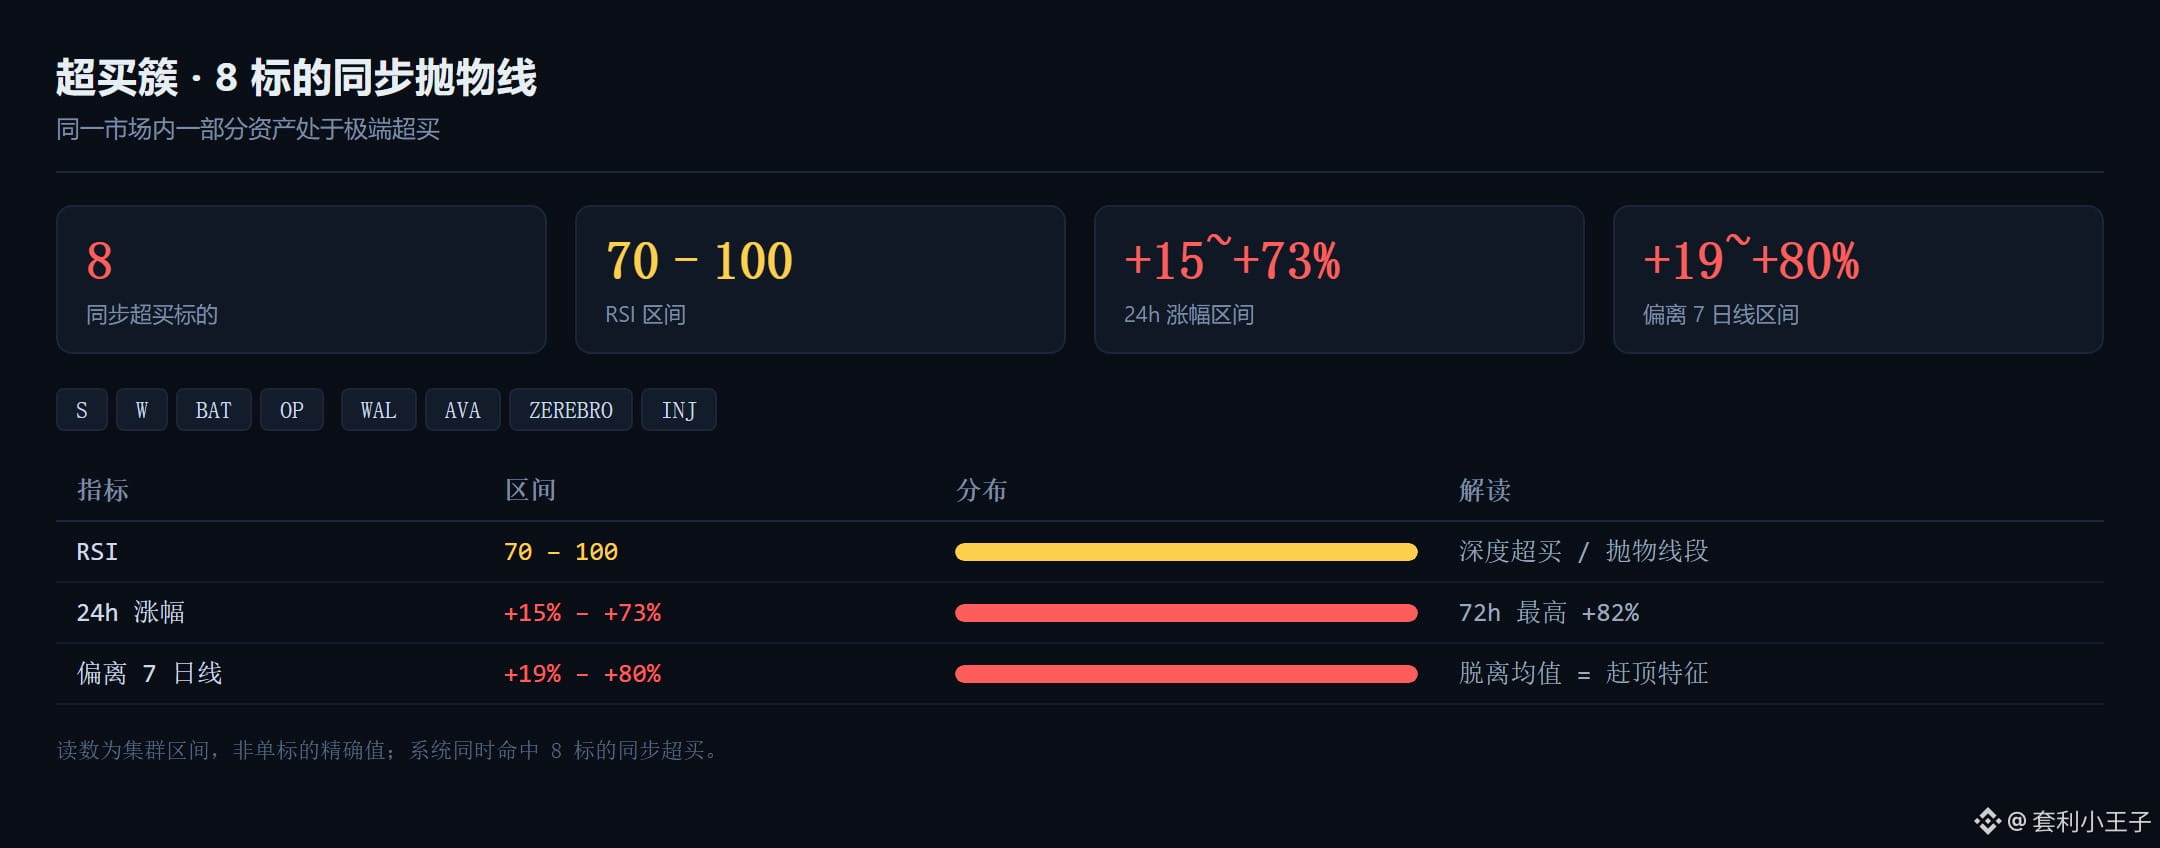
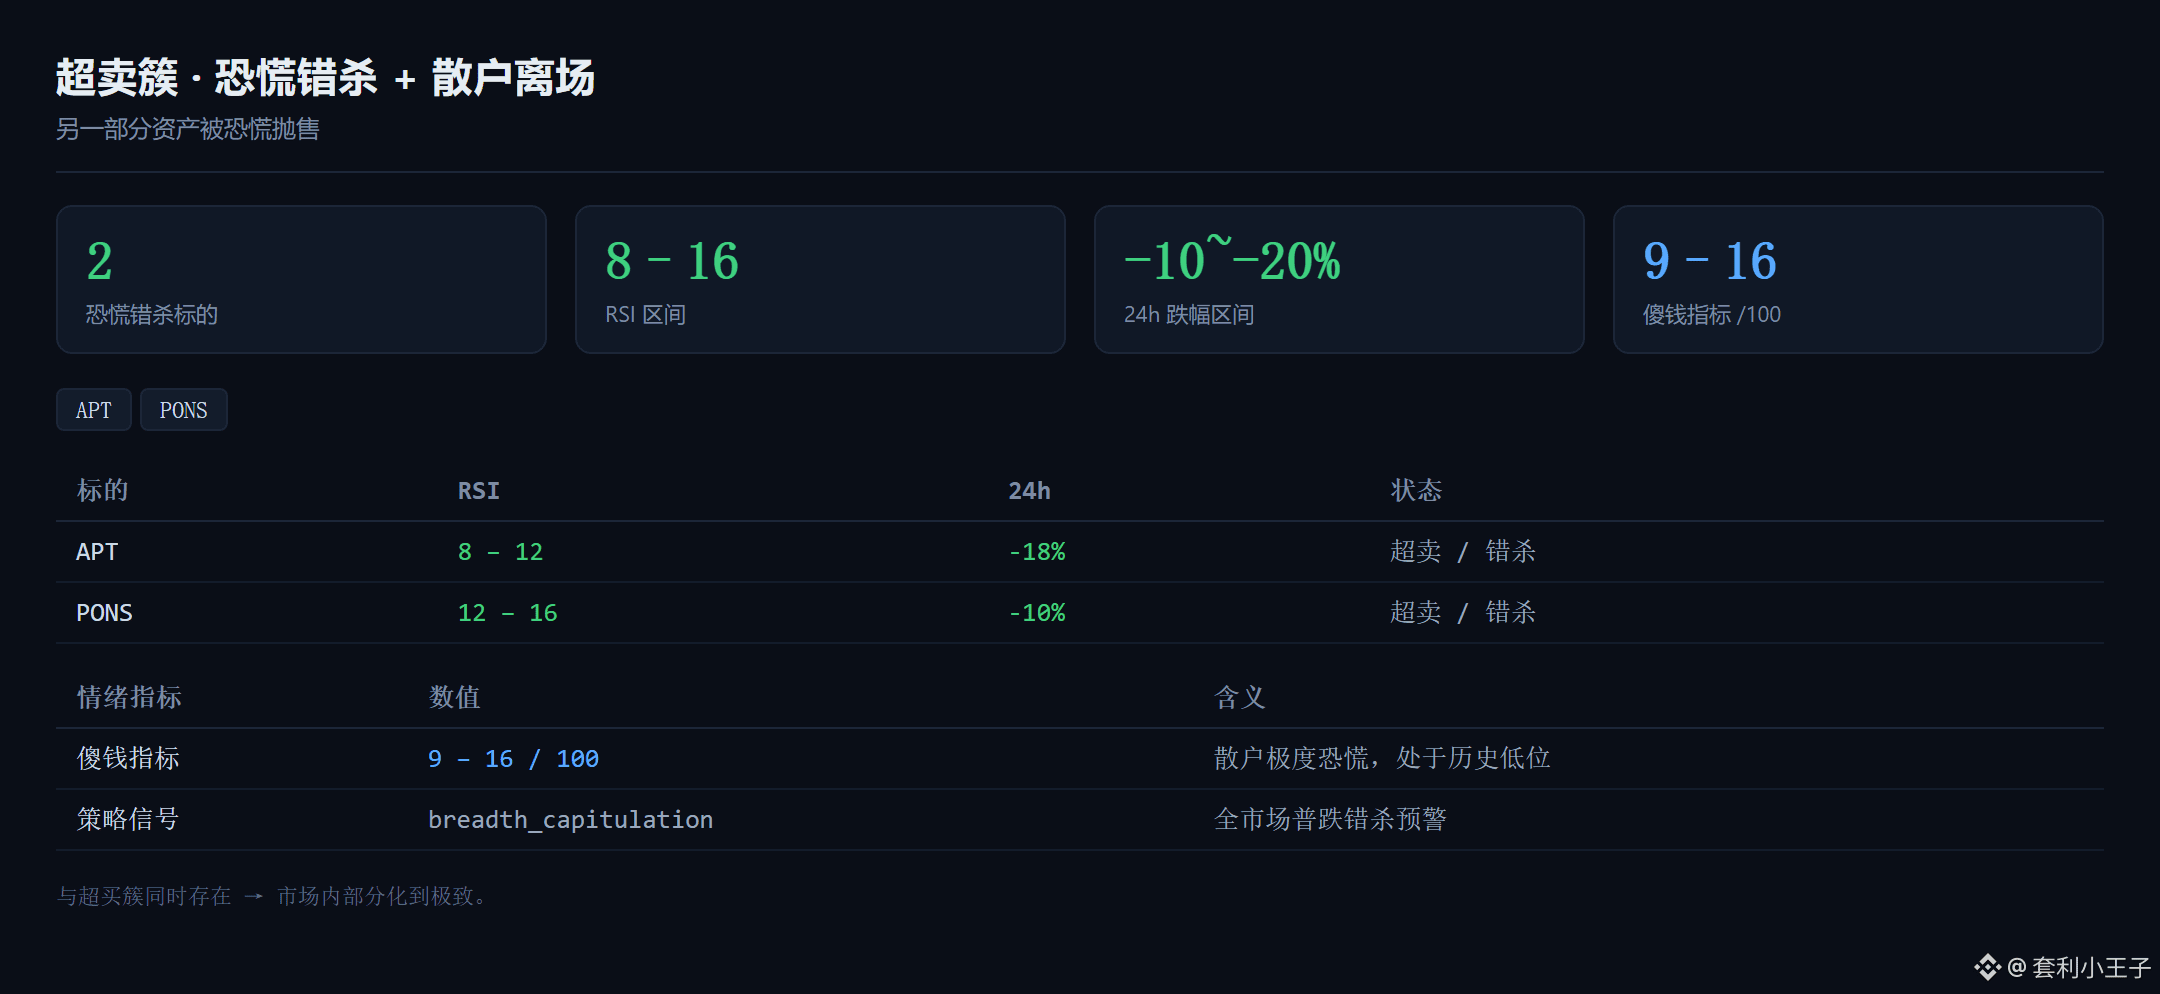
Half the assets are racing toward a parabolic top: S, W, BAT, and OP all have RSI readings pegged at 70–100, up 15% to 73% in 24 hours and nearly 80% above their seven-day moving averages. The other half have been unfairly dumped in a panic, with APT and PONS RSI readings down to 8–16, falling 10–20% in a day.
The same market, but two groups of people living in different universes.
My approach is simple: don't chase the ones racing toward a top; wait for them to break on their own. For the panic-sold ones, place your orders and wait for a rebound. In a split market, the worst thing you can do is use the same yardstick for everyone.
The strangest thing about today's market isn't the drop—it's the split.
Half the assets are racing toward a parabolic top: S, W, BAT, and OP all have RSI readings pegged at 70–100, up 15% to 73% in 24 hours and nearly 80% above their seven-day moving averages. The other half have been unfairly dumped in a panic, with APT and PONS RSI readings down to 8–16, falling 10–20% in a day.
The same market, but two groups of people living in different universes.
My approach is simple: don't chase the ones racing toward a top; wait for them to break on their own. For the panic-sold ones, place your orders and wait for a rebound. In a split market, the worst thing you can do is use the same yardstick for everyone.
Half the assets are racing toward a parabolic top: S, W, BAT, and OP all have RSI readings pegged at 70–100, up 15% to 73% in 24 hours and nearly 80% above their seven-day moving averages. The other half have been unfairly dumped in a panic, with APT and PONS RSI readings down to 8–16, falling 10–20% in a day.
The same market, but two groups of people living in different universes.
My approach is simple: don't chase the ones racing toward a top; wait for them to break on their own. For the panic-sold ones, place your orders and wait for a rebound. In a split market, the worst thing you can do is use the same yardstick for everyone.
35
·
--
Yesterday, I had a very elegant explanation: Binance had suspended withdrawals, coins couldn’t get out, prices were bottlenecked, and cross-exchange spreads widened.
The logic was sound, and the data supported it—the dispersion in the group whose withdrawals hadn’t resumed was 3 times that of the group whose withdrawals had resumed. It was so elegant I wanted to publish it right away.
Elegant things usually have a problem. So I built a control group that could kill the explanation.
Perpetual contracts for the same assets.
Perpetuals don’t require withdrawals. Positions can be closed at any time, and prices are anchored to the index and funding rates, so there’s no “can’t get out” problem. Same asset, same moment, same counterparty exchange; the only variable is whether this price instrument requires withdrawals.
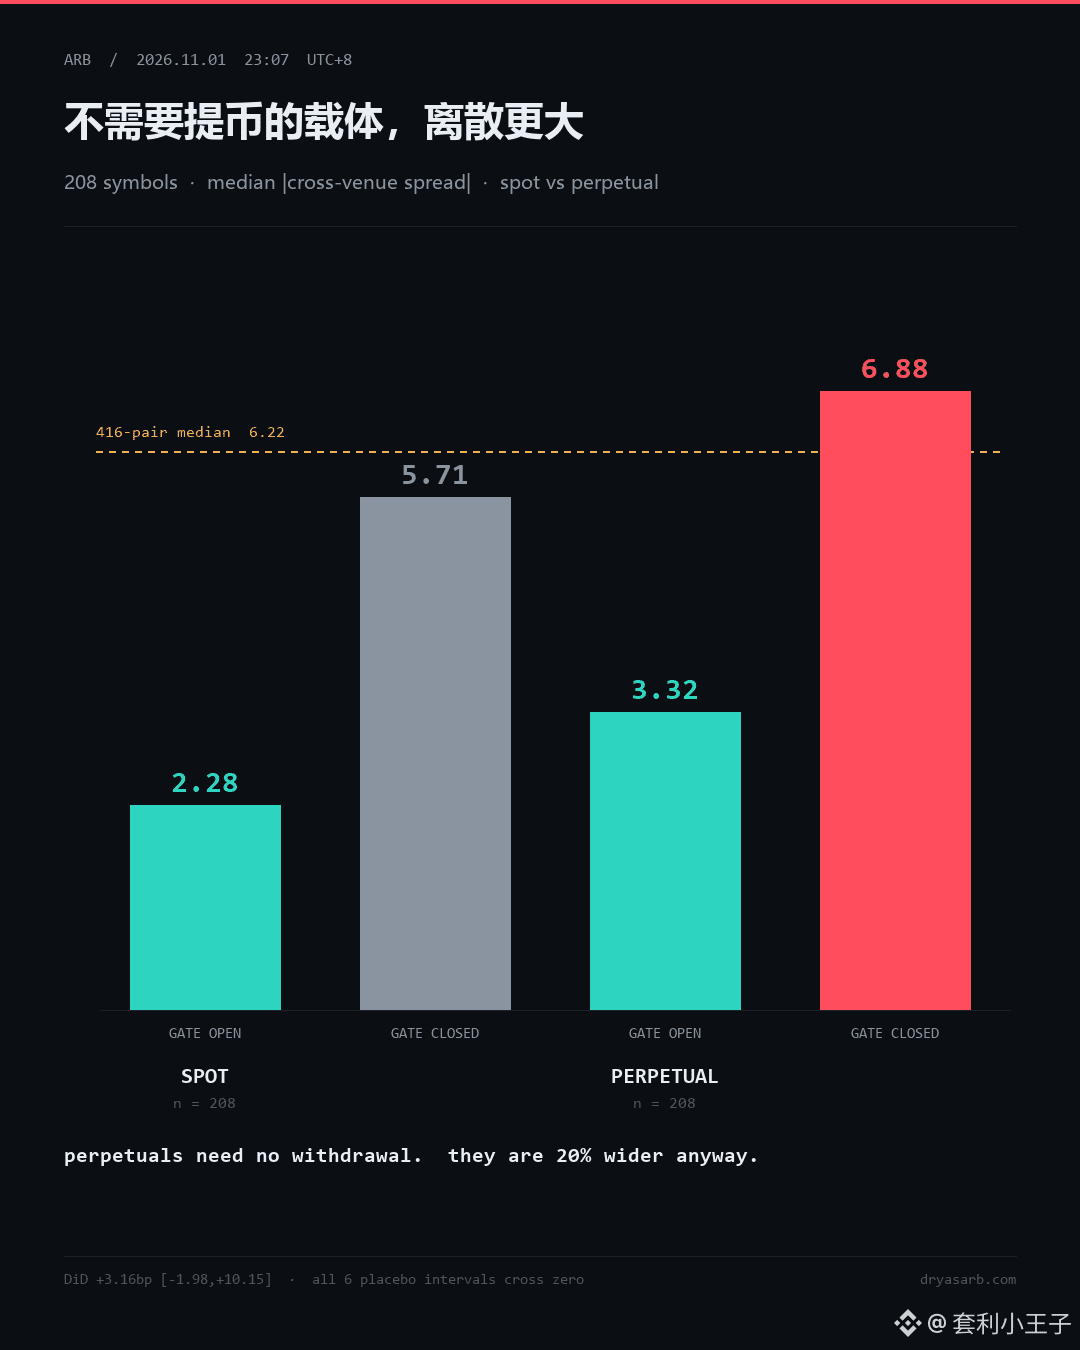
208 assets, with spot spreads and perpetual spreads each calculated once.
Group whose withdrawals had resumed: spot 2.28bp, perpetual 3.32bp.
Group whose withdrawals hadn’t resumed: spot 5.71bp, perpetual 6.88bp.
The instrument that doesn’t require withdrawals had greater dispersion.
My explanation died on the spot.
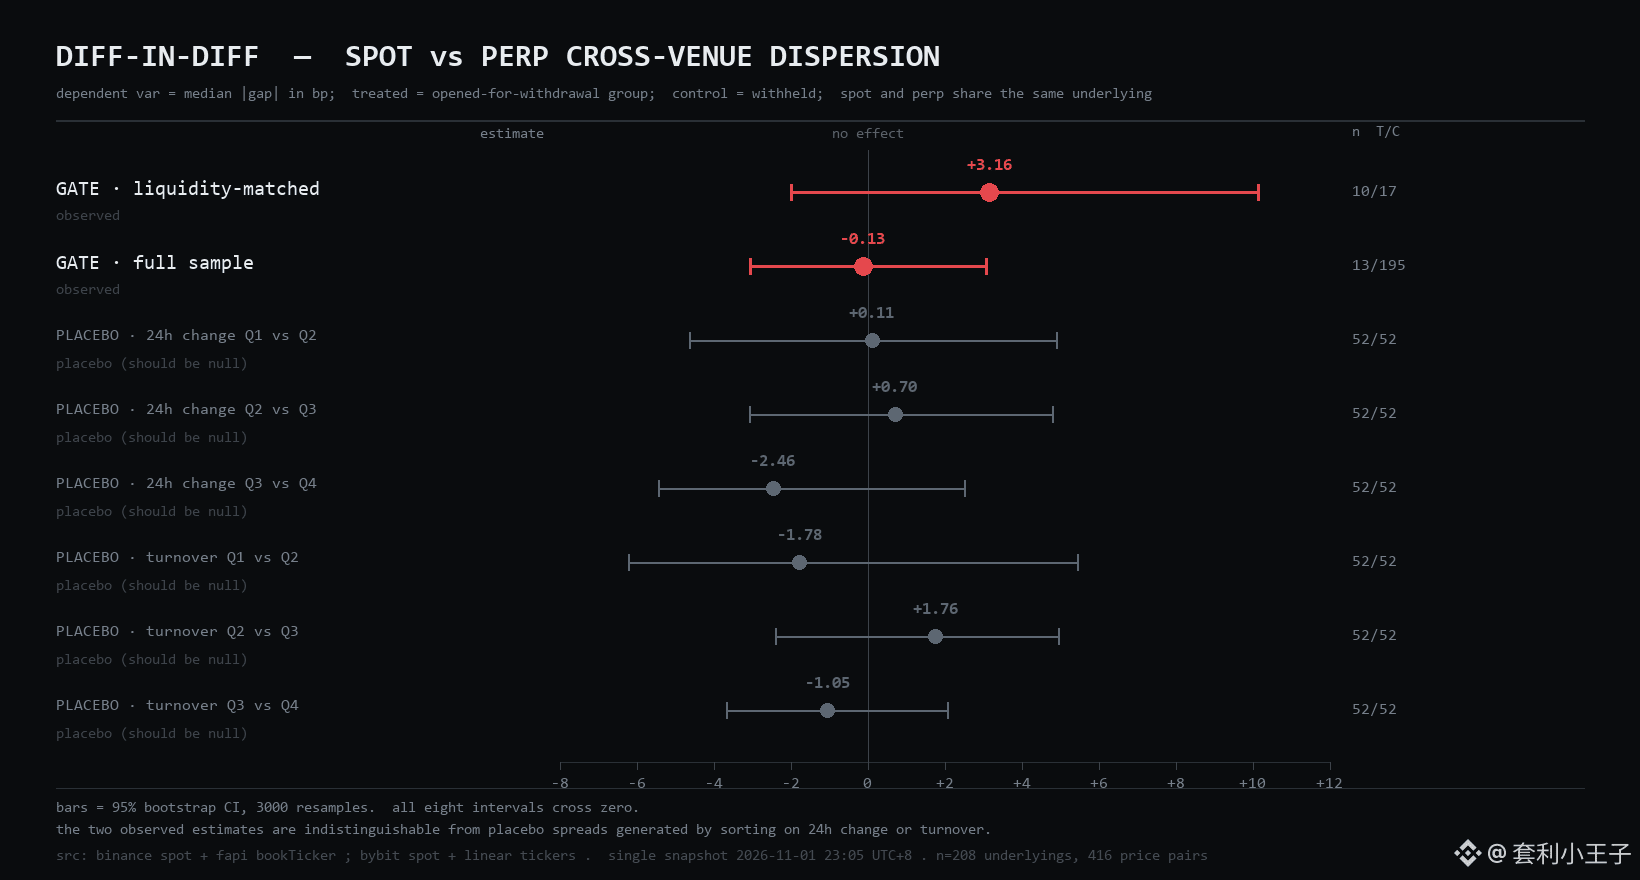
Then I ran a DiD—taking the difference in excess dispersion of spot relative to perpetuals. Qualifying subsample: +3.16bp, 95% interval [−1.98, +10.15]. Full sample: −0.13bp, [−3.04, +3.08]. Both intervals cross zero.
Still not enough. I also ran six placebos: instead of grouping by withdrawal status, I used quartiles for price gains and trading volume, then ran the same tests. All six intervals crossed zero, with effects ranging from −2.46 to +1.76.
The “effect” you can get from random grouping is on the same scale as the one from grouping by withdrawal status.
So the conclusion is: with this sample size and this design, the price impact of withdrawal access cannot be identified.
Dispersion is an asset characteristic, not a channel characteristic.
Yesterday, I had a very elegant explanation: Binance had suspended withdrawals, coins couldn’t get out, prices were bottlenecked, and cross-exchange spreads widened.
The logic was sound, and the data supported it—the dispersion in the group whose withdrawals hadn’t resumed was 3 times that of the group whose withdrawals had resumed. It was so elegant I wanted to publish it right away.
Elegant things usually have a problem. So I built a control group that could kill the explanation.
Perpetual contracts for the same assets.
Perpetuals don’t require withdrawals. Positions can be closed at any time, and prices are anchored to the index and funding rates, so there’s no “can’t get out” problem. Same asset, same moment, same counterparty exchange; the only variable is whether this price instrument requires withdrawals.
208 assets, with spot spreads and perpetual spreads each calculated once.
Group whose withdrawals had resumed: spot 2.28bp, perpetual 3.32bp.
Group whose withdrawals hadn’t resumed: spot 5.71bp, perpetual 6.88bp.
The instrument that doesn’t require withdrawals had greater dispersion.
My explanation died on the spot.
Then I ran a DiD—taking the difference in excess dispersion of spot relative to perpetuals. Qualifying subsample: +3.16bp, 95% interval [−1.98, +10.15]. Full sample: −0.13bp, [−3.04, +3.08]. Both intervals cross zero.
Still not enough. I also ran six placebos: instead of grouping by withdrawal status, I used quartiles for price gains and trading volume, then ran the same tests. All six intervals crossed zero, with effects ranging from −2.46 to +1.76.
The “effect” you can get from random grouping is on the same scale as the one from grouping by withdrawal status.
So the conclusion is: with this sample size and this design, the price impact of withdrawal access cannot be identified.
Dispersion is an asset characteristic, not a channel characteristic.
The logic was sound, and the data supported it—the dispersion in the group whose withdrawals hadn’t resumed was 3 times that of the group whose withdrawals had resumed. It was so elegant I wanted to publish it right away.
Elegant things usually have a problem. So I built a control group that could kill the explanation.
Perpetual contracts for the same assets.
Perpetuals don’t require withdrawals. Positions can be closed at any time, and prices are anchored to the index and funding rates, so there’s no “can’t get out” problem. Same asset, same moment, same counterparty exchange; the only variable is whether this price instrument requires withdrawals.
208 assets, with spot spreads and perpetual spreads each calculated once.
Group whose withdrawals had resumed: spot 2.28bp, perpetual 3.32bp.
Group whose withdrawals hadn’t resumed: spot 5.71bp, perpetual 6.88bp.
The instrument that doesn’t require withdrawals had greater dispersion.
My explanation died on the spot.
Then I ran a DiD—taking the difference in excess dispersion of spot relative to perpetuals. Qualifying subsample: +3.16bp, 95% interval [−1.98, +10.15]. Full sample: −0.13bp, [−3.04, +3.08]. Both intervals cross zero.
Still not enough. I also ran six placebos: instead of grouping by withdrawal status, I used quartiles for price gains and trading volume, then ran the same tests. All six intervals crossed zero, with effects ranging from −2.46 to +1.76.
The “effect” you can get from random grouping is on the same scale as the one from grouping by withdrawal status.
So the conclusion is: with this sample size and this design, the price impact of withdrawal access cannot be identified.
Dispersion is an asset characteristic, not a channel characteristic.
229
Log in to explore more content
Join global crypto users on Binance Square
⚡️ Get latest and useful information about crypto.
💬 Trusted by the world’s largest crypto exchange.
👍 Discover real insights from verified creators.
Email / Phone number
Trending Topics
BinanceReopensWithdrawalsForMoreAssets
765,938 views
4,237 Discussing
Security Incident | Recovery Update #8: Withdrawals for More Assets to Reopen (2026-11-05)
Binance Announcement
·330 Likes
·1.4M views
Binance98PercentReplenished
138,796 views
1,630 Discussing
USStocksSlipandCryptoMarketUnderBroadPressure
201 views
79 Discussing