
hellobinyak
88 Posts

hellobinyak
Most traders use indicators. I use the one thing indicators are built on — price itself. Supply & Demand | Trade recaps | Real setups, real logic.
High-Frequency Trader
11.1 Months
28 Following
71 Followers
62 Liked
Posts
All
Quotes
hellobinyak
·
--
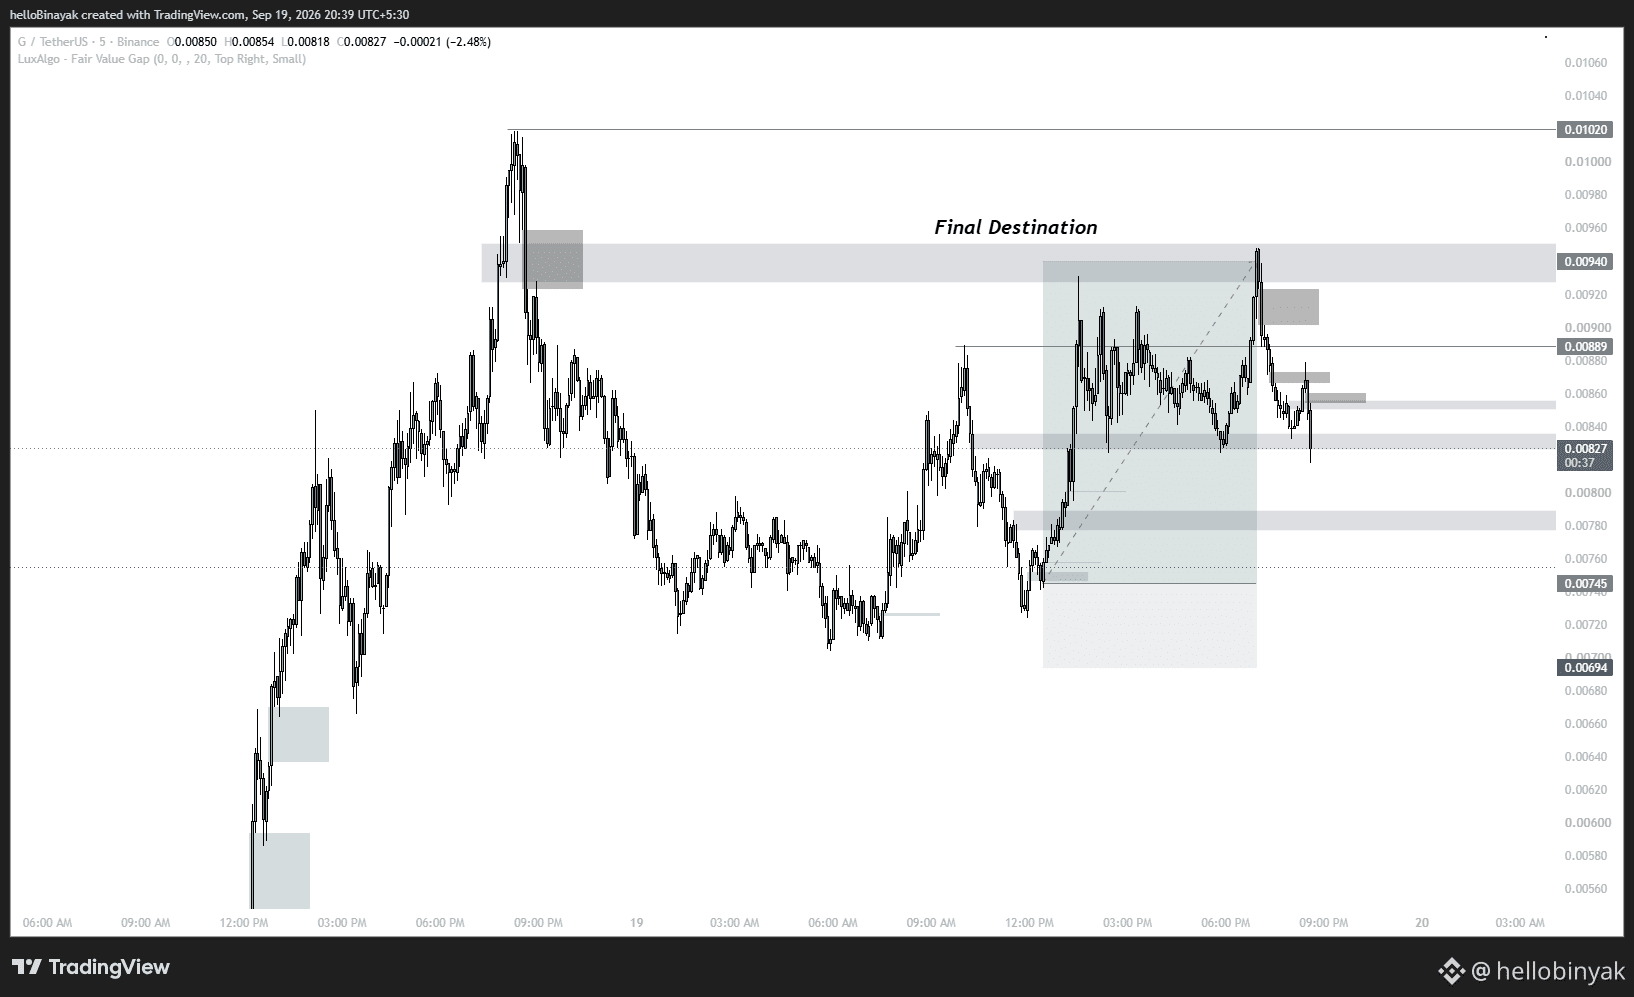
BullishUPDATE: $G
/USDT. Still in. Still running.
Entry: 0.0074450
Now: 0.0091333
Final Destination: 0.00940
━━━━━━━━━━━━━━━━━━
LIVE UPDATE
━━━━━━━━━━━━━━━━━━
Posted this setup earlier when it was at +458%. Demand zone entry, New York session timing, zone was clear.
Price didn't stop there.
From 0.00745 to 0.00913 in one move. No chop, no fake-out, straight into the target. The zone held exactly where it was supposed to, the session delivered, and the trade ran itself.
Final destination is 0.00940. Almost there. I'm not closing early.
When the zone is right and the session is right, you sit on your hands and let it play out. That's the whole discipline.
Will post the final update when it closes.
━━━━━━━━━━━━━━━━━━
Debate:
At +900% on a live trade, do you close early or hold to the target? Where does discipline end and greed begin?
#G #CryptoAnalysis #SupplyAndDemand #LiveTrade #BinanceSquare #PriceAction $
/USDT. Still in. Still running.
Entry: 0.0074450
Now: 0.0091333
Final Destination: 0.00940
━━━━━━━━━━━━━━━━━━
LIVE UPDATE
━━━━━━━━━━━━━━━━━━
Posted this setup earlier when it was at +458%. Demand zone entry, New York session timing, zone was clear.
Price didn't stop there.
From 0.00745 to 0.00913 in one move. No chop, no fake-out, straight into the target. The zone held exactly where it was supposed to, the session delivered, and the trade ran itself.
Final destination is 0.00940. Almost there. I'm not closing early.
When the zone is right and the session is right, you sit on your hands and let it play out. That's the whole discipline.
Will post the final update when it closes.
━━━━━━━━━━━━━━━━━━
Debate:
At +900% on a live trade, do you close early or hold to the target? Where does discipline end and greed begin?
#G #CryptoAnalysis #SupplyAndDemand #LiveTrade #BinanceSquare #PriceAction $


Elite Entry
·
--
People my age: find a partner. Me: find a 100x coin 😂😭
.
.
.
.
.
.
$ZBT
$HFT
$BICO
#FunnyMemes #funny
.
.
.
.
.
.
$ZBT
$HFT
$BICO
#FunnyMemes #funny

hellobinyak
·
--
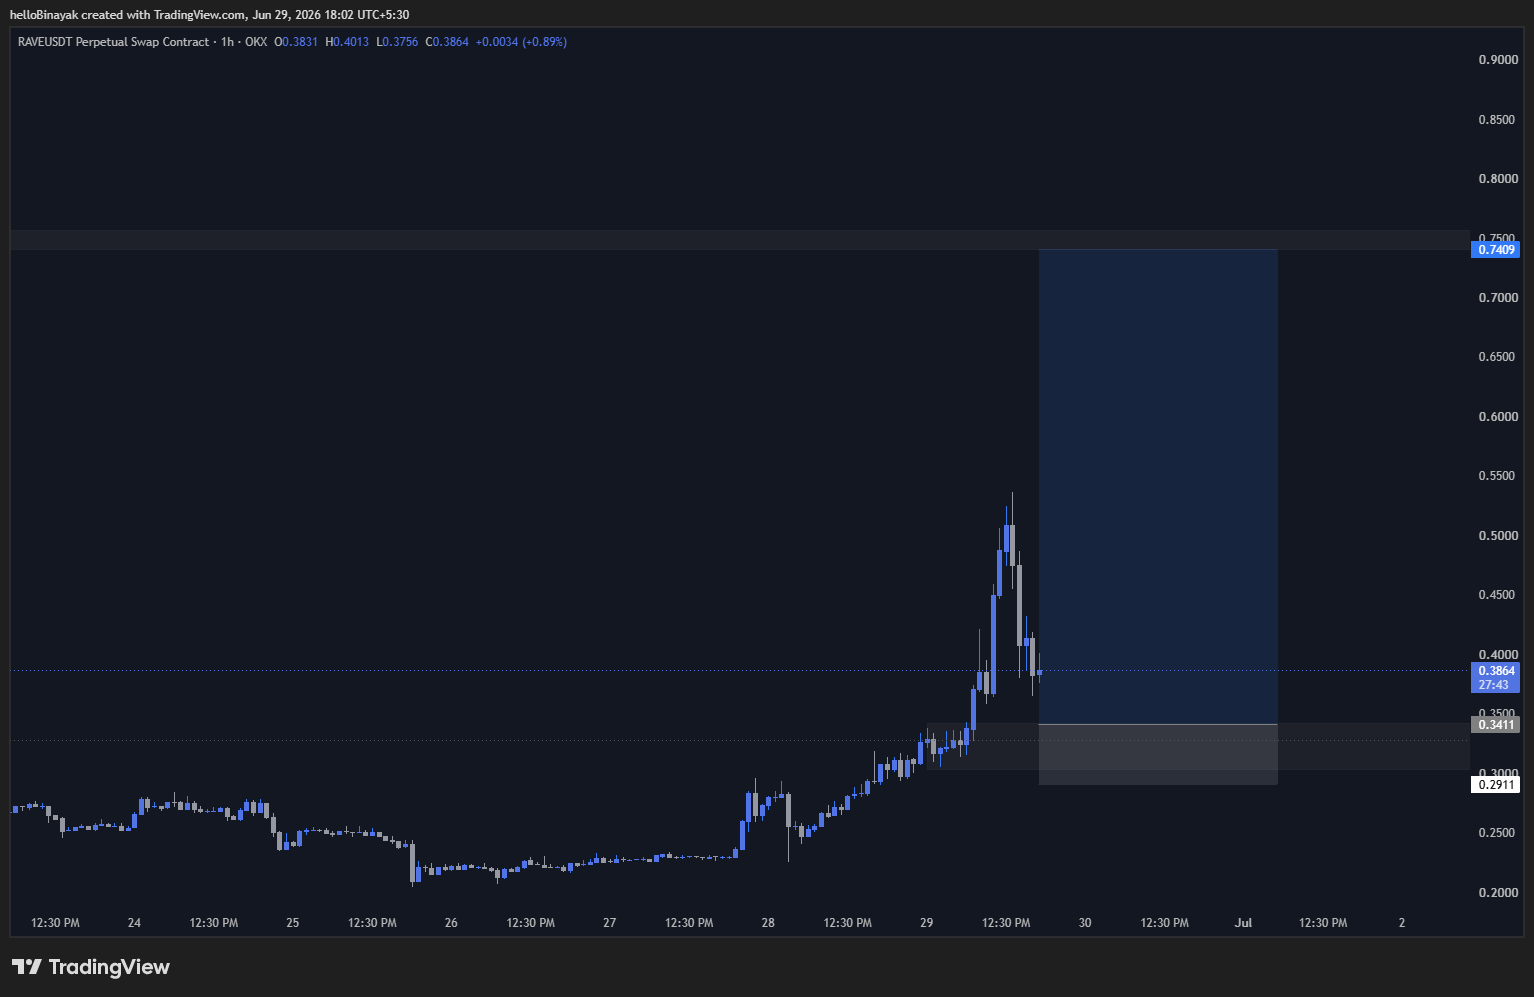
Bullish$RAVE dropped 80% from its highs. Now it's sitting on a level I've had marked for weeks. I'm watching for my entry.
$RAVE — WATCHING FOR LONG ⏳
Waiting for: 4H confirmation candle inside demand zone
Entry zone: 0.29 – 0.39
SL: Below 0.28
TP1: 0.550
TP2: 0.740
TP3: 0.935
━━━━━━━━━━━━━━━━━━
WHAT I'M SEEING
━━━━━━━━━━━━━━━━━━
This zone at 0.29–0.39 is where $RAVE built its base before the original move up. Price left this level fast back then — and now after an 80% pullback, it's returned to the same area.
The bounce off 0.20 caught my attention. Not because of how far it moved — because of how fast it moved. That kind of reaction from a known level isn't random. It tells me there's interest here.
But I haven't entered yet. I want one clean 4H candle closing inside the zone with buyers clearly in control before I commit. Until that forms, this stays on my watchlist.
If confirmation comes — entry is 0.29–0.39, SL below 0.28, and I'm targeting 0.55, 0.74, and 0.935 in that order. Each of those targets is a level where price previously stalled on the way down. Natural ceilings.
If price closes below 0.28 on the 4H before I get confirmation — the zone is broken and I move on. No trade.
I'll update this when the candle forms.
Click to trade 👇
#RAVE #CryptoAnalysis #SupplyAndDemand #Watchlist #BinanceSquare #PriceAction #AltcoinAlert #Write2Earn
$RAVE — WATCHING FOR LONG ⏳
Waiting for: 4H confirmation candle inside demand zone
Entry zone: 0.29 – 0.39
SL: Below 0.28
TP1: 0.550
TP2: 0.740
TP3: 0.935
━━━━━━━━━━━━━━━━━━
WHAT I'M SEEING
━━━━━━━━━━━━━━━━━━
This zone at 0.29–0.39 is where $RAVE built its base before the original move up. Price left this level fast back then — and now after an 80% pullback, it's returned to the same area.
The bounce off 0.20 caught my attention. Not because of how far it moved — because of how fast it moved. That kind of reaction from a known level isn't random. It tells me there's interest here.
But I haven't entered yet. I want one clean 4H candle closing inside the zone with buyers clearly in control before I commit. Until that forms, this stays on my watchlist.
If confirmation comes — entry is 0.29–0.39, SL below 0.28, and I'm targeting 0.55, 0.74, and 0.935 in that order. Each of those targets is a level where price previously stalled on the way down. Natural ceilings.
If price closes below 0.28 on the 4H before I get confirmation — the zone is broken and I move on. No trade.
I'll update this when the candle forms.
Click to trade 👇
#RAVE #CryptoAnalysis #SupplyAndDemand #Watchlist #BinanceSquare #PriceAction #AltcoinAlert #Write2Earn
hellobinyak
·
--
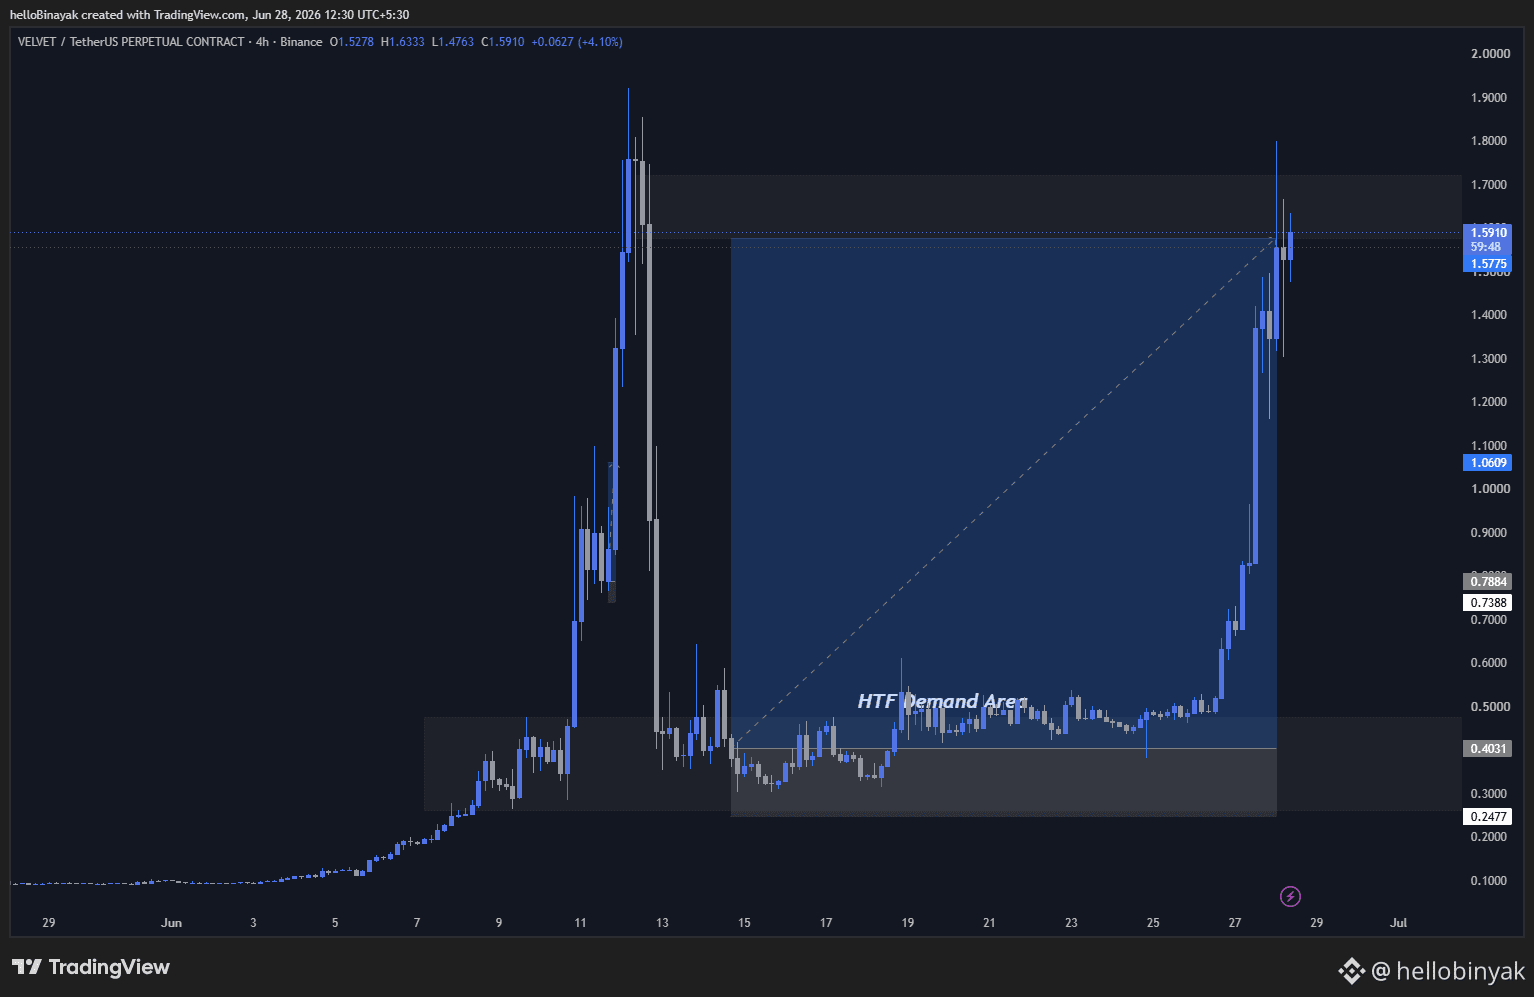
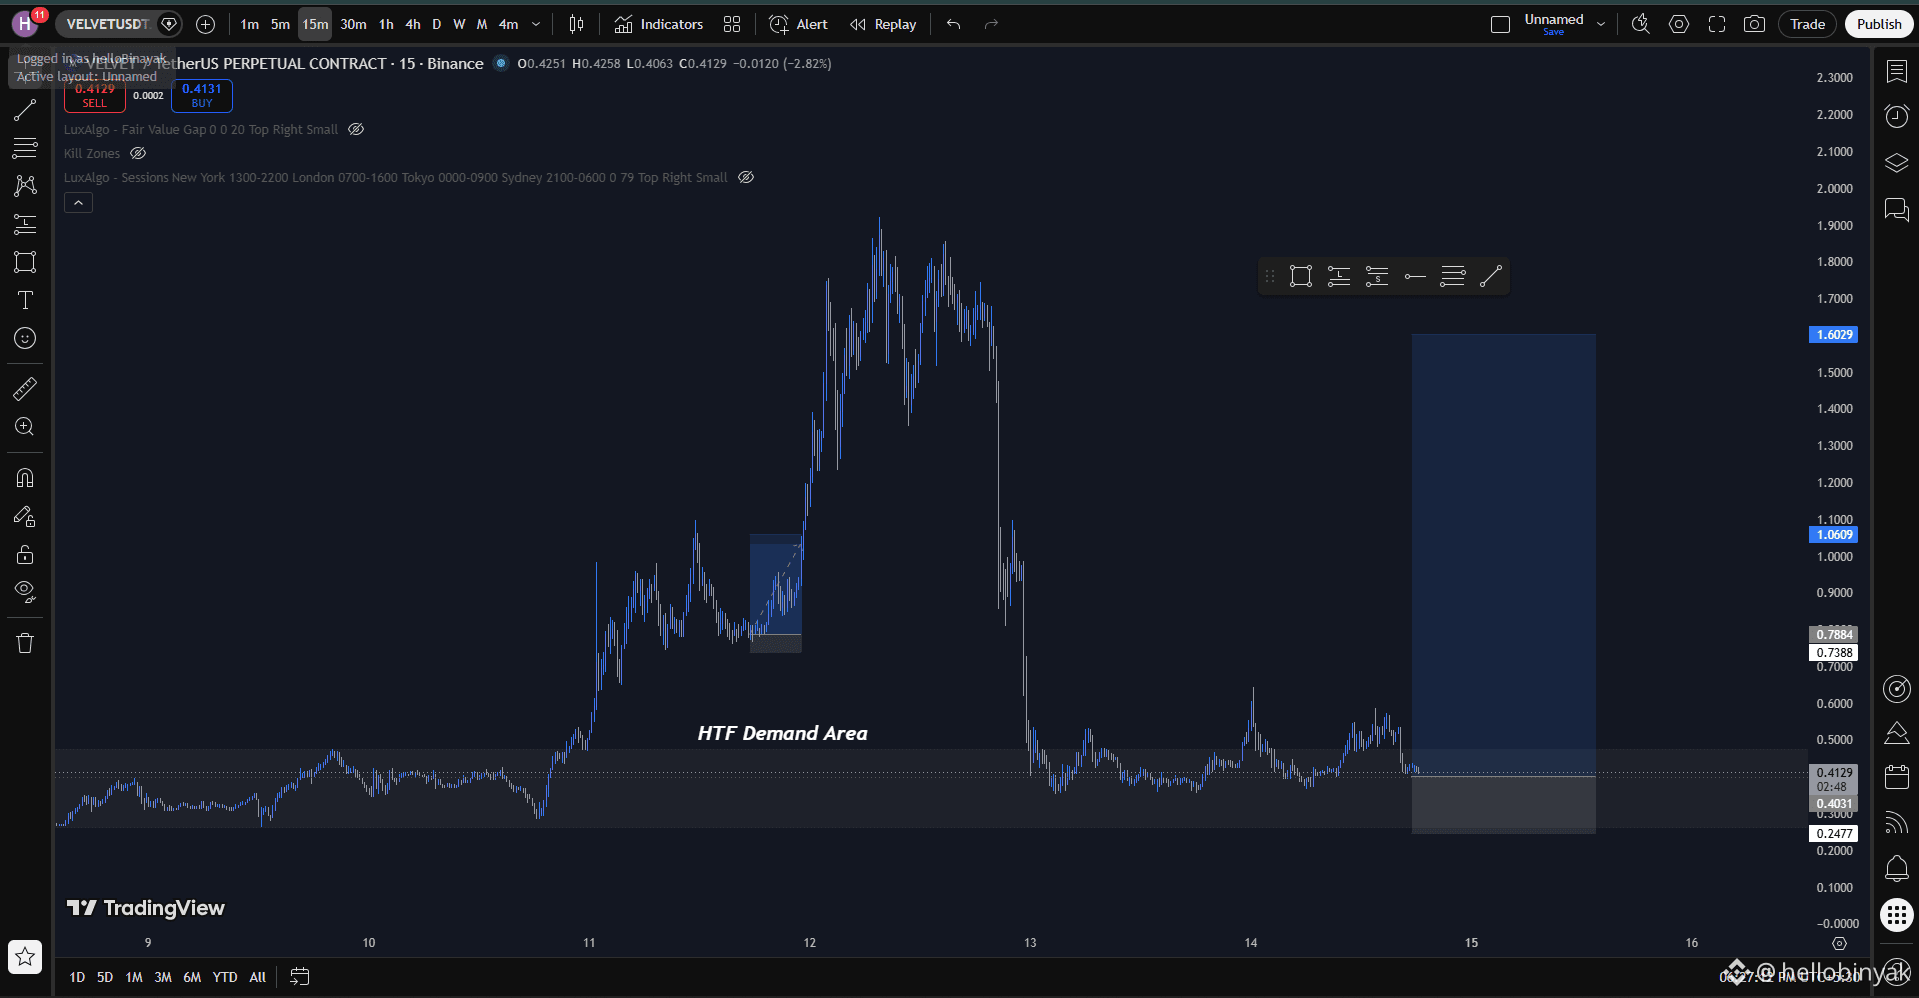
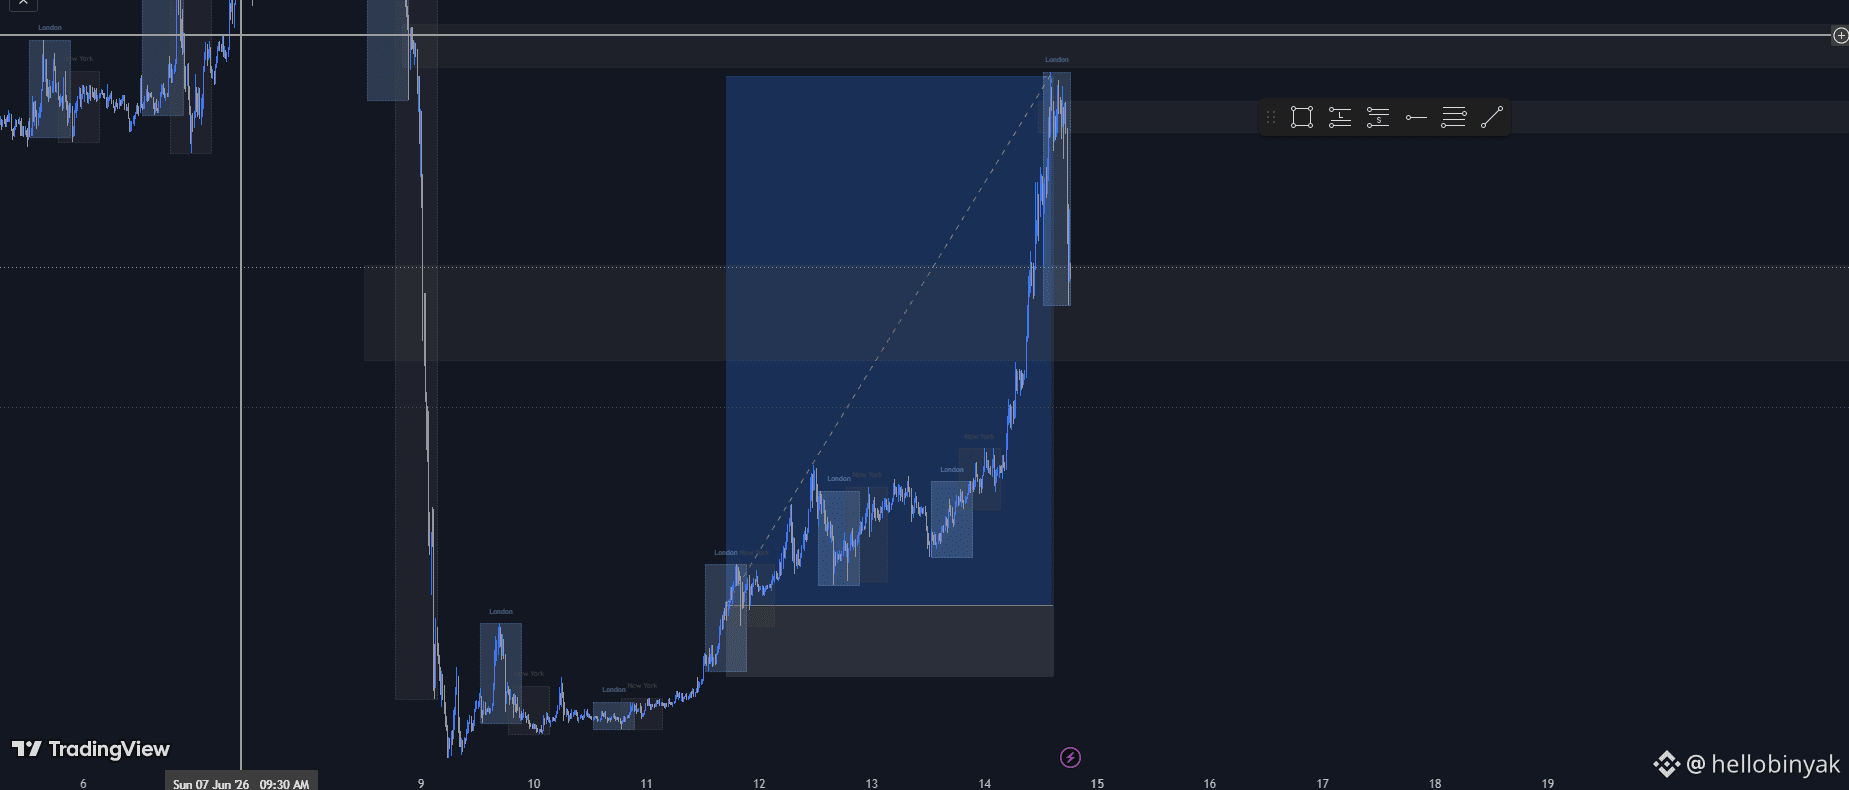
$VELVET
are you guys still holding? Going as planned
are you guys still holding? Going as planned


hellobinyak
·
--
BullishEveryone is panic-selling the crash, but $H just entered a zone where smart money usually starts paying attention.
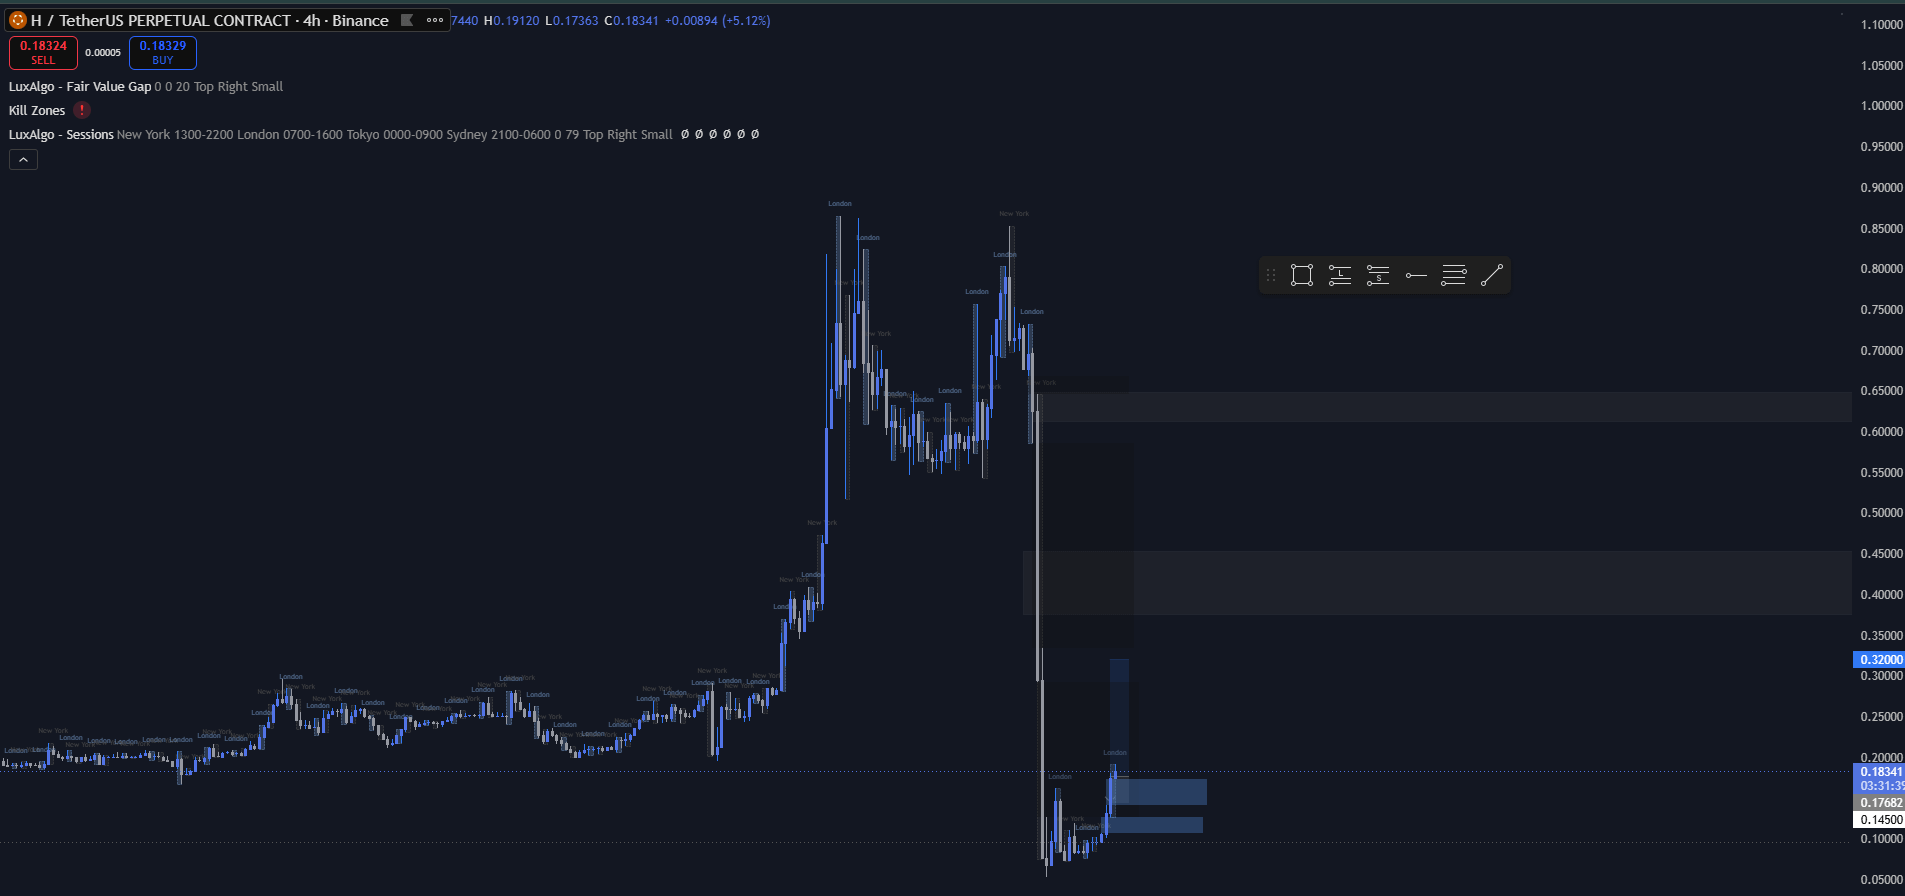
$H – LONG 🚀
Trade Plan:
Entry: 0.145 – 0.185
SL: 0.120
TP1: 0.320
TP2: 0.450
TP3: 0.600
Why this setup? (A quick lesson in Liquidity & Demand)
• What happened here? After a massive rally, $H experienced a sharp liquidation event that wiped out leveraged longs and forced weak hands out of the market. These aggressive selloffs often create opportunities because price becomes heavily discounted relative to where institutions previously accumulated.
• Why is the current zone important? The 0.145–0.185 area sits near the first significant reaction after the crash. When a market stabilizes after such a violent move, traders watch these zones for signs of absorption. If buyers continue defending this level, it can become the foundation for a larger recovery.
• What makes this attractive? The downside is clearly defined while the upside targets remain significantly larger. Good trading isn't about predicting the future—it's about finding situations where the reward outweighs the risk.
• How do I know the setup is invalid? If price loses the 0.120 area and closes below it, buyers are no longer defending the zone. That's the point where the idea is wrong and the trade should be closed.
• Risk management: Never risk more than you're comfortable losing on a single setup. The goal isn't to win every trade. The goal is to make sure your winners are larger than your losers.
Debate:
Do you think this is a genuine accumulation phase, or just a dead-cat bounce before another leg down?
Drop your thoughts below 👇 Let's discuss.
$H – LONG 🚀
Trade Plan:
Entry: 0.145 – 0.185
SL: 0.120
TP1: 0.320
TP2: 0.450
TP3: 0.600
Why this setup? (A quick lesson in Liquidity & Demand)
• What happened here? After a massive rally, $H experienced a sharp liquidation event that wiped out leveraged longs and forced weak hands out of the market. These aggressive selloffs often create opportunities because price becomes heavily discounted relative to where institutions previously accumulated.
• Why is the current zone important? The 0.145–0.185 area sits near the first significant reaction after the crash. When a market stabilizes after such a violent move, traders watch these zones for signs of absorption. If buyers continue defending this level, it can become the foundation for a larger recovery.
• What makes this attractive? The downside is clearly defined while the upside targets remain significantly larger. Good trading isn't about predicting the future—it's about finding situations where the reward outweighs the risk.
• How do I know the setup is invalid? If price loses the 0.120 area and closes below it, buyers are no longer defending the zone. That's the point where the idea is wrong and the trade should be closed.
• Risk management: Never risk more than you're comfortable losing on a single setup. The goal isn't to win every trade. The goal is to make sure your winners are larger than your losers.
Debate:
Do you think this is a genuine accumulation phase, or just a dead-cat bounce before another leg down?
Drop your thoughts below 👇 Let's discuss.
hellobinyak
·
--
BullishEveryone is panic-selling the crash, but $H just entered a zone where smart money usually starts paying attention.
$H – LONG 🚀
Trade Plan:
Entry: 0.145 – 0.185
SL: 0.120
TP1: 0.320
TP2: 0.450
TP3: 0.600
Why this setup? (A quick lesson in Liquidity & Demand)
• What happened here? After a massive rally, $H experienced a sharp liquidation event that wiped out leveraged longs and forced weak hands out of the market. These aggressive selloffs often create opportunities because price becomes heavily discounted relative to where institutions previously accumulated.
• Why is the current zone important? The 0.145–0.185 area sits near the first significant reaction after the crash. When a market stabilizes after such a violent move, traders watch these zones for signs of absorption. If buyers continue defending this level, it can become the foundation for a larger recovery.
• What makes this attractive? The downside is clearly defined while the upside targets remain significantly larger. Good trading isn't about predicting the future—it's about finding situations where the reward outweighs the risk.
• How do I know the setup is invalid? If price loses the 0.120 area and closes below it, buyers are no longer defending the zone. That's the point where the idea is wrong and the trade should be closed.
• Risk management: Never risk more than you're comfortable losing on a single setup. The goal isn't to win every trade. The goal is to make sure your winners are larger than your losers.
Debate:
Do you think this is a genuine accumulation phase, or just a dead-cat bounce before another leg down?
Drop your thoughts below 👇 Let's discuss.
$H – LONG 🚀
Trade Plan:
Entry: 0.145 – 0.185
SL: 0.120
TP1: 0.320
TP2: 0.450
TP3: 0.600
Why this setup? (A quick lesson in Liquidity & Demand)
• What happened here? After a massive rally, $H experienced a sharp liquidation event that wiped out leveraged longs and forced weak hands out of the market. These aggressive selloffs often create opportunities because price becomes heavily discounted relative to where institutions previously accumulated.
• Why is the current zone important? The 0.145–0.185 area sits near the first significant reaction after the crash. When a market stabilizes after such a violent move, traders watch these zones for signs of absorption. If buyers continue defending this level, it can become the foundation for a larger recovery.
• What makes this attractive? The downside is clearly defined while the upside targets remain significantly larger. Good trading isn't about predicting the future—it's about finding situations where the reward outweighs the risk.
• How do I know the setup is invalid? If price loses the 0.120 area and closes below it, buyers are no longer defending the zone. That's the point where the idea is wrong and the trade should be closed.
• Risk management: Never risk more than you're comfortable losing on a single setup. The goal isn't to win every trade. The goal is to make sure your winners are larger than your losers.
Debate:
Do you think this is a genuine accumulation phase, or just a dead-cat bounce before another leg down?
Drop your thoughts below 👇 Let's discuss.
hellobinyak
·
--
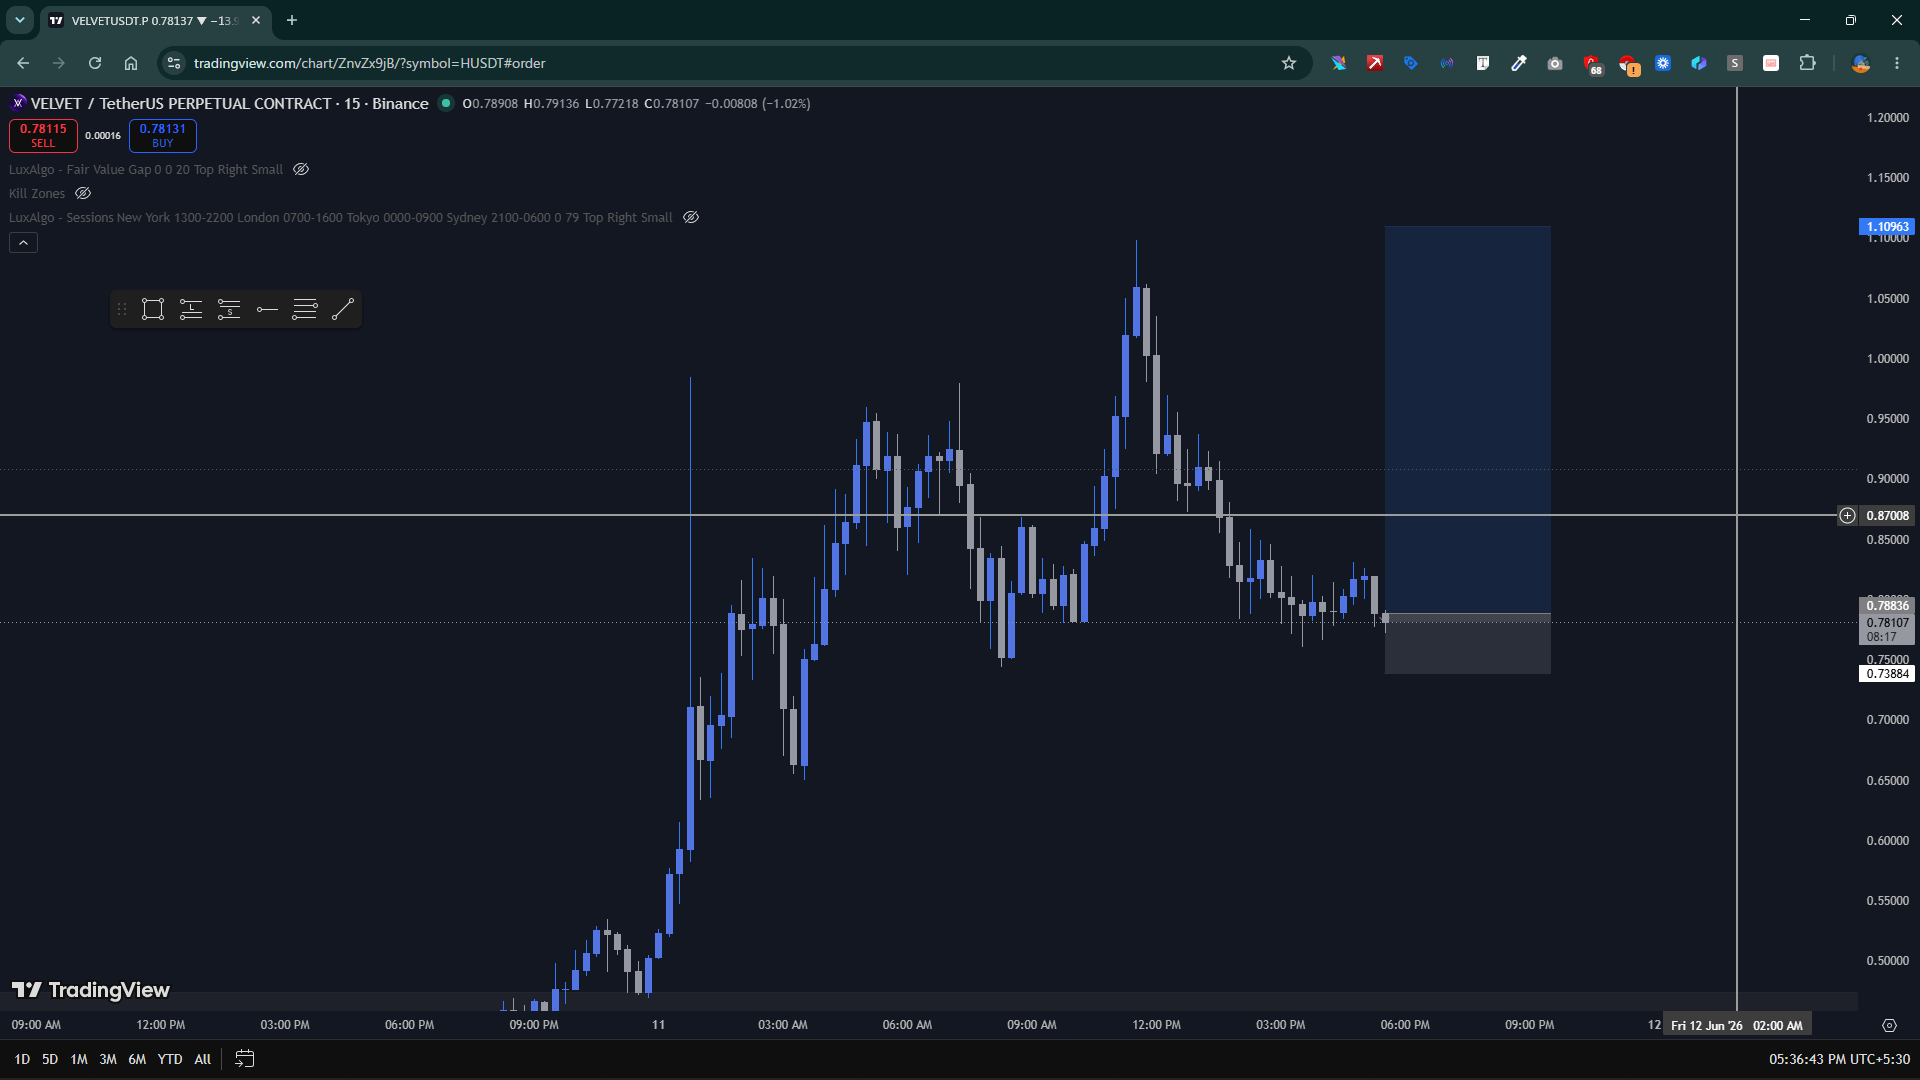
BullishEveryone is watching the pump, but $VELVET /USDT just armed a trap most won't see coming.
$VELVET – LONG
Trade Plan:
Entry: 0.748 – 0.790
SL: 0.728
TP1: 0.950
TP2: 1.050
TP3: 1.100
Why this setup? (A quick lesson in Supply & Demand)
•
What is a demand zone? It's a price area where buying pressure was strong enough to push price up sharply. The faster price leaves a level, the more unfilled buy orders are likely still sitting there. On VELVET, the 0.748–0.790 range was the last major origin point before the 2x move to 1.10. Price is now returning to that same area.
•
Why does this matter? Institutions and large traders don't fill their entire position in one candle. They leave resting orders at levels they consider valuable. When price revisits those levels, those orders get triggered — and that's what creates the bounce. This is the core logic behind supply & demand trading.
•
How do I confirm the zone is still valid? Three things: price hasn't closed below 0.728 (invalidation), the zone hasn't been tested multiple times already (fresh zones are stronger), and session timing from the Kill Zone indicator lines up with when smart money is most active.
• Risk management: SL is placed below the zone's origin at 0.728. If price closes below that level, the demand zone is broken and the setup is invalid. Never hold a trade past your invalidation — that's not trading, that's hoping.
Debate:
Do you trade supply & demand zones, or do you prefer indicator-based entries? What does your setup look like?
Drop your thoughts below 👇 Let's learn from each other.
😁
$VELVET – LONG
Trade Plan:
Entry: 0.748 – 0.790
SL: 0.728
TP1: 0.950
TP2: 1.050
TP3: 1.100
Why this setup? (A quick lesson in Supply & Demand)
•
What is a demand zone? It's a price area where buying pressure was strong enough to push price up sharply. The faster price leaves a level, the more unfilled buy orders are likely still sitting there. On VELVET, the 0.748–0.790 range was the last major origin point before the 2x move to 1.10. Price is now returning to that same area.
•
Why does this matter? Institutions and large traders don't fill their entire position in one candle. They leave resting orders at levels they consider valuable. When price revisits those levels, those orders get triggered — and that's what creates the bounce. This is the core logic behind supply & demand trading.
•
How do I confirm the zone is still valid? Three things: price hasn't closed below 0.728 (invalidation), the zone hasn't been tested multiple times already (fresh zones are stronger), and session timing from the Kill Zone indicator lines up with when smart money is most active.
• Risk management: SL is placed below the zone's origin at 0.728. If price closes below that level, the demand zone is broken and the setup is invalid. Never hold a trade past your invalidation — that's not trading, that's hoping.
Debate:
Do you trade supply & demand zones, or do you prefer indicator-based entries? What does your setup look like?
Drop your thoughts below 👇 Let's learn from each other.
😁
Log in to explore more content