
Hascobar
101 Posts

Hascobar
Data engineer. Safe trading(Spot only). 10 years experience in stock markets, 5 years experience in cryptocurrency
Open Trade
Occasional Trader
8.7 Years
8 Following
222 Followers
164 Liked
Posts
Portfolio
All
Quotes
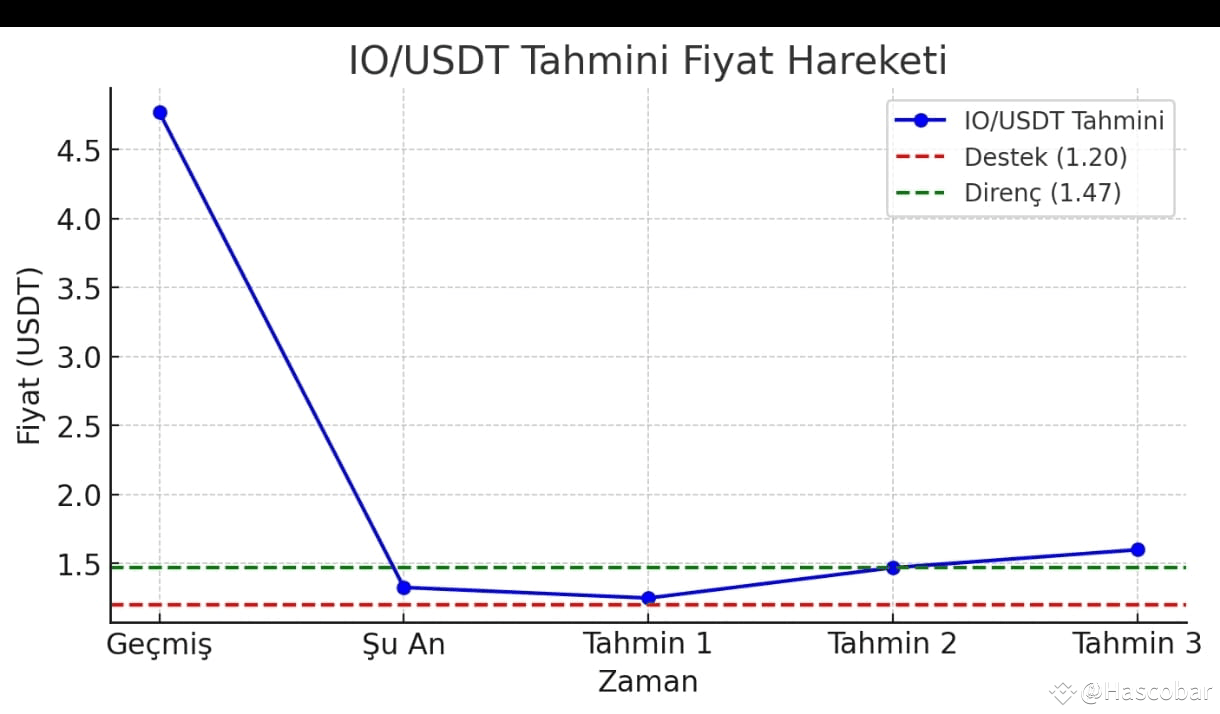
The chart shows the estimated movement of the IO/USDT price. Considering the current downtrend, a scenario is drawn where the price could test the 1.20 support level, then recover and head towards the 1.47 and 1.60 resistance levels.
If 1.20 is broken, the decline could deepen. However, the RSI is in the oversold territory, so a reaction buy is likely in the short term. Volume growth and a positive MACD turn will be critical for the rise to continue.
$IO
#InfiniHacked #SaylorBTCPurchase
If 1.20 is broken, the decline could deepen. However, the RSI is in the oversold territory, so a reaction buy is likely in the short term. Volume growth and a positive MACD turn will be critical for the rise to continue.
$IO
#InfiniHacked #SaylorBTCPurchase
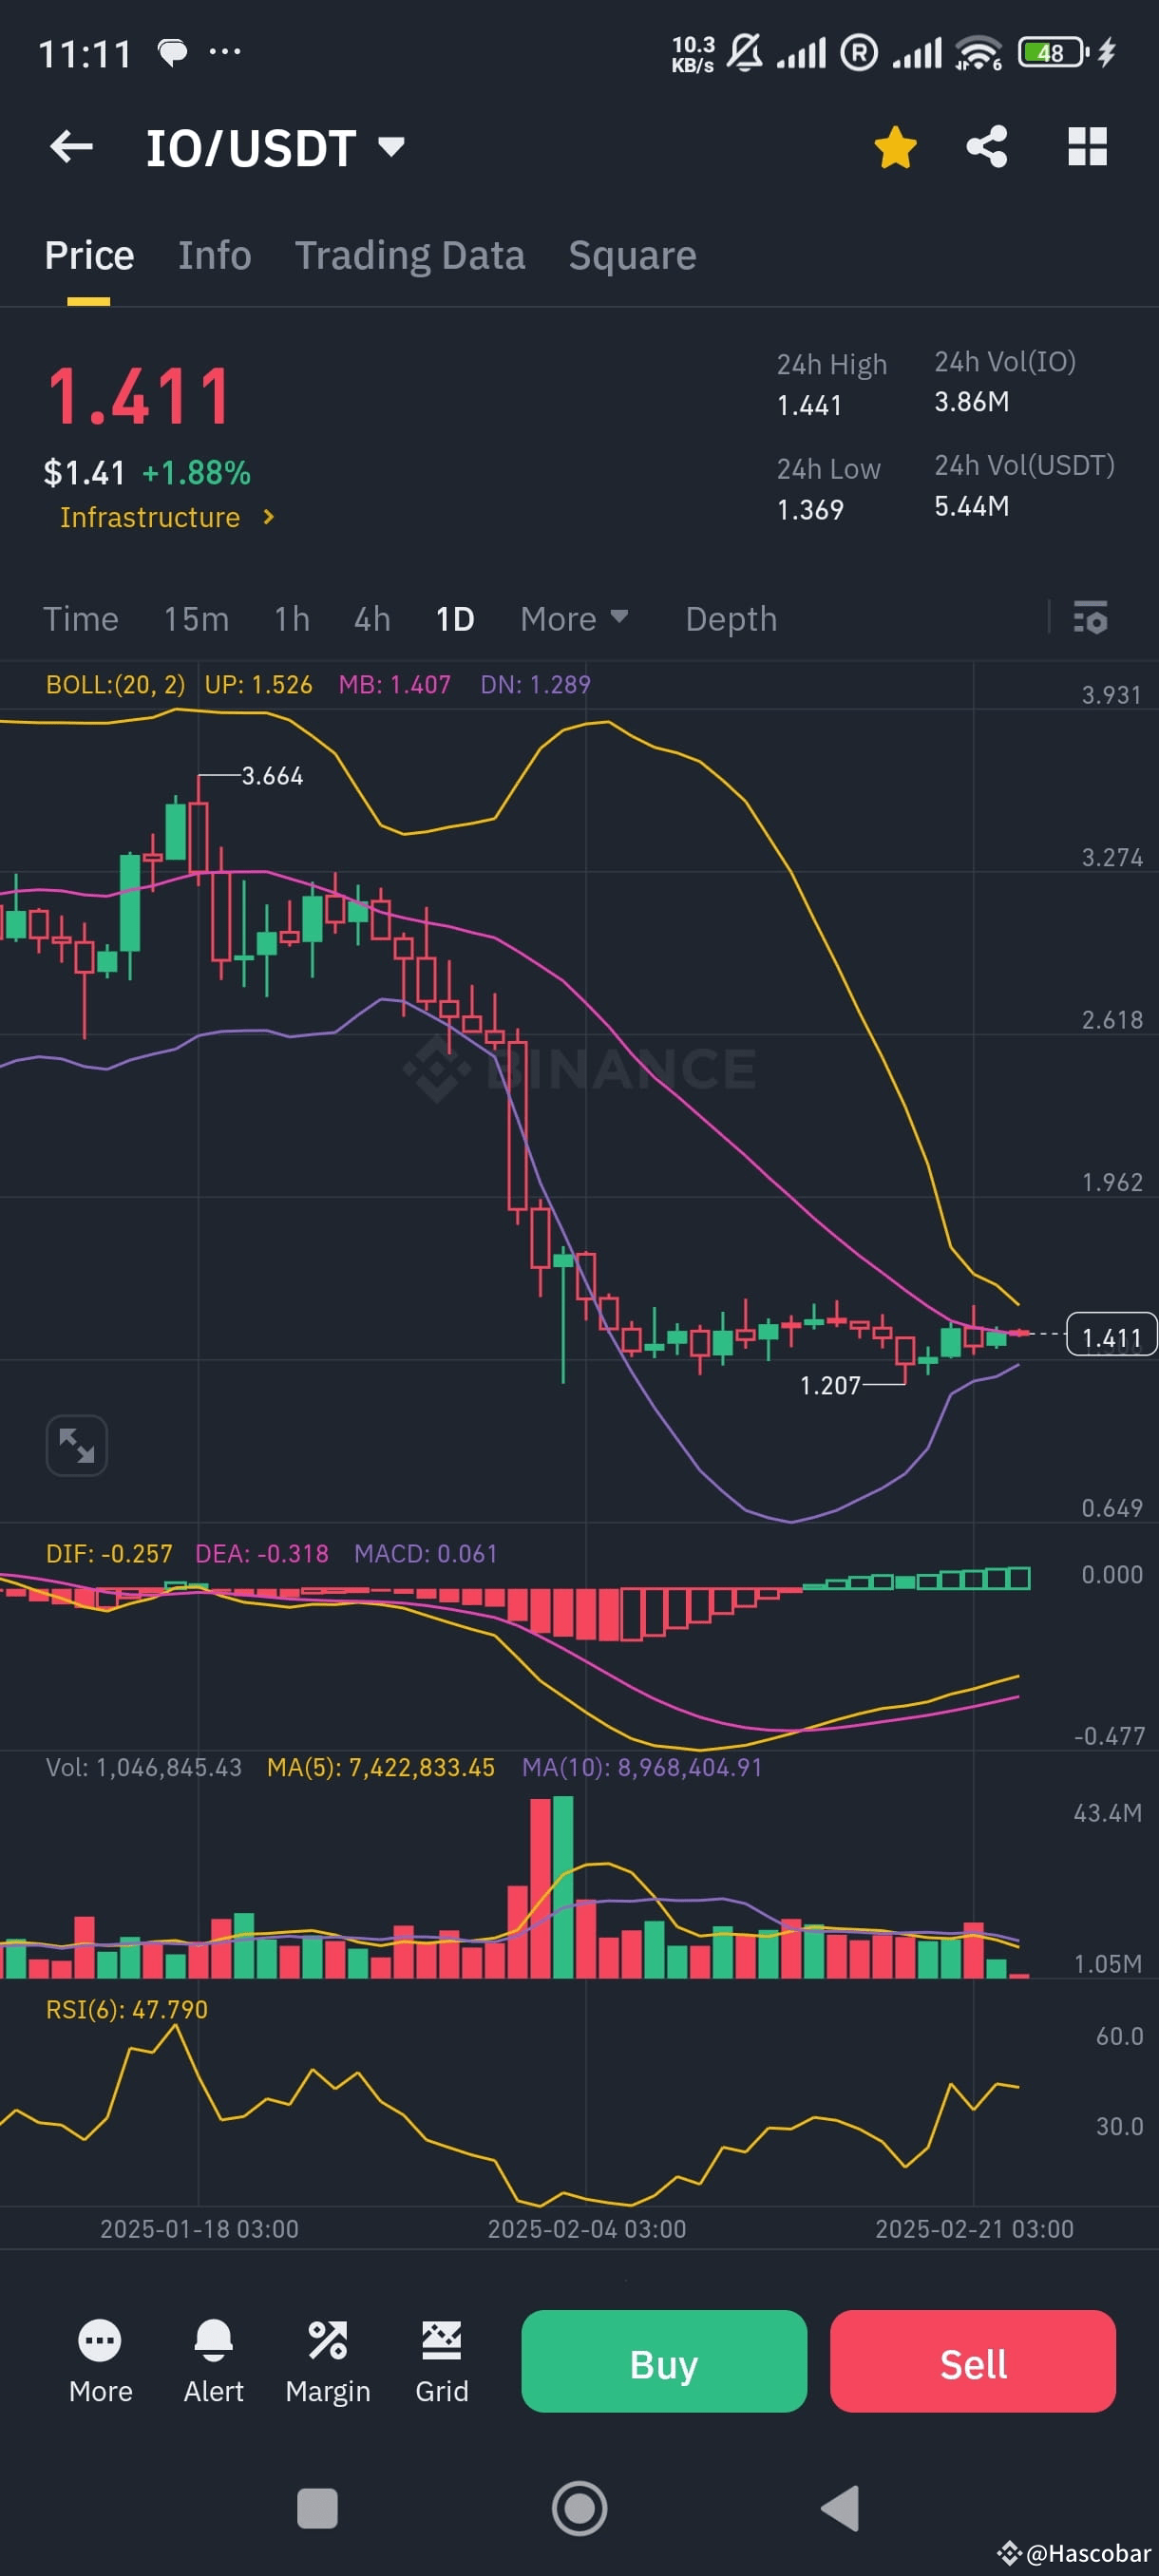
Let's analyze the technical indicators of the IO/USDT trading pair on the chart on the 1-day (1D) time frame:
1. General Outlook
Price: 1,411 USDT
24-hour change: 1.88% up
24-hour high: 1,441 USDT
24-hour low: 1,369 USDT
The price is following a sideways movement, recovering from the recent low of 1,207 USDT.
---
2. Technical Indicators
Bollinger Bands (BB)
Upper Band: 1,526 USDT
Middle Band (20-Day Average): 1,407 USDT
Lower Band: 1,289 USDT
The price is currently trading just above the middle band, but the Bollinger bands are tightening, suggesting that volatility may increase soon.
MACD (Moving Average Convergence Divergence)
MACD Line: -0.257
Signal Line: -0.318
Histogram: 0.061 (weak positive signal)
The MACD indicator has started to give a weak bullish signal, but for a strong buy signal, the MACD line needs to break above the signal line.
RSI (Relative Strength Index)
RSI Value: 47.79 (Neutral zone)
The RSI is currently neither overbought nor oversold, but it could gain momentum if it breaks above 50.
Volume Analysis
The trading volume has been low in recent days, but it increased during the previous sharp decline.
The trading volume needs to increase for a rally.
---
3. Future Forecast
Short-Term Scenarios (1-7 Days):
1. Bullish Scenario:
With the break of the 1.45 USDT resistance, the price may rise to the 1.52-1.60 USDT range.
MACD and RSI need to gain strength.
An increase in volume is a must.
2. Bearish Scenario:
The 1.37-1.35 USDT support level can be tested.
If 1.35 is broken, there is a possibility of a decline to the 1.28-1.20 levels.
Medium-Term Expectation (2-4 Weeks):
Bollinger Bands are tightening, which is usually a sign of a big move.
A breakout with volume is a must for an increase.
Support and resistance levels should be followed carefully.
---
4. Conclusion and Recommendations
The price is currently in a sideways trend, there is no strong directional sign.
Volume and MACD should be followed carefully.#BybitSecurityBreach $IO
1. General Outlook
Price: 1,411 USDT
24-hour change: 1.88% up
24-hour high: 1,441 USDT
24-hour low: 1,369 USDT
The price is following a sideways movement, recovering from the recent low of 1,207 USDT.
---
2. Technical Indicators
Bollinger Bands (BB)
Upper Band: 1,526 USDT
Middle Band (20-Day Average): 1,407 USDT
Lower Band: 1,289 USDT
The price is currently trading just above the middle band, but the Bollinger bands are tightening, suggesting that volatility may increase soon.
MACD (Moving Average Convergence Divergence)
MACD Line: -0.257
Signal Line: -0.318
Histogram: 0.061 (weak positive signal)
The MACD indicator has started to give a weak bullish signal, but for a strong buy signal, the MACD line needs to break above the signal line.
RSI (Relative Strength Index)
RSI Value: 47.79 (Neutral zone)
The RSI is currently neither overbought nor oversold, but it could gain momentum if it breaks above 50.
Volume Analysis
The trading volume has been low in recent days, but it increased during the previous sharp decline.
The trading volume needs to increase for a rally.
---
3. Future Forecast
Short-Term Scenarios (1-7 Days):
1. Bullish Scenario:
With the break of the 1.45 USDT resistance, the price may rise to the 1.52-1.60 USDT range.
MACD and RSI need to gain strength.
An increase in volume is a must.
2. Bearish Scenario:
The 1.37-1.35 USDT support level can be tested.
If 1.35 is broken, there is a possibility of a decline to the 1.28-1.20 levels.
Medium-Term Expectation (2-4 Weeks):
Bollinger Bands are tightening, which is usually a sign of a big move.
A breakout with volume is a must for an increase.
Support and resistance levels should be followed carefully.
---
4. Conclusion and Recommendations
The price is currently in a sideways trend, there is no strong directional sign.
Volume and MACD should be followed carefully.#BybitSecurityBreach $IO

Hi everyone from the USA. Ripple will be Rank 2. coin soon that's why Ethereum is lost and Vitalik is selling eth... Trump doesn't support Eth! #TrumptMarketInsights #TrumpMarketWatch #BTCBreaksATH #TrumpMarketInsights #TRUMPOnBinance $XRP

İ think troy will decrease at least %35 more. it seems like shtcoin project and monitoring. it seems like scm project maybe . binance can delist . Take care of it! $TROY
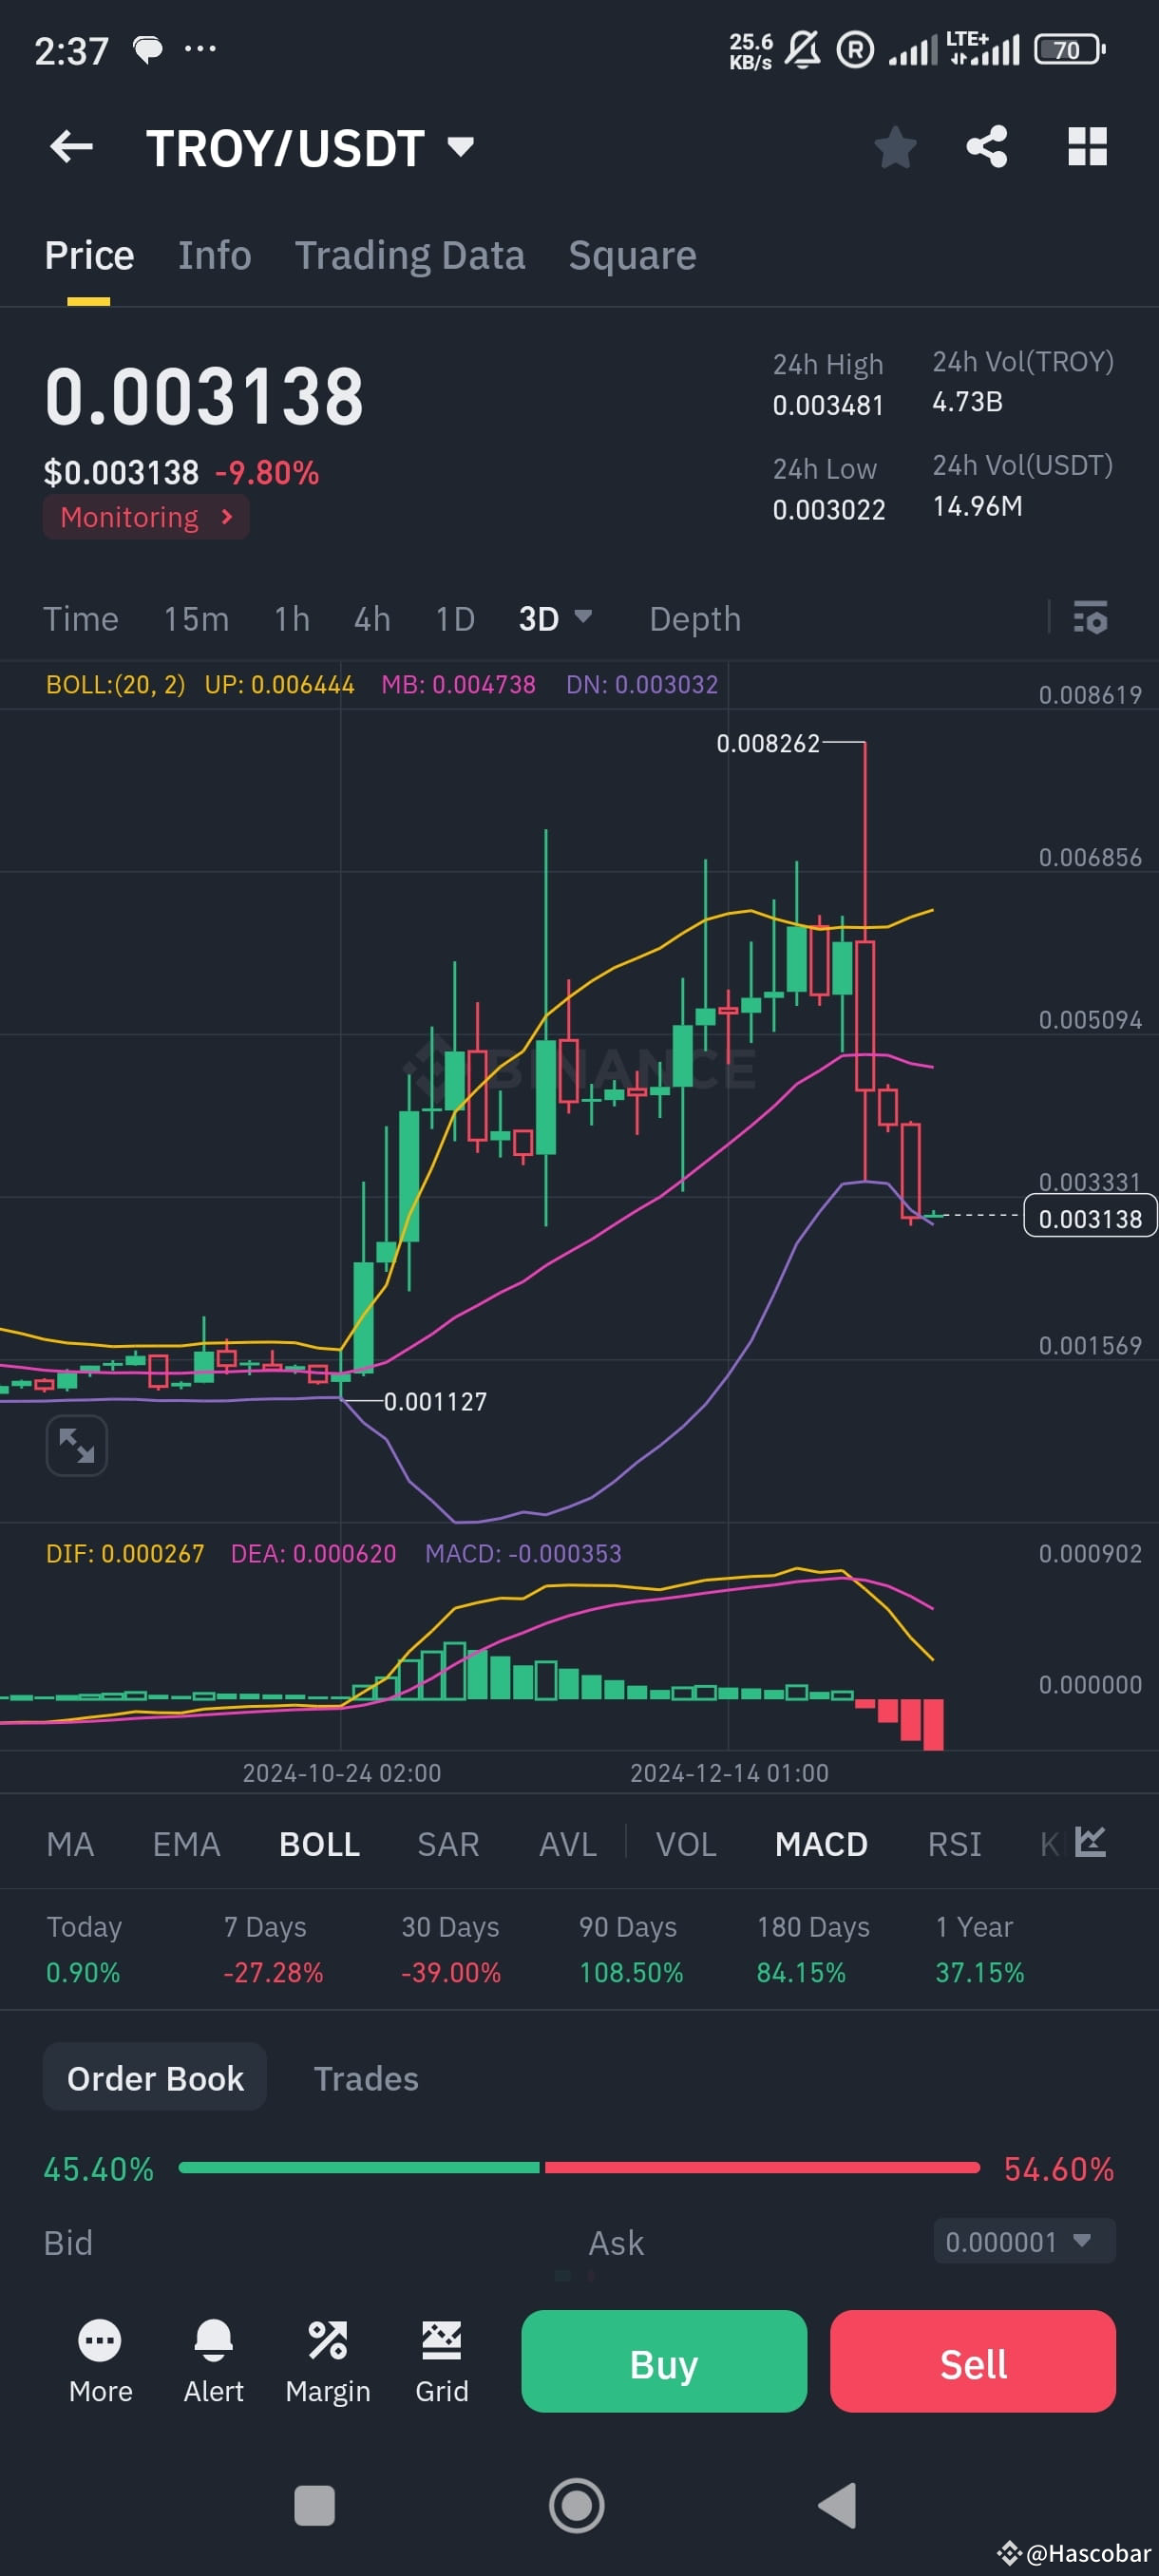
troy will be delist ASAP... because its a scam project and monitoring now

raqe co
·
--
Bullish$TROY
If you sell your coin at 0.00418, hoping to buy it back at 0.0040, let me tell you—it doesn’t happen every day. Whales have strategies designed to manipulate the market. While they might let you win 1% or 2% occasionally, their ultimate goal is to make you lose 20% or even 30% of your investment.
Here’s the trick: they’ll create a pattern that makes you think the coin is declining steadily, day by day, draining your hope. Then, when you least expect it—boom—the price skyrockets, maybe even to 0.01. At that moment, they’ve left you scrambling, realizing you missed the opportunity.
Remember, the market is designed to test your patience and discipline. Don’t let their strategies shake your confidence
If you sell your coin at 0.00418, hoping to buy it back at 0.0040, let me tell you—it doesn’t happen every day. Whales have strategies designed to manipulate the market. While they might let you win 1% or 2% occasionally, their ultimate goal is to make you lose 20% or even 30% of your investment.
Here’s the trick: they’ll create a pattern that makes you think the coin is declining steadily, day by day, draining your hope. Then, when you least expect it—boom—the price skyrockets, maybe even to 0.01. At that moment, they’ve left you scrambling, realizing you missed the opportunity.
Remember, the market is designed to test your patience and discipline. Don’t let their strategies shake your confidence

Log in to explore more content