
GRTradersPro
921 Posts

GRTradersPro
Report
Block User
📊 Crypto Market Analysis | Trading Insights 🎯 Data-Driven Decisions • Discipline • Risk Management
Open Trade
Frequent Trader
5.3 Years
71 Following
287 Followers
661 Liked
Posts
Portfolio
All
Quotes
Videos
·
--
LUNA update :
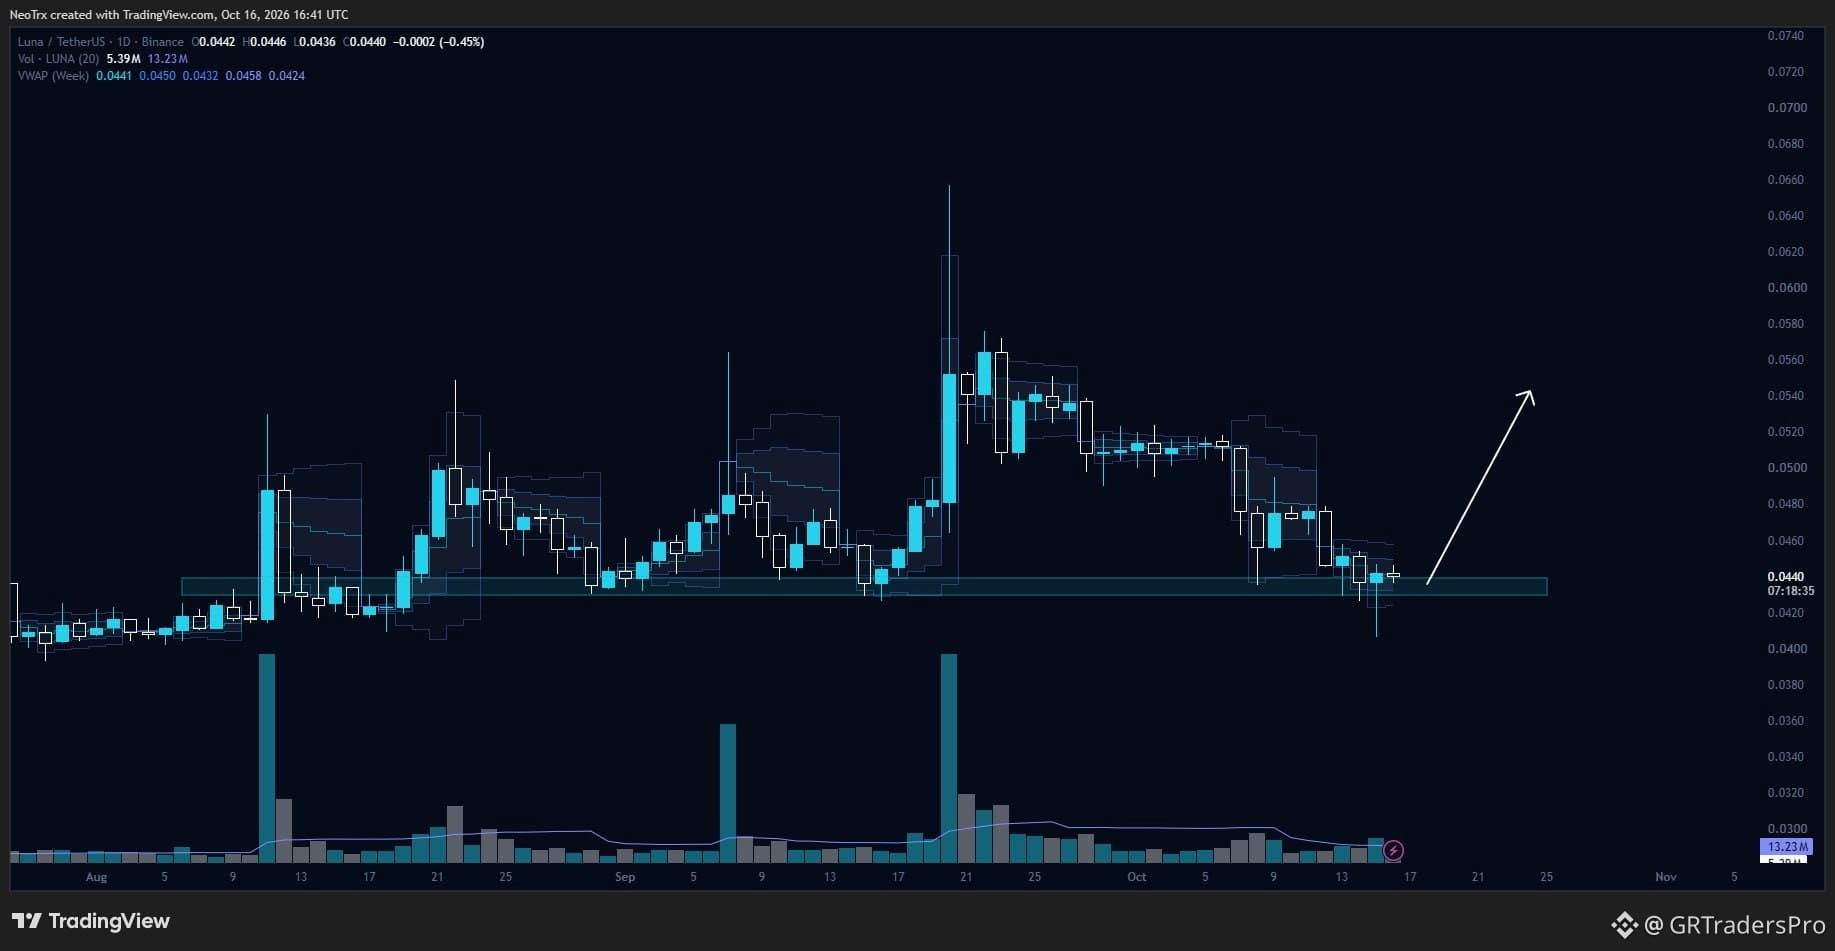
$LUNA is back at its mid-term horizontal support zone (~$0.043-$0.044). The upside liquidity was already swept by that massive wick in September, so the area above is clear for $LUNA.
With little overhead resistance left, a rebound from here should come easier this time. Now $LUNA needs to hold the zone and bounce.
$LUNA
{spot}(LUNAUSDT)
#BinanceSquareFamily
LUNA update :
$LUNA is back at its mid-term horizontal support zone (~$0.043-$0.044). The upside liquidity was already swept by that massive wick in September, so the area above is clear for $LUNA .
With little overhead resistance left, a rebound from here should come easier this time. Now $LUNA needs to hold the zone and bounce.
$LUNA
#BinanceSquareFamily
$LUNA is back at its mid-term horizontal support zone (~$0.043-$0.044). The upside liquidity was already swept by that massive wick in September, so the area above is clear for $LUNA .
With little overhead resistance left, a rebound from here should come easier this time. Now $LUNA needs to hold the zone and bounce.
$LUNA
#BinanceSquareFamily
90
·
--
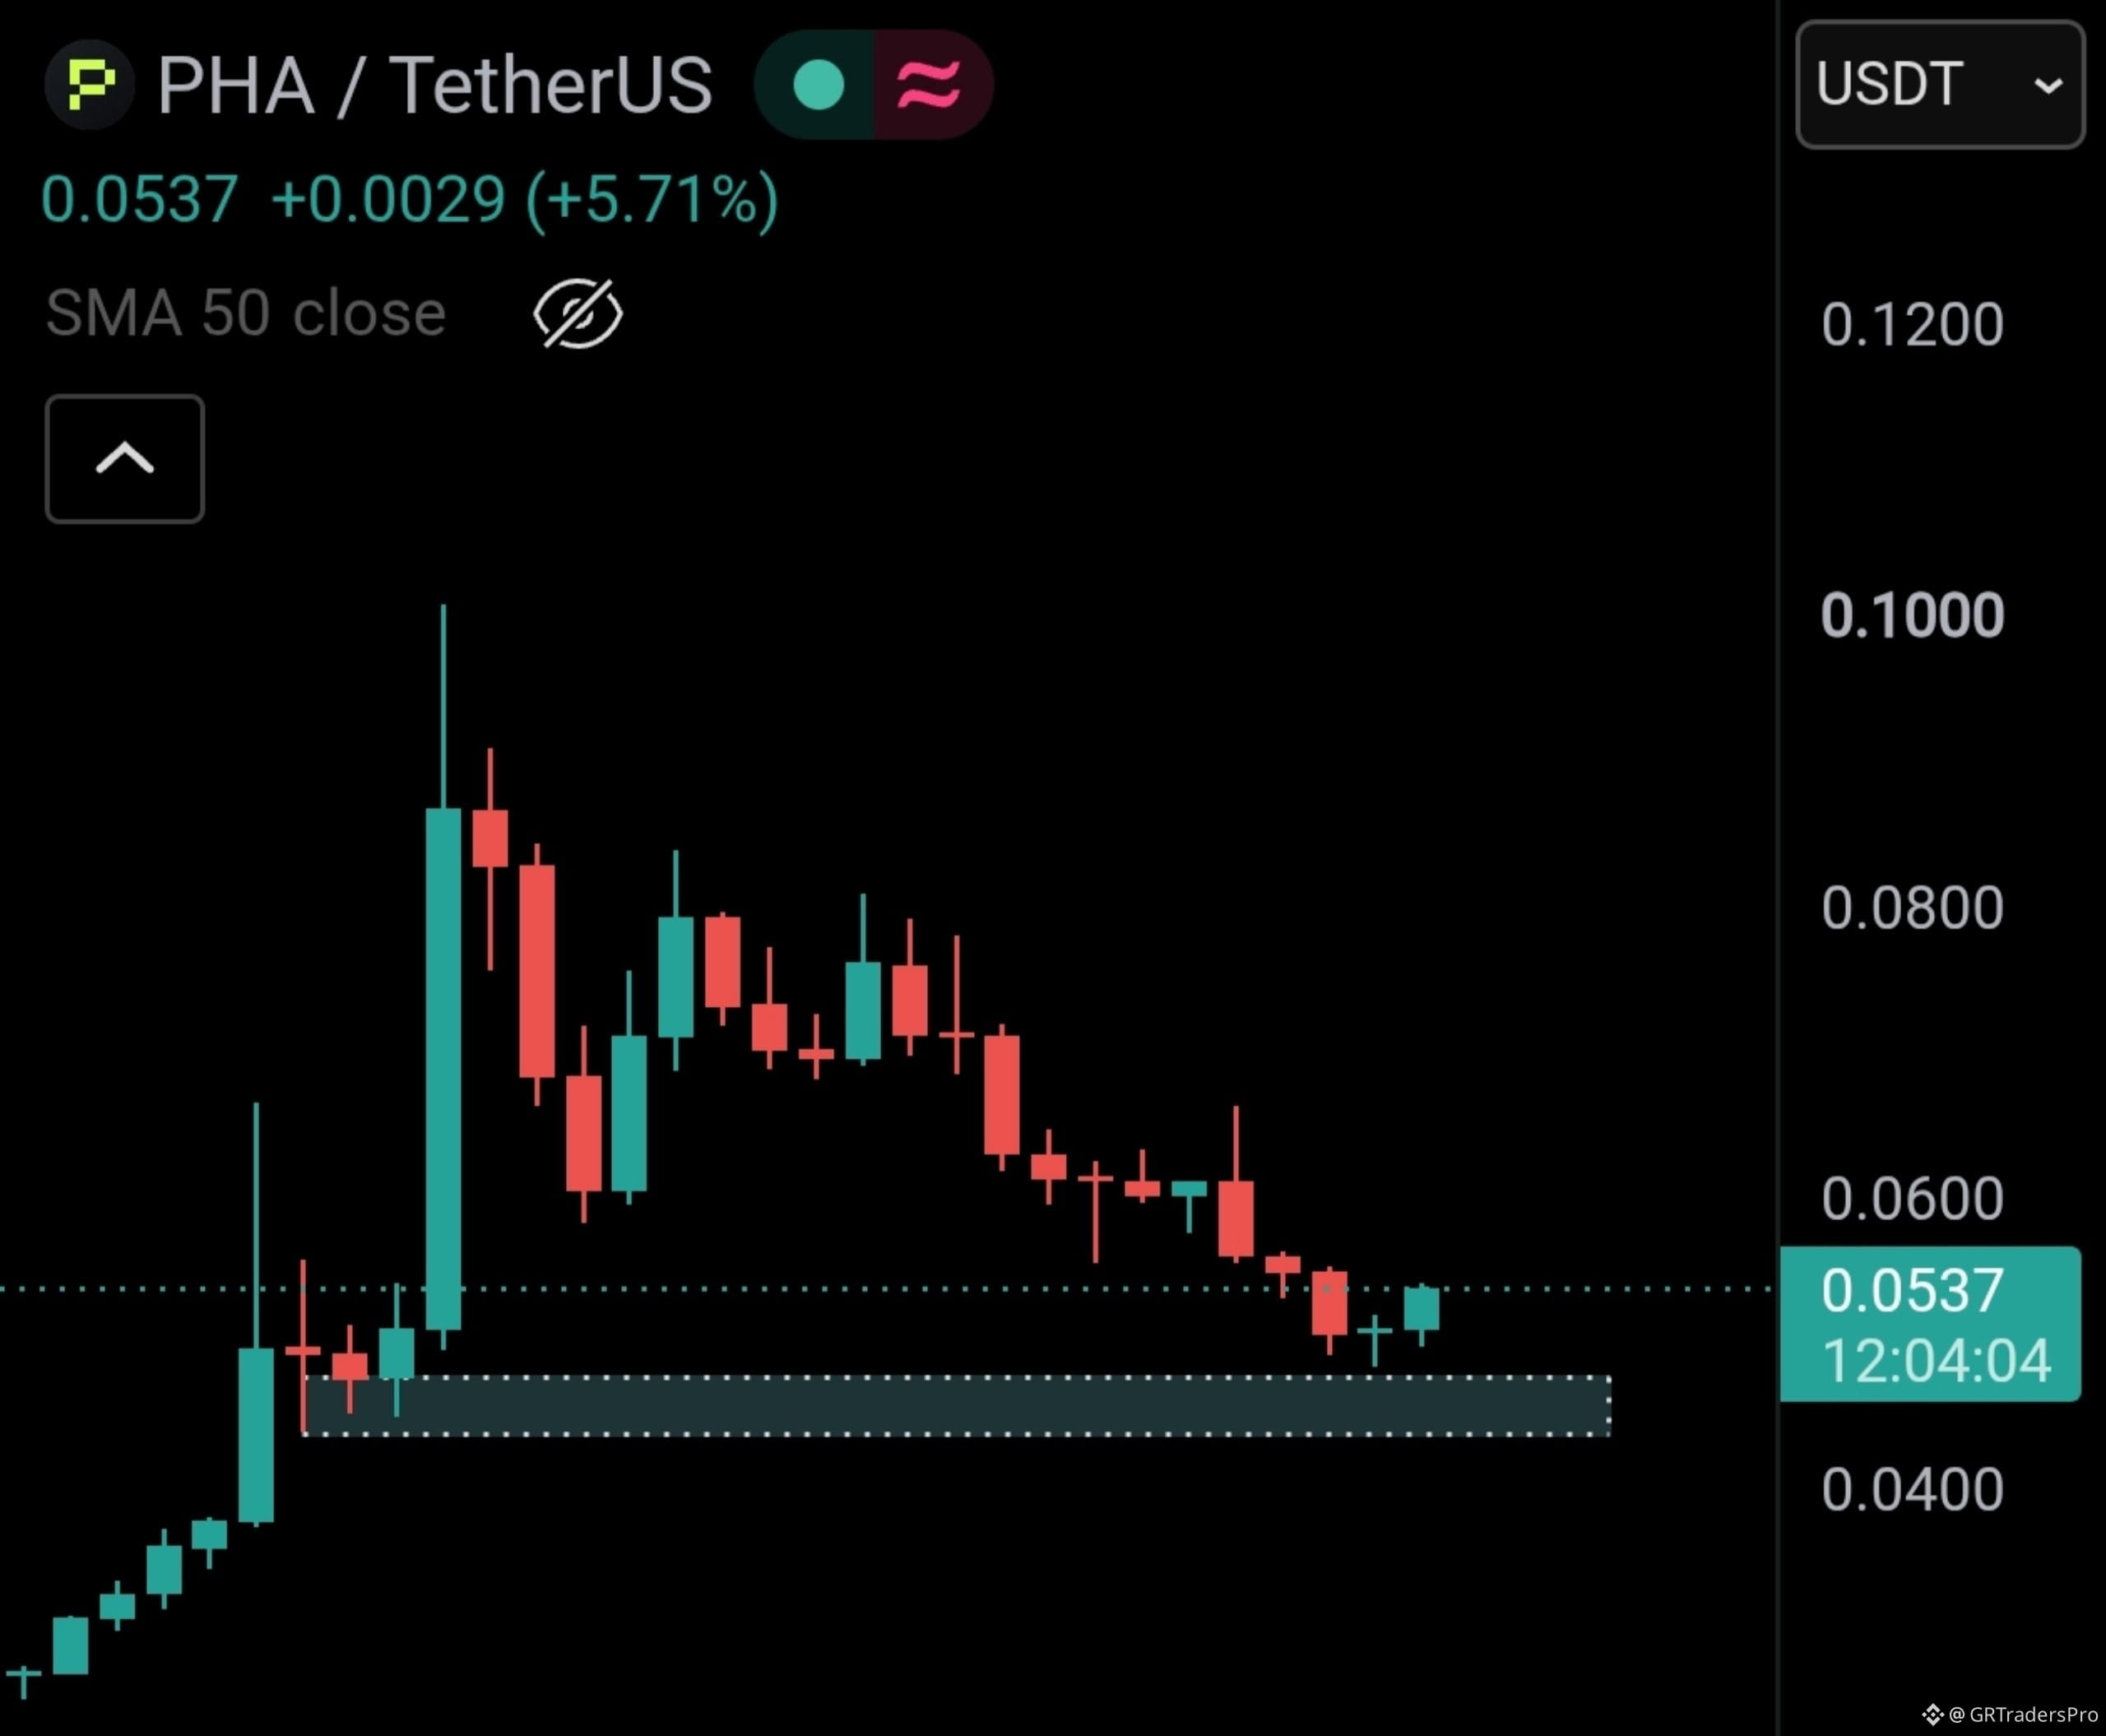
PHA is holding near an important support zone. A bounce from here looks possible.
$PHA
{future}(PHAUSDT)
Entry Zone: $0.0478 to $0.0528
Targets: $0.0615, $0.0655, $0.0735, $0.0824
PHA is holding near an important support zone. A bounce from here looks possible.
$PHA
Entry Zone: $0.0478 to $0.0528
Targets: $0.0615, $0.0655, $0.0735, $0.0824
$PHA
Entry Zone: $0.0478 to $0.0528
Targets: $0.0615, $0.0655, $0.0735, $0.0824
1
160
·
--
Chart Request: $XPL
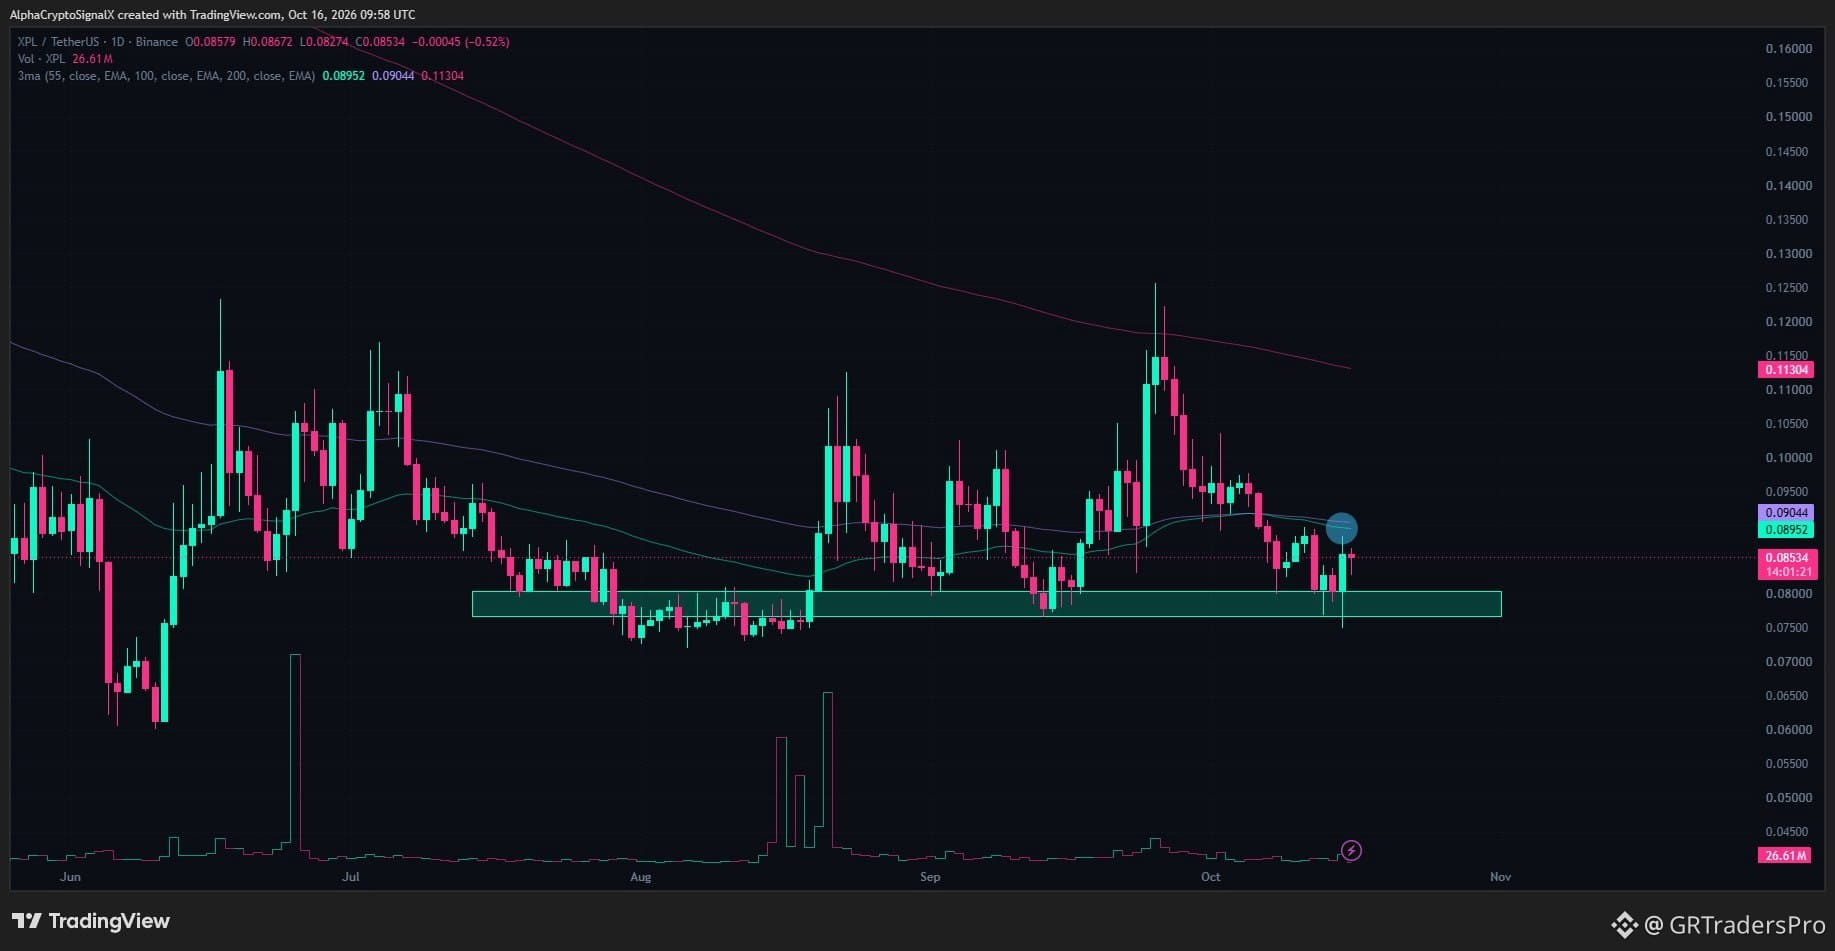
$XPL is defending its primary horizontal demand zone on the daily chart, showing early signs of buyer defense at these lower levels.
Waiting for extra confirmation is the smart play here on $XPL. A decisive push and close above the 55 EMA and 100 EMA will confirm dynamic support reclamation, offering a high-probability long entry setup targeting $0.105+.
$XPL
{future}(XPLUSDT)
Chart Request: $XPL
$XPL is defending its primary horizontal demand zone on the daily chart, showing early signs of buyer defense at these lower levels.
Waiting for extra confirmation is the smart play here on $XPL . A decisive push and close above the 55 EMA and 100 EMA will confirm dynamic support reclamation, offering a high-probability long entry setup targeting $0.105+.
$XPL
$XPL is defending its primary horizontal demand zone on the daily chart, showing early signs of buyer defense at these lower levels.
Waiting for extra confirmation is the smart play here on $XPL . A decisive push and close above the 55 EMA and 100 EMA will confirm dynamic support reclamation, offering a high-probability long entry setup targeting $0.105+.
$XPL
109
·
--
Thoughts on #XNO:
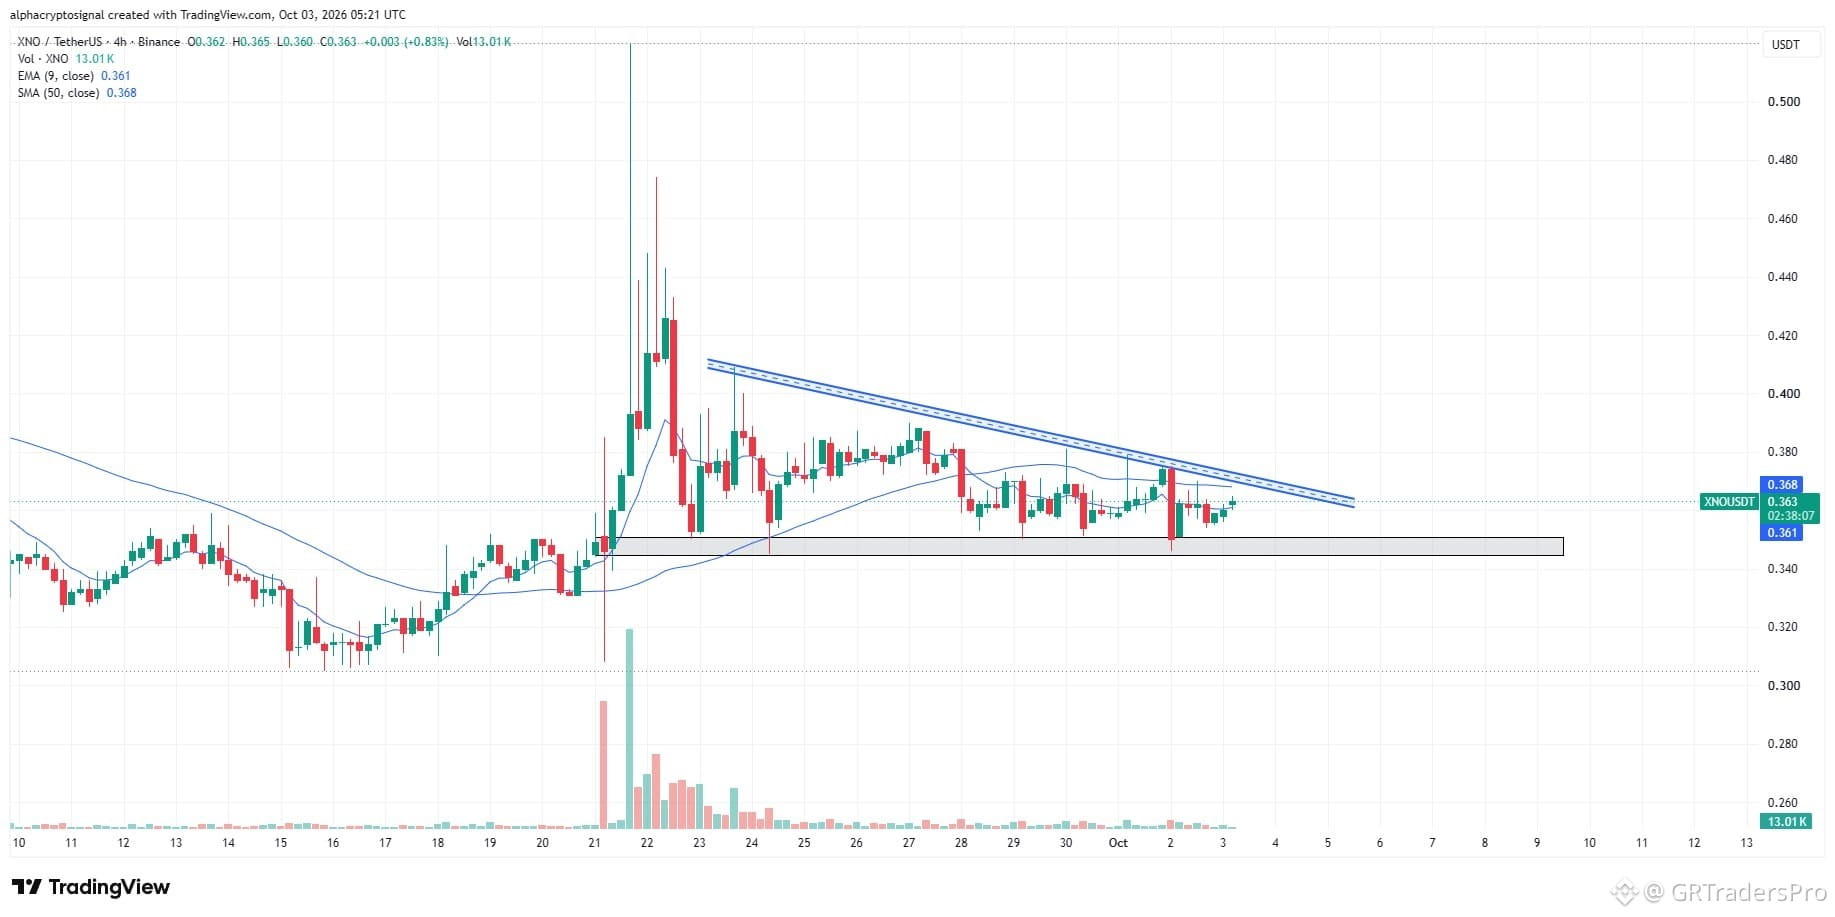
$XNO is forming a descending triangle on the 4H timeframe, with price consistently respecting the horizontal support zone while facing downward pressure from the descending resistance. The price action is getting tighter, suggesting a potential breakout could be approaching.
I’m keeping $XNO on my radar for a breakout from this structure.
$XNO
{spot}(XNOUSDT)
Thoughts on #XNO:
$XNO is forming a descending triangle on the 4H timeframe, with price consistently respecting the horizontal support zone while facing downward pressure from the descending resistance. The price action is getting tighter, suggesting a potential breakout could be approaching.
I’m keeping $XNO on my radar for a breakout from this structure.
$XNO
$XNO is forming a descending triangle on the 4H timeframe, with price consistently respecting the horizontal support zone while facing downward pressure from the descending resistance. The price action is getting tighter, suggesting a potential breakout could be approaching.
I’m keeping $XNO on my radar for a breakout from this structure.
$XNO
101
·
--
Thoughts on #FET:
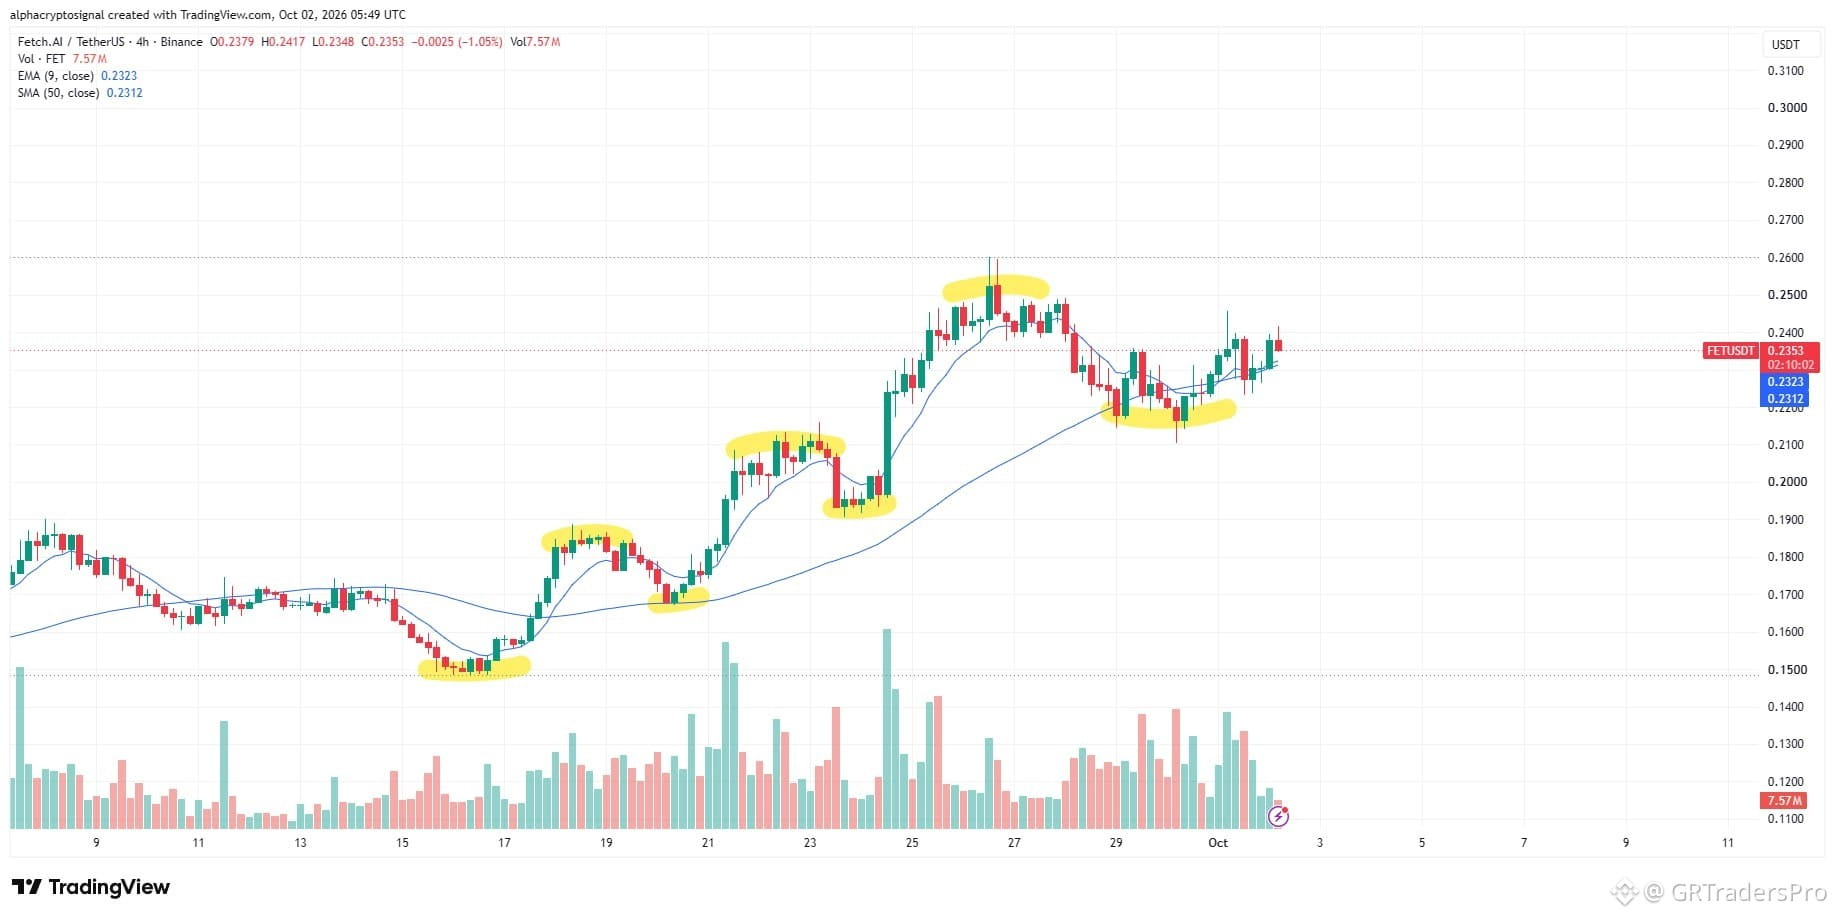
$FET is maintaining a clear higher high and higher low structure, indicating bullish momentum on the 4H timeframe. Every pullback is finding buyers at a higher level, while price continues to push towards previous highs.
As long as $FET maintains this HH/HL structure, I’ll remain bullish and look for continuation towards the next resistance. A break below the recent higher low would be the first sign of weakness.
$FET
{future}(FETUSDT)
Thoughts on #FET:
$FET is maintaining a clear higher high and higher low structure, indicating bullish momentum on the 4H timeframe. Every pullback is finding buyers at a higher level, while price continues to push towards previous highs.
As long as $FET maintains this HH/HL structure, I’ll remain bullish and look for continuation towards the next resistance. A break below the recent higher low would be the first sign of weakness.
$FET
$FET is maintaining a clear higher high and higher low structure, indicating bullish momentum on the 4H timeframe. Every pullback is finding buyers at a higher level, while price continues to push towards previous highs.
As long as $FET maintains this HH/HL structure, I’ll remain bullish and look for continuation towards the next resistance. A break below the recent higher low would be the first sign of weakness.
$FET
89
·
--
Bullish
Thoughts on #FIL:
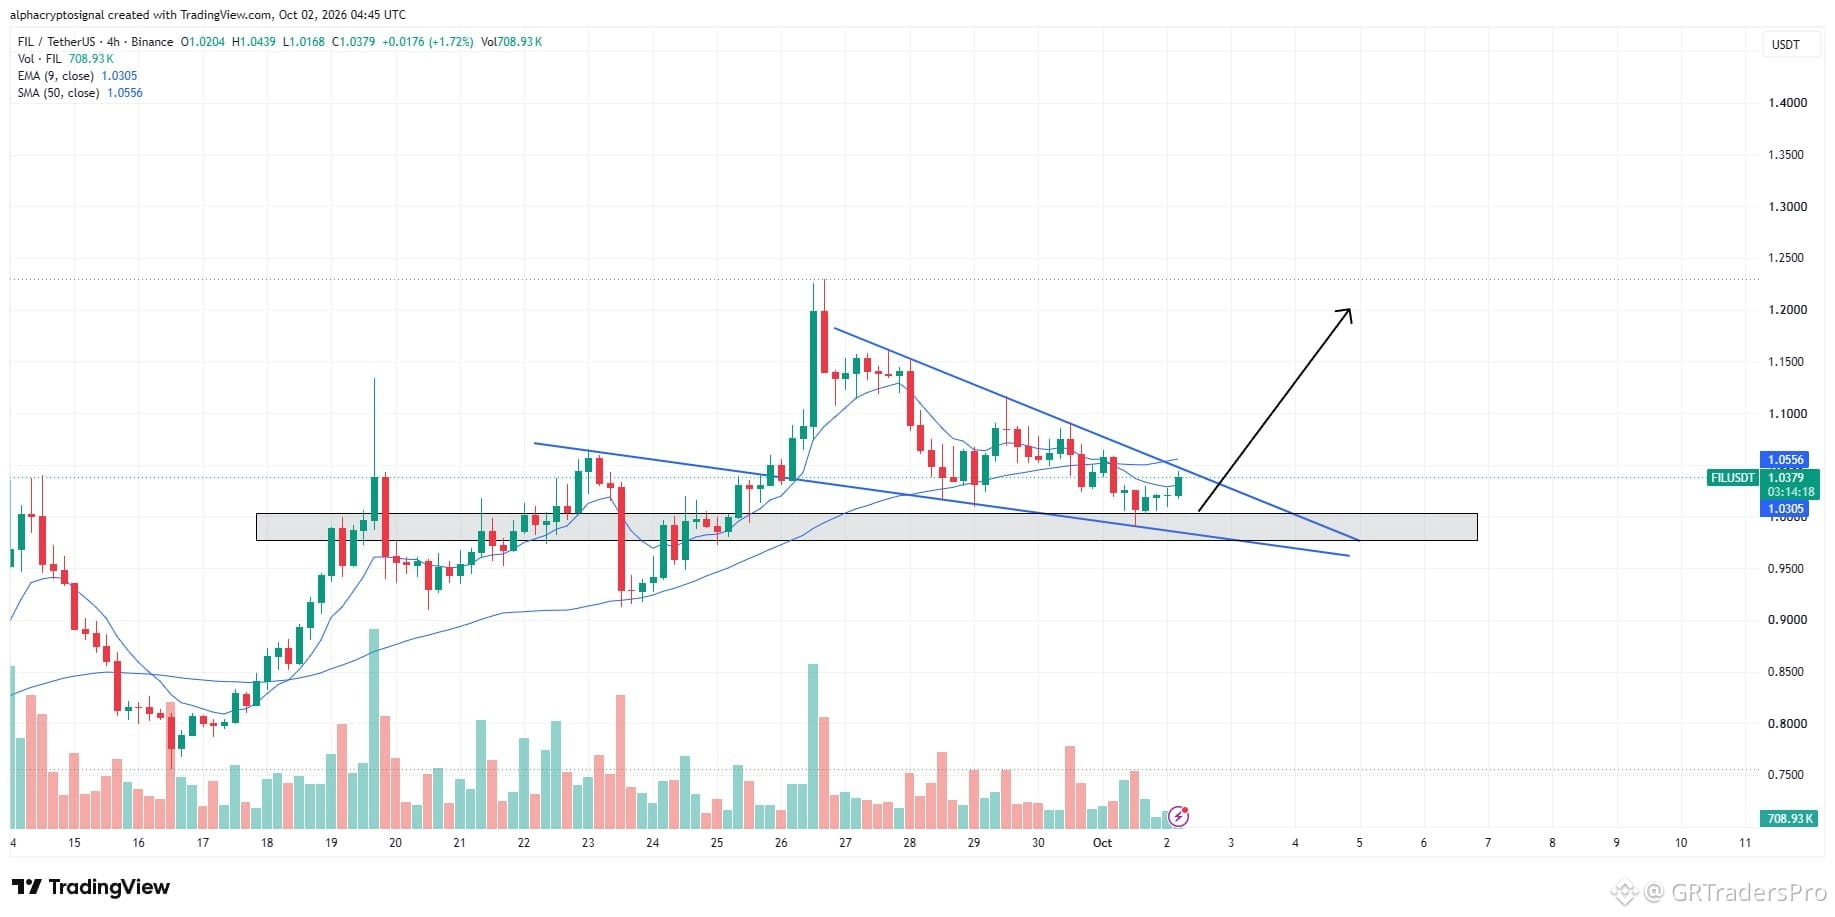
$FIL is looking bullish as it approaches a potential falling wedge breakout while continuing to hold above the horizontal support zone. $FIL is showing signs of recovery, and a clean breakout above the descending trendline could trigger the next move higher.
$FIL
{future}(FILUSDT)
Thoughts on #FIL:
$FIL is looking bullish as it approaches a potential falling wedge breakout while continuing to hold above the horizontal support zone. $FIL is showing signs of recovery, and a clean breakout above the descending trendline could trigger the next move higher.
$FIL
$FIL is looking bullish as it approaches a potential falling wedge breakout while continuing to hold above the horizontal support zone. $FIL is showing signs of recovery, and a clean breakout above the descending trendline could trigger the next move higher.
$FIL
93
·
--
Chart Request: #LIT
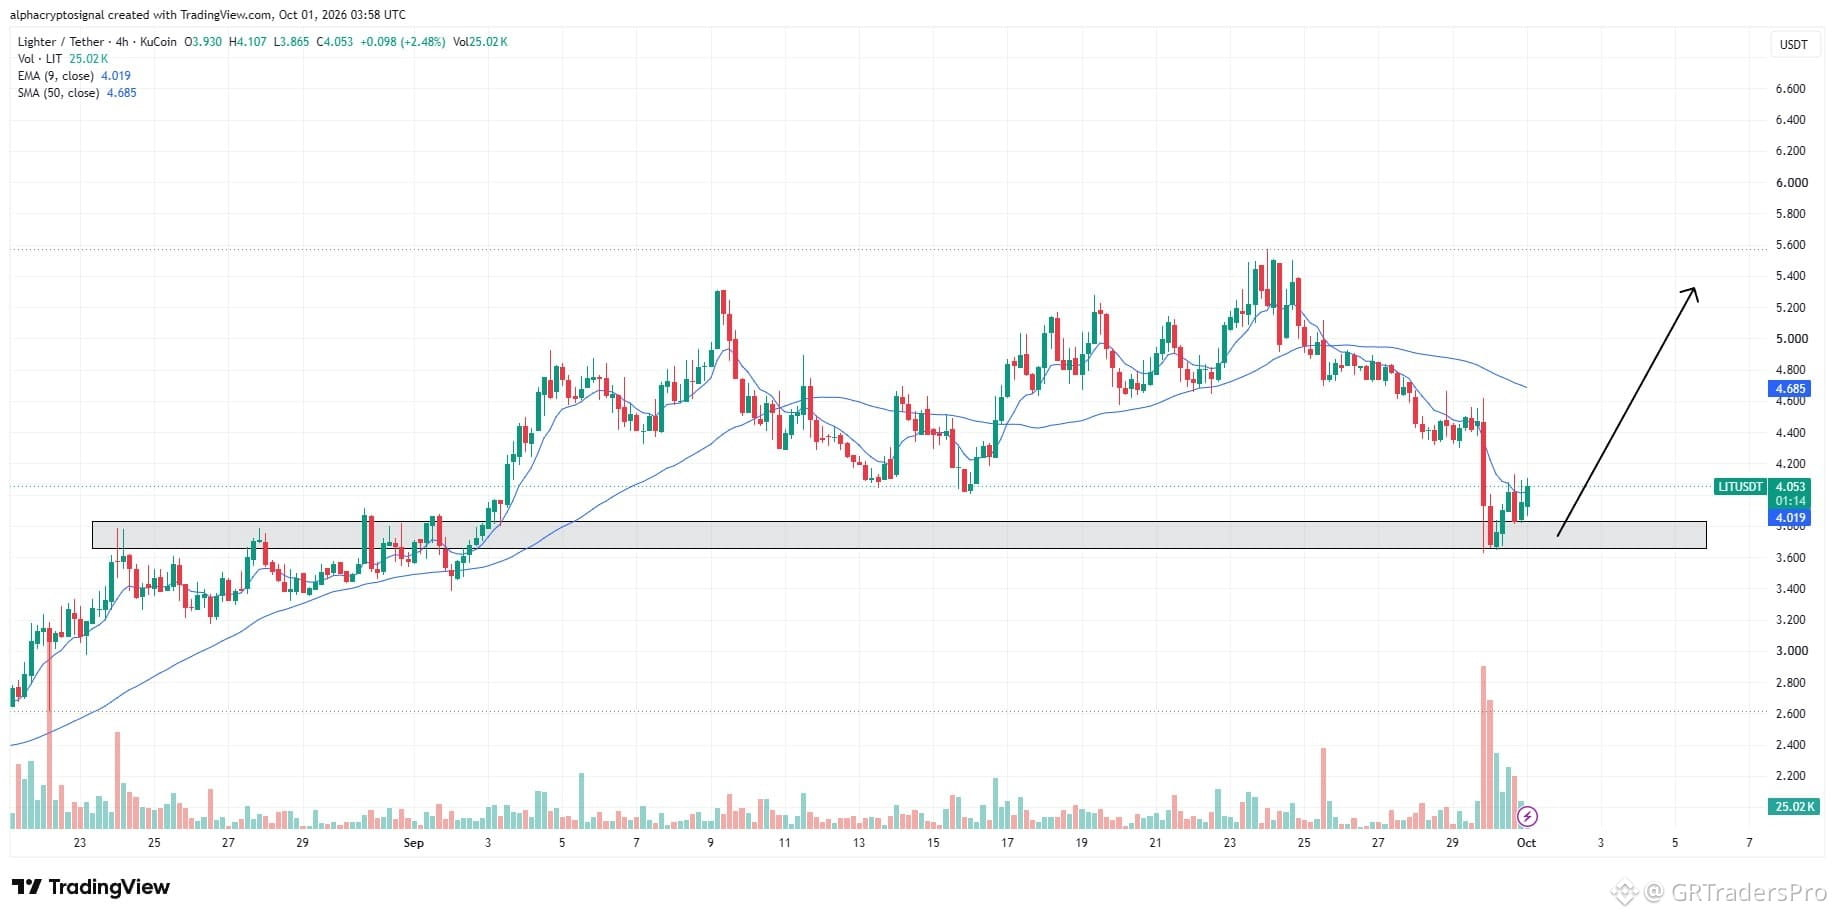
$LIT is showing a rebound from the lower horizontal support zone after the recent pullback. This area has acted as an important level before, so holding it could give the bulls a chance to regain momentum.
If $LIT continues to hold this zone and starts moving higher, I’ll be watching for a move toward the $5.3 area. A clean loss of the support would weaken this setup.
$LIT
{future}(LITUSDT)
Chart Request: #LIT
$LIT is showing a rebound from the lower horizontal support zone after the recent pullback. This area has acted as an important level before, so holding it could give the bulls a chance to regain momentum.
If $LIT continues to hold this zone and starts moving higher, I’ll be watching for a move toward the $5.3 area. A clean loss of the support would weaken this setup.
$LIT
$LIT is showing a rebound from the lower horizontal support zone after the recent pullback. This area has acted as an important level before, so holding it could give the bulls a chance to regain momentum.
If $LIT continues to hold this zone and starts moving higher, I’ll be watching for a move toward the $5.3 area. A clean loss of the support would weaken this setup.
$LIT
91
·
--
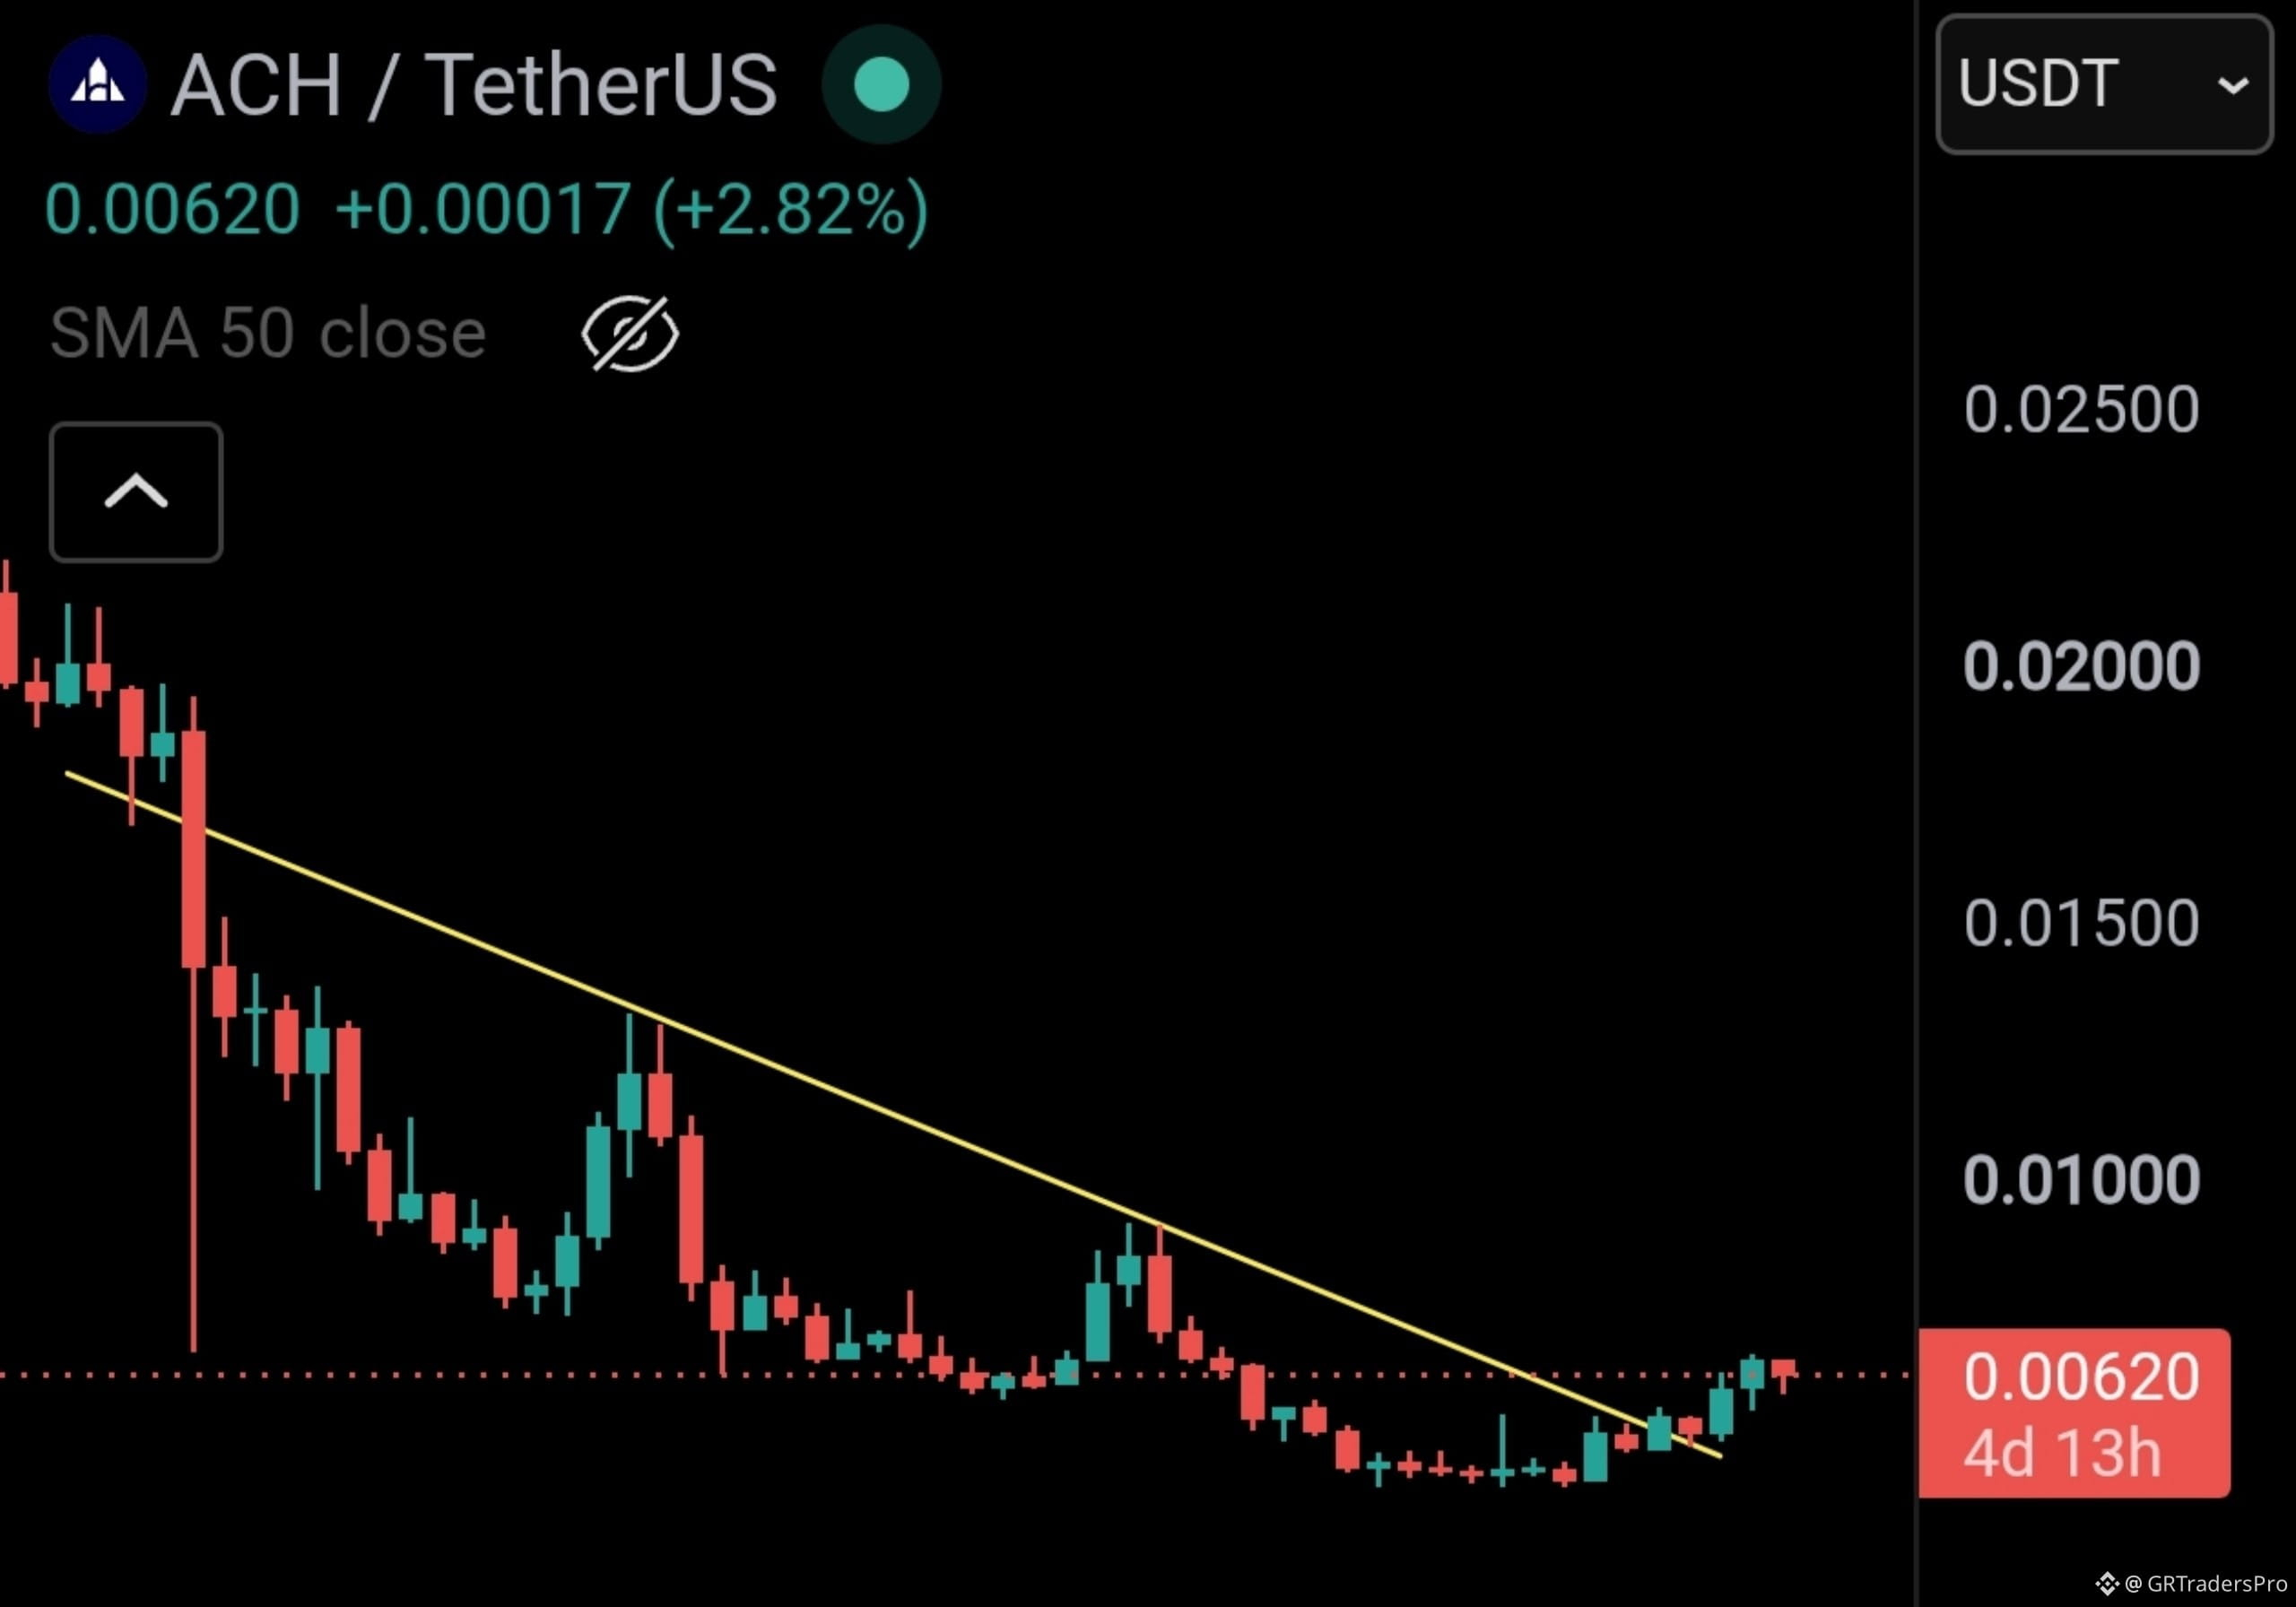
$ACH has broken above an important trendline resistance and is now holding above it. 👀
It’s still near its bottom, You can look for an entry around $0.0058 to $0.0062.
$ACH
{future}(ACHUSDT)
$ACH has broken above an important trendline resistance and is now holding above it. 👀
It’s still near its bottom, You can look for an entry around $0.0058 to $0.0062.
$ACH
It’s still near its bottom, You can look for an entry around $0.0058 to $0.0062.
$ACH
87
·
--
Chart Request: #ZEC
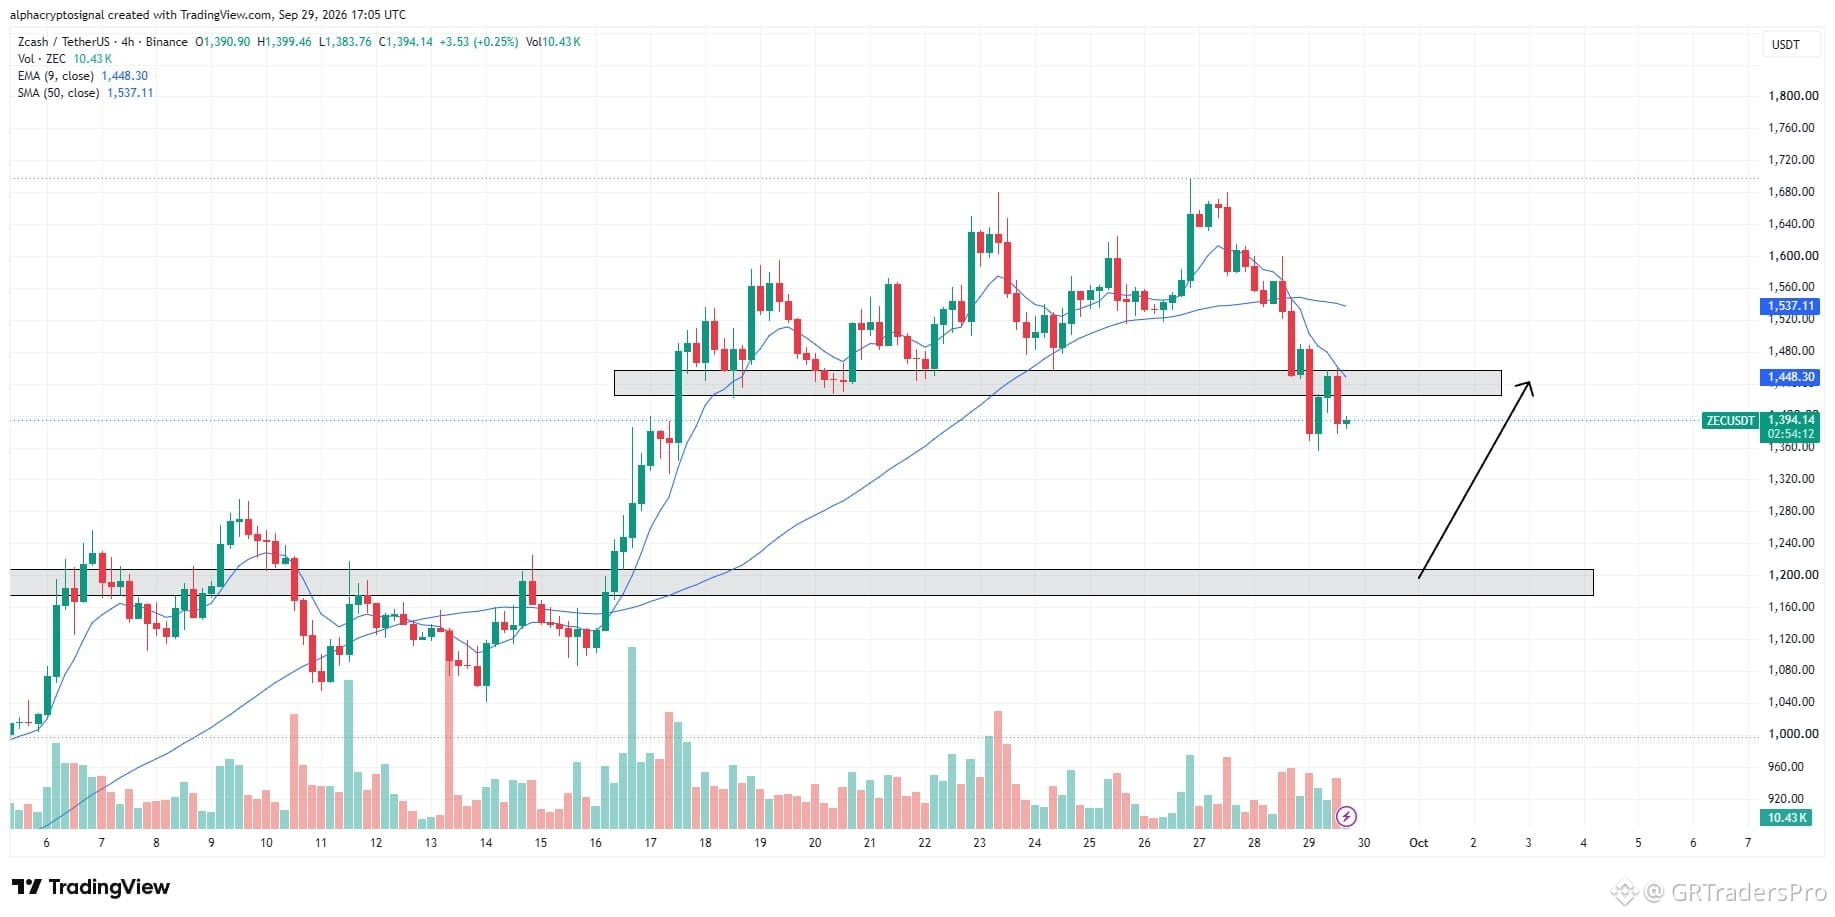
$ZEC is approaching a potential long interest zone after the recent pullback. The lower horizontal support around $1,170–$1,210 is the key area I’m watching for a reaction.
If $ZEC reaches this zone and shows bullish confirmation, I’ll be looking for a long setup. Until then, patience is key and I’d rather wait for price action to confirm the support.
$ZEC
{future}(ZECUSDT)
#ZECUSDT
Chart Request: #ZEC
$ZEC is approaching a potential long interest zone after the recent pullback. The lower horizontal support around $1,170–$1,210 is the key area I’m watching for a reaction.
If $ZEC reaches this zone and shows bullish confirmation, I’ll be looking for a long setup. Until then, patience is key and I’d rather wait for price action to confirm the support.
$ZEC
#ZECUSDT
$ZEC is approaching a potential long interest zone after the recent pullback. The lower horizontal support around $1,170–$1,210 is the key area I’m watching for a reaction.
If $ZEC reaches this zone and shows bullish confirmation, I’ll be looking for a long setup. Until then, patience is key and I’d rather wait for price action to confirm the support.
$ZEC
#ZECUSDT
94
·
--
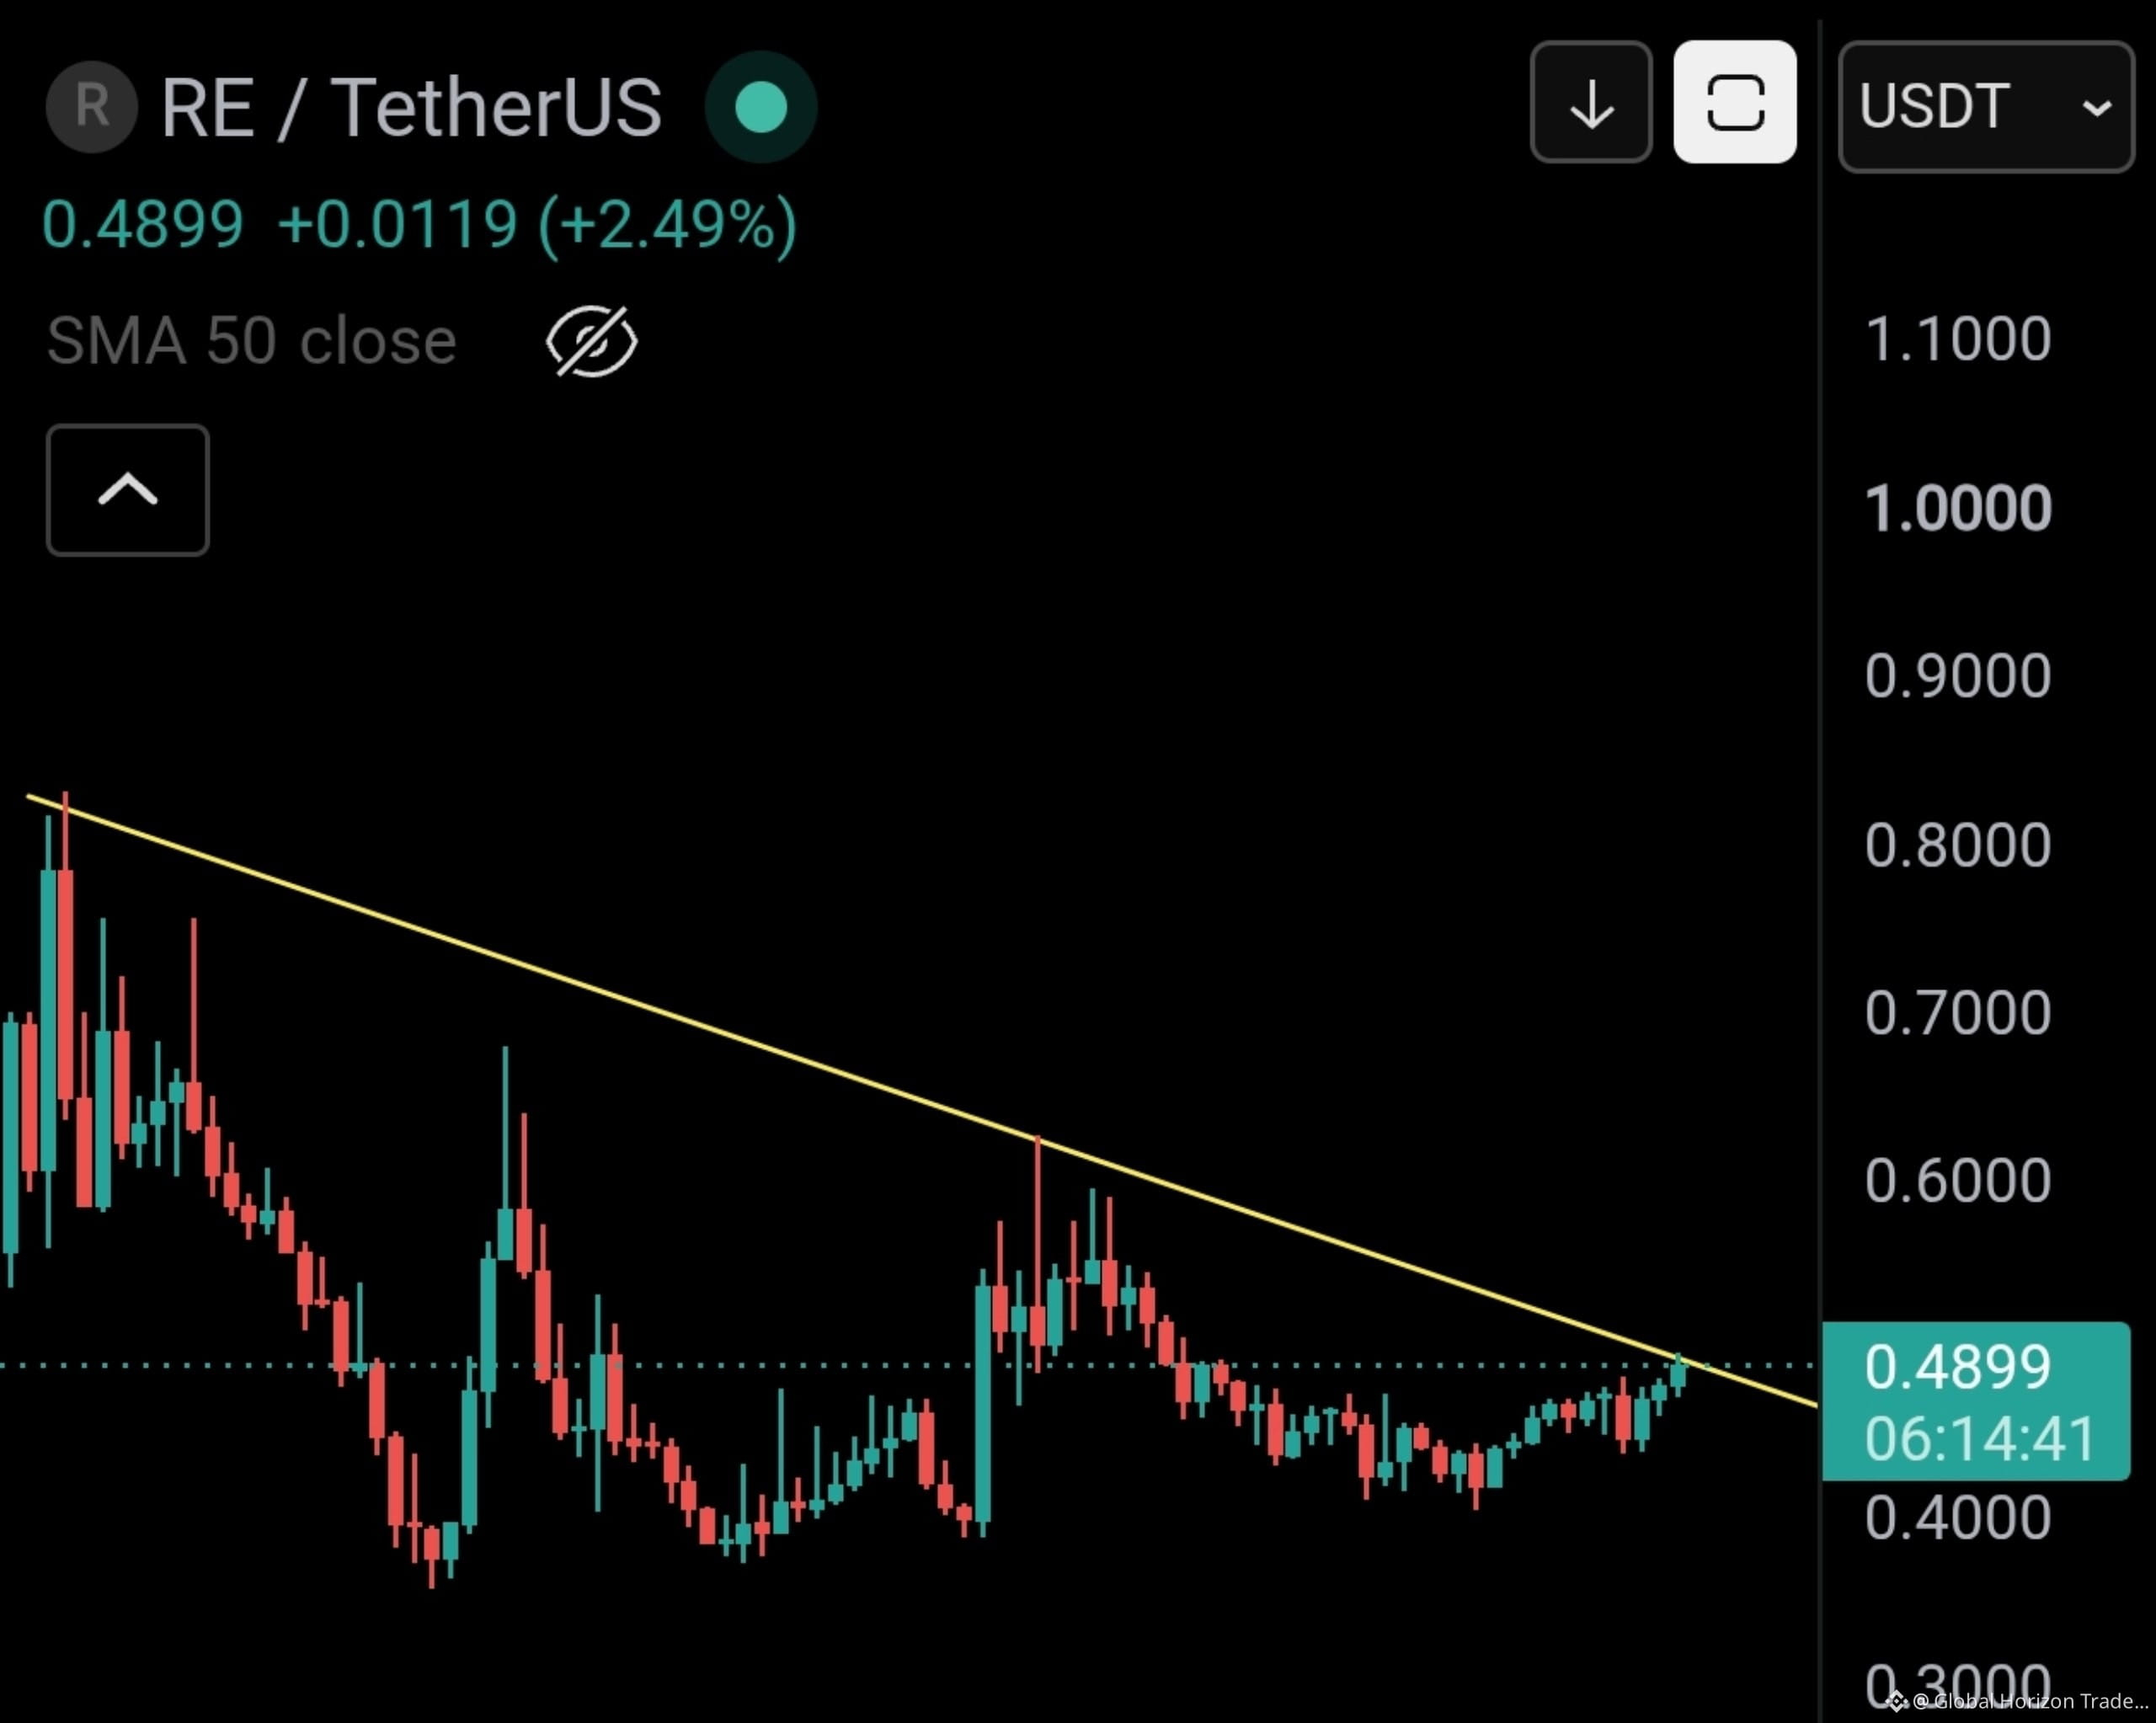
$RE about to breakout its important resistance Trendline.
You can take entry in between $0.4890 to $0.4700
50% to 100% profit expected in this coin 👍
$RE
{future}(REUSDT)
#reusdtupdate
$RE about to breakout its important resistance Trendline.
You can take entry in between $0.4890 to $0.4700
50% to 100% profit expected in this coin 👍
$RE
#reusdtupdate
You can take entry in between $0.4890 to $0.4700
50% to 100% profit expected in this coin 👍
$RE
#reusdtupdate
354
·
--
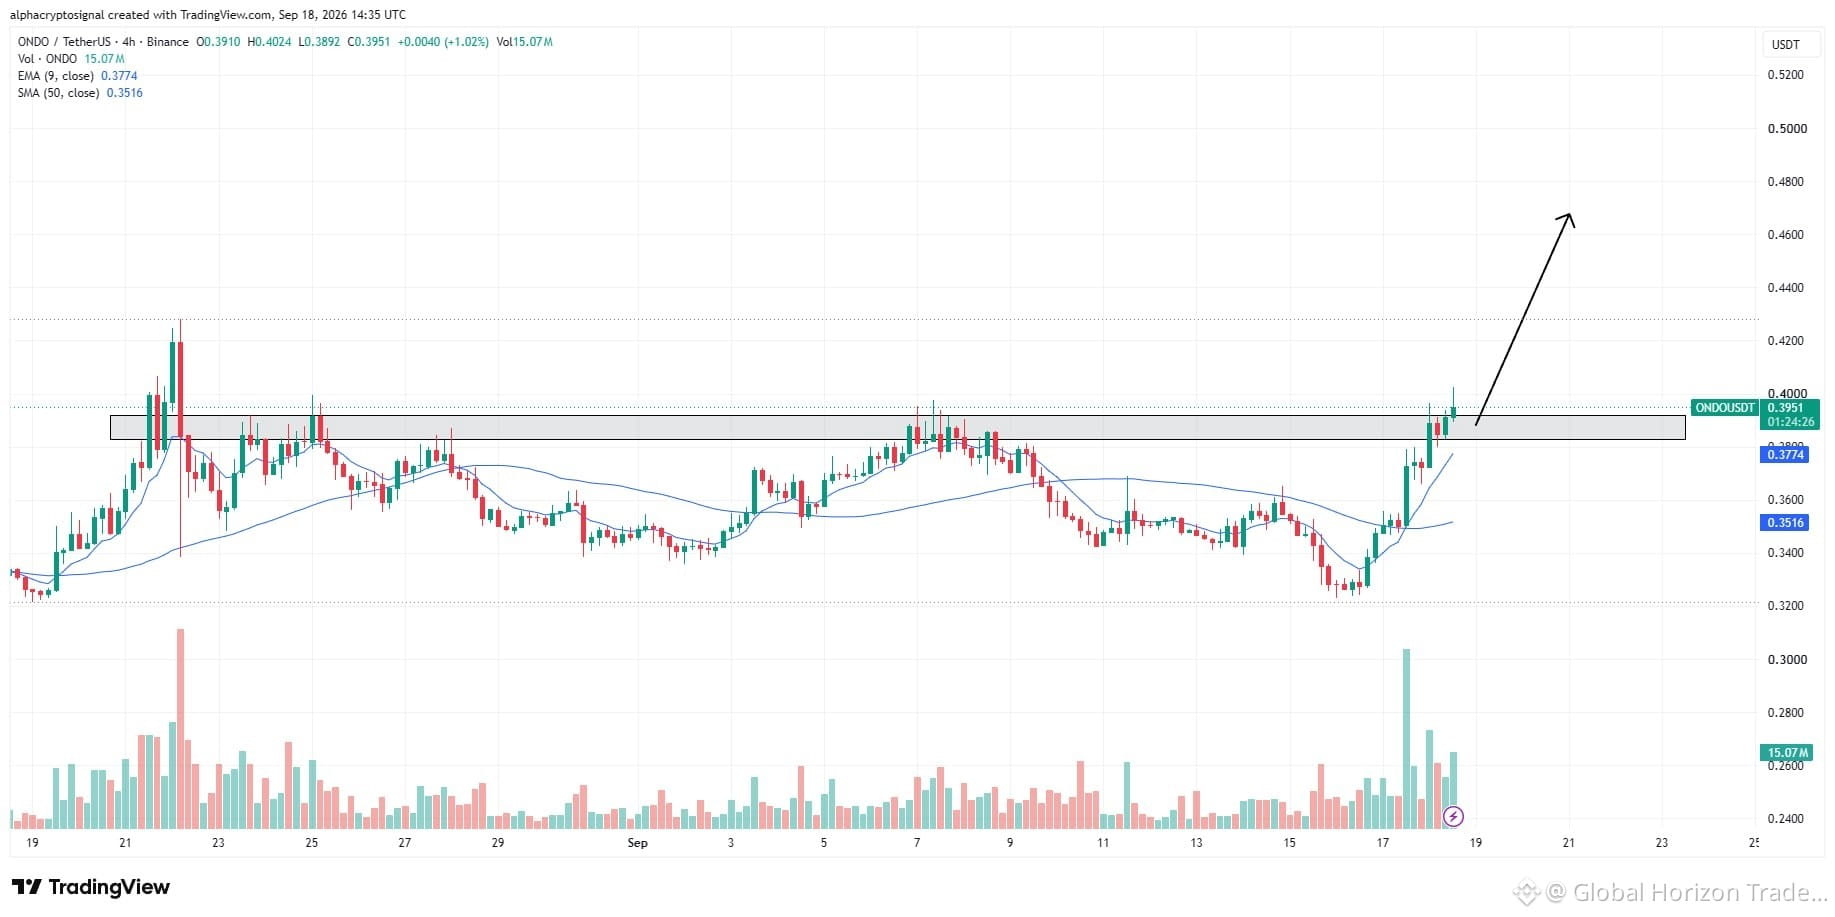
#ONDO LTF Analysis:
$ONDO looks beautiful after reclaiming this key horizontal level with strong momentum. As long as ONDO continues holding above the reclaimed zone, the structure remains bullish and we could see further upside.
A clean hold here would keep ONDO in a strong position for the next move higher. $ONDO is definitely one to keep on the radar.
{future}(ONDOUSDT)
#ONDO LTF Analysis:
$ONDO looks beautiful after reclaiming this key horizontal level with strong momentum. As long as ONDO continues holding above the reclaimed zone, the structure remains bullish and we could see further upside.
A clean hold here would keep ONDO in a strong position for the next move higher. $ONDO is definitely one to keep on the radar.
$ONDO looks beautiful after reclaiming this key horizontal level with strong momentum. As long as ONDO continues holding above the reclaimed zone, the structure remains bullish and we could see further upside.
A clean hold here would keep ONDO in a strong position for the next move higher. $ONDO is definitely one to keep on the radar.
81
·
--
Bullish
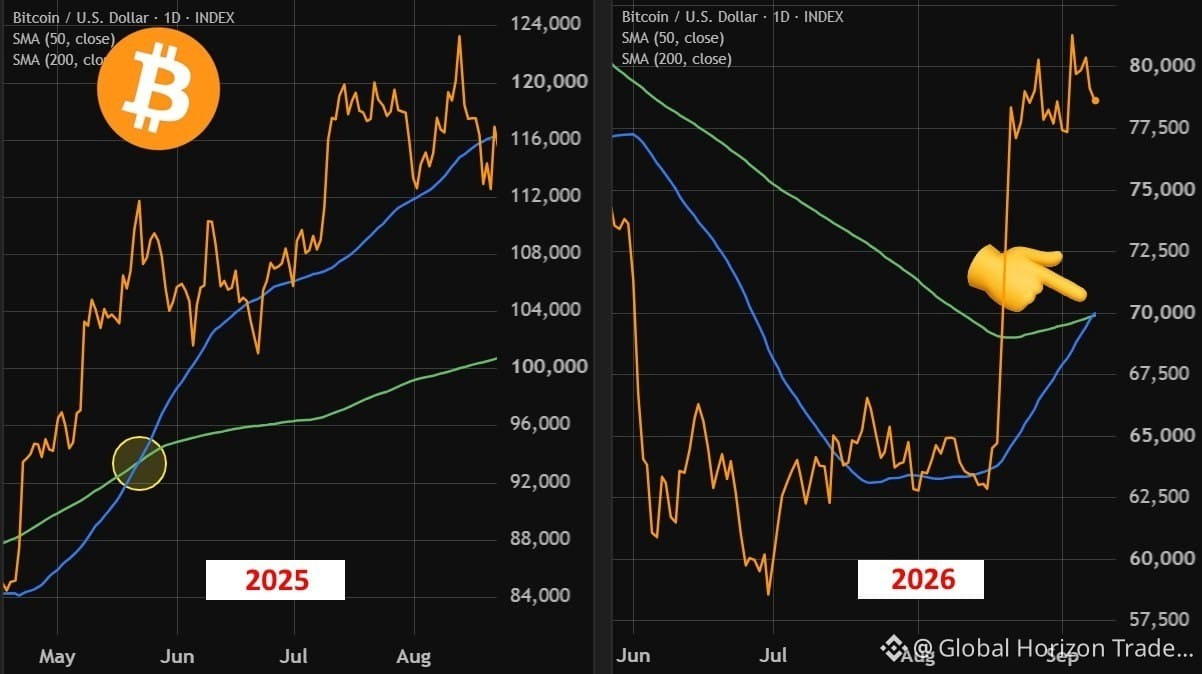
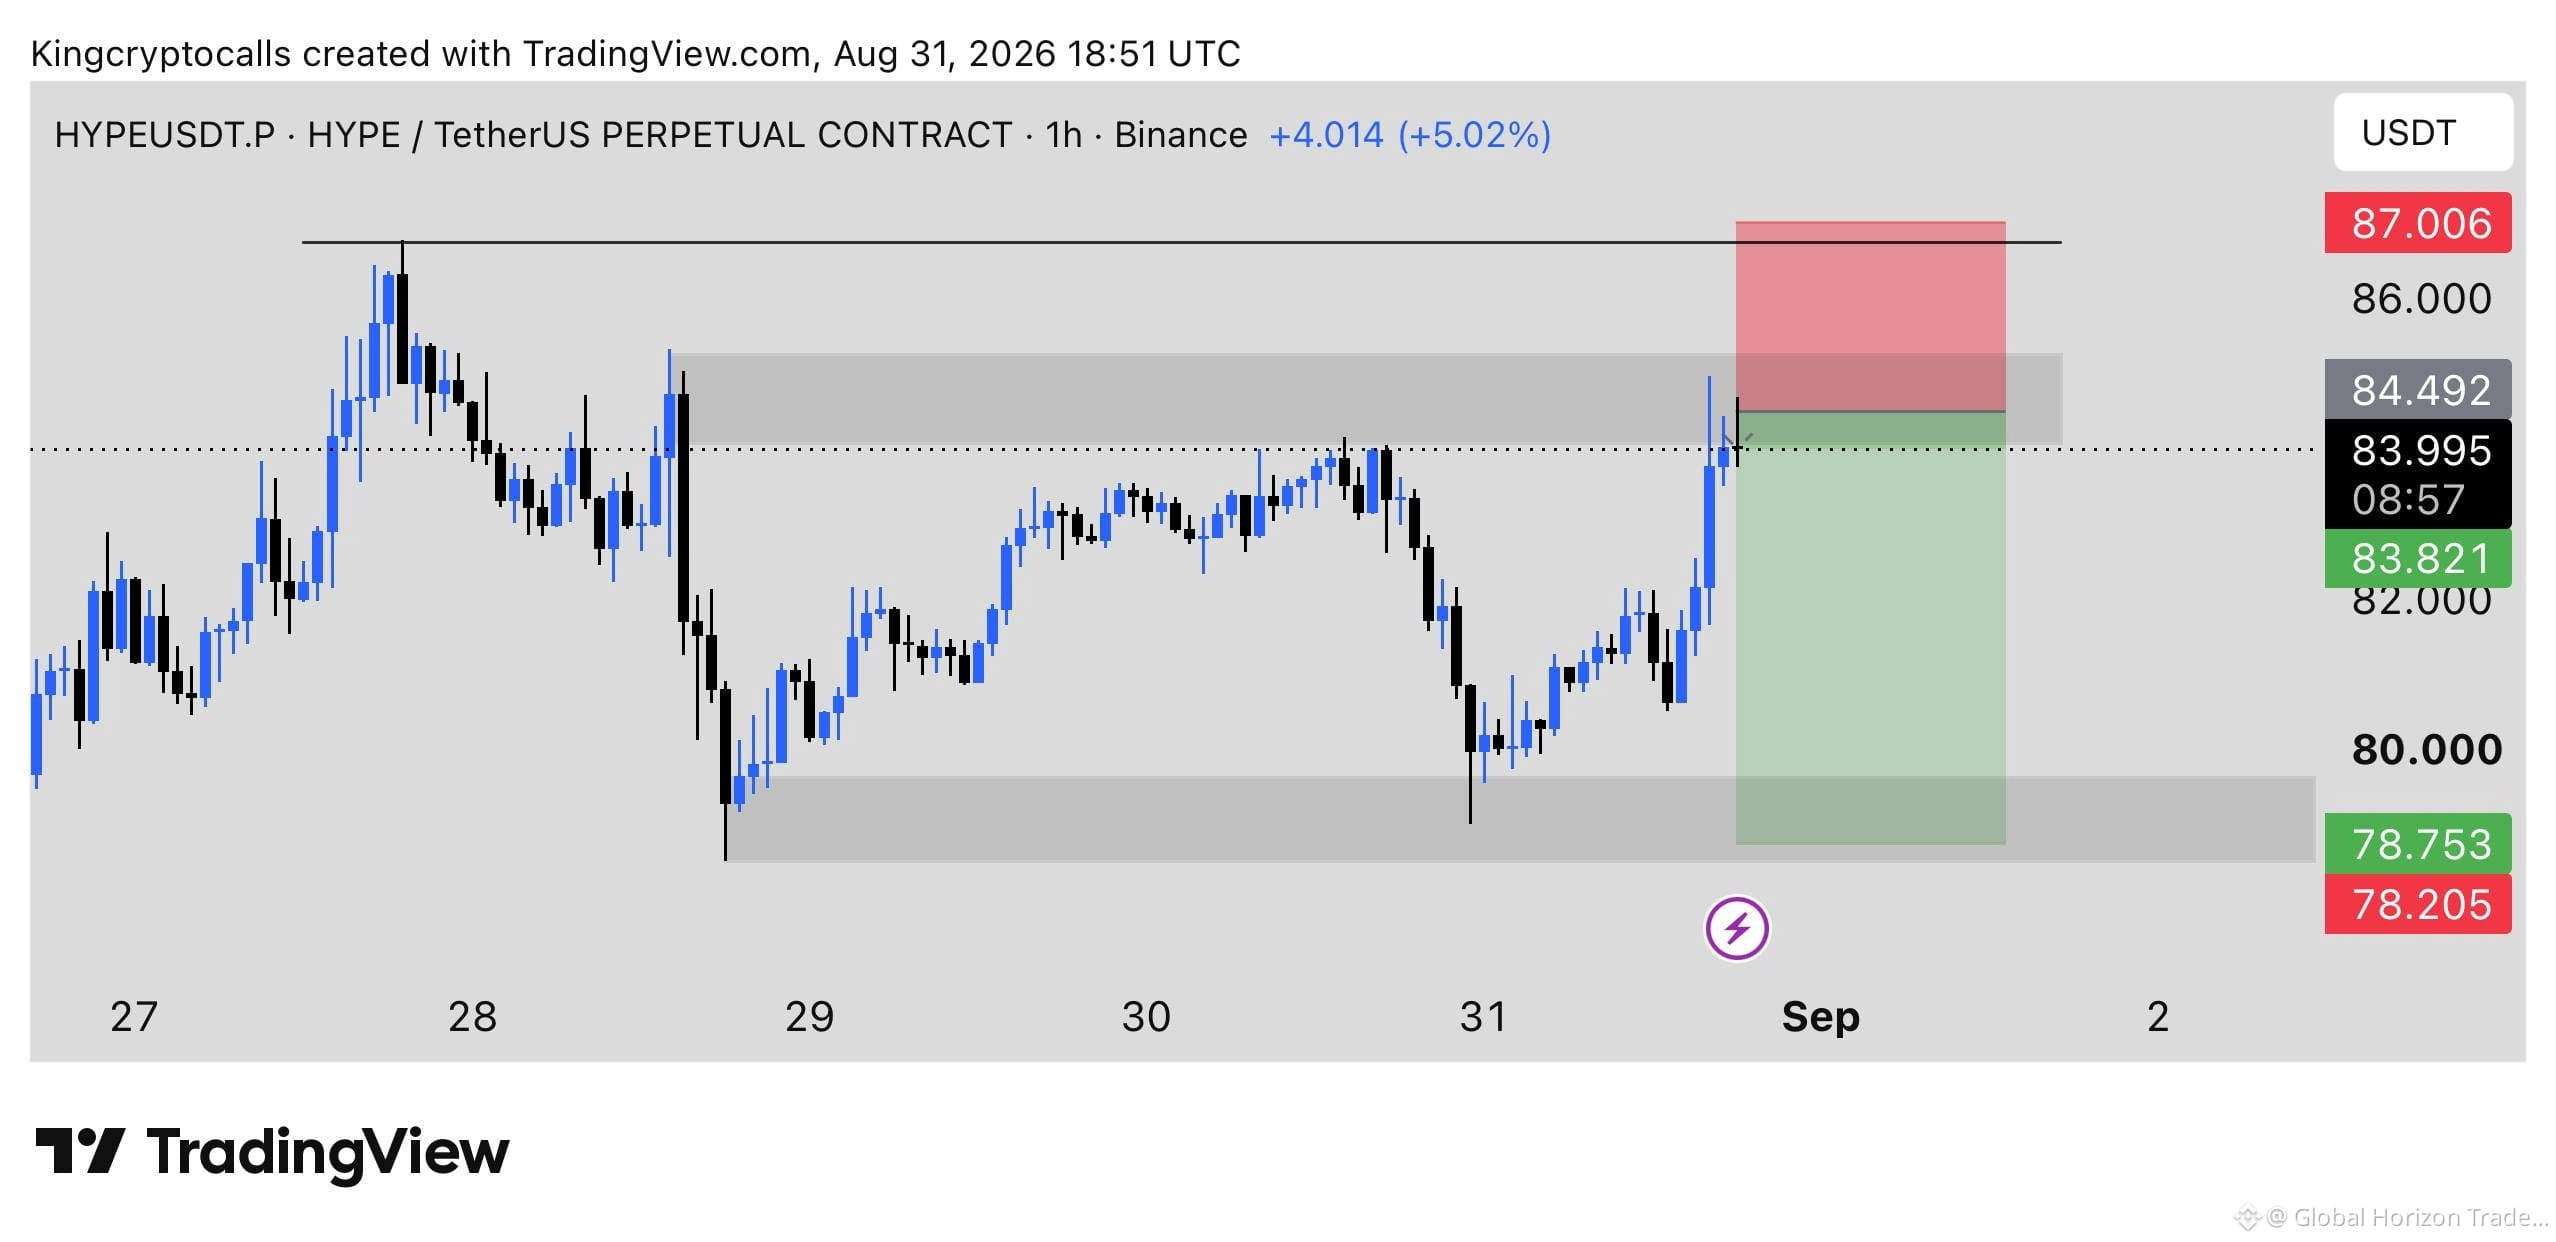
WILL HISTORY REPEATS ITSELF???😱😱
🚨 BITCOIN FLASHES BULLISH GOLDEN CROSS!
The previous setup in May 2025 led straight to the $126,200 all-time high.
History favors major continuation.
$BTC
{spot}(BTCUSDT)
#HISTORY #BTCHistory
WILL HISTORY REPEATS ITSELF???😱😱
🚨 BITCOIN FLASHES BULLISH GOLDEN CROSS!
The previous setup in May 2025 led straight to the $126,200 all-time high.
History favors major continuation.
$BTC
#HISTORY #BTCHistory
🚨 BITCOIN FLASHES BULLISH GOLDEN CROSS!
The previous setup in May 2025 led straight to the $126,200 all-time high.
History favors major continuation.
$BTC
#HISTORY #BTCHistory
81
·
--
Bearish
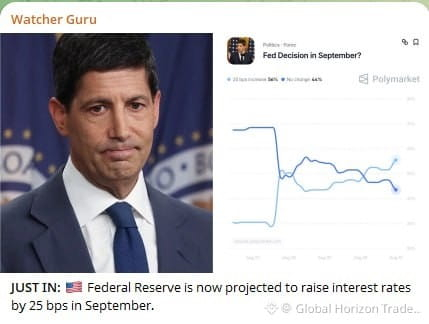
Wait what...???? 😲
Well things getting abnormal
$BTC
{spot}(BTCUSDT)
$ETH
{spot}(ETHUSDT)
Wait what...???? 😲
Well things getting abnormal
$BTC
$ETH
Well things getting abnormal
$BTC
$ETH
1
134
·
--
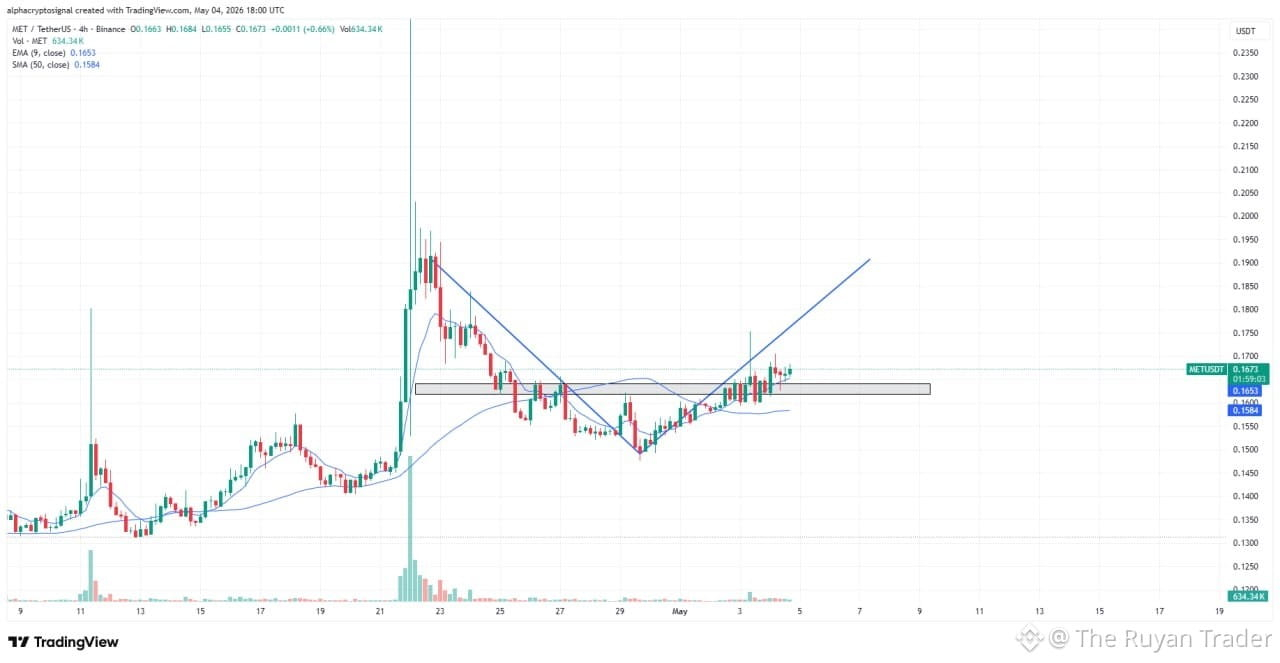
Thoughts on MET:
$MET is showing a clear V-shaped recovery, with strong momentum pushing $MET back above the neckline resistance. The sharp reversal indicates aggressive buying after the drop, signaling a potential trend shift.
{future}(METUSDT)
Holding above the neckline is key to confirm continuation, as it flips into support. As long as this level holds $MET, the bullish structure remains intact with room for further upside.
#MET
Thoughts on MET:
$MET is showing a clear V-shaped recovery, with strong momentum pushing $MET back above the neckline resistance. The sharp reversal indicates aggressive buying after the drop, signaling a potential trend shift.
Holding above the neckline is key to confirm continuation, as it flips into support. As long as this level holds $MET , the bullish structure remains intact with room for further upside.
#MET
$MET is showing a clear V-shaped recovery, with strong momentum pushing $MET back above the neckline resistance. The sharp reversal indicates aggressive buying after the drop, signaling a potential trend shift.
Holding above the neckline is key to confirm continuation, as it flips into support. As long as this level holds $MET , the bullish structure remains intact with room for further upside.
#MET
100
·
--
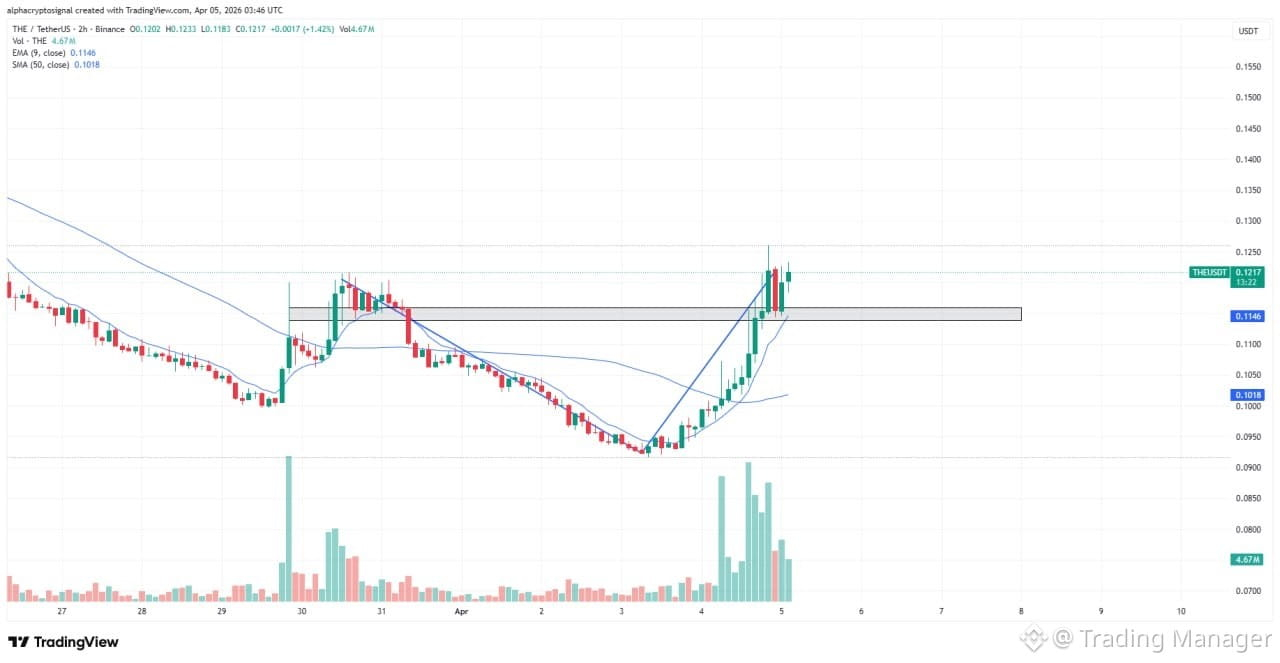
Chart Request: #THE
$THE has completed a clean V-shaped recovery, showing strong momentum from the recent lows. $THE has reclaimed the key horizontal level, which now acts as support and confirms the strength of the reversal.
{future}(THEUSDT)
As long as this level holds $THE, the bias remains bullish with potential for continuation to the upside. Losing this zone would weaken the structure, but for now, holding above it keeps buyers in control.
Chart Request: #THE
$THE has completed a clean V-shaped recovery, showing strong momentum from the recent lows. $THE has reclaimed the key horizontal level, which now acts as support and confirms the strength of the reversal.
As long as this level holds $THE , the bias remains bullish with potential for continuation to the upside. Losing this zone would weaken the structure, but for now, holding above it keeps buyers in control.
$THE has completed a clean V-shaped recovery, showing strong momentum from the recent lows. $THE has reclaimed the key horizontal level, which now acts as support and confirms the strength of the reversal.
As long as this level holds $THE , the bias remains bullish with potential for continuation to the upside. Losing this zone would weaken the structure, but for now, holding above it keeps buyers in control.
42
Log in to explore more content
Join global crypto users on Binance Square
⚡️ Get latest and useful information about crypto.
💬 Trusted by the world’s largest crypto exchange.
👍 Discover real insights from verified creators.
Email / Phone number
Trending Topics
CryptoSelloffTriggersMultipleWhaleLiquidations
151,883 views
1,634 Discussing
Crypto Liquidations Top $2B in 24 Hours as 329,000 Traders Are Wiped Out
Binance News
·39 Likes
·48.3k views
USSpotXRPETFsSeeLargestWeeklyOutflowIn8Months
140,908 views
1,477 Discussing
WillFOMCMinutesReinforceRateHikeExpectations?
39,145 views
682 Discussing