
gladguy
20 Posts

gladguy
33 Following
94 Followers
33 Liked
Posts
All
Quotes
more it will go down??

Silentkiller3
·
--
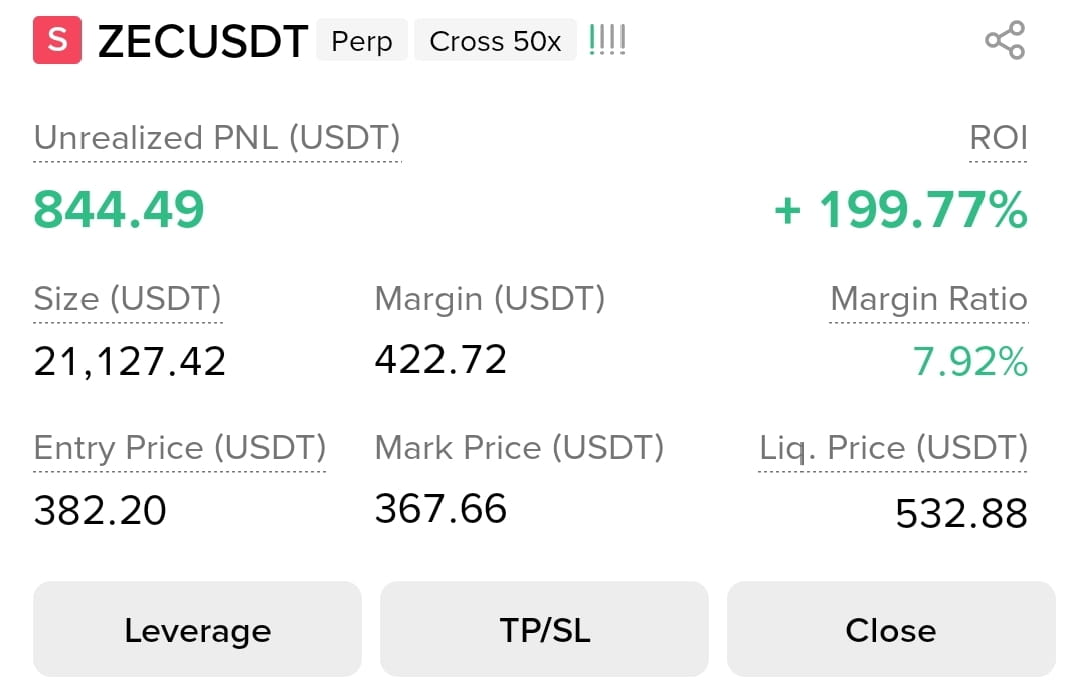
I love $ZEC , Send it to $0
Short $ZEC now
#zec
Short $ZEC now
#zec
$100

Bit King Np
·
--
Buy icp it will be 1000$ soon
which coin

BEST TRADER IN INDIA
·
--
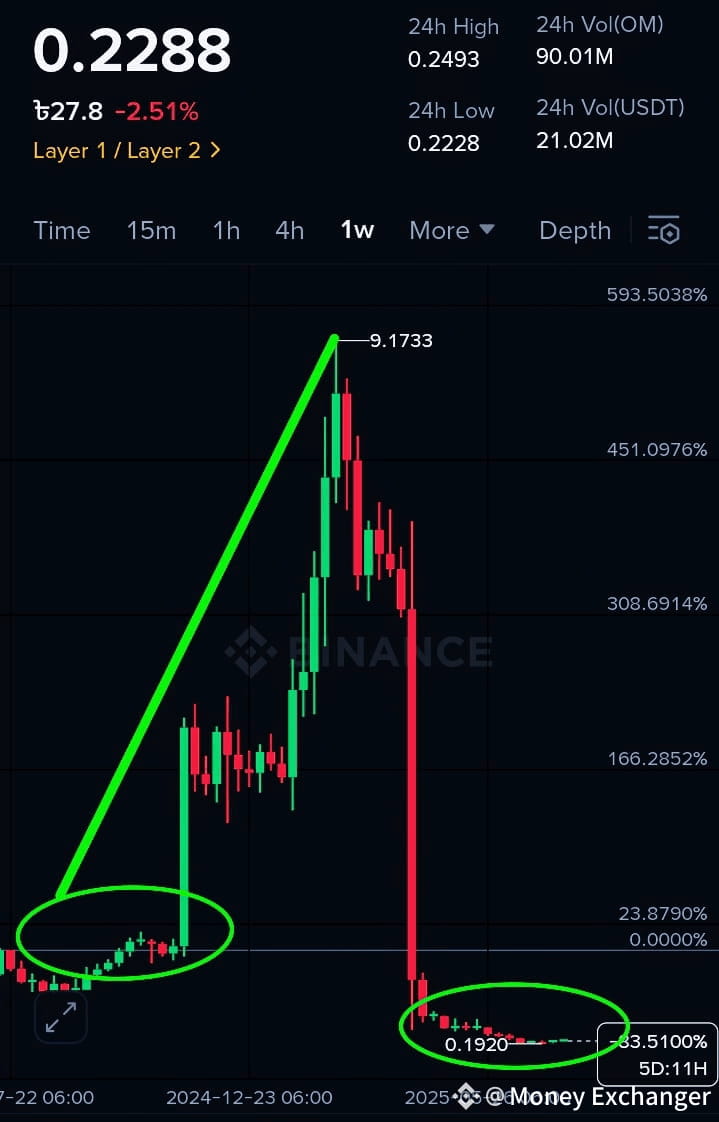
just one coin change your life 🧬🧬
$XRP change your life ♥️♥️♥️♥️
#BinanceTurn8
$XRP change your life ♥️♥️♥️♥️
#BinanceTurn8
link

Clara_LewiSs
·
--
BullishMelania Trump recently launched her meme Coin melania. which rapidly achieved a market capitalization of aproximately 6 billion$ within 2 hours of its release.
#MelaniaTrumpLaunchesToken
$MEME
#MelaniaTrumpLaunchesToken
$MEME

Sport or Futures?

Assi trader
·
--
$SUI hold or close experts please guide me buying at $3.663 Please guide me please
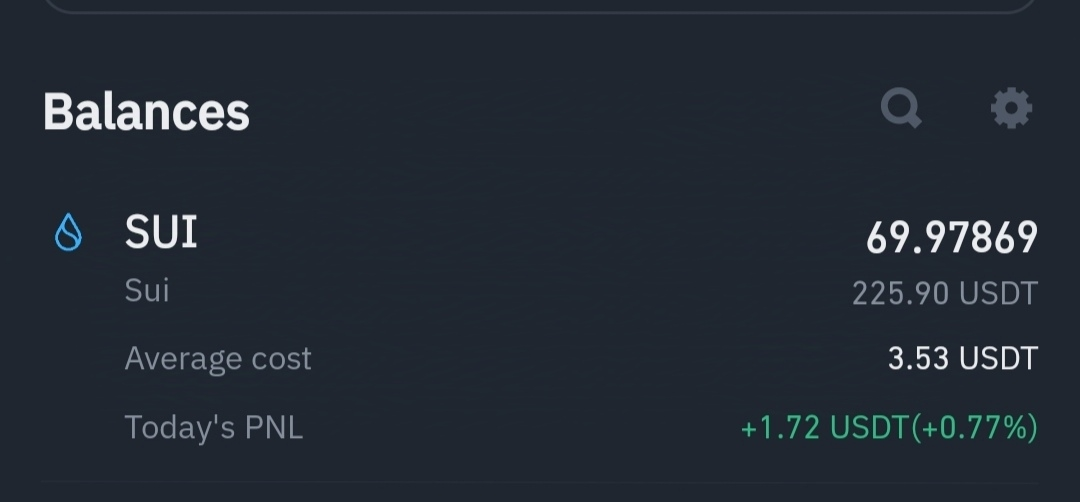
Sport or Futures bro


Decilizer
·
--
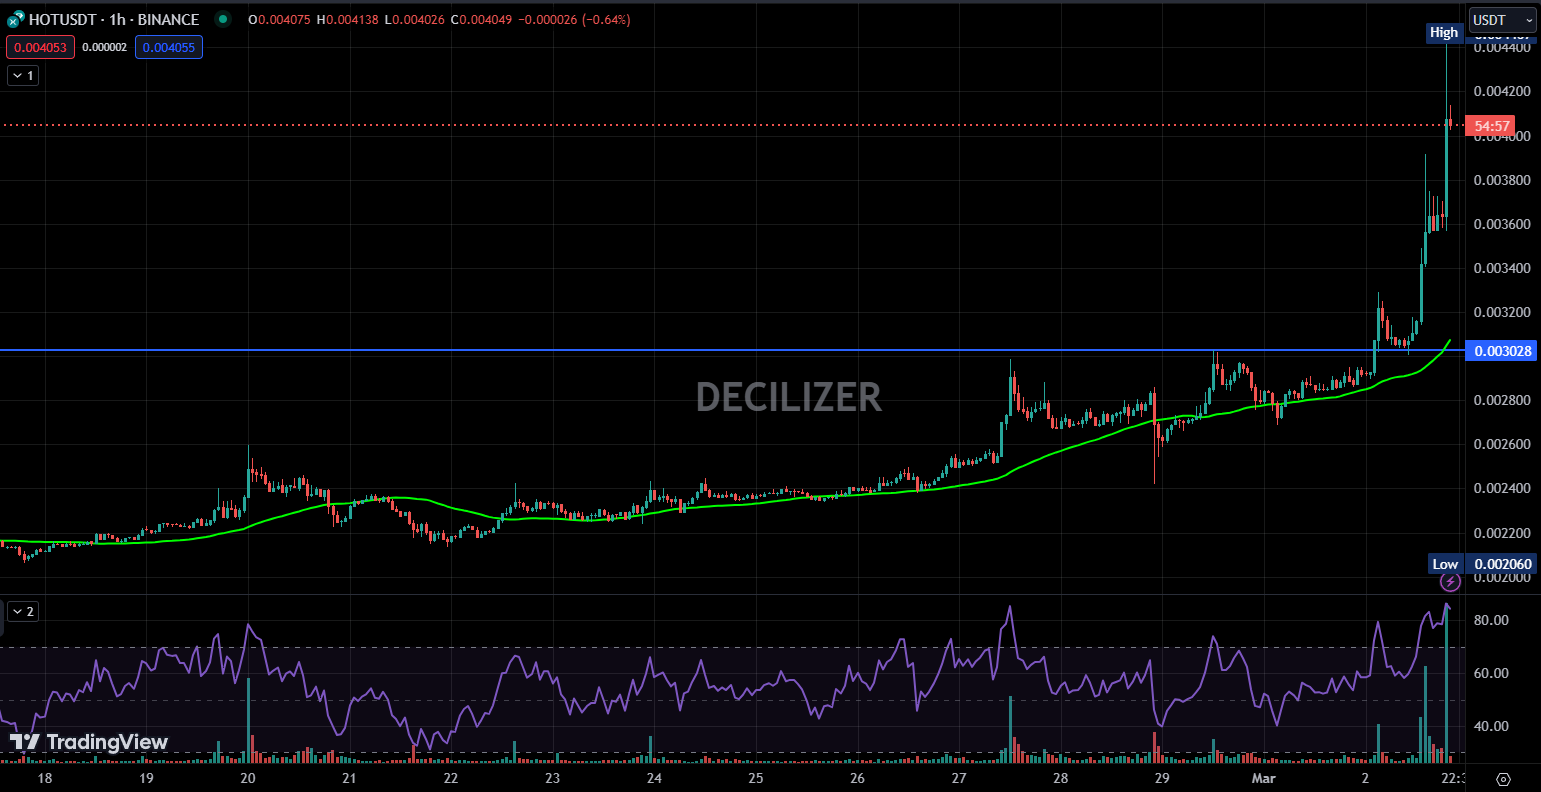
Bullish$HOT is breaking barriers, surpassing resistance at $0.0013 and targeting $0.0037. Volume spikes and $DYDX involvement are propelling this uptrend. Monitoring $BTC dominance is essential—it often leads market shifts and provides valuable insights for timing $HOT’s price moves.
Our data indicates 410% gains in the last rally.
Our data indicates 410% gains in the last rally.
When to Exit Altcoins? Here's the Blueprint:
📉 Exit Signal #1: Bitcoin Dominance (BTC.D) at 40%
Historically, Bitcoin dominance (BTC.D) hits around 40% when altcoins are at their peak euphoria.
Key Moments:
🔹 2017 Bull Run: BTC.D bottomed at 40% in Q4 2017
🔹 2021 Bull Run: BTC.D bottomed at 40% in Q4 2021
🗓️ Exit Signal #2: Q4 of 2025
Following previous cycles, Q4 2025 (especially October 2025) is likely the exit window.
📈 Each major altcoin season has lined up with BTC.D hitting 40% during Q4—don't miss the signal this time around.
🔮 Looking Ahead: What to Expect in 2025
If history repeats: Altcoins could peak when BTC.D hits 40% again in Q4 2025.
Timing is everything: staying patient until BTC.D nears 40% could mean maximizing gains.
✨ Takeaway:
✅ Plan ahead and be prepared to exit around BTC.D = 40% and Q4 2025.
✅ Watch for parabolic altcoin moves as BTC.D approaches 40%, signaling potential all-time highs.
Stay vigilant, stay strategic, and ride the wave to its peak 🌊✨
📉 Exit Signal #1: Bitcoin Dominance (BTC.D) at 40%
Historically, Bitcoin dominance (BTC.D) hits around 40% when altcoins are at their peak euphoria.
Key Moments:
🔹 2017 Bull Run: BTC.D bottomed at 40% in Q4 2017
🔹 2021 Bull Run: BTC.D bottomed at 40% in Q4 2021
🗓️ Exit Signal #2: Q4 of 2025
Following previous cycles, Q4 2025 (especially October 2025) is likely the exit window.
📈 Each major altcoin season has lined up with BTC.D hitting 40% during Q4—don't miss the signal this time around.
🔮 Looking Ahead: What to Expect in 2025
If history repeats: Altcoins could peak when BTC.D hits 40% again in Q4 2025.
Timing is everything: staying patient until BTC.D nears 40% could mean maximizing gains.
✨ Takeaway:
✅ Plan ahead and be prepared to exit around BTC.D = 40% and Q4 2025.
✅ Watch for parabolic altcoin moves as BTC.D approaches 40%, signaling potential all-time highs.
Stay vigilant, stay strategic, and ride the wave to its peak 🌊✨



$COW is currently trading at 0.4638,
A bounce back expected with the following targets:
Target 1: 0.48
Target 2: 0.50
Target 3: 0.55
A bounce back expected with the following targets:
Target 1: 0.48
Target 2: 0.50
Target 3: 0.55
Current Price: Sui is trading around $2.054 as of October 20, 2024.
Support Level: Immediate support is at $2.01, which is key for sustaining bullish momentum.
Resistance Level: SUI faces resistance at $2.18, with a breakout potentially leading to further gains.
Bullish Sentiment: Investor sentiment is largely positive, with a majority of traders taking long positions.
Volatility Warning: While technical indicators suggest growth, crypto markets are volatile, and external factors can impact price movements.
Not a Financial Advice😀
Support Level: Immediate support is at $2.01, which is key for sustaining bullish momentum.
Resistance Level: SUI faces resistance at $2.18, with a breakout potentially leading to further gains.
Bullish Sentiment: Investor sentiment is largely positive, with a majority of traders taking long positions.
Volatility Warning: While technical indicators suggest growth, crypto markets are volatile, and external factors can impact price movements.
Not a Financial Advice😀
Log in to explore more content