

技术流谬皮
352 Posts

技术流谬皮
Report
Block User
专注量价行为与微观盘面博弈
每日巨鲸/做市商异动与链上流动性监控
清算热力图 & 衍生品数据解读
头部 KOL 观点数据化复盘与信号打假、客观胜率归纳与留白周报,聚合分析
严选 Alpha 资讯与实时异动预警
内部实时预警,请咨询

USD1 Holder
High-Frequency Trader
1.3 Years
61 Following
105 Followers
34 Liked
Posts
All
Quotes
Videos
·
--
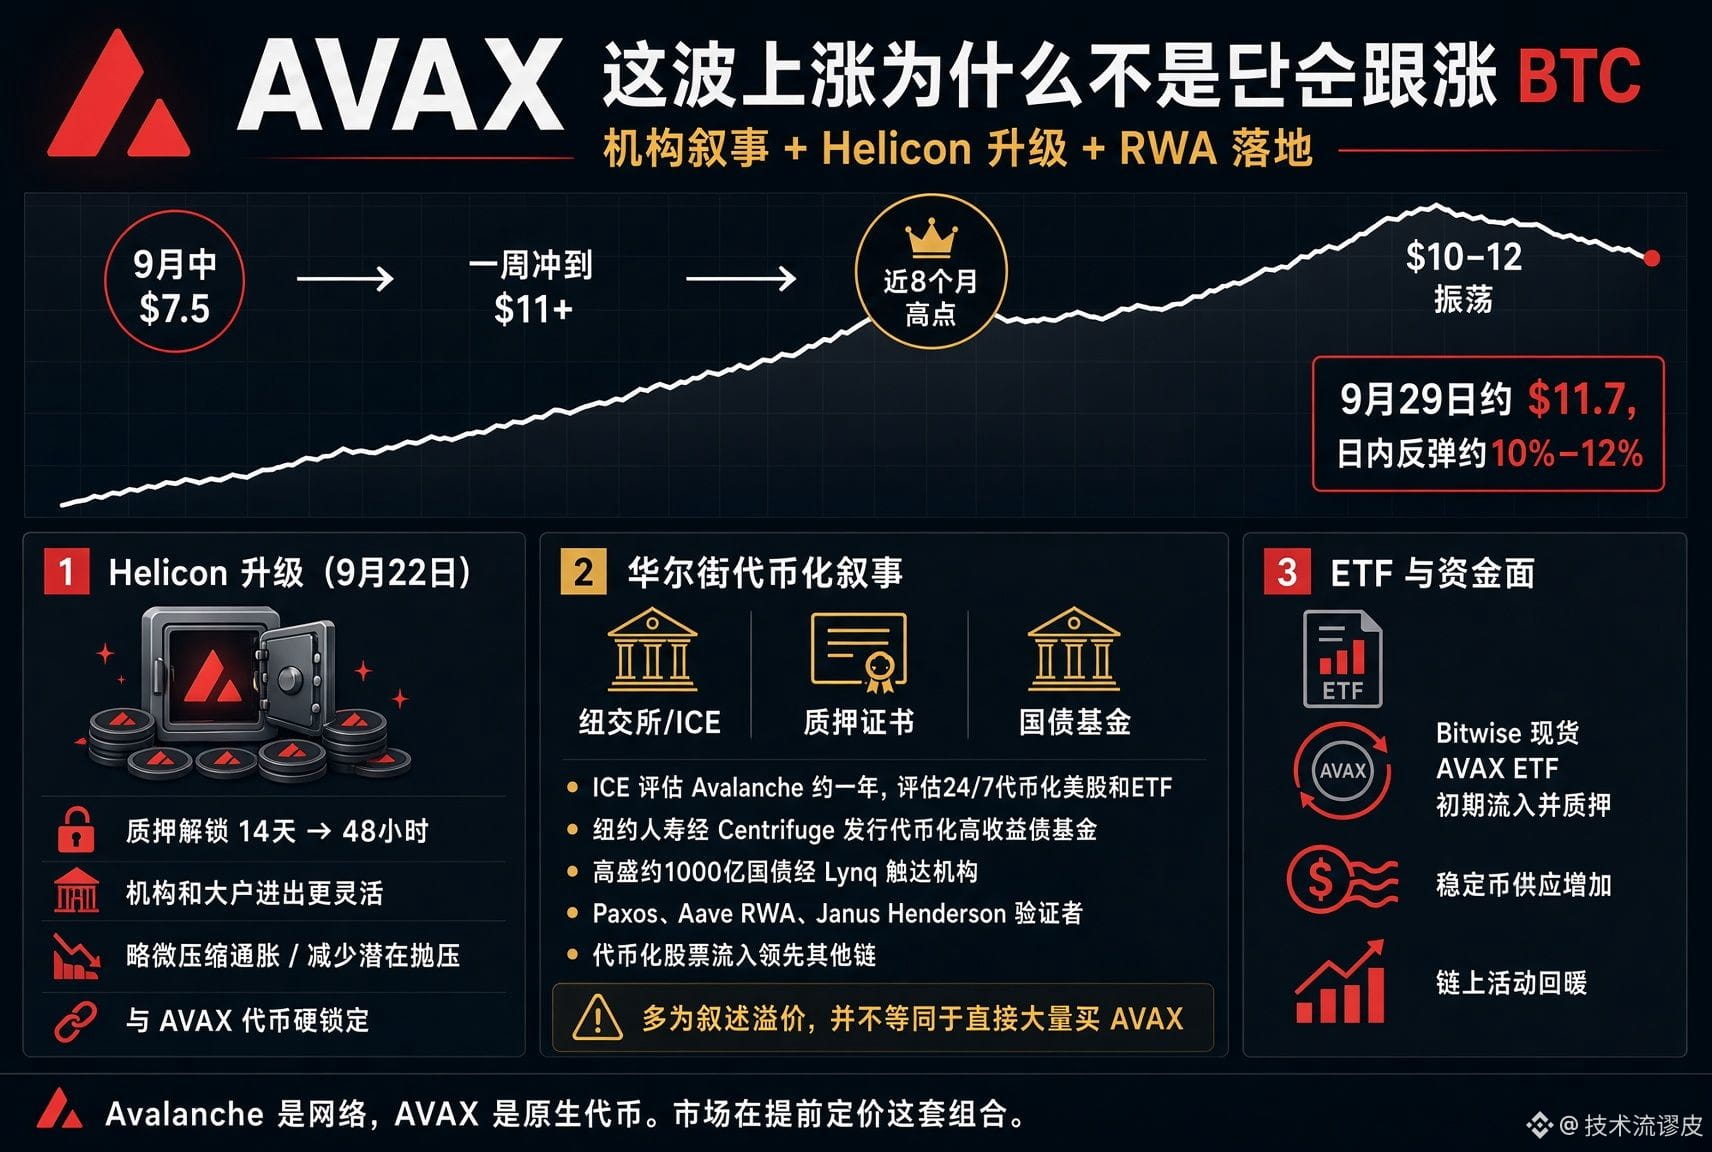
This AVAX rally isn’t just following BTC—it’s driven by an institutional narrative that combines network upgrades plus real-world asset (RWA) adoption, with the market pricing it in early.
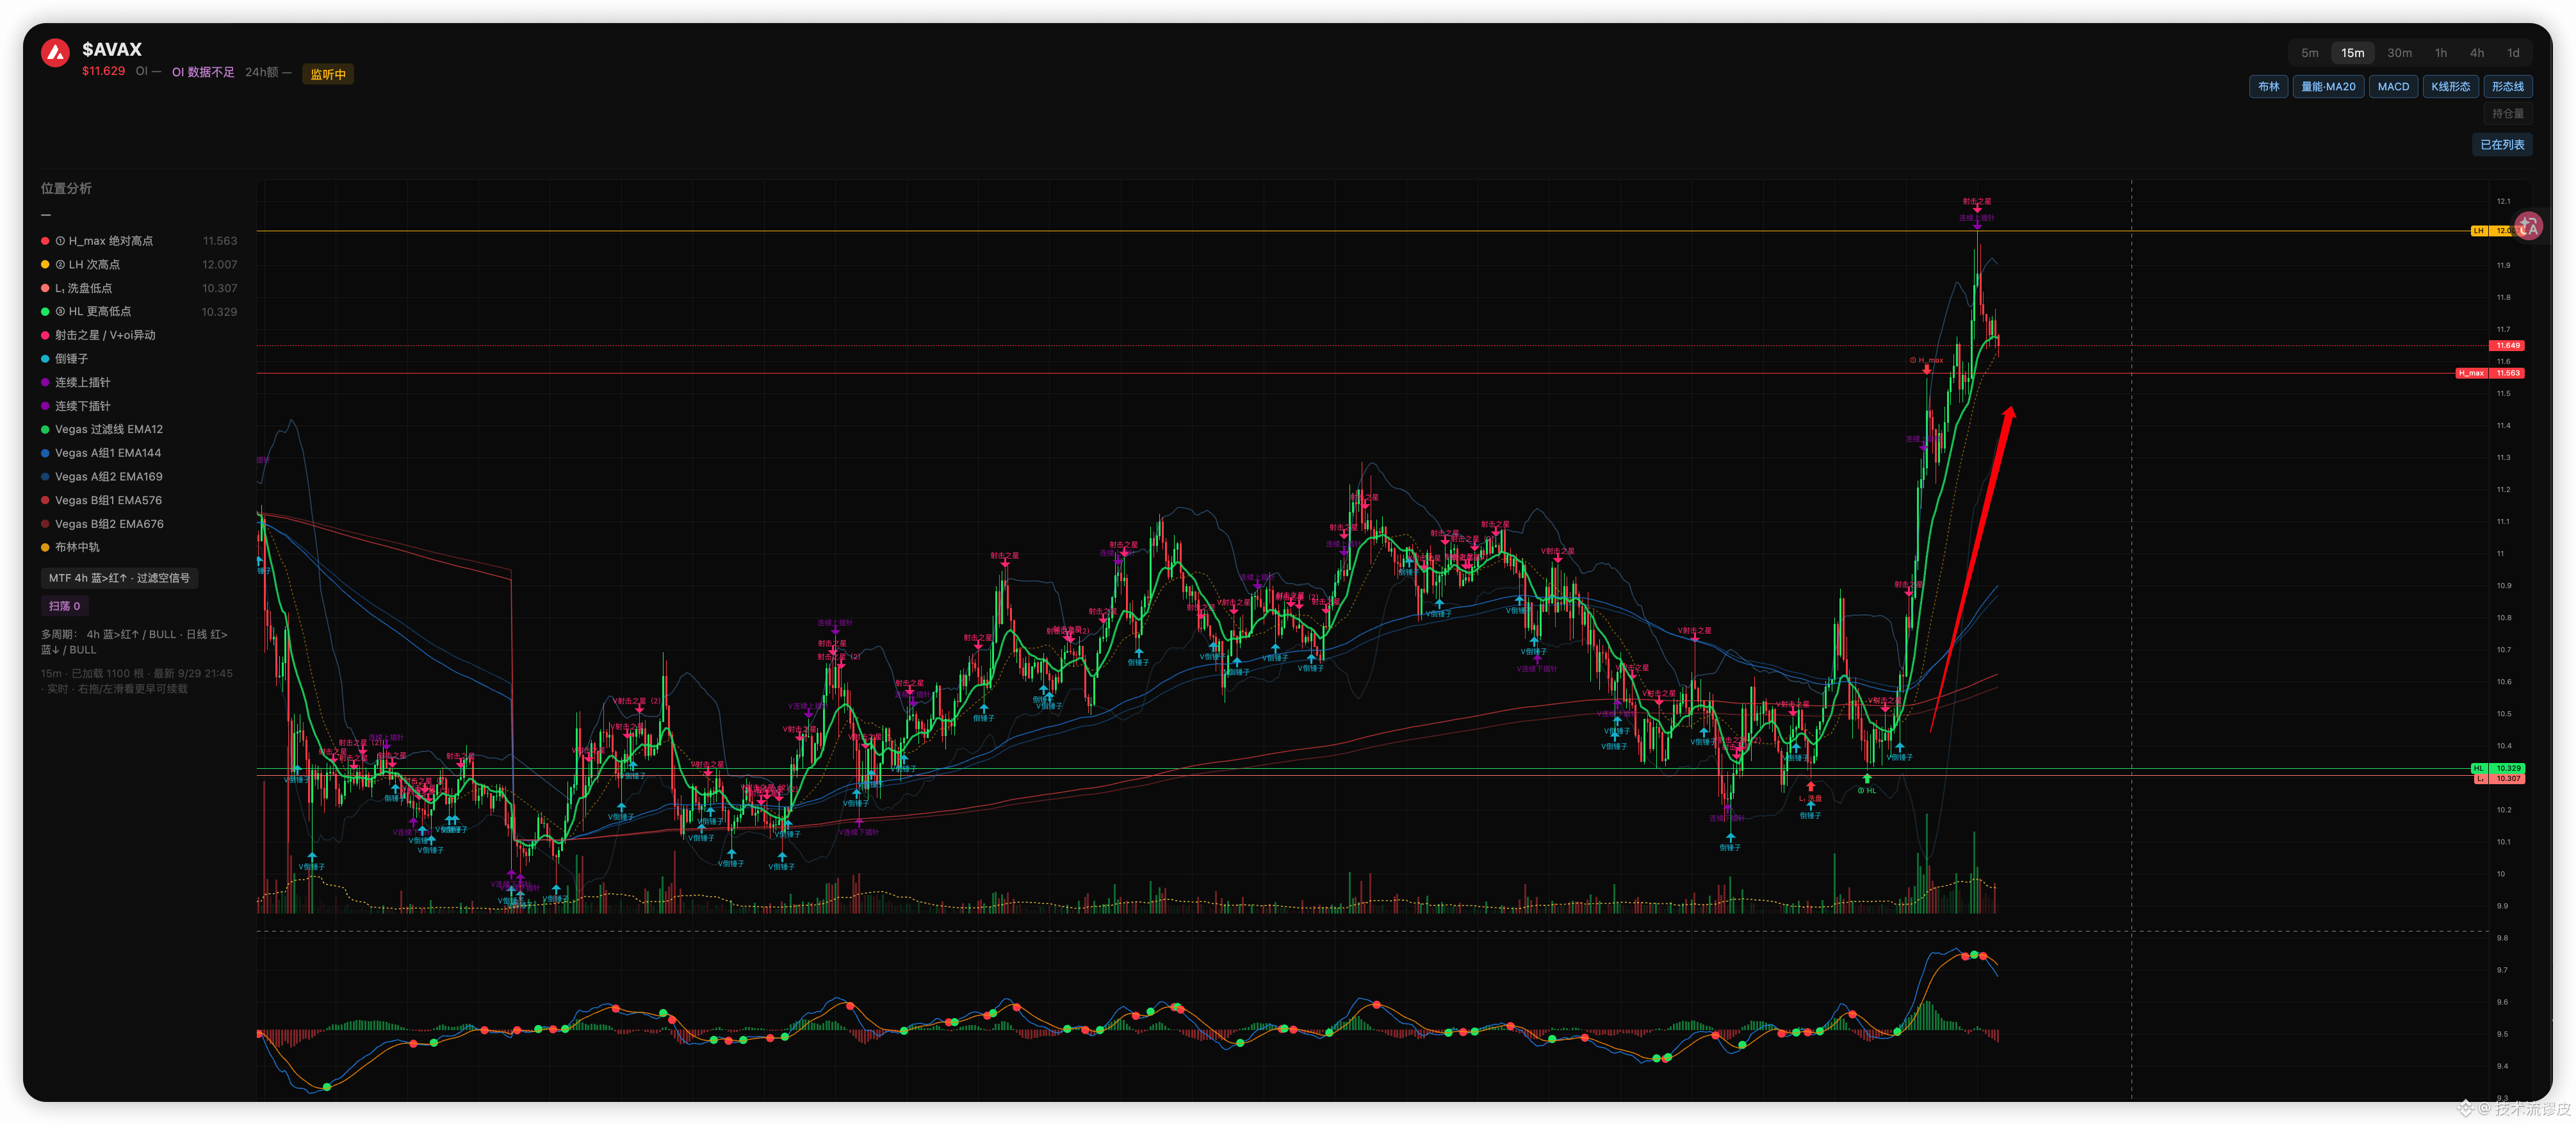
Starting in mid-September around the $7.5 area, it surged to above $11 within a week, briefly hitting an almost 8-month high. After that, it consolidated in a $10–$12 range. Today (Sept. 29) there’s another rebound of roughly 10%–12%, and the current price is around $11.7.
Key catalysts (Avalanche is the network; AVAX is the native token of this network)
1. Helicon upgrade (live as of Sept. 22, tightly hard-bound to AVAX)
The staking-unlock cycle was shortened from 14 days to 48 hours. For institutions and large holders, capital moves in and out more flexibly, while slightly compressing inflation and reducing potential sell pressure. The market is front-running the move—price elasticity around the upgrade has been明显.
2. The Wall Street tokenization narrative (the biggest imagination space)
ICE (the parent company of the NYSE) has been testing Avalanche for about a year, evaluating it for 24/7 tokenized US equity and ETF trading. While no final partnership has been officially announced, senior figures at Ava Labs confirmed both sides are still in close contact, and option premium has already been priced by the market.
New York Life (via Centrifuge) launched the first tokenized high-yield bond fund on Avalanche.
Goldman Sachs plans to provide roughly $100 billion in US Treasury fund exposure to institutional clients via Lynq (a licensed chain on Avalanche) (news reported Sept. 28).
Additional deployments include Paxos, RWA lending by Aave, Janus Henderson becoming a validator, and more.Bifu
Avalanche has also been strong in the inflow of tokenized stocks; in the past week alone, its inflows exceeded the total of other chains combined. Institutions treat Avalanche as a “compliant, customizable L1 with high throughput” settlement layer—this narrative is more substantial than mere DeFi hype.
3. ETFs and liquidity conditions
After the launch of Bitwise’s spot AVAX ETF (BAVA), there were initial inflows, and the fund also stakes most of its tokens to earn yield. Combined with increased stablecoin supply and a recovery in on-chain activity, this creates a positive feedback loop.
This AVAX rally isn’t just following BTC—it’s driven by an institutional narrative that combines network upgrades plus real-world asset (RWA) adoption, with the market pricing it in early.
Starting in mid-September around the $7.5 area, it surged to above $11 within a week, briefly hitting an almost 8-month high. After that, it consolidated in a $10–$12 range. Today (Sept. 29) there’s another rebound of roughly 10%–12%, and the current price is around $11.7.
Key catalysts (Avalanche is the network; AVAX is the native token of this network)
1. Helicon upgrade (live as of Sept. 22, tightly hard-bound to AVAX)
The staking-unlock cycle was shortened from 14 days to 48 hours. For institutions and large holders, capital moves in and out more flexibly, while slightly compressing inflation and reducing potential sell pressure. The market is front-running the move—price elasticity around the upgrade has been明显.
2. The Wall Street tokenization narrative (the biggest imagination space)
ICE (the parent company of the NYSE) has been testing Avalanche for about a year, evaluating it for 24/7 tokenized US equity and ETF trading. While no final partnership has been officially announced, senior figures at Ava Labs confirmed both sides are still in close contact, and option premium has already been priced by the market.
New York Life (via Centrifuge) launched the first tokenized high-yield bond fund on Avalanche.
Goldman Sachs plans to provide roughly $100 billion in US Treasury fund exposure to institutional clients via Lynq (a licensed chain on Avalanche) (news reported Sept. 28).
Additional deployments include Paxos, RWA lending by Aave, Janus Henderson becoming a validator, and more.Bifu
Avalanche has also been strong in the inflow of tokenized stocks; in the past week alone, its inflows exceeded the total of other chains combined. Institutions treat Avalanche as a “compliant, customizable L1 with high throughput” settlement layer—this narrative is more substantial than mere DeFi hype.
3. ETFs and liquidity conditions
After the launch of Bitwise’s spot AVAX ETF (BAVA), there were initial inflows, and the fund also stakes most of its tokens to earn yield. Combined with increased stablecoin supply and a recovery in on-chain activity, this creates a positive feedback loop.
Starting in mid-September around the $7.5 area, it surged to above $11 within a week, briefly hitting an almost 8-month high. After that, it consolidated in a $10–$12 range. Today (Sept. 29) there’s another rebound of roughly 10%–12%, and the current price is around $11.7.
Key catalysts (Avalanche is the network; AVAX is the native token of this network)
1. Helicon upgrade (live as of Sept. 22, tightly hard-bound to AVAX)
The staking-unlock cycle was shortened from 14 days to 48 hours. For institutions and large holders, capital moves in and out more flexibly, while slightly compressing inflation and reducing potential sell pressure. The market is front-running the move—price elasticity around the upgrade has been明显.
2. The Wall Street tokenization narrative (the biggest imagination space)
ICE (the parent company of the NYSE) has been testing Avalanche for about a year, evaluating it for 24/7 tokenized US equity and ETF trading. While no final partnership has been officially announced, senior figures at Ava Labs confirmed both sides are still in close contact, and option premium has already been priced by the market.
New York Life (via Centrifuge) launched the first tokenized high-yield bond fund on Avalanche.
Goldman Sachs plans to provide roughly $100 billion in US Treasury fund exposure to institutional clients via Lynq (a licensed chain on Avalanche) (news reported Sept. 28).
Additional deployments include Paxos, RWA lending by Aave, Janus Henderson becoming a validator, and more.Bifu
Avalanche has also been strong in the inflow of tokenized stocks; in the past week alone, its inflows exceeded the total of other chains combined. Institutions treat Avalanche as a “compliant, customizable L1 with high throughput” settlement layer—this narrative is more substantial than mere DeFi hype.
3. ETFs and liquidity conditions
After the launch of Bitwise’s spot AVAX ETF (BAVA), there were initial inflows, and the fund also stakes most of its tokens to earn yield. Combined with increased stablecoin supply and a recovery in on-chain activity, this creates a positive feedback loop.
510
·
--
The two most common price-volume patterns are also the easiest to misread.
First: a short candle body + a large volume surge
The real body is short and there aren’t many wicks, but the volume suddenly spikes.
This indicates that bulls and bears are fighting fiercely at this price level, and the price can’t be pushed further for now.
After that, there are two possible outcomes:
Continue in the same direction after the volume surge → the trend accelerates (extension)
Or reverse after the volume surge → a reversal; the prior move was the climax of selling pressure/accumulation
In the first pattern, the ultra-large-volume candle on the right is very typical: volume is extremely high, but the candlestick doesn’t crash into a big bearish candle. This is most easily mistaken for “it’s about to collapse,” but in reality it’s more like rotation/turnover.
Second: a big candle body + a small volume
The real body is long, but the volume can’t keep up.
A strong up candle with high prices but low volume means momentum is insufficient and the price is likely to pull back.
A strong down candle with low volume means selling force is weakening and the price is likely to stop falling.
A bullish breakthrough should come with high volume; a bearish breakdown should come with high volume. The selected bullish candle in the middle has decent volume and a sufficiently large body—it’s more of a “healthy” continuation. So don’t just chase because volume is increasing, or run away because volume is shrinking.
First, look at the size of the candle body; then check whether the volume confirms or diverges; finally, look at how the next candle behaves after the volume surge.
Whether it continues (extension) or reverses is often determined within the 1–3 candles after the peak volume.
Watch your own chart—your gains or losses are your own responsibility.
The two most common price-volume patterns are also the easiest to misread.
First: a short candle body + a large volume surge
The real body is short and there aren’t many wicks, but the volume suddenly spikes.
This indicates that bulls and bears are fighting fiercely at this price level, and the price can’t be pushed further for now.
After that, there are two possible outcomes:
Continue in the same direction after the volume surge → the trend accelerates (extension)
Or reverse after the volume surge → a reversal; the prior move was the climax of selling pressure/accumulation
In the first pattern, the ultra-large-volume candle on the right is very typical: volume is extremely high, but the candlestick doesn’t crash into a big bearish candle. This is most easily mistaken for “it’s about to collapse,” but in reality it’s more like rotation/turnover.
Second: a big candle body + a small volume
The real body is long, but the volume can’t keep up.
A strong up candle with high prices but low volume means momentum is insufficient and the price is likely to pull back.
A strong down candle with low volume means selling force is weakening and the price is likely to stop falling.
A bullish breakthrough should come with high volume; a bearish breakdown should come with high volume. The selected bullish candle in the middle has decent volume and a sufficiently large body—it’s more of a “healthy” continuation. So don’t just chase because volume is increasing, or run away because volume is shrinking.
First, look at the size of the candle body; then check whether the volume confirms or diverges; finally, look at how the next candle behaves after the volume surge.
Whether it continues (extension) or reverses is often determined within the 1–3 candles after the peak volume.
Watch your own chart—your gains or losses are your own responsibility.
First: a short candle body + a large volume surge
The real body is short and there aren’t many wicks, but the volume suddenly spikes.
This indicates that bulls and bears are fighting fiercely at this price level, and the price can’t be pushed further for now.
After that, there are two possible outcomes:
Continue in the same direction after the volume surge → the trend accelerates (extension)
Or reverse after the volume surge → a reversal; the prior move was the climax of selling pressure/accumulation
In the first pattern, the ultra-large-volume candle on the right is very typical: volume is extremely high, but the candlestick doesn’t crash into a big bearish candle. This is most easily mistaken for “it’s about to collapse,” but in reality it’s more like rotation/turnover.
Second: a big candle body + a small volume
The real body is long, but the volume can’t keep up.
A strong up candle with high prices but low volume means momentum is insufficient and the price is likely to pull back.
A strong down candle with low volume means selling force is weakening and the price is likely to stop falling.
A bullish breakthrough should come with high volume; a bearish breakdown should come with high volume. The selected bullish candle in the middle has decent volume and a sufficiently large body—it’s more of a “healthy” continuation. So don’t just chase because volume is increasing, or run away because volume is shrinking.
First, look at the size of the candle body; then check whether the volume confirms or diverges; finally, look at how the next candle behaves after the volume surge.
Whether it continues (extension) or reverses is often determined within the 1–3 candles after the peak volume.
Watch your own chart—your gains or losses are your own responsibility.
71
·
--
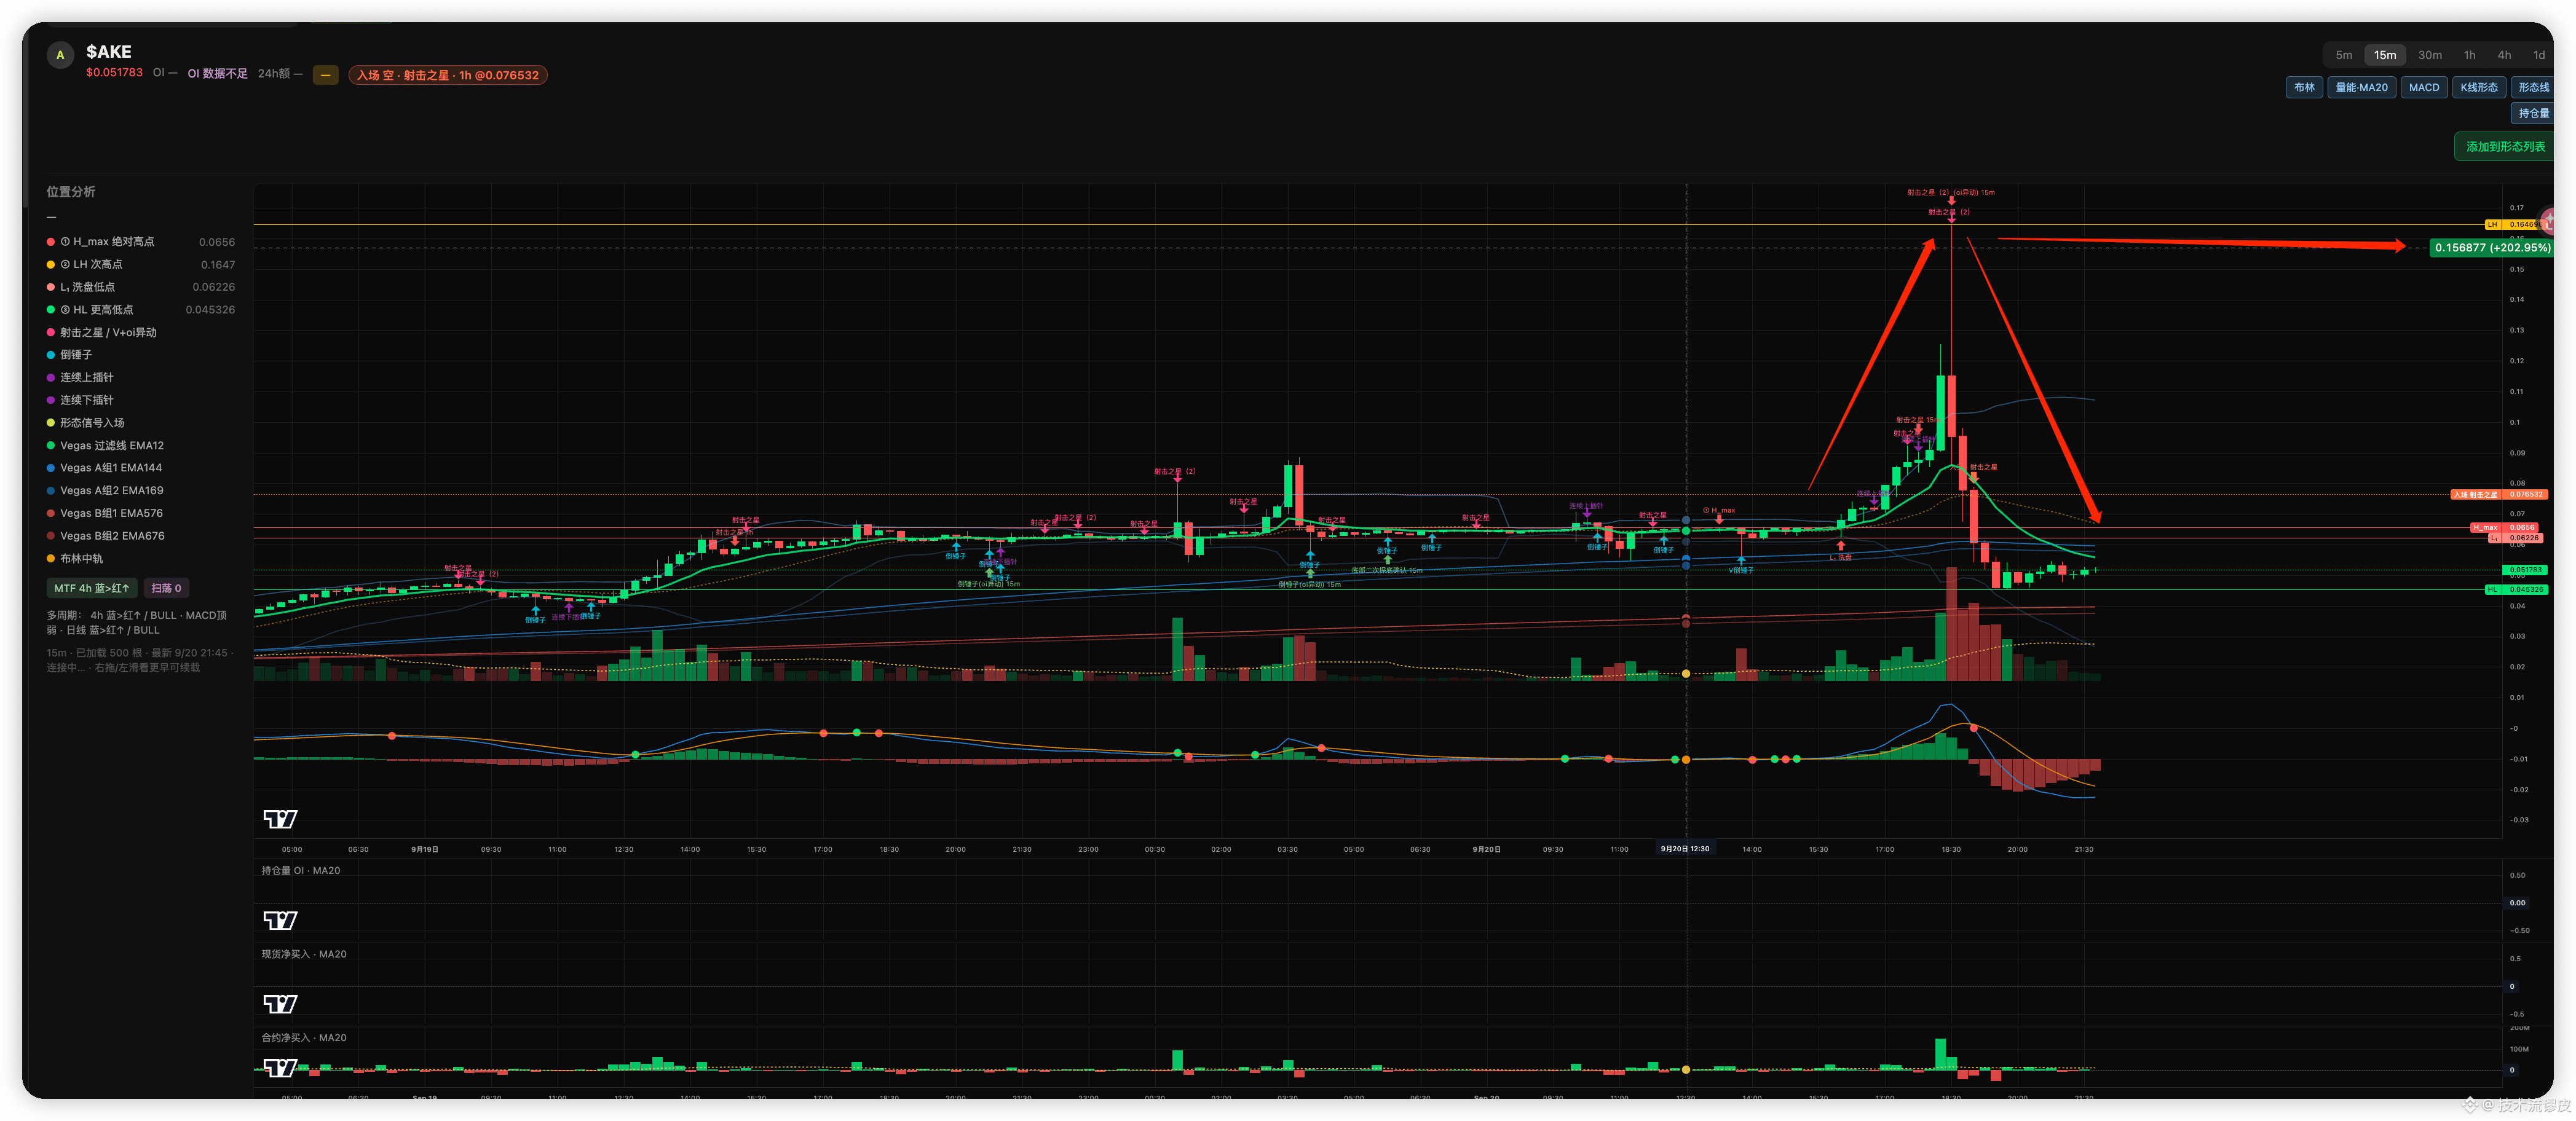
$AKE Three hours to double first and then unload everything. It’s not because of good news—it’s because the order book is too thin (a thin book), and it can’t withstand a single market buy/sell order. The only focus is this:
What you see as “buyers scrambling to buy” is, in large part, shorts being force-liquidated, with the exchange buying back for them using market orders. That’s why the wick becomes long and fast.
At the highs there’s no spot liquidity to hold the price up. The chasing longs also get force-liquidated, and the system switches to market selling. The path the price went up is the path it gets smashed back down. So this wick isn’t answering whether to go long.
It’s answering: in this burst of trades, how much was people proactively adding positions, and how much was positions being forcibly liquidated. If it’s mostly the latter—spot doesn’t follow, and only the contracts blow out—then it’s mainly about retracing (giving back), not a trend. Don’t chase the first candle.
In that first candle, what gets bought is often orders from other people’s liquidations.
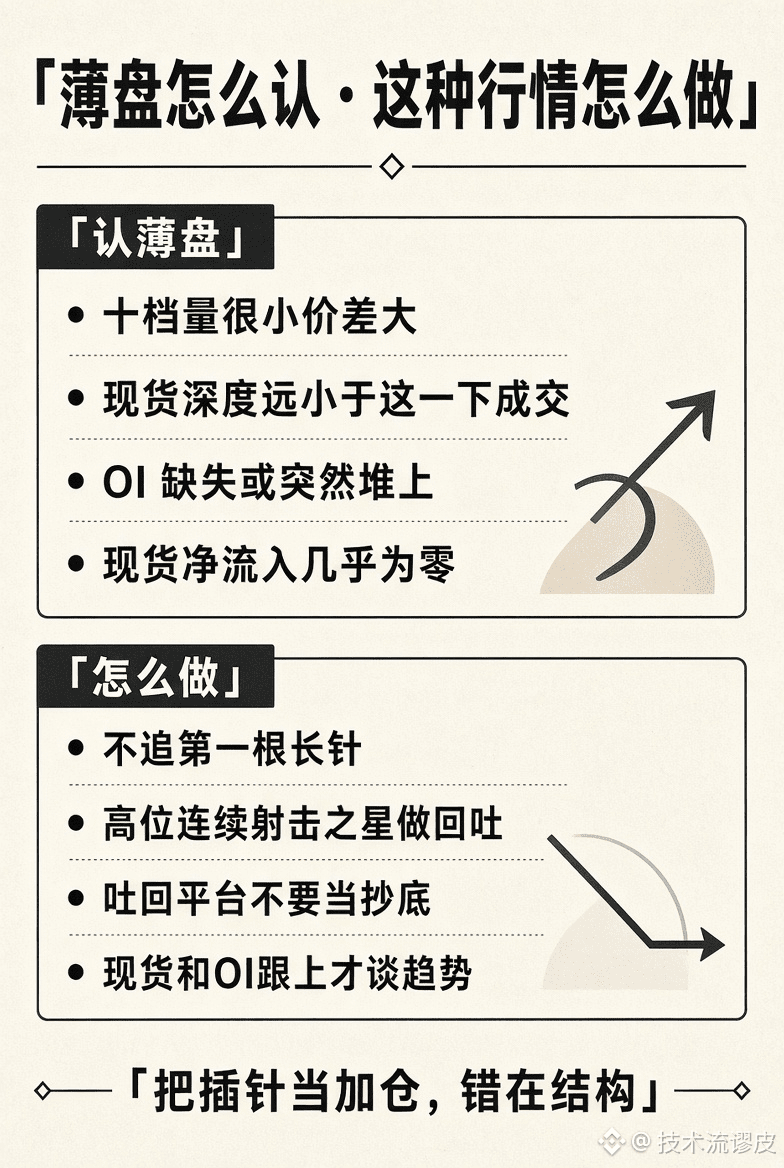
How to recognize a thin order book:
Don’t judge by percentage change. Judge by “how far this single order can push the price.”
The order book at levels 10 is very thin—sweep one layer and the price jumps. Even the spot depth is smaller than the single contract trade that just happened. That’s a thin book.
The meaning of a thin book isn’t “it can still rise.” It’s that price can be misaligned by forced matching of trades.
How to play this kind of market:
If the wick is still accelerating, don’t do anything. You’re competing with liquidation orders for execution.
If the wick has appeared but spot still doesn’t follow, the trades are about retracing.
Before this round ends, you’ll see the platform it pulls back to and then rises from—but it’s not a brand-new cheap entry point.
Unless spot and your positions both start following together, don’t upgrade the thin-book wick into a trend.
$AKE Three hours to double first and then unload everything. It’s not because of good news—it’s because the order book is too thin (a thin book), and it can’t withstand a single market buy/sell order. The only focus is this:
What you see as “buyers scrambling to buy” is, in large part, shorts being force-liquidated, with the exchange buying back for them using market orders. That’s why the wick becomes long and fast.
At the highs there’s no spot liquidity to hold the price up. The chasing longs also get force-liquidated, and the system switches to market selling. The path the price went up is the path it gets smashed back down. So this wick isn’t answering whether to go long.
It’s answering: in this burst of trades, how much was people proactively adding positions, and how much was positions being forcibly liquidated. If it’s mostly the latter—spot doesn’t follow, and only the contracts blow out—then it’s mainly about retracing (giving back), not a trend. Don’t chase the first candle.
In that first candle, what gets bought is often orders from other people’s liquidations.
How to recognize a thin order book:
Don’t judge by percentage change. Judge by “how far this single order can push the price.”
The order book at levels 10 is very thin—sweep one layer and the price jumps. Even the spot depth is smaller than the single contract trade that just happened. That’s a thin book.
The meaning of a thin book isn’t “it can still rise.” It’s that price can be misaligned by forced matching of trades.
How to play this kind of market:
If the wick is still accelerating, don’t do anything. You’re competing with liquidation orders for execution.
If the wick has appeared but spot still doesn’t follow, the trades are about retracing.
Before this round ends, you’ll see the platform it pulls back to and then rises from—but it’s not a brand-new cheap entry point.
Unless spot and your positions both start following together, don’t upgrade the thin-book wick into a trend.
What you see as “buyers scrambling to buy” is, in large part, shorts being force-liquidated, with the exchange buying back for them using market orders. That’s why the wick becomes long and fast.
At the highs there’s no spot liquidity to hold the price up. The chasing longs also get force-liquidated, and the system switches to market selling. The path the price went up is the path it gets smashed back down. So this wick isn’t answering whether to go long.
It’s answering: in this burst of trades, how much was people proactively adding positions, and how much was positions being forcibly liquidated. If it’s mostly the latter—spot doesn’t follow, and only the contracts blow out—then it’s mainly about retracing (giving back), not a trend. Don’t chase the first candle.
In that first candle, what gets bought is often orders from other people’s liquidations.
How to recognize a thin order book:
Don’t judge by percentage change. Judge by “how far this single order can push the price.”
The order book at levels 10 is very thin—sweep one layer and the price jumps. Even the spot depth is smaller than the single contract trade that just happened. That’s a thin book.
The meaning of a thin book isn’t “it can still rise.” It’s that price can be misaligned by forced matching of trades.
How to play this kind of market:
If the wick is still accelerating, don’t do anything. You’re competing with liquidation orders for execution.
If the wick has appeared but spot still doesn’t follow, the trades are about retracing.
Before this round ends, you’ll see the platform it pulls back to and then rises from—but it’s not a brand-new cheap entry point.
Unless spot and your positions both start following together, don’t upgrade the thin-book wick into a trend.
469
·
--
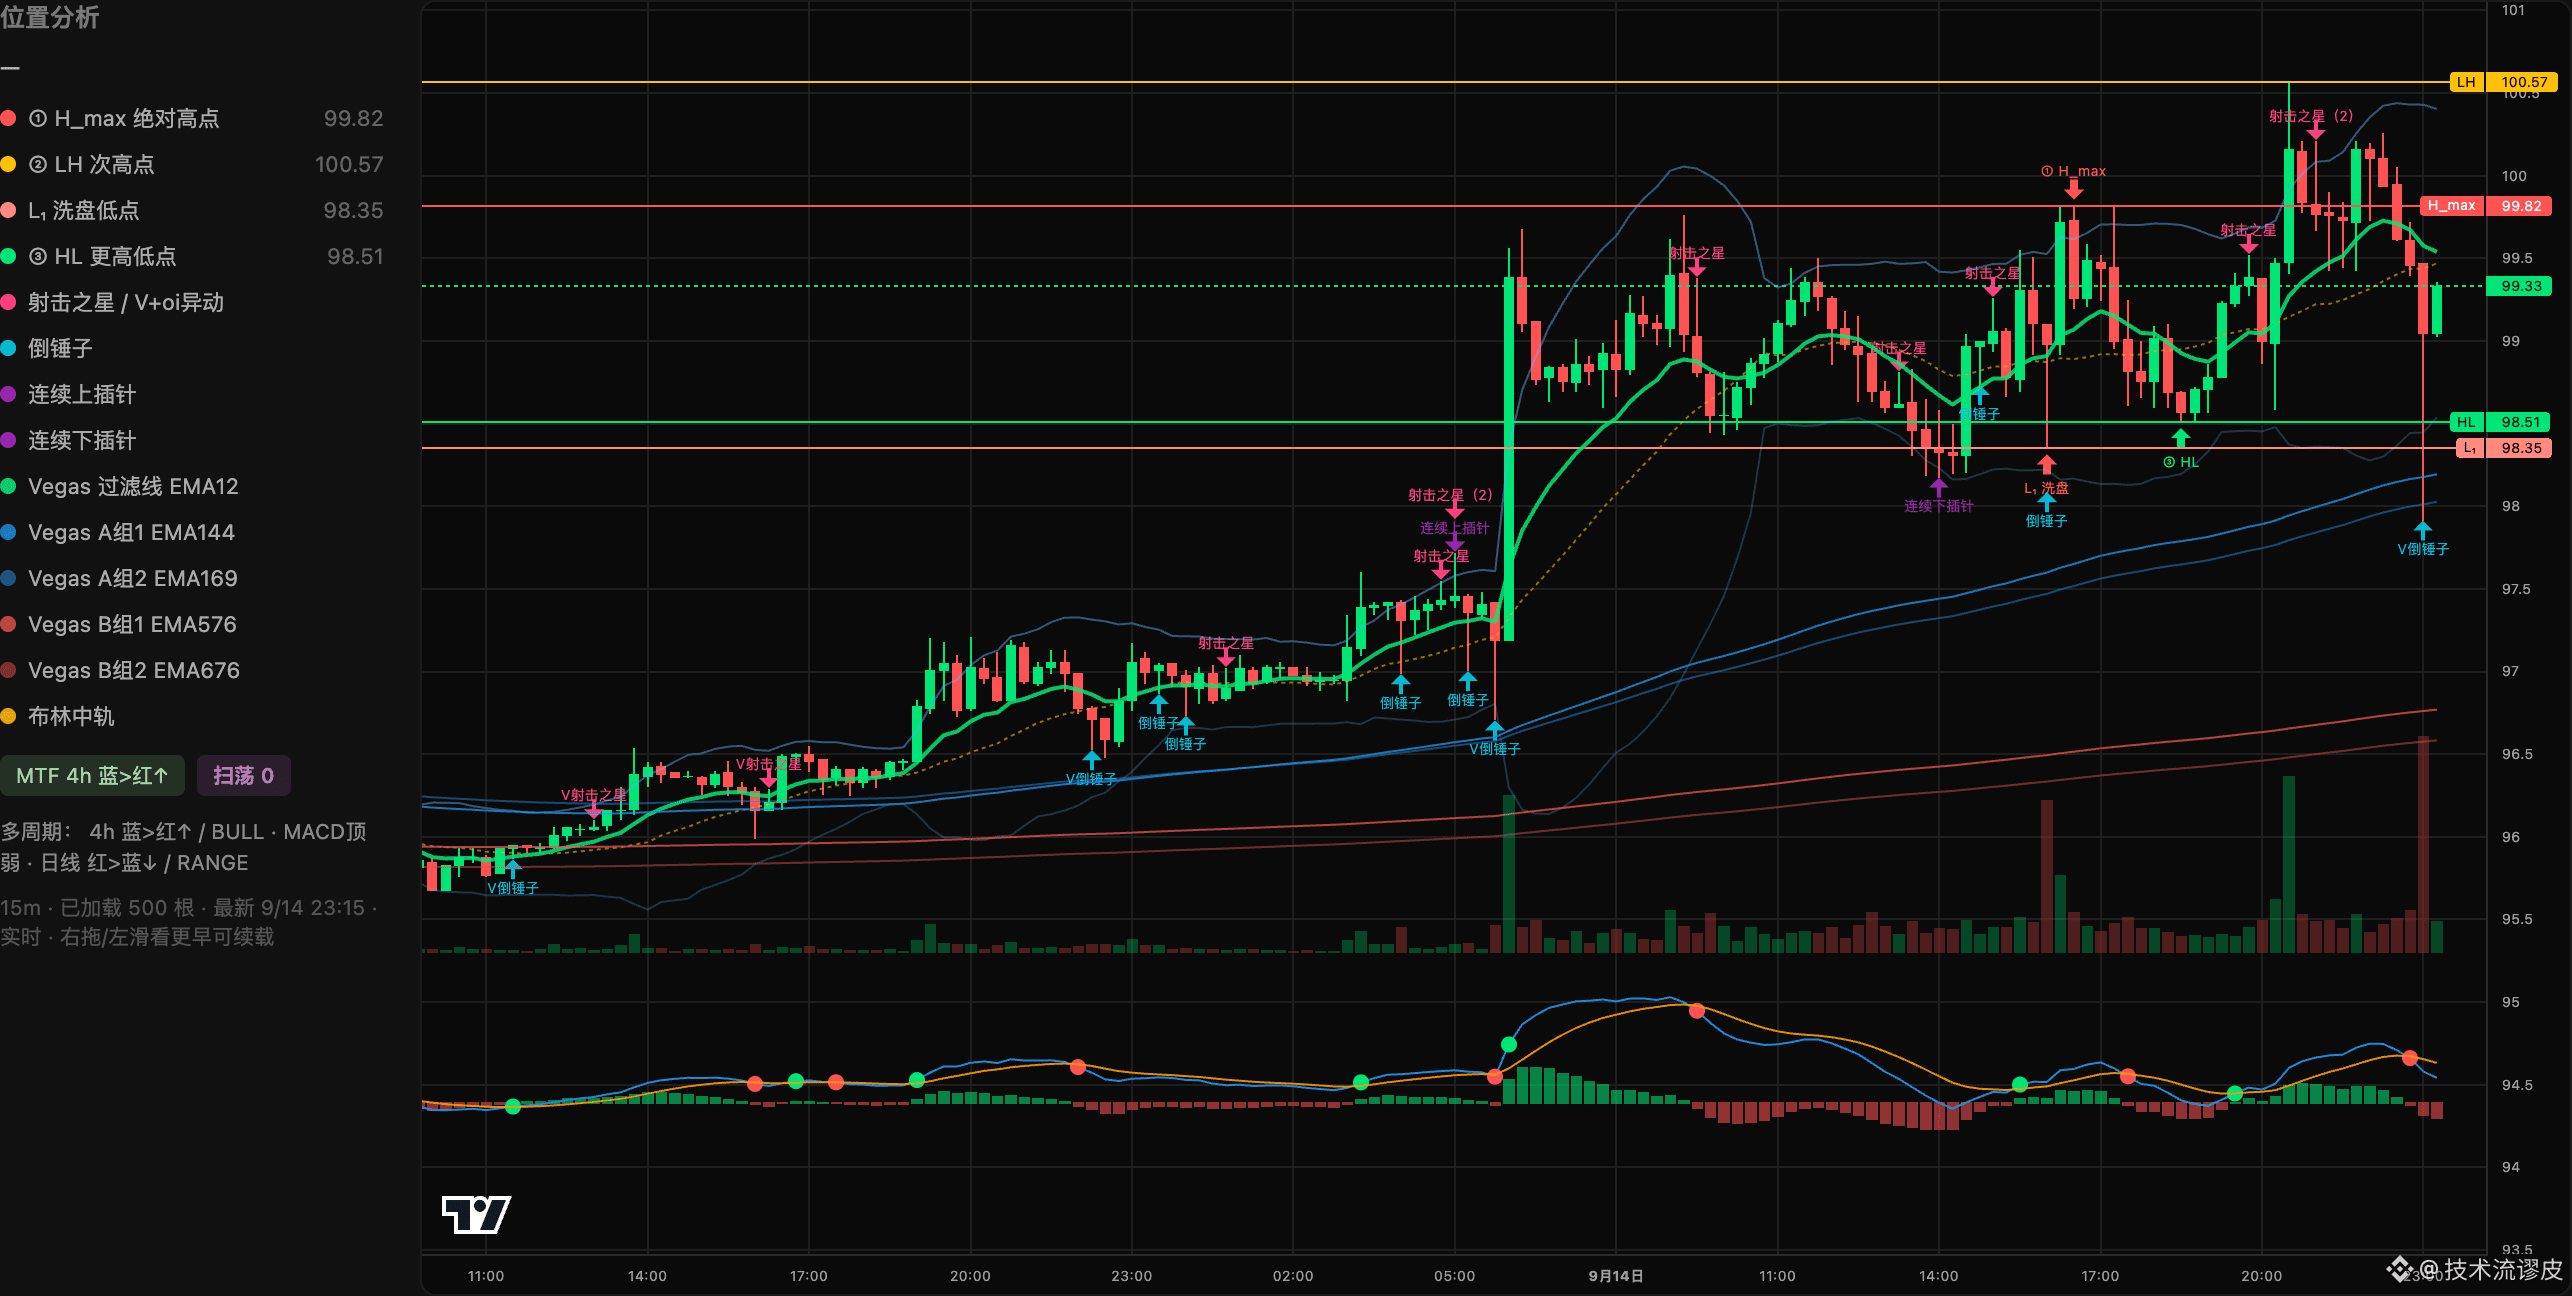
Oil is back at 100 again. Go ahead and open a short position directly—I don’t believe it can reach 120. Take profit if it hits 80.
Oil is back at 100 again. Go ahead and open a short position directly—I don’t believe it can reach 120. Take profit if it hits 80.
3
1
806
·
--
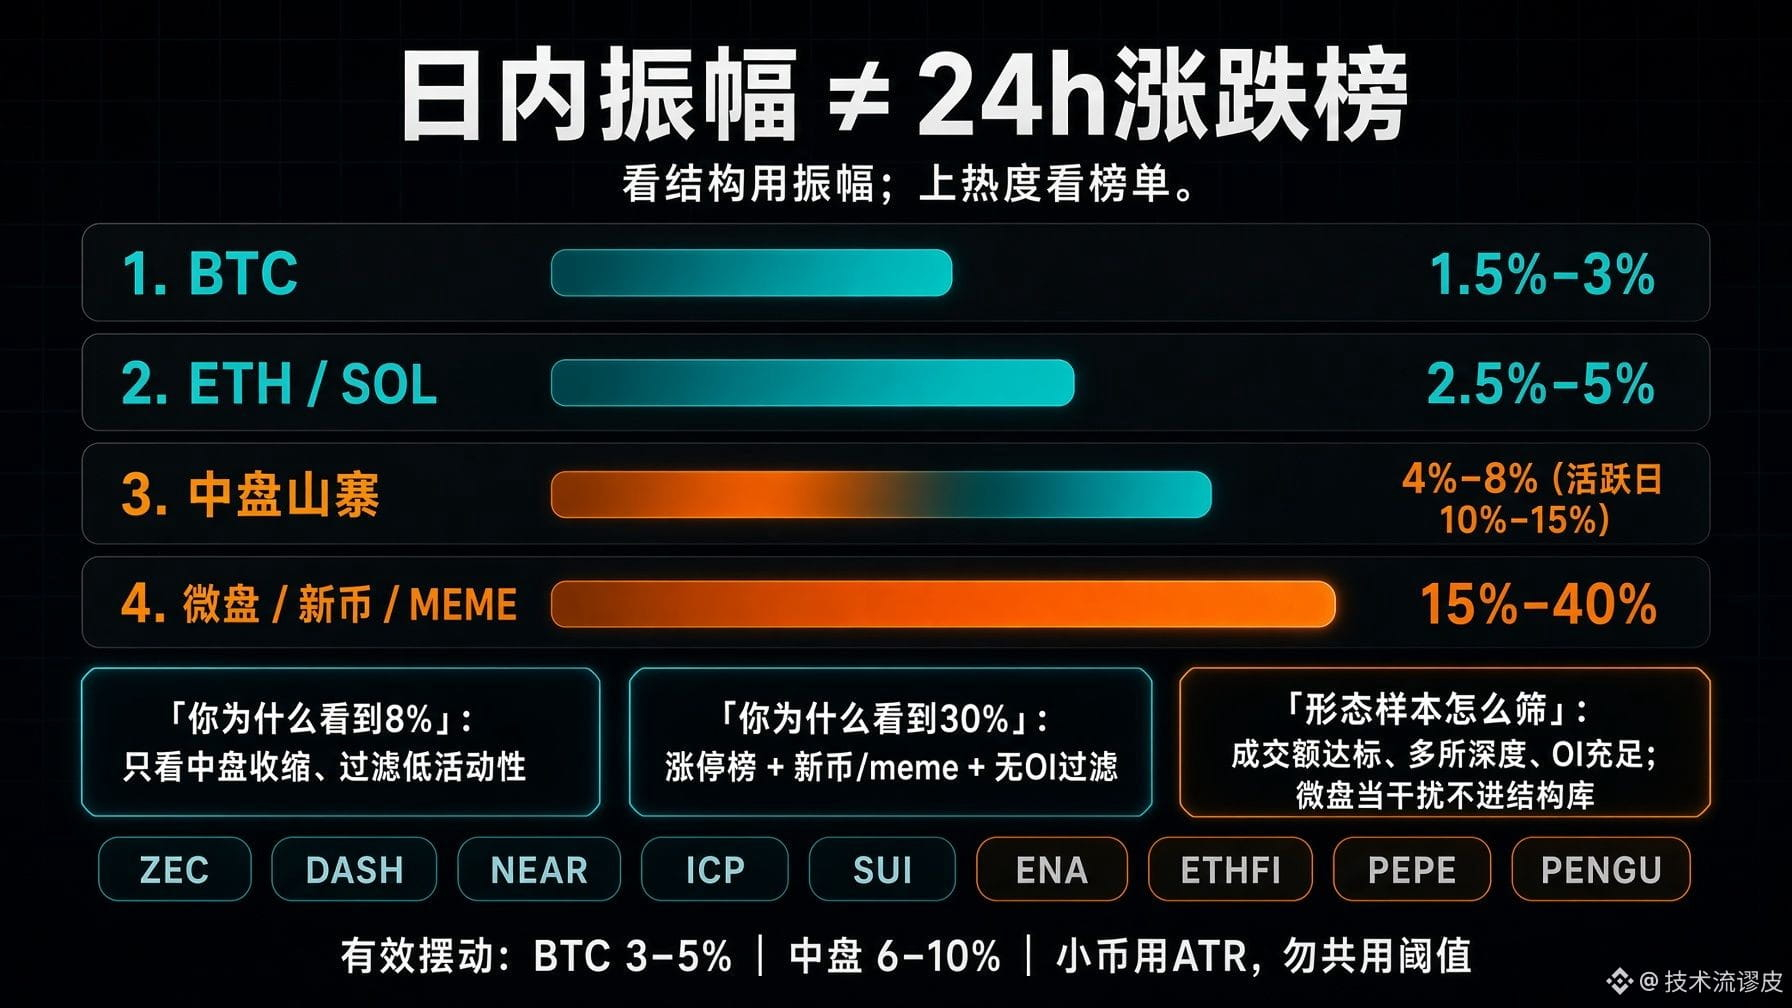
Why, when looking at the same kind of “shanzhai” coins, do some people see 8% in a day while others see 30% every day? What are the most common daily ranges for most coin types?
For most shanzhai coins that can be traded on margin/futures, the typical daily swing is about 5%–10%. Don’t mix this up with the gainers/losers leaderboard:
• BTC on a normal day is about 1.5%–3%
• Coins like ETH / SOL are about 2.5%–5%
• Mid-cap shanzhai coins are mostly 4%–8%, with active days at 10%–15%
• Small caps, new listings, and memes of 15%–40% are also common. For those that truly make it onto a high-volume leaderboard, the move on that day is often already ±10%–25%.
Over 30% is mostly for small coins or extreme days—not the usual daily structure for mid-cap coins. Coins that are easy to attract attention include high-beta types like: ZEC / DASH, NEAR / ICP / SUI, ENA / ETHFI, PEPE / PENGU, and the like.
Tokens that tend to trigger rising hype: ZEC / DASH, NEAR / ICP / SUI, ENA / ETHFI, PEPE / PENGU, etc. These tokens have very high activity.
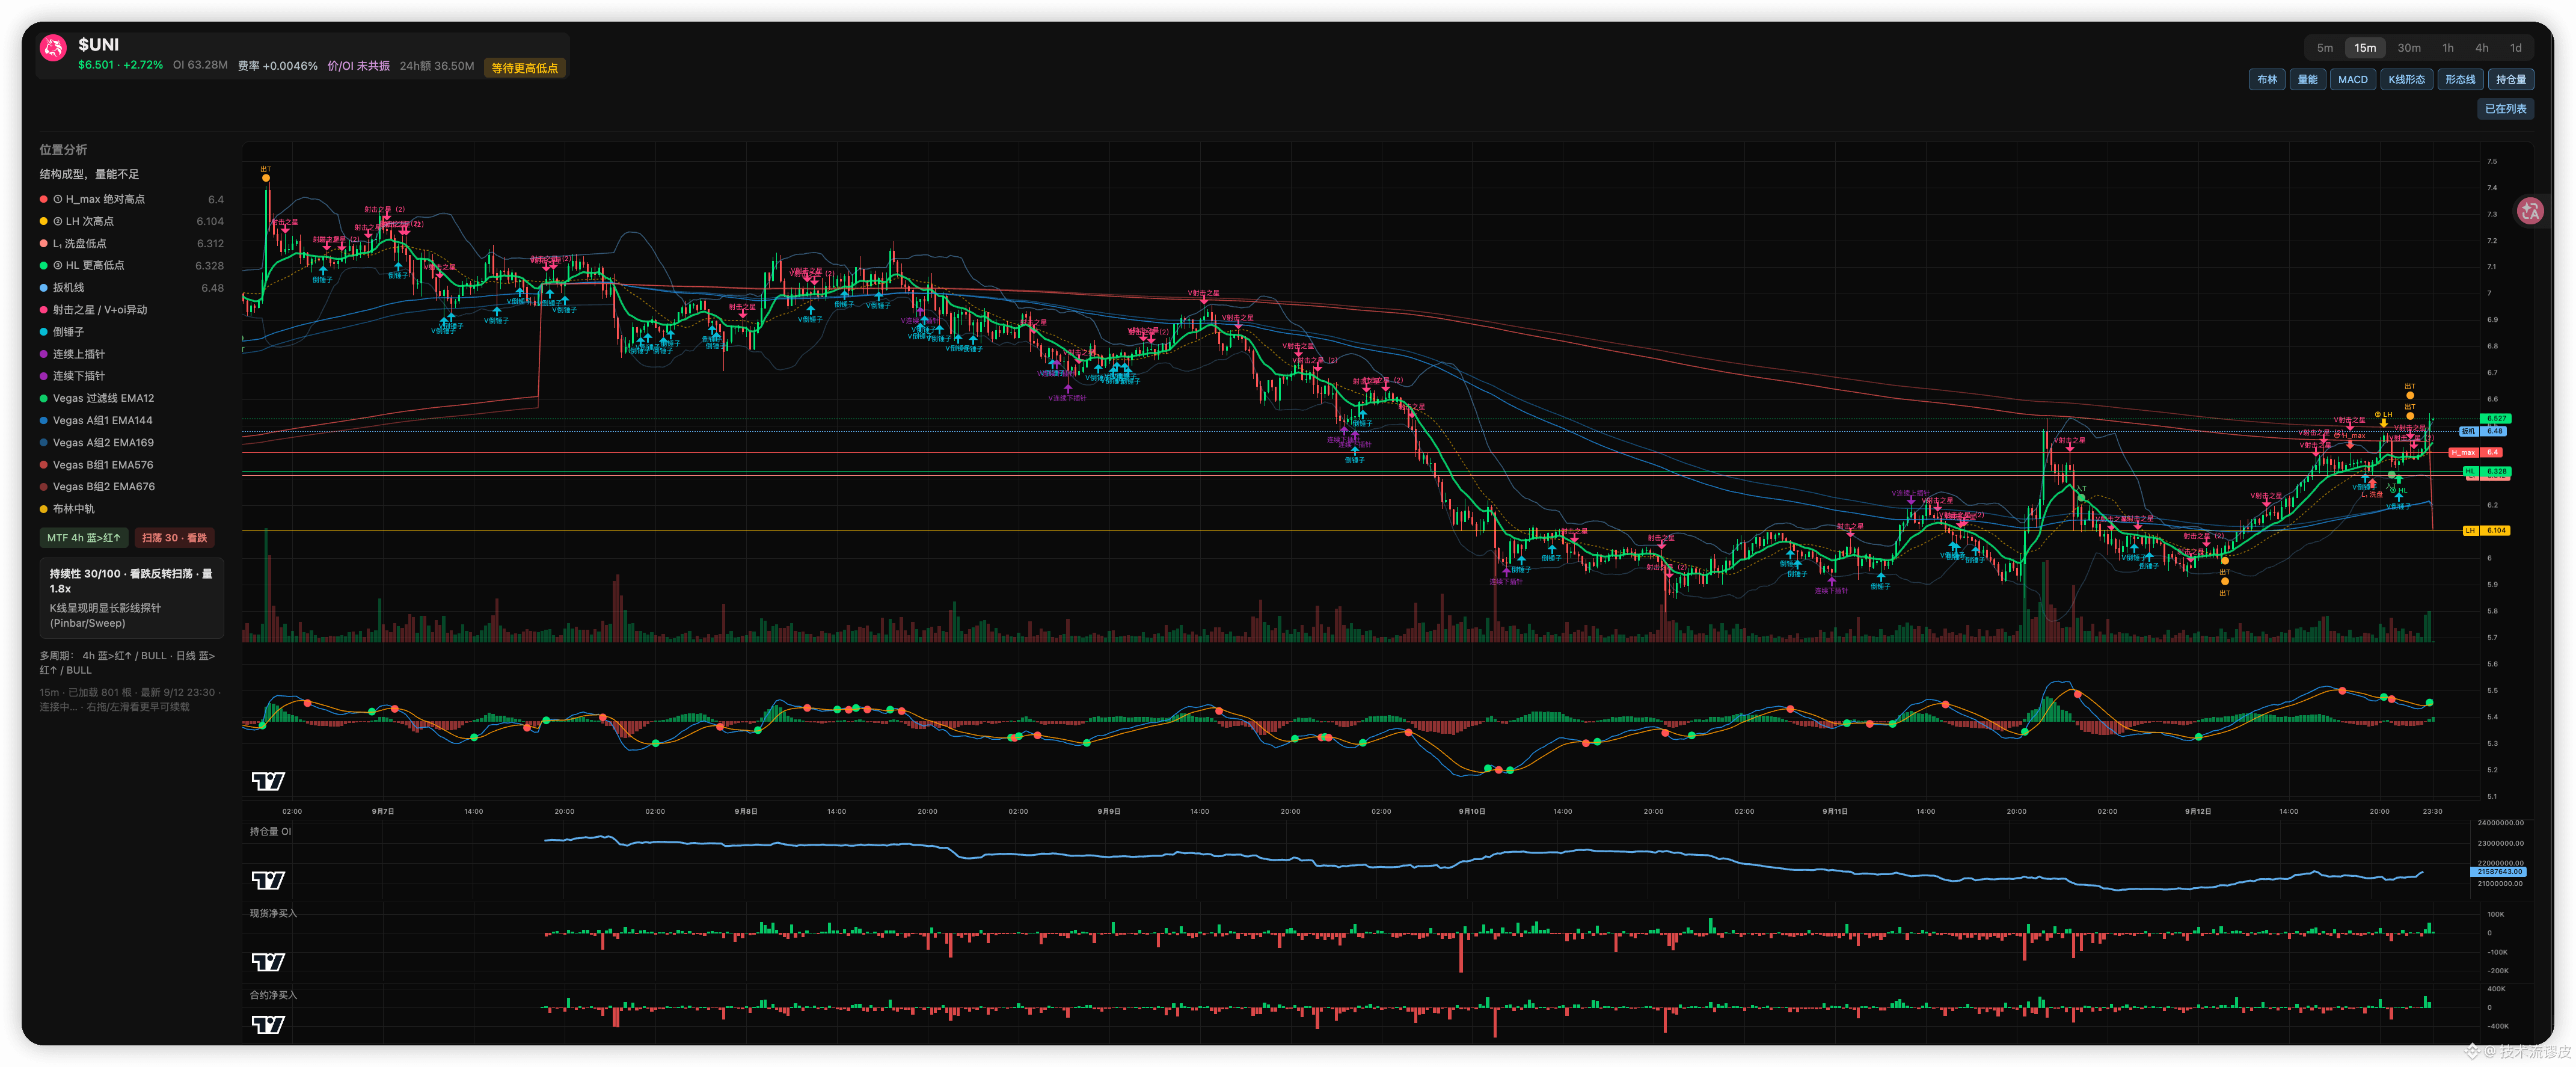
Even if OI is insufficient or a new listing on a single venue with shallow depth can still surge hard, that surge can’t serve as a pattern sample. For alerts, don’t use the same percentages across the board:
For BTC, using 3%–5% as an “effective swing” is acceptable. Most shanzhai coins usually need to be set to 6%–10%, and for small caps you should base it on ATR.
Otherwise your charts will be nothing but peaks—not structure, just noise.
Why, when looking at the same kind of “shanzhai” coins, do some people see 8% in a day while others see 30% every day? What are the most common daily ranges for most coin types?
For most shanzhai coins that can be traded on margin/futures, the typical daily swing is about 5%–10%. Don’t mix this up with the gainers/losers leaderboard:
• BTC on a normal day is about 1.5%–3%
• Coins like ETH / SOL are about 2.5%–5%
• Mid-cap shanzhai coins are mostly 4%–8%, with active days at 10%–15%
• Small caps, new listings, and memes of 15%–40% are also common. For those that truly make it onto a high-volume leaderboard, the move on that day is often already ±10%–25%.
Over 30% is mostly for small coins or extreme days—not the usual daily structure for mid-cap coins. Coins that are easy to attract attention include high-beta types like: ZEC / DASH, NEAR / ICP / SUI, ENA / ETHFI, PEPE / PENGU, and the like.
Tokens that tend to trigger rising hype: ZEC / DASH, NEAR / ICP / SUI, ENA / ETHFI, PEPE / PENGU, etc. These tokens have very high activity.
Even if OI is insufficient or a new listing on a single venue with shallow depth can still surge hard, that surge can’t serve as a pattern sample. For alerts, don’t use the same percentages across the board:
For BTC, using 3%–5% as an “effective swing” is acceptable. Most shanzhai coins usually need to be set to 6%–10%, and for small caps you should base it on ATR.
Otherwise your charts will be nothing but peaks—not structure, just noise.
For most shanzhai coins that can be traded on margin/futures, the typical daily swing is about 5%–10%. Don’t mix this up with the gainers/losers leaderboard:
• BTC on a normal day is about 1.5%–3%
• Coins like ETH / SOL are about 2.5%–5%
• Mid-cap shanzhai coins are mostly 4%–8%, with active days at 10%–15%
• Small caps, new listings, and memes of 15%–40% are also common. For those that truly make it onto a high-volume leaderboard, the move on that day is often already ±10%–25%.
Over 30% is mostly for small coins or extreme days—not the usual daily structure for mid-cap coins. Coins that are easy to attract attention include high-beta types like: ZEC / DASH, NEAR / ICP / SUI, ENA / ETHFI, PEPE / PENGU, and the like.
Tokens that tend to trigger rising hype: ZEC / DASH, NEAR / ICP / SUI, ENA / ETHFI, PEPE / PENGU, etc. These tokens have very high activity.
Even if OI is insufficient or a new listing on a single venue with shallow depth can still surge hard, that surge can’t serve as a pattern sample. For alerts, don’t use the same percentages across the board:
For BTC, using 3%–5% as an “effective swing” is acceptable. Most shanzhai coins usually need to be set to 6%–10%, and for small caps you should base it on ATR.
Otherwise your charts will be nothing but peaks—not structure, just noise.
589
·
--
249,000 turned into 15,000! From Biden’s son to Trump: once you掌握 power and traffic, the suckers will grow legs and come chasing you themselves!
Not even a month later—here comes another tragic case of “cutting losses” by deleting accounts and fleeing! A trader liquidated LAPTOP: put in $249,000, and walked out with only $15,000—cut by 94% straight off the bat!
Many people think crypto harvesting is all about technical analysis and market-manipulating “dog庄.” But that’s not it at all. Who says only Trump issues coins and shouts calls to slice suckers without restraint? Look at Biden’s son and those “artworks” that are hard to verify, plus private deals—aren’t the underlying principles exactly the same?!
The truth is:
Once you have absolute power, political influence, or top-tier traffic, you don’t even need to set a trap. Big-money fund flows and all kinds of opportunists will come running on their own.
In the face of overwhelming self-interest, whether you’re the president’s relative or a political bigshot—
As long as you attract enough hot money, it all happens in one go: pump, cash out, dump the price, delete the account, and vanish.
After all, in this circle—
If you can pull off a successful scam once with enough ruthlessness, you’ll be able to lie flat and live comfortably for the rest of your life!
💡 The iron law of surviving as a sucker:
Stop paying for political halos or big-shot personas! When a project attracts capital flow by using “power-and-traffic labels” like Biden’s son or Trump, you think you’re riding the trend of the moment—but in reality, you’re just the stepping stone for someone else’s “one-wave, lie-flat” scheme.
#LAPTOPTragedy #Trump #HunterBiden #Cryptocurrency #Web3 Harvesting Logic #Sucker Survival Guide
249,000 turned into 15,000! From Biden’s son to Trump: once you掌握 power and traffic, the suckers will grow legs and come chasing you themselves!
Not even a month later—here comes another tragic case of “cutting losses” by deleting accounts and fleeing! A trader liquidated LAPTOP: put in $249,000, and walked out with only $15,000—cut by 94% straight off the bat!
Many people think crypto harvesting is all about technical analysis and market-manipulating “dog庄.” But that’s not it at all. Who says only Trump issues coins and shouts calls to slice suckers without restraint? Look at Biden’s son and those “artworks” that are hard to verify, plus private deals—aren’t the underlying principles exactly the same?!
The truth is:
Once you have absolute power, political influence, or top-tier traffic, you don’t even need to set a trap. Big-money fund flows and all kinds of opportunists will come running on their own.
In the face of overwhelming self-interest, whether you’re the president’s relative or a political bigshot—
As long as you attract enough hot money, it all happens in one go: pump, cash out, dump the price, delete the account, and vanish.
After all, in this circle—
If you can pull off a successful scam once with enough ruthlessness, you’ll be able to lie flat and live comfortably for the rest of your life!
💡 The iron law of surviving as a sucker:
Stop paying for political halos or big-shot personas! When a project attracts capital flow by using “power-and-traffic labels” like Biden’s son or Trump, you think you’re riding the trend of the moment—but in reality, you’re just the stepping stone for someone else’s “one-wave, lie-flat” scheme.
#LAPTOPTragedy #Trump #HunterBiden #Cryptocurrency #Web3 Harvesting Logic #Sucker Survival Guide
Not even a month later—here comes another tragic case of “cutting losses” by deleting accounts and fleeing! A trader liquidated LAPTOP: put in $249,000, and walked out with only $15,000—cut by 94% straight off the bat!
Many people think crypto harvesting is all about technical analysis and market-manipulating “dog庄.” But that’s not it at all. Who says only Trump issues coins and shouts calls to slice suckers without restraint? Look at Biden’s son and those “artworks” that are hard to verify, plus private deals—aren’t the underlying principles exactly the same?!
The truth is:
Once you have absolute power, political influence, or top-tier traffic, you don’t even need to set a trap. Big-money fund flows and all kinds of opportunists will come running on their own.
In the face of overwhelming self-interest, whether you’re the president’s relative or a political bigshot—
As long as you attract enough hot money, it all happens in one go: pump, cash out, dump the price, delete the account, and vanish.
After all, in this circle—
If you can pull off a successful scam once with enough ruthlessness, you’ll be able to lie flat and live comfortably for the rest of your life!
💡 The iron law of surviving as a sucker:
Stop paying for political halos or big-shot personas! When a project attracts capital flow by using “power-and-traffic labels” like Biden’s son or Trump, you think you’re riding the trend of the moment—but in reality, you’re just the stepping stone for someone else’s “one-wave, lie-flat” scheme.
#LAPTOPTragedy #Trump #HunterBiden #Cryptocurrency #Web3 Harvesting Logic #Sucker Survival Guide


276
·
--
BlockBeats message: On September 8, according to GMGN data, on the BNB Chain, a Meme build paired with BNC4 launched and had a market cap that surpassed $50 million within 6 hours, with trading volume of $20 million. The build pairs tokenized US stocks BNC (CEA Industries, the BNB Treasury company) as the pool, and uses the build/BNC4 trading pair to provide liquidity. BlockBeats note: Meme coin trading is highly volatile and relies largely on market sentiment and hype around concepts, with no actual value or use case. Investors should be aware of the risks.
BlockBeats message: On September 8, according to GMGN data, on the BNB Chain, a Meme build paired with BNC4 launched and had a market cap that surpassed $50 million within 6 hours, with trading volume of $20 million. The build pairs tokenized US stocks BNC (CEA Industries, the BNB Treasury company) as the pool, and uses the build/BNC4 trading pair to provide liquidity. BlockBeats note: Meme coin trading is highly volatile and relies largely on market sentiment and hype around concepts, with no actual value or use case. Investors should be aware of the risks.

72
·
--
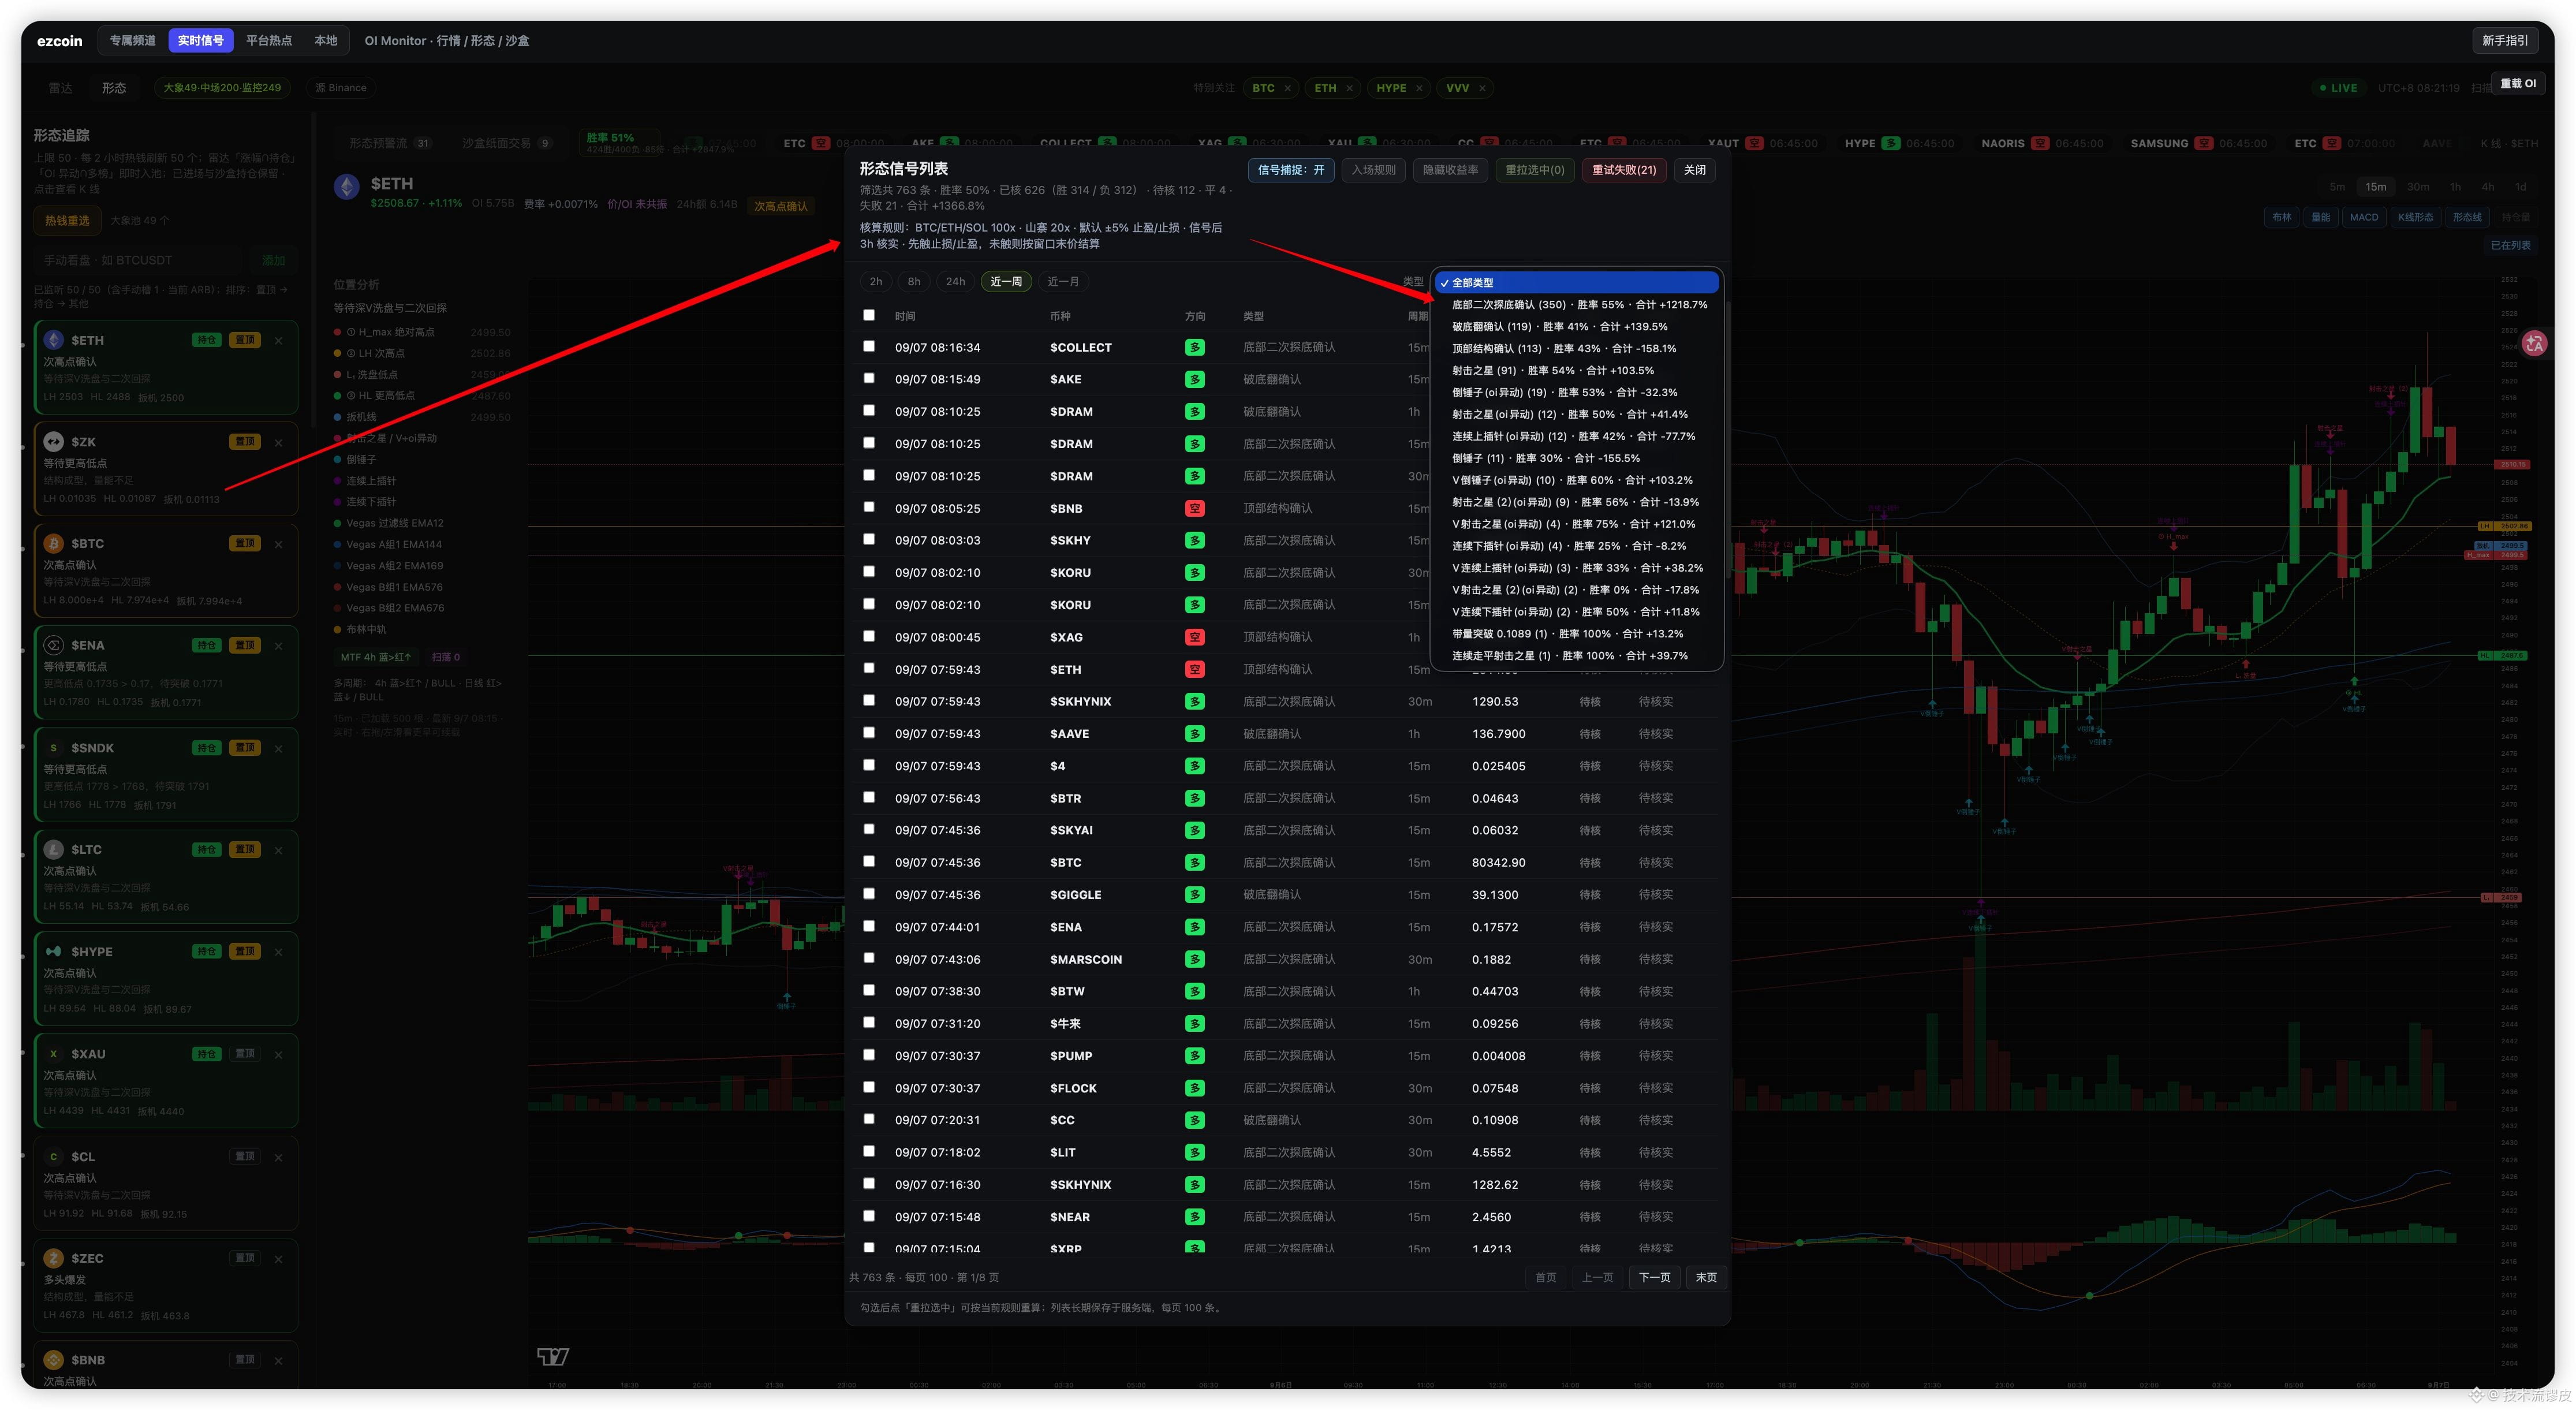
Monitoring OI fluctuations across the entire network, I used these patterns for three days and got this result. As expected, in an uptrend, the second bottom test has the highest win rate.
Monitoring OI fluctuations across the entire network, I used these patterns for three days and got this result. As expected, in an uptrend, the second bottom test has the highest win rate.
82
·
--
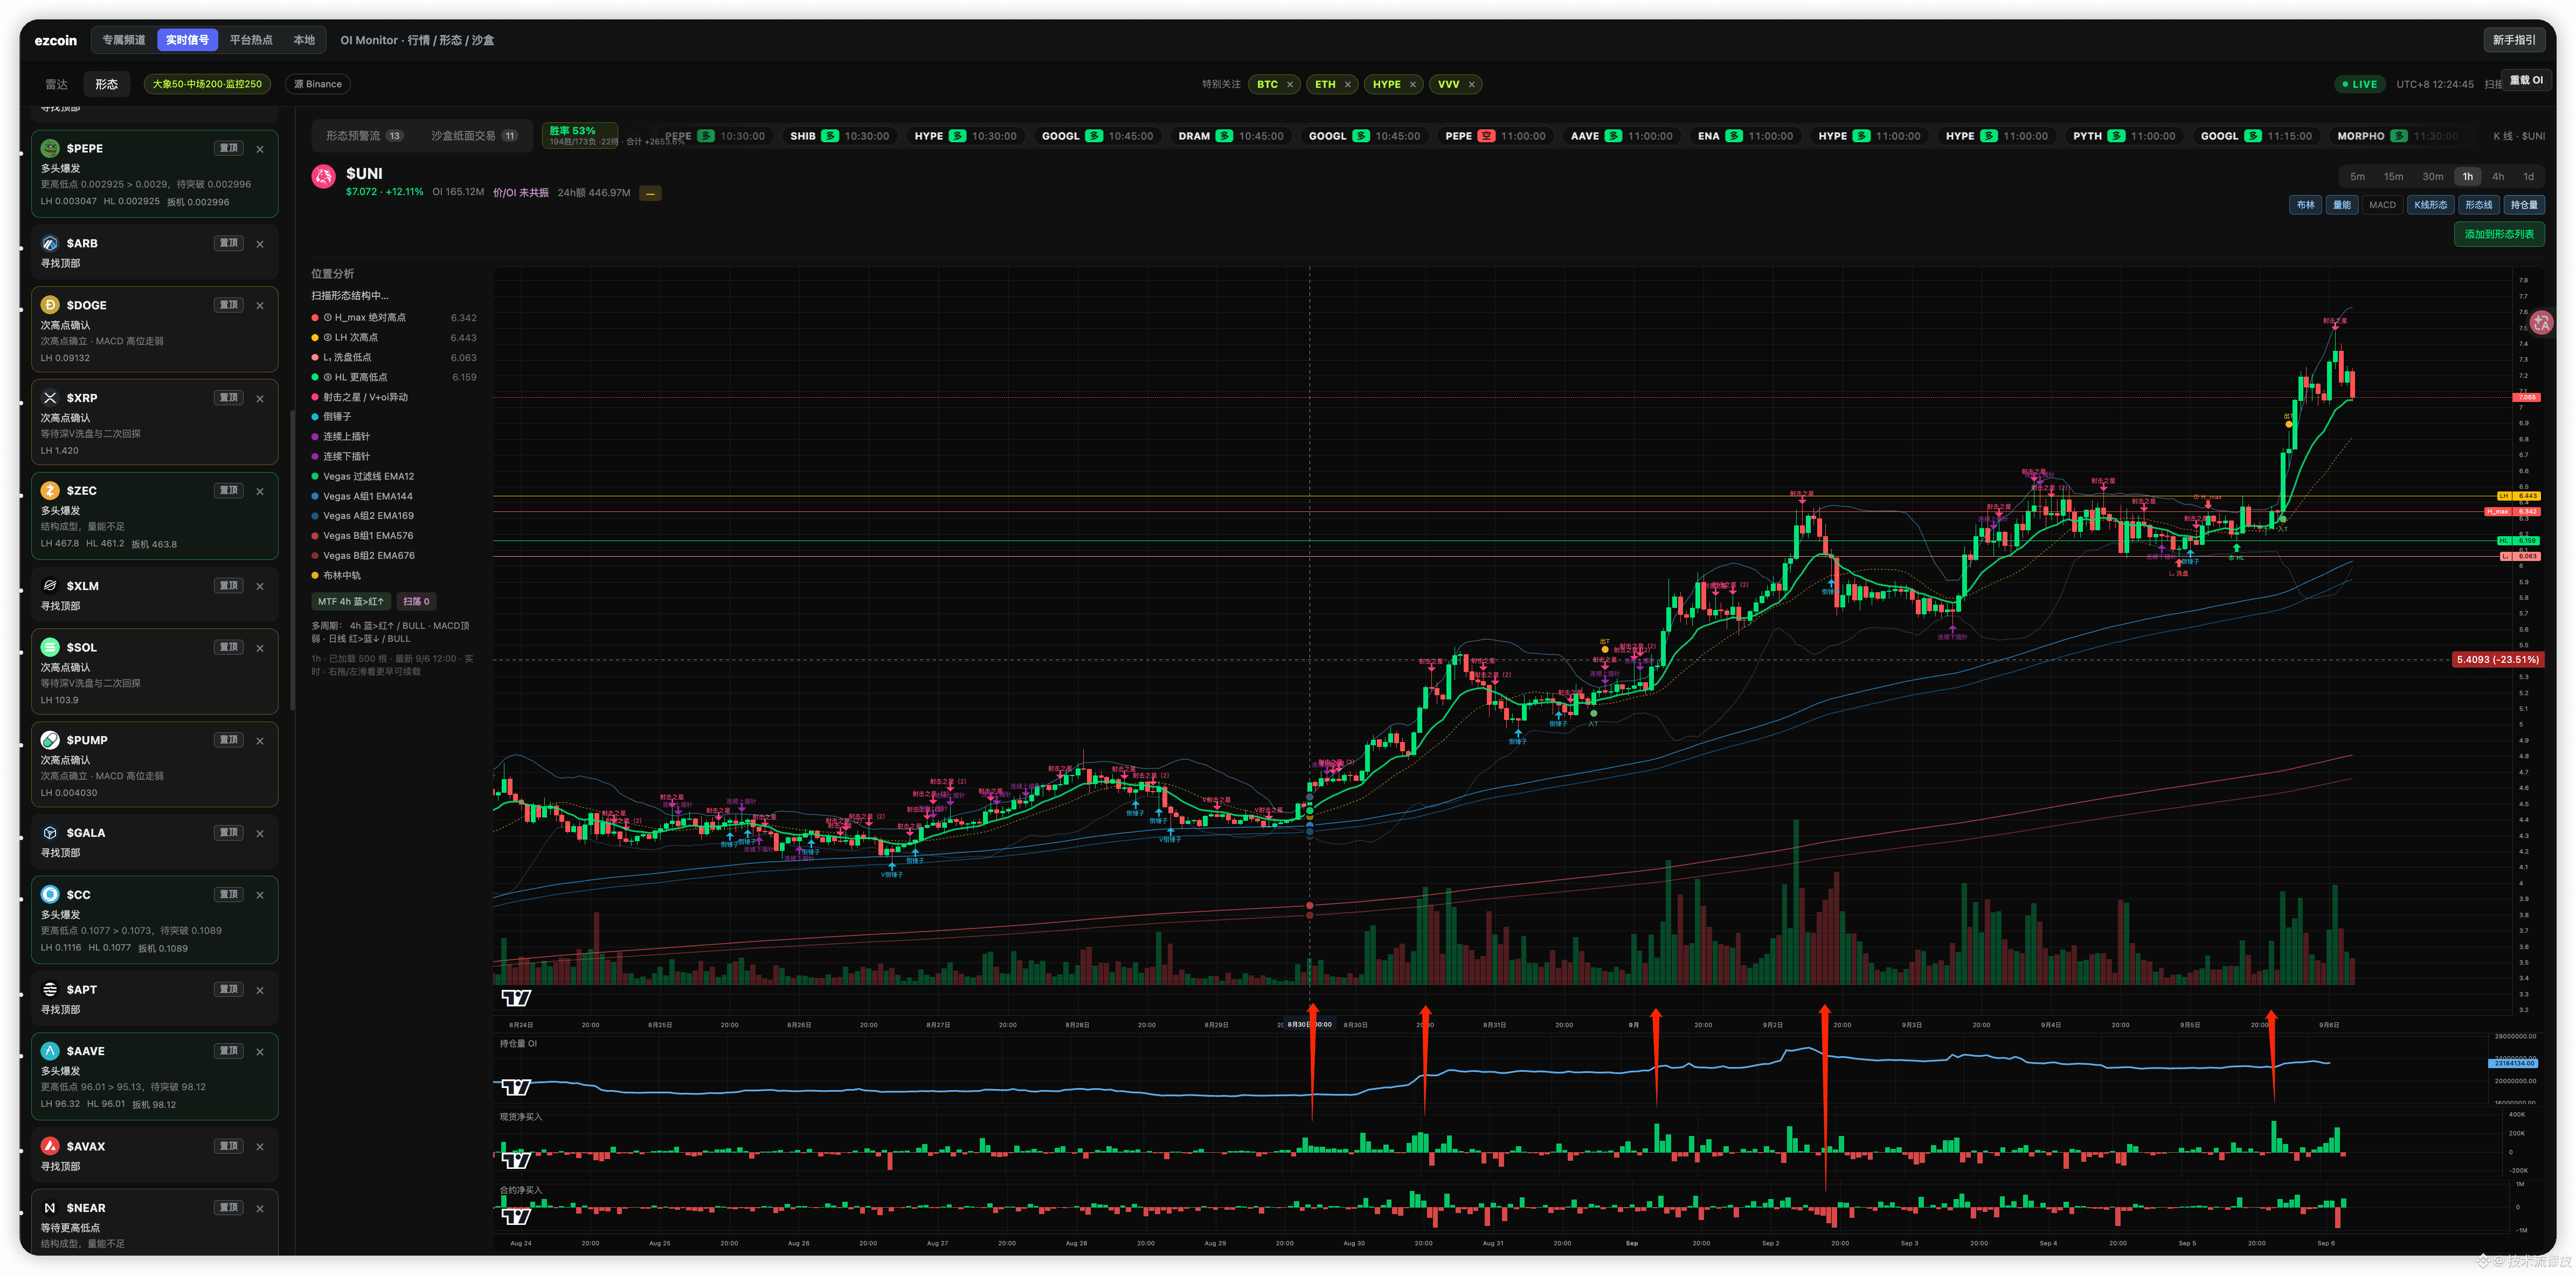
Data doesn’t lie — learn to understand the “clear-as-day accumulation” by the big players 🧵👇
Many retail traders only look at the big green K-line candles, but the “smart money” has already written the answer all over the indicators:
1️⃣ Spot net buying (accumulation by the main players): During the choppy shakeout phase, the spot histogram repeatedly shows strong buy orders (the red arrow in the chart). This means real cash is absorbing sell pressure, indicating determined players locking in chips.
2. Open interest (OI anomaly): Open interest starts rising before the price rally, and after the tug-of-war between longs and shorts, shorts get liquidated/squeezed, directly fueling the ammunition for the subsequent breakout.
3. Futures buy-sell imbalance: During the shakeout, futures capital gets shaken out, and only after the main uptrend begins do traders chase in reluctantly.
Conclusion: Spot-led accumulation + open interest moving before price = a highly favorable risk-reward setup. Don’t wait until it’s already blown up before chasing higher!
#Crypto #BTC #Trading #TechnicalAnalysis #WyckoffMethod $UNI
Data doesn’t lie — learn to understand the “clear-as-day accumulation” by the big players 🧵👇
Many retail traders only look at the big green K-line candles, but the “smart money” has already written the answer all over the indicators:
1️⃣ Spot net buying (accumulation by the main players): During the choppy shakeout phase, the spot histogram repeatedly shows strong buy orders (the red arrow in the chart). This means real cash is absorbing sell pressure, indicating determined players locking in chips.
2. Open interest (OI anomaly): Open interest starts rising before the price rally, and after the tug-of-war between longs and shorts, shorts get liquidated/squeezed, directly fueling the ammunition for the subsequent breakout.
3. Futures buy-sell imbalance: During the shakeout, futures capital gets shaken out, and only after the main uptrend begins do traders chase in reluctantly.
Conclusion: Spot-led accumulation + open interest moving before price = a highly favorable risk-reward setup. Don’t wait until it’s already blown up before chasing higher!
#Crypto #BTC #Trading #TechnicalAnalysis #WyckoffMethod $UNI
Many retail traders only look at the big green K-line candles, but the “smart money” has already written the answer all over the indicators:
1️⃣ Spot net buying (accumulation by the main players): During the choppy shakeout phase, the spot histogram repeatedly shows strong buy orders (the red arrow in the chart). This means real cash is absorbing sell pressure, indicating determined players locking in chips.
2. Open interest (OI anomaly): Open interest starts rising before the price rally, and after the tug-of-war between longs and shorts, shorts get liquidated/squeezed, directly fueling the ammunition for the subsequent breakout.
3. Futures buy-sell imbalance: During the shakeout, futures capital gets shaken out, and only after the main uptrend begins do traders chase in reluctantly.
Conclusion: Spot-led accumulation + open interest moving before price = a highly favorable risk-reward setup. Don’t wait until it’s already blown up before chasing higher!
#Crypto #BTC #Trading #TechnicalAnalysis #WyckoffMethod $UNI
293
·
--
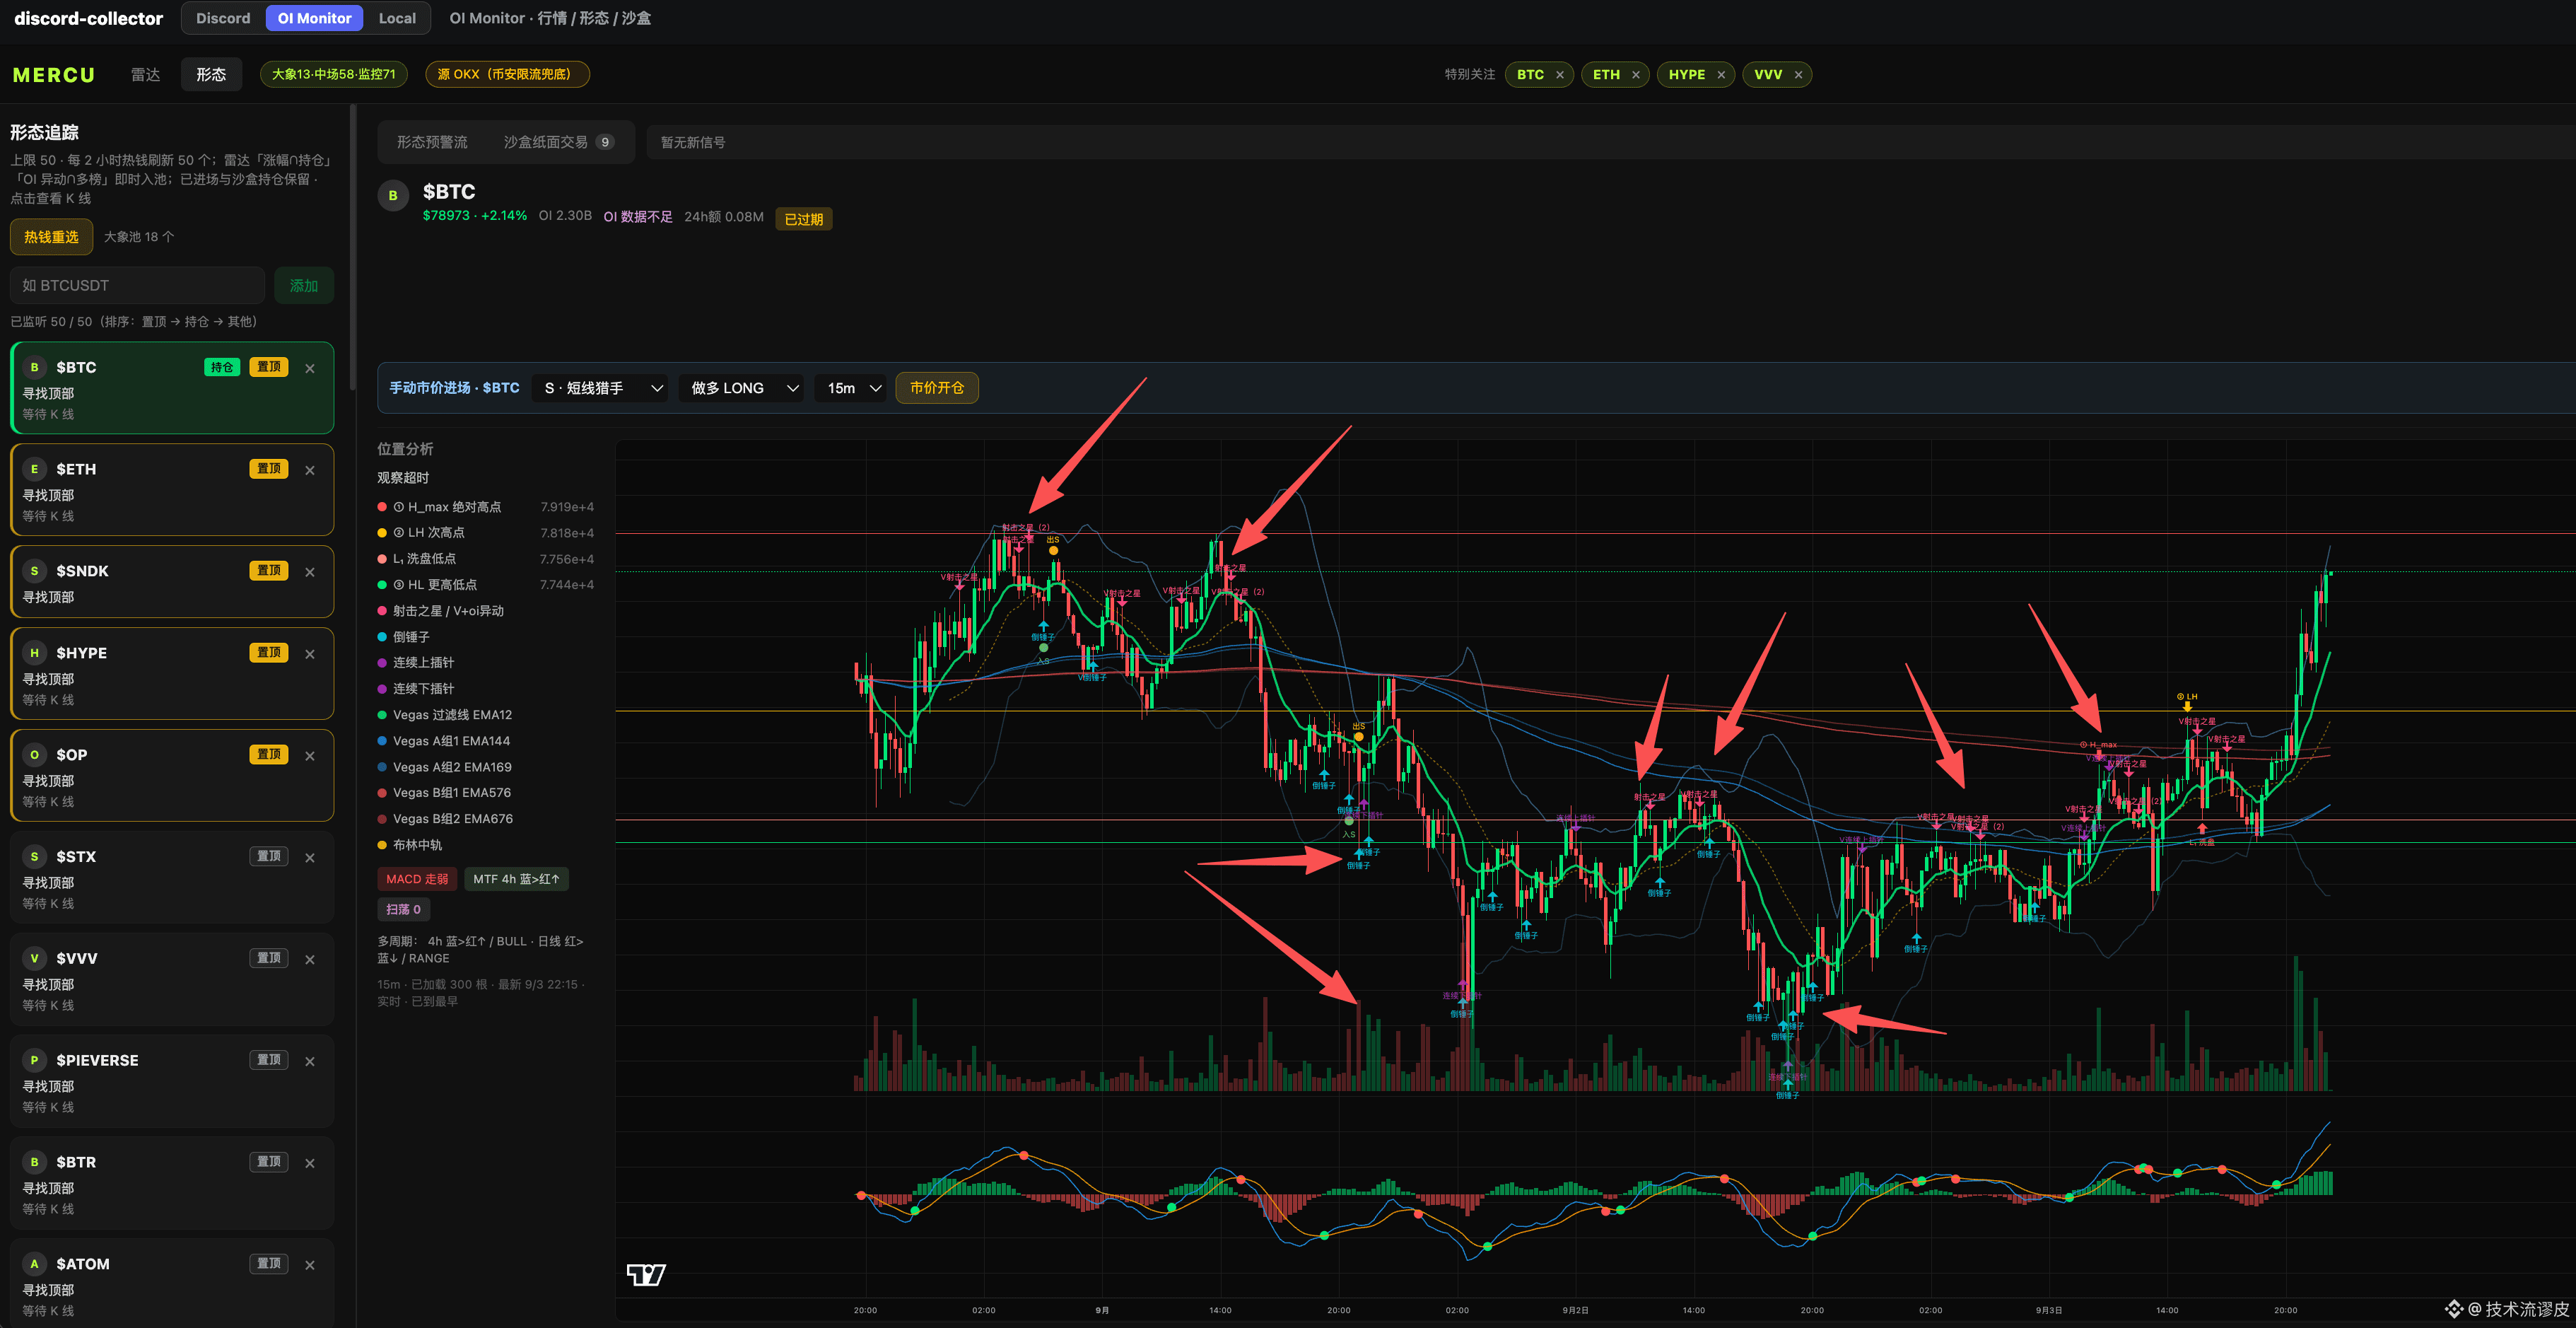
A classic double-bottom reversal; the candlestick patterns are quite accurate, and it would be even more precise if you add a bit of volume-price analysis.
A classic double-bottom reversal; the candlestick patterns are quite accurate, and it would be even more precise if you add a bit of volume-price analysis.
298
Log in to explore more content
Join global crypto users on Binance Square
⚡️ Get latest and useful information about crypto.
💬 Trusted by the world’s largest crypto exchange.
👍 Discover real insights from verified creators.
Email / Phone number
Trending Topics
EtherGains70.9%InQ3
61,860 views
723 Discussing
🧭🧭🧭 Analysis 🧭🧭🧭
💡 Altcoin Season Indicator 💡
🚨🚨🚨 The third quarter (Q3) has closed. ETH is up 71% and BTC is up 43%. 🚨🚨🚨
Was this the start of altcoin season?
Among the top 100:
🌐🌐🌐 57 outperformed BTC over the last 90 days
Altcoin season starts at 75, so it is still
It is also only advancing 10 points from its annual peak at 67 🌐🌐
💥💥💥 But wait, a month ago the indicator was only at 23!
Can October push it to 75? 👀💥💥💥
Please follow up
#EtherGains70.9%InQ3
$GRAM
Shamika Metting
·2 Likes
·540 views
TreasuryLetsStatesFileStablecoinCertificationsEarly
2,588 views
33 Discussing
US10YearYieldNears5.3%
93,824 views
868 Discussing