
fulldeg
287 Posts

fulldeg
Report
Block User
Full Time Trader
Mathematician & Economist
Using #Binance to trade.
Twitter: @fulldeg
0 Following
13.6K+ Followers
4.0K+ Liked
Posts
All
Quotes
·
--
Bullish
🤝 What is Pairs Trading?
Remember when I said I consistently make profits?
Here’s the why — and more importantly, the how.
Pairs Trading is a market-neutral strategy rooted in statistics and mathematics, not gambling, guessing, or gut feelings.
This is not luck.
This is a quantitative model based on data and logic.
🔍 How Does It Work?
Let me break it down simply:
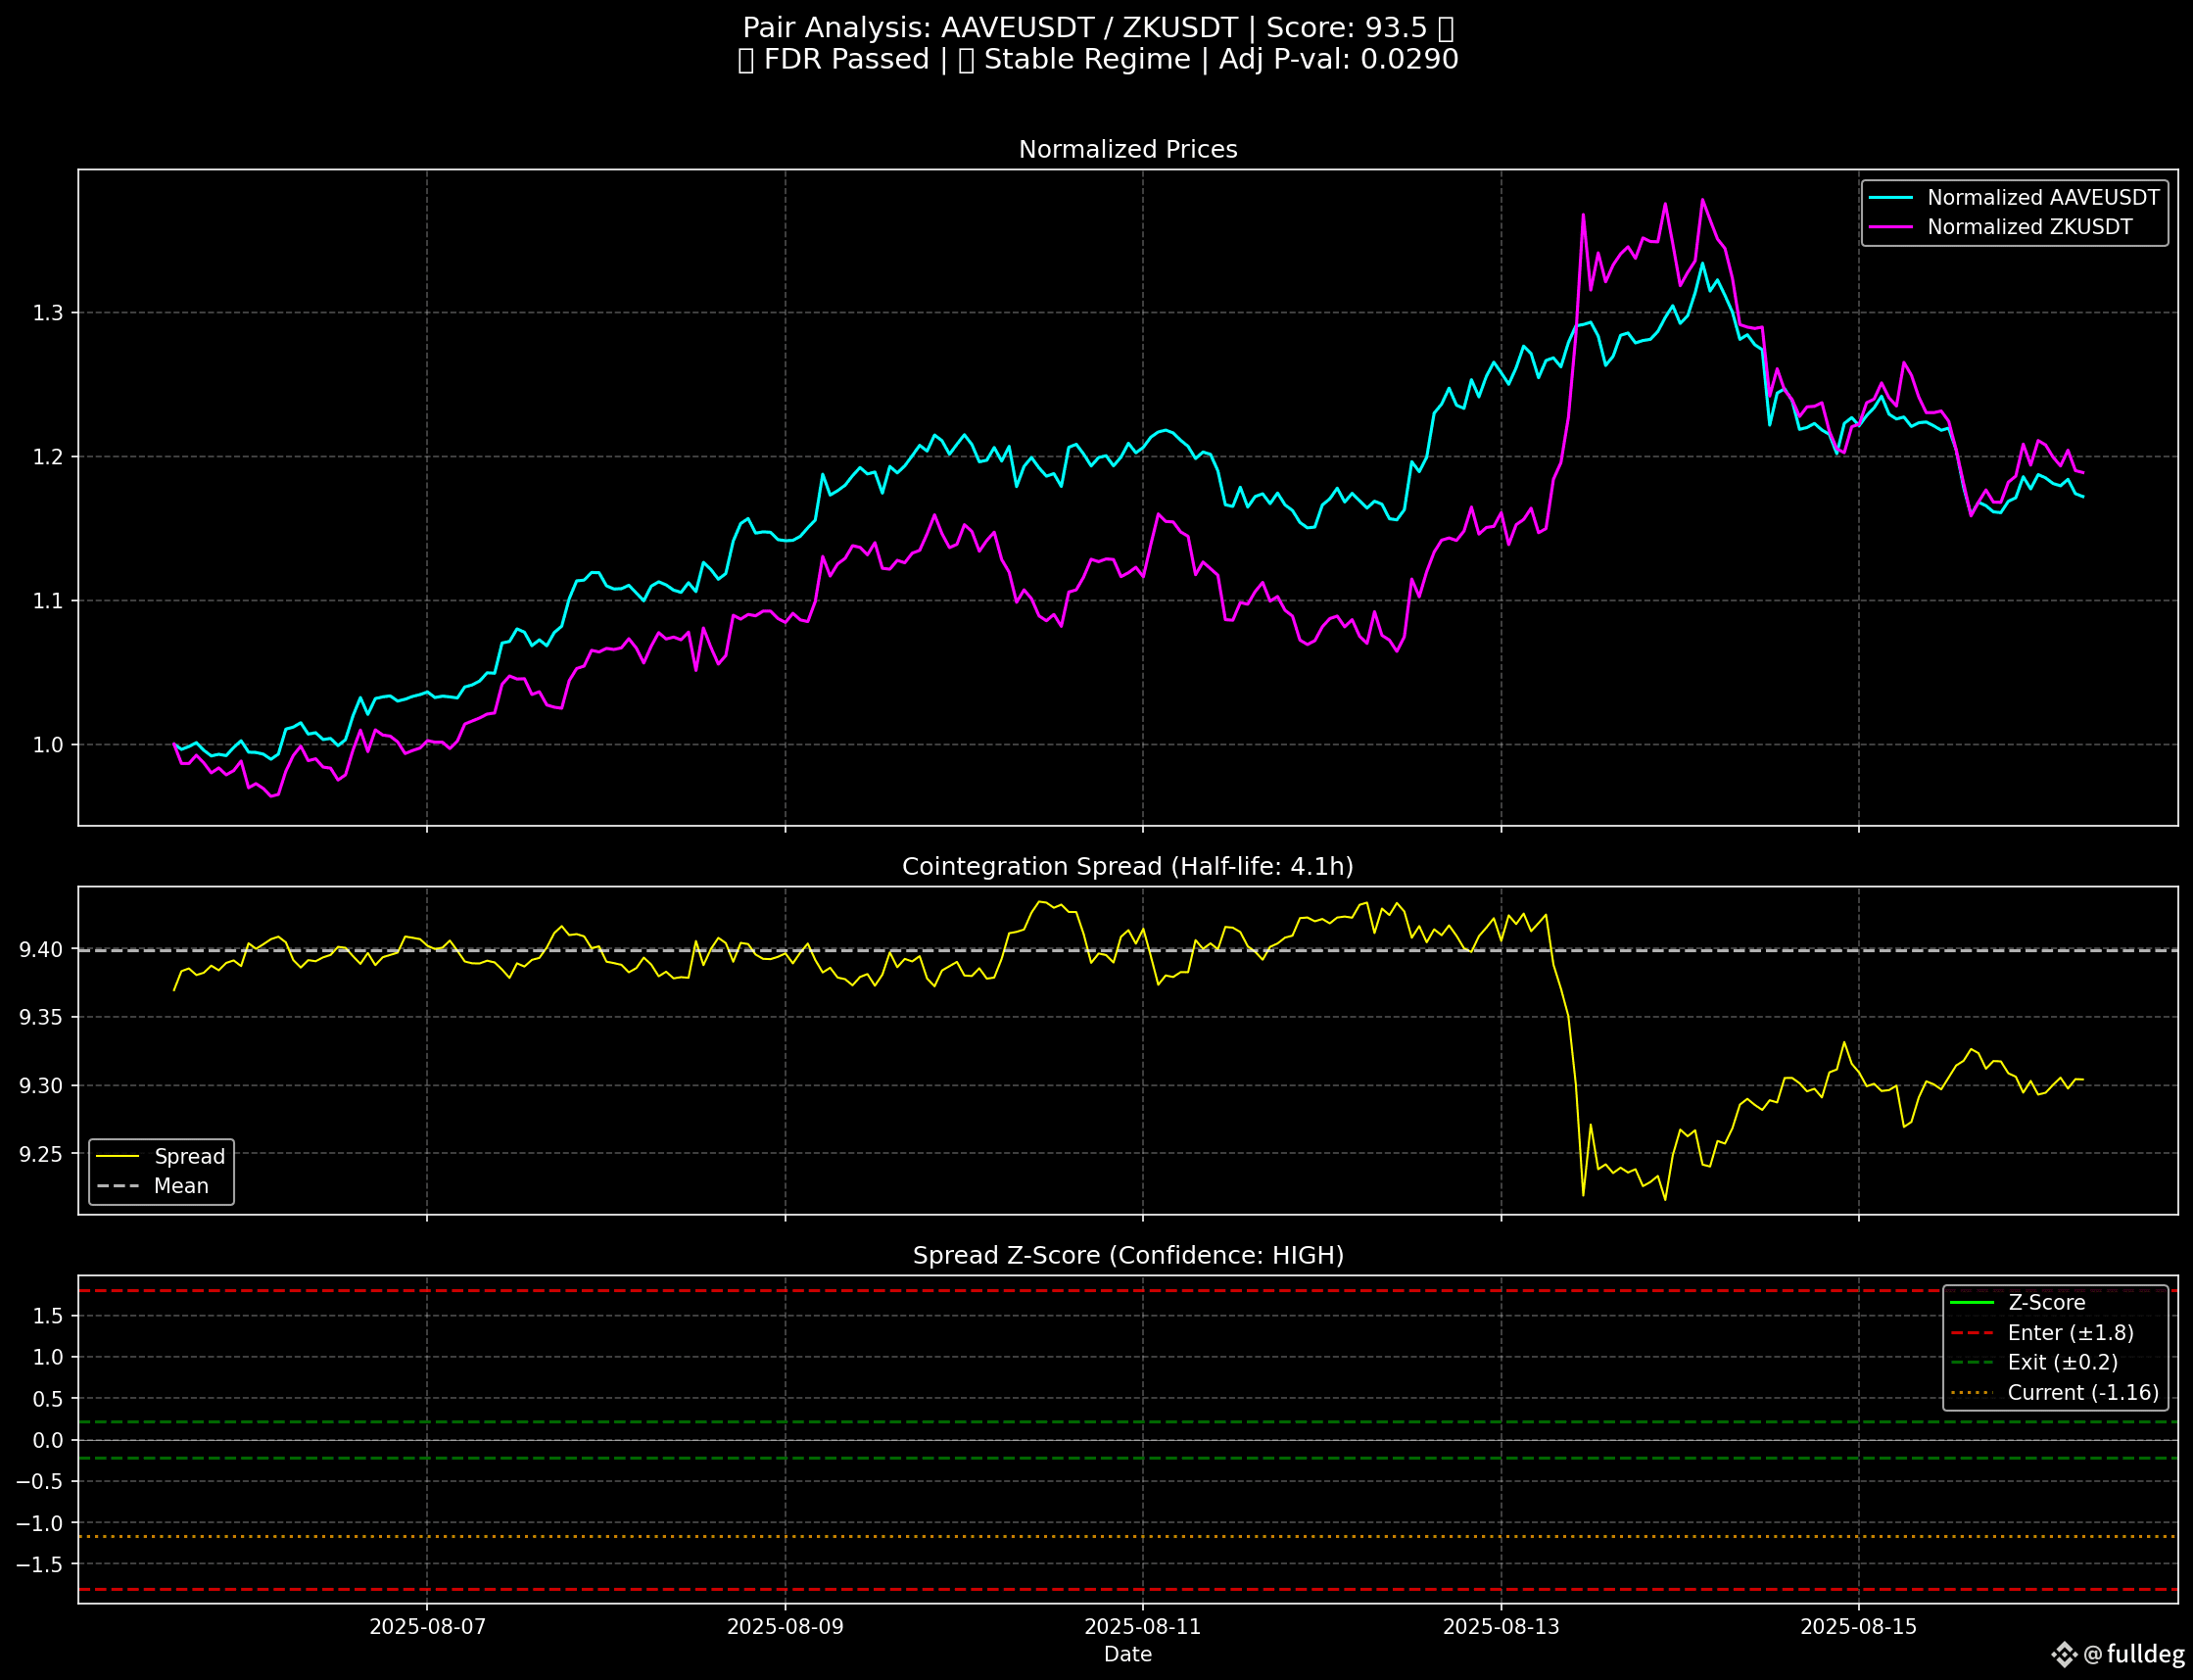
Pick a Pair: Choose two highly correlated assets (e.g., ETH & ETC).
Monitor the Spread: Track the price difference (spread) between them.
Model the Relationship: Use statistical methods to determine the “normal” spread range.
Exploit Deviations:
When the spread deviates significantly from the norm,
go long on the undervalued asset and short the overvalued one.
Profit on Reversion:
As the spread returns to normal, the positions are closed — with a profit.
📐 Why It’s Not Gambling
This approach is:
✅ Backed by historical data
✅ Grounded in mathematics
✅ Systematic and repeatable
✅ Free from emotion and noise
I'm not just randomly buying and selling. I’m not chasing pumps.
I’m a mathematician and a quant, with backgrounds in both Mathematics and Economics, and soon starting my Master’s in Quantitative Finance.
This is research-backed strategy execution, not hope-based trading.
💡 In Short:
I’m not trading based on hunches.
I’m running a mean-reversion engine built on math.
And often — just like the stats say — it works.
👍 Like this post if you're curious.
📚 Because in the next ones, I’ll share:
How I select pairs
What cointegration and z-score really mean
A full working Pairs Trading script in Python
Stay tuned.
Stay smart.
🤝 What is Pairs Trading?
Remember when I said I consistently make profits?
Here’s the why — and more importantly, the how.
Pairs Trading is a market-neutral strategy rooted in statistics and mathematics, not gambling, guessing, or gut feelings.
This is not luck.
This is a quantitative model based on data and logic.
🔍 How Does It Work?
Let me break it down simply:
Pick a Pair: Choose two highly correlated assets (e.g., ETH & ETC).
Monitor the Spread: Track the price difference (spread) between them.
Model the Relationship: Use statistical methods to determine the “normal” spread range.
Exploit Deviations:
When the spread deviates significantly from the norm,
go long on the undervalued asset and short the overvalued one.
Profit on Reversion:
As the spread returns to normal, the positions are closed — with a profit.
📐 Why It’s Not Gambling
This approach is:
✅ Backed by historical data
✅ Grounded in mathematics
✅ Systematic and repeatable
✅ Free from emotion and noise
I'm not just randomly buying and selling. I’m not chasing pumps.
I’m a mathematician and a quant, with backgrounds in both Mathematics and Economics, and soon starting my Master’s in Quantitative Finance.
This is research-backed strategy execution, not hope-based trading.
💡 In Short:
I’m not trading based on hunches.
I’m running a mean-reversion engine built on math.
And often — just like the stats say — it works.
👍 Like this post if you're curious.
📚 Because in the next ones, I’ll share:
How I select pairs
What cointegration and z-score really mean
A full working Pairs Trading script in Python
Stay tuned.
Stay smart.
Remember when I said I consistently make profits?
Here’s the why — and more importantly, the how.
Pairs Trading is a market-neutral strategy rooted in statistics and mathematics, not gambling, guessing, or gut feelings.
This is not luck.
This is a quantitative model based on data and logic.
🔍 How Does It Work?
Let me break it down simply:
Pick a Pair: Choose two highly correlated assets (e.g., ETH & ETC).
Monitor the Spread: Track the price difference (spread) between them.
Model the Relationship: Use statistical methods to determine the “normal” spread range.
Exploit Deviations:
When the spread deviates significantly from the norm,
go long on the undervalued asset and short the overvalued one.
Profit on Reversion:
As the spread returns to normal, the positions are closed — with a profit.
📐 Why It’s Not Gambling
This approach is:
✅ Backed by historical data
✅ Grounded in mathematics
✅ Systematic and repeatable
✅ Free from emotion and noise
I'm not just randomly buying and selling. I’m not chasing pumps.
I’m a mathematician and a quant, with backgrounds in both Mathematics and Economics, and soon starting my Master’s in Quantitative Finance.
This is research-backed strategy execution, not hope-based trading.
💡 In Short:
I’m not trading based on hunches.
I’m running a mean-reversion engine built on math.
And often — just like the stats say — it works.
👍 Like this post if you're curious.
📚 Because in the next ones, I’ll share:
How I select pairs
What cointegration and z-score really mean
A full working Pairs Trading script in Python
Stay tuned.
Stay smart.
fulldeg
·
--
Bullish💰 I keep printing money. Curious how?
It's called Pairs Trading — and it's not luck, it's strategy.
🔥 Smash that like if you're intrigued,
because my next post will drop the alpha.
Get ready to learn how I do this step-by-step.
📈 Stay tuned, stay profitable.
It's called Pairs Trading — and it's not luck, it's strategy.
🔥 Smash that like if you're intrigued,
because my next post will drop the alpha.
Get ready to learn how I do this step-by-step.
📈 Stay tuned, stay profitable.
2
785
·
--
Bullish
🚨 BTC Market Pulse – Multi-Timeframe Breakdown 🚨
Here’s what the Bitcoin charts are whispering across all major timeframes 👇
📅 1D (Daily Chart)
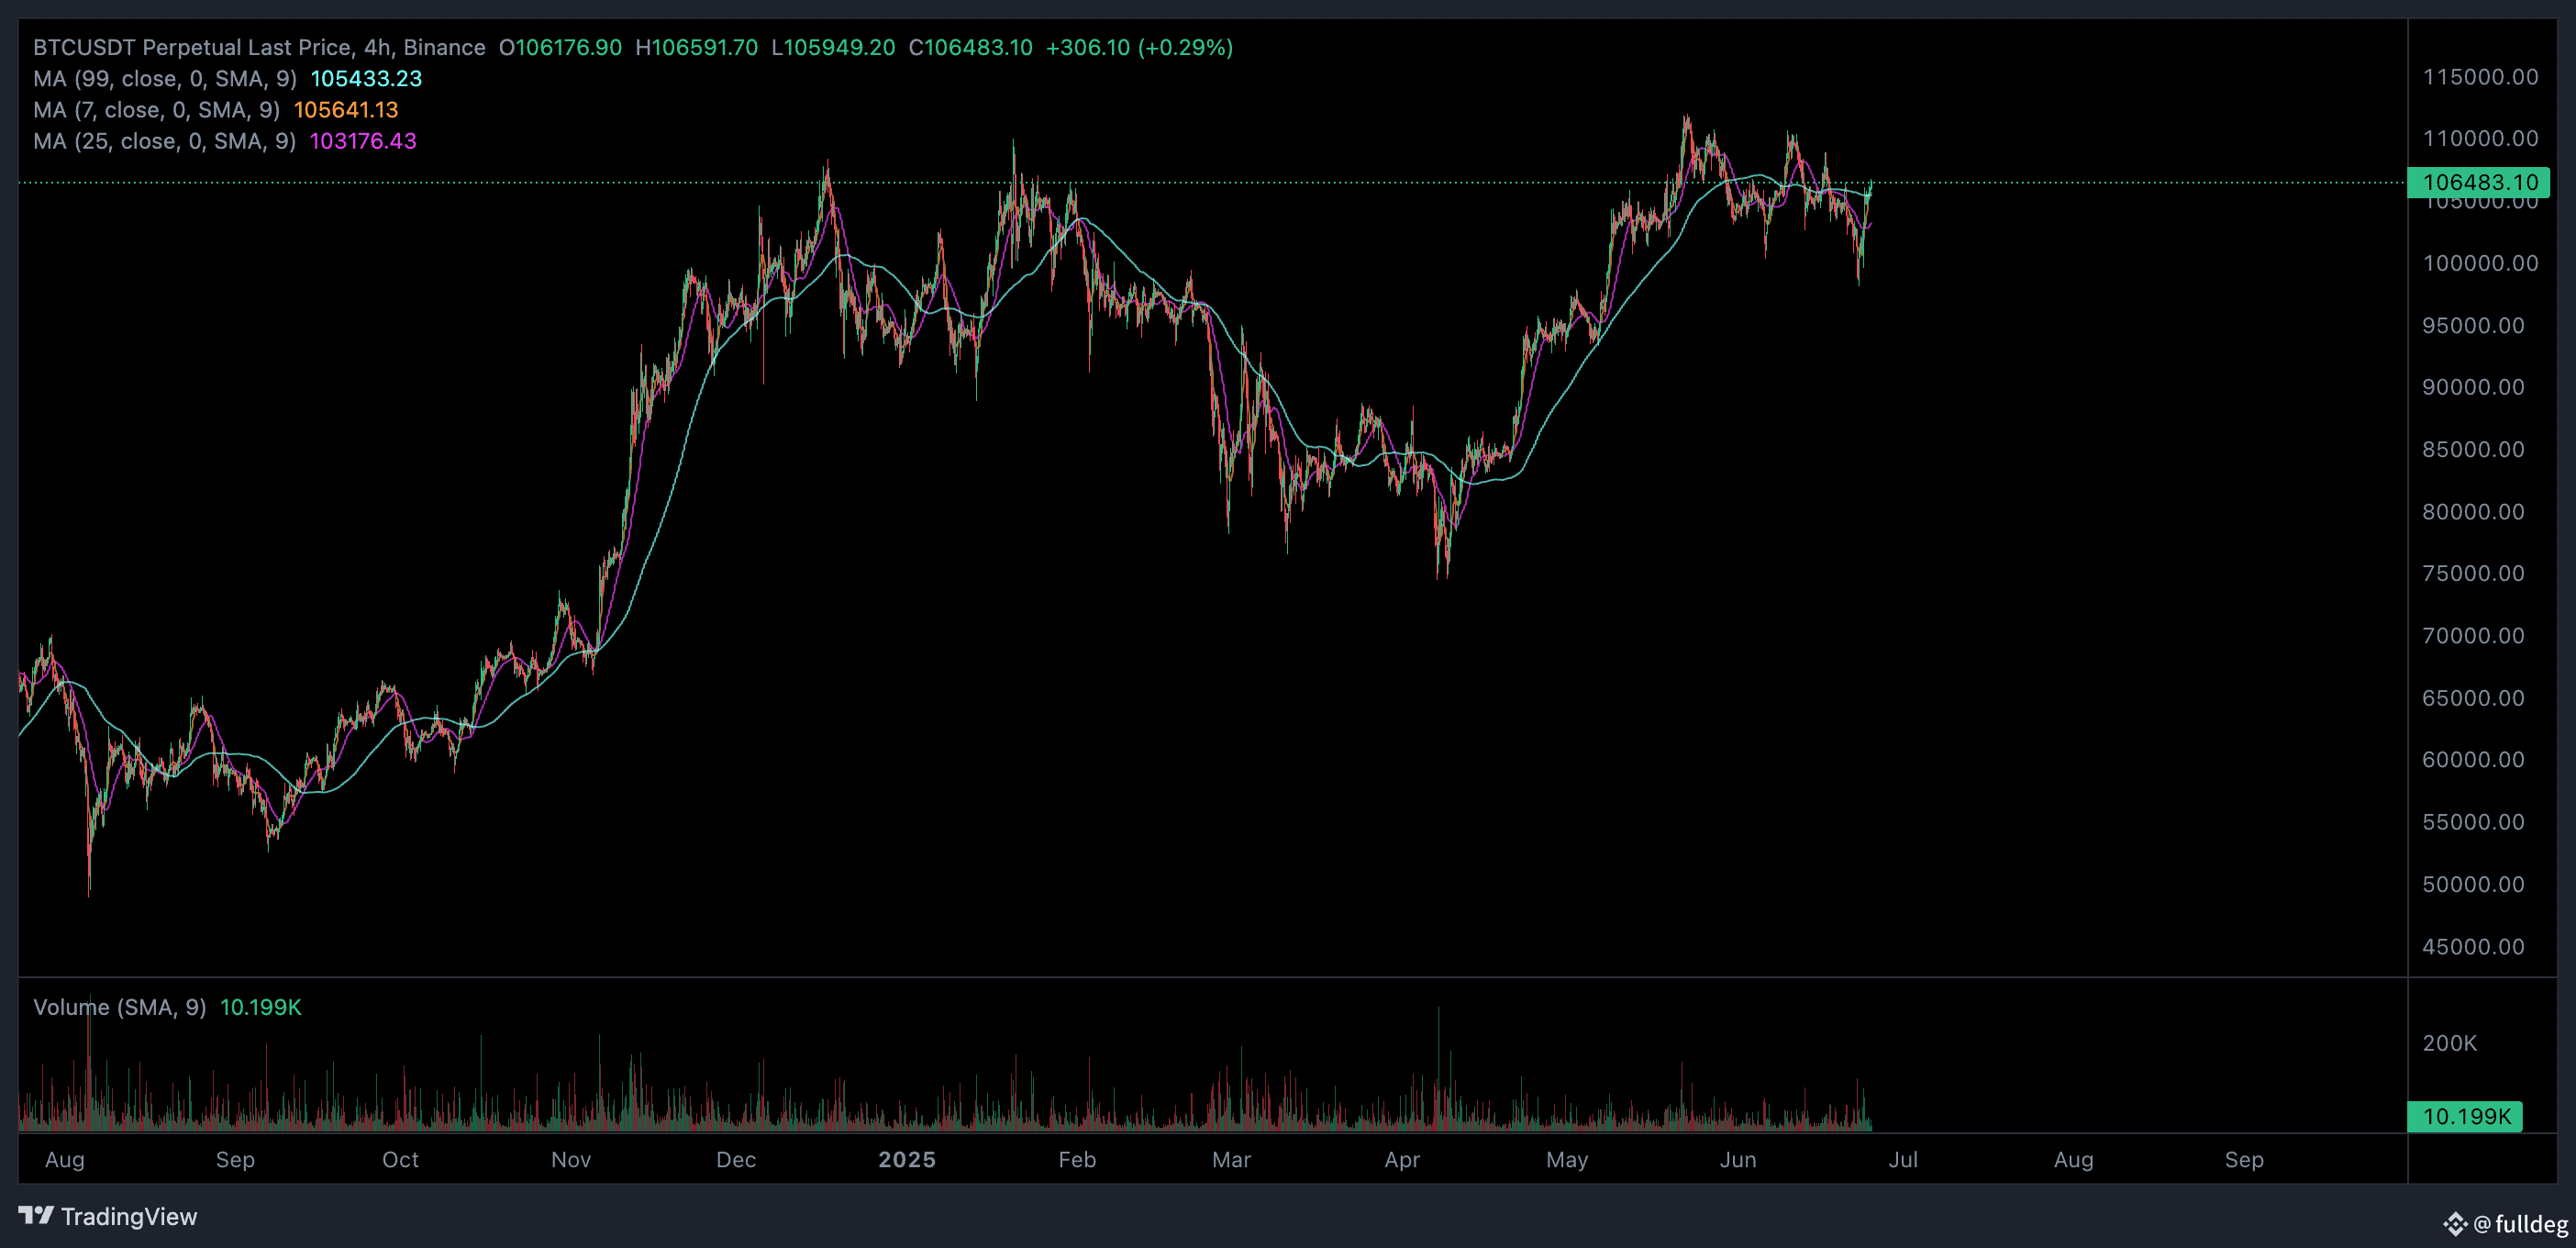
Bitcoin continues to hold a strong macro uptrend structure. We’re trading above all major SMAs (7, 25, and 99), with price consolidating around 106.5K. The 7-day SMA has bounced cleanly off the 25 SMA, which is typically a bullish continuation signal. Momentum remains intact unless price dips below ~104K.
⏰ 4H (4-Hour Chart)
A healthy correction followed by a strong recovery — BTC reclaimed its MAs and is again pressing up toward recent highs. Bulls are clearly defending dips. However, resistance around the 110K zone may require volume to break cleanly. Short-term structure looks like a bull flag.
🕐 1H (1-Hour Chart)
We’ve reclaimed 106K after the recent dip, now hovering above all SMAs again. Microstructure is showing higher lows and higher highs, a good sign. As long as we stay above 105.5K, the bias favors a push higher.
🕒 15M (15-Min Chart)
We’re seeing some sideways chop after the sharp rebound — classic cool-off behavior. Volume is lighter, and candles are tightening. Watch for a range breakout, likely around the 107K mark. If that breaks, 110K retest is back on the table.
📌 TL;DR
Trend = Up across all timeframes
Momentum = Strong, but 110K remains a critical resistance
Watch 105.5K–107K as the key intraday range
Possible breakout brewing – patience may pay 📈
Stay sharp, fam. Markets move fast — but with structure like this, we just might be warming up for the next leg.
#Bitcoin #BTCUSDT #CryptoTrading #BinanceSquare
{future}(BTCUSDT)
{future}(OMUSDT)
{future}(ETHUSDT)
🚨 BTC Market Pulse – Multi-Timeframe Breakdown 🚨
Here’s what the Bitcoin charts are whispering across all major timeframes 👇
📅 1D (Daily Chart)
Bitcoin continues to hold a strong macro uptrend structure. We’re trading above all major SMAs (7, 25, and 99), with price consolidating around 106.5K. The 7-day SMA has bounced cleanly off the 25 SMA, which is typically a bullish continuation signal. Momentum remains intact unless price dips below ~104K.
⏰ 4H (4-Hour Chart)
A healthy correction followed by a strong recovery — BTC reclaimed its MAs and is again pressing up toward recent highs. Bulls are clearly defending dips. However, resistance around the 110K zone may require volume to break cleanly. Short-term structure looks like a bull flag.
🕐 1H (1-Hour Chart)
We’ve reclaimed 106K after the recent dip, now hovering above all SMAs again. Microstructure is showing higher lows and higher highs, a good sign. As long as we stay above 105.5K, the bias favors a push higher.
🕒 15M (15-Min Chart)
We’re seeing some sideways chop after the sharp rebound — classic cool-off behavior. Volume is lighter, and candles are tightening. Watch for a range breakout, likely around the 107K mark. If that breaks, 110K retest is back on the table.
📌 TL;DR
Trend = Up across all timeframes
Momentum = Strong, but 110K remains a critical resistance
Watch 105.5K–107K as the key intraday range
Possible breakout brewing – patience may pay 📈
Stay sharp, fam. Markets move fast — but with structure like this, we just might be warming up for the next leg.
#Bitcoin #BTCUSDT #CryptoTrading #BinanceSquare
Here’s what the Bitcoin charts are whispering across all major timeframes 👇
📅 1D (Daily Chart)
Bitcoin continues to hold a strong macro uptrend structure. We’re trading above all major SMAs (7, 25, and 99), with price consolidating around 106.5K. The 7-day SMA has bounced cleanly off the 25 SMA, which is typically a bullish continuation signal. Momentum remains intact unless price dips below ~104K.
⏰ 4H (4-Hour Chart)
A healthy correction followed by a strong recovery — BTC reclaimed its MAs and is again pressing up toward recent highs. Bulls are clearly defending dips. However, resistance around the 110K zone may require volume to break cleanly. Short-term structure looks like a bull flag.
🕐 1H (1-Hour Chart)
We’ve reclaimed 106K after the recent dip, now hovering above all SMAs again. Microstructure is showing higher lows and higher highs, a good sign. As long as we stay above 105.5K, the bias favors a push higher.
🕒 15M (15-Min Chart)
We’re seeing some sideways chop after the sharp rebound — classic cool-off behavior. Volume is lighter, and candles are tightening. Watch for a range breakout, likely around the 107K mark. If that breaks, 110K retest is back on the table.
📌 TL;DR
Trend = Up across all timeframes
Momentum = Strong, but 110K remains a critical resistance
Watch 105.5K–107K as the key intraday range
Possible breakout brewing – patience may pay 📈
Stay sharp, fam. Markets move fast — but with structure like this, we just might be warming up for the next leg.
#Bitcoin #BTCUSDT #CryptoTrading #BinanceSquare
408
Log in to explore more content
Join global crypto users on Binance Square
⚡️ Get latest and useful information about crypto.
💬 Trusted by the world’s largest crypto exchange.
👍 Discover real insights from verified creators.
Email / Phone number
Trending Topics
AppleDebutsFoldablePhone
9,580 views
222 Discussing
$BTC
Apple just released a foldable phone
Apple fans are calculating installments
Old “weak hands” are figuring out how many BTC
Brothers
Apple finally can’t hold it back anymore
Its first foldable phone
iPhone Duo
Starts at 15,999 yuan in mainland China
The top configuration goes straight up to 26,499
I swear—when I saw the price
my first reaction wasn’t “too expensive”
It was, “Quick, open the exchange and calculate.”
Based on the current coin price,
this phone is about 0.025 BTC
0.025 BTC
Doesn’t sound like much, right?
But go look at history.
When the iPhone 4s launched back then,
the price translated to 162 BTC
iPhone 6 was 1.7 BTC
iPhone 13 was 0.018 BTC
iPhone 17 was 0.007 BTC
Got the trend now?
It’s not that your money is growing
It’s Bitcoin diluting Apple’s pricing for you
What’s interesting is that at the event itself,
Apple’s stock price rode a roller coaster.
It got hit at the open—then it bounced back.
By the close, it finished down slightly.
Whether the market thinks this high-priced foldable phone can sell big—
there’s quite a split 😂😂
But brothers,
don’t see Apple releasing a new phone and start imagining that “tech bull run” is here.
The big-bag (BTC) needs to follow the trend
Apple doesn’t have a direct capital pipeline to the crypto market.
No matter how many phones it sells,
not a single automatic cent flows into crypto.
This is only a hardware tailwind on the consumer side,
not the big logic that directly pushes BTC higher.
BTC’s pricing main driver is still
the Fed cutting rates and US Treasury yields.
Apple’s new product is just a small industry hotspot.
It can only boost sector sentiment in the short term.
It can’t change the big market’s overall trend.
If you were already planning to change your phone,
and you also happen to have some spare money worth 0.025 BTC in hand
Would you buy it?
#appledebutsfoldablephone
孔大锤
·2 Likes
·2.1k views
EUExtendsCentralContactPointToCASPs
30 views
10 Discussing
US10YTreasuryYieldHitsHighestSinceNov2023
13,496 views
247 Discussing