
BNB Fox
3.3k Posts

BNB Fox
 Square Verified
Report
Block User
Tired of crypto noise? I share what actually matters. No hype, just clarity. Follow for the edge 🦊 X: @Fox_BNB_
Open Trade
Frequent Trader
2.2 Years
565 Following
30.0K+ Followers
5.1K+ Liked
Posts
Portfolio
·
--
Article
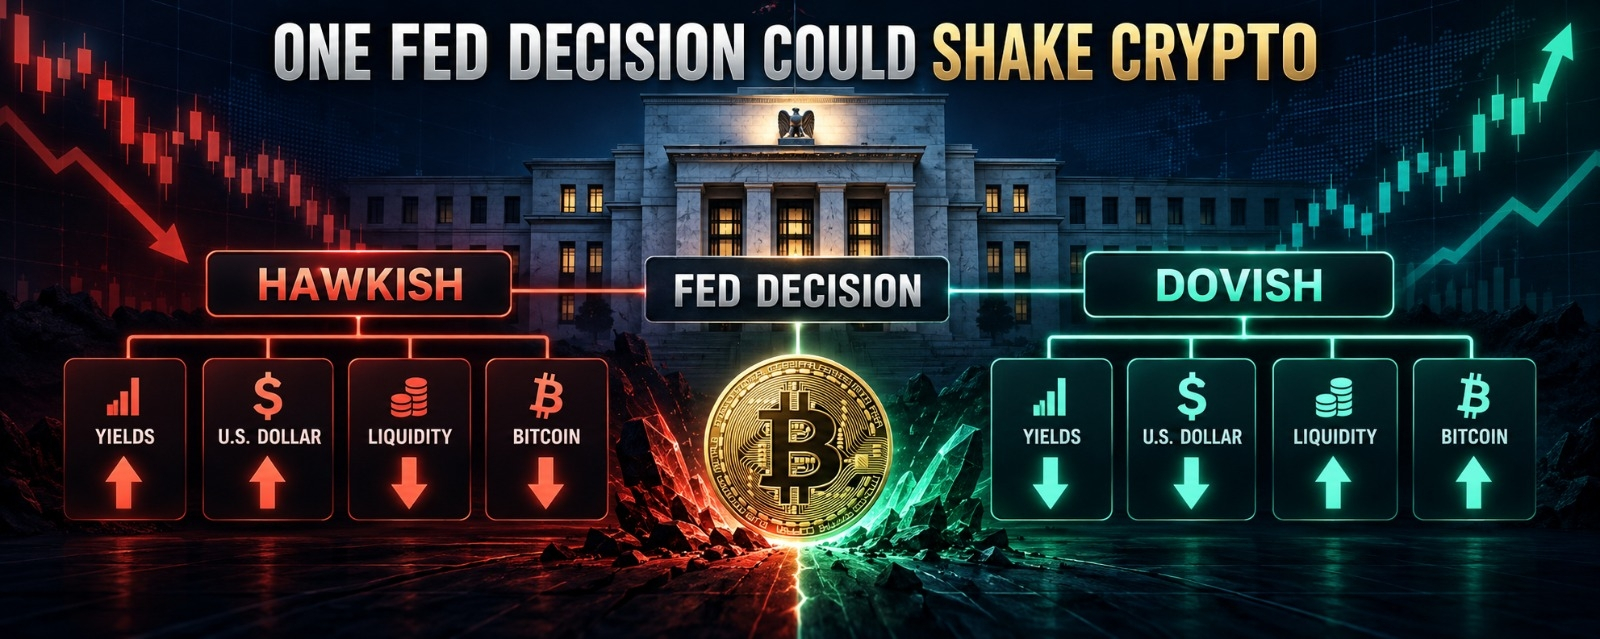
One Fed Decision Could Shake CryptoI have rarely seen a Federal Reserve meeting approach with expectations this divided. The Fed will announce its next interest-rate decision on September 16, and the market is no longer debating a simple choice between holding and cutting. A rate increase has returned as a realistic possibility. That uncertainty matters because crypto has spent months adapting to the idea that monetary conditions would eventually become easier.
The Fed’s decision exists inside an uncomfortable combination of persistent inflation, resilient employment and rising energy prices. Strong economic data may look positive on the surface, but it gives policymakers less reason to support growth through lower rates. Oil above $100 creates another problem because higher transportation and production costs can spread through the economy. If the Fed believes inflation could accelerate again, it may keep rates unchanged while delivering a warning—or raise them outright.
What I think many crypto traders overlook is that the interest rate itself is only one part of the mechanism. The more important question is how the decision changes the expected path of money. Markets continuously compare the return available from risky assets with the yield offered by government debt and cash-like instruments. When safe yields rise, investors require stronger potential returns before taking risk elsewhere. Bitcoin does not suddenly lose its scarcity, and a blockchain does not stop producing blocks, but the price investors are willing to pay for those qualities can decline.
This is how traders interact with the Fed without ever dealing with the central bank directly. They respond through Bitcoin, technology shares, Treasury yields, the dollar, perpetual futures and stablecoins. A hawkish surprise can strengthen the dollar, increase yields and force leveraged crypto positions to close. Liquidations then create selling that appears much larger than the original change in policy justified.
The opposite reaction is also possible. If the Fed holds rates and suggests that further tightening is unlikely, traders may interpret it as a limit on financial pressure. Bitcoin could recover quickly as short positions close and sidelined capital returns. Yet a hold would not automatically be bullish. If the accompanying projections show rates remaining elevated for longer, the initial rise could fade once the market studies the details.
That is the uncomfortable truth about this meeting: the headline decision may matter less than the language surrounding it. The new economic projections, inflation forecasts and expected rate path can reshape liquidity assumptions for several months. Even a widely anticipated decision can produce volatility if the Fed’s future outlook conflicts with market positioning.
I would watch stablecoin balances, spot trading volume, funding rates and exchange inflows after the announcement. Rising stablecoin supply alongside genuine spot demand would suggest that capital is returning with patience. A sharp move driven mainly by leveraged futures would be less convincing. Similarly, heavy Bitcoin deposits to exchanges during rising funding rates could show that traders are chasing a fragile reaction.
This moment fits a phase of the market cycle where liquidity matters more than narrative. Crypto has matured institutionally, but it has not escaped the price of money. The Fed cannot determine Bitcoin’s long-term value, yet it can influence who has the confidence and available capital to hold it today.
My conviction is not that one decision will permanently change crypto’s direction. It is that this meeting could expose how much of the current market is supported by genuine demand—and how much is resting on an assumption about easier money that may no longer be safe.
One Fed Decision Could Shake Crypto
I have rarely seen a Federal Reserve meeting approach with expectations this divided. The Fed will announce its next interest-rate decision on September 16, and the market is no longer debating a simple choice between holding and cutting. A rate increase has returned as a realistic possibility. That uncertainty matters because crypto has spent months adapting to the idea that monetary conditions would eventually become easier.
The Fed’s decision exists inside an uncomfortable combination of persistent inflation, resilient employment and rising energy prices. Strong economic data may look positive on the surface, but it gives policymakers less reason to support growth through lower rates. Oil above $100 creates another problem because higher transportation and production costs can spread through the economy. If the Fed believes inflation could accelerate again, it may keep rates unchanged while delivering a warning—or raise them outright.
What I think many crypto traders overlook is that the interest rate itself is only one part of the mechanism. The more important question is how the decision changes the expected path of money. Markets continuously compare the return available from risky assets with the yield offered by government debt and cash-like instruments. When safe yields rise, investors require stronger potential returns before taking risk elsewhere. Bitcoin does not suddenly lose its scarcity, and a blockchain does not stop producing blocks, but the price investors are willing to pay for those qualities can decline.
This is how traders interact with the Fed without ever dealing with the central bank directly. They respond through Bitcoin, technology shares, Treasury yields, the dollar, perpetual futures and stablecoins. A hawkish surprise can strengthen the dollar, increase yields and force leveraged crypto positions to close. Liquidations then create selling that appears much larger than the original change in policy justified.
The opposite reaction is also possible. If the Fed holds rates and suggests that further tightening is unlikely, traders may interpret it as a limit on financial pressure. Bitcoin could recover quickly as short positions close and sidelined capital returns. Yet a hold would not automatically be bullish. If the accompanying projections show rates remaining elevated for longer, the initial rise could fade once the market studies the details.
That is the uncomfortable truth about this meeting: the headline decision may matter less than the language surrounding it. The new economic projections, inflation forecasts and expected rate path can reshape liquidity assumptions for several months. Even a widely anticipated decision can produce volatility if the Fed’s future outlook conflicts with market positioning.
I would watch stablecoin balances, spot trading volume, funding rates and exchange inflows after the announcement. Rising stablecoin supply alongside genuine spot demand would suggest that capital is returning with patience. A sharp move driven mainly by leveraged futures would be less convincing. Similarly, heavy Bitcoin deposits to exchanges during rising funding rates could show that traders are chasing a fragile reaction.
This moment fits a phase of the market cycle where liquidity matters more than narrative. Crypto has matured institutionally, but it has not escaped the price of money. The Fed cannot determine Bitcoin’s long-term value, yet it can influence who has the confidence and available capital to hold it today.
My conviction is not that one decision will permanently change crypto’s direction. It is that this meeting could expose how much of the current market is supported by genuine demand—and how much is resting on an assumption about easier money that may no longer be safe.
The Fed’s decision exists inside an uncomfortable combination of persistent inflation, resilient employment and rising energy prices. Strong economic data may look positive on the surface, but it gives policymakers less reason to support growth through lower rates. Oil above $100 creates another problem because higher transportation and production costs can spread through the economy. If the Fed believes inflation could accelerate again, it may keep rates unchanged while delivering a warning—or raise them outright.
What I think many crypto traders overlook is that the interest rate itself is only one part of the mechanism. The more important question is how the decision changes the expected path of money. Markets continuously compare the return available from risky assets with the yield offered by government debt and cash-like instruments. When safe yields rise, investors require stronger potential returns before taking risk elsewhere. Bitcoin does not suddenly lose its scarcity, and a blockchain does not stop producing blocks, but the price investors are willing to pay for those qualities can decline.
This is how traders interact with the Fed without ever dealing with the central bank directly. They respond through Bitcoin, technology shares, Treasury yields, the dollar, perpetual futures and stablecoins. A hawkish surprise can strengthen the dollar, increase yields and force leveraged crypto positions to close. Liquidations then create selling that appears much larger than the original change in policy justified.
The opposite reaction is also possible. If the Fed holds rates and suggests that further tightening is unlikely, traders may interpret it as a limit on financial pressure. Bitcoin could recover quickly as short positions close and sidelined capital returns. Yet a hold would not automatically be bullish. If the accompanying projections show rates remaining elevated for longer, the initial rise could fade once the market studies the details.
That is the uncomfortable truth about this meeting: the headline decision may matter less than the language surrounding it. The new economic projections, inflation forecasts and expected rate path can reshape liquidity assumptions for several months. Even a widely anticipated decision can produce volatility if the Fed’s future outlook conflicts with market positioning.
I would watch stablecoin balances, spot trading volume, funding rates and exchange inflows after the announcement. Rising stablecoin supply alongside genuine spot demand would suggest that capital is returning with patience. A sharp move driven mainly by leveraged futures would be less convincing. Similarly, heavy Bitcoin deposits to exchanges during rising funding rates could show that traders are chasing a fragile reaction.
This moment fits a phase of the market cycle where liquidity matters more than narrative. Crypto has matured institutionally, but it has not escaped the price of money. The Fed cannot determine Bitcoin’s long-term value, yet it can influence who has the confidence and available capital to hold it today.
My conviction is not that one decision will permanently change crypto’s direction. It is that this meeting could expose how much of the current market is supported by genuine demand—and how much is resting on an assumption about easier money that may no longer be safe.
91
·
--

Article
Bitcoin vs. $100 OilBrent crude returning to $100 is not simply another commodity headline. I see it as a direct test of Bitcoin’s behavior when the global economy faces a serious supply shock. Oil is becoming more expensive because markets are worried about production disruptions, vulnerable shipping routes, and geopolitical instability. Bitcoin, meanwhile, is being forced to prove whether investors treat it as protection from monetary disorder or as another risky asset that gets sold when uncertainty rises.
Oil and Bitcoin are both described as scarce assets, but their scarcity works differently. Oil is physically limited, geographically concentrated, difficult to transport, and essential to daily economic activity. Bitcoin is digitally scarce, globally transferable, and governed by a fixed issuance schedule. Oil keeps the physical economy moving. Bitcoin offers a monetary network that can operate without a central authority controlling its supply.
This distinction becomes important when oil reaches $100. Higher energy prices quickly affect transportation, manufacturing, food production, and household expenses. Businesses face rising costs, consumers lose purchasing power, and inflation becomes more difficult to control. Central banks may then be forced to keep interest rates elevated, even while economic growth begins to weaken.
That environment is not automatically positive for Bitcoin. Although BTC is often presented as protection against inflation, it remains highly sensitive to liquidity. When traders fear higher rates, stronger inflation, and slower growth at the same time, they usually reduce exposure to volatile assets. Leveraged positions are closed, capital moves toward cash, and Bitcoin can fall even as the argument for owning a scarce asset becomes stronger.
This is the uncomfortable truth behind Bitcoin versus $100 oil. Bitcoin may benefit from distrust in traditional monetary systems over the long term, but it can still suffer during the immediate financial stress that creates that distrust.
The network itself does not react to oil prices. Miners continue securing transactions, new BTC continues entering circulation according to predetermined rules, and the maximum supply remains fixed at 21 million coins. No government can increase Bitcoin production to offset a shortage, and no central bank can modify its issuance schedule in response to inflation.
Users interact with this system by holding BTC, transferring value, trading it, or using it as collateral. Its economic role is therefore different from oil. Oil is consumed, while Bitcoin is transferred and stored. Oil’s value comes from physical demand and constrained supply. Bitcoin’s value depends heavily on adoption, liquidity, network security, and confidence in its scarcity.
I would watch market behavior rather than accept the simple idea that inflation must push Bitcoin higher. Rising exchange inflows, selling from short-term holders, falling derivatives leverage, and heavier realized losses would show that investors are reducing risk. Declining exchange balances, steady long-term accumulation, and improving stablecoin liquidity would suggest that stronger buyers are absorbing the pressure.
This also matters within the broader market cycle. If $100 oil keeps inflation elevated, interest-rate cuts may be delayed and Bitcoin could remain under pressure. If expensive energy eventually damages economic growth and forces governments or central banks to provide support, liquidity conditions could improve again. Bitcoin may begin recovering before the wider economy looks healthy.
I do not see Bitcoin and oil as direct competitors. I see them as two different measures of global stress. Oil exposes weakness in the physical supply system, while Bitcoin measures confidence in the monetary system. My uncertainty is about timing, not the underlying tension. Bitcoin may eventually benefit from the consequences of expensive oil, but it could first be forced to survive the liquidity shock that $100 oil creates.$BTC
{spot}(BTCUSDT)
Bitcoin vs. $100 Oil
Brent crude returning to $100 is not simply another commodity headline. I see it as a direct test of Bitcoin’s behavior when the global economy faces a serious supply shock. Oil is becoming more expensive because markets are worried about production disruptions, vulnerable shipping routes, and geopolitical instability. Bitcoin, meanwhile, is being forced to prove whether investors treat it as protection from monetary disorder or as another risky asset that gets sold when uncertainty rises.
Oil and Bitcoin are both described as scarce assets, but their scarcity works differently. Oil is physically limited, geographically concentrated, difficult to transport, and essential to daily economic activity. Bitcoin is digitally scarce, globally transferable, and governed by a fixed issuance schedule. Oil keeps the physical economy moving. Bitcoin offers a monetary network that can operate without a central authority controlling its supply.
This distinction becomes important when oil reaches $100. Higher energy prices quickly affect transportation, manufacturing, food production, and household expenses. Businesses face rising costs, consumers lose purchasing power, and inflation becomes more difficult to control. Central banks may then be forced to keep interest rates elevated, even while economic growth begins to weaken.
That environment is not automatically positive for Bitcoin. Although BTC is often presented as protection against inflation, it remains highly sensitive to liquidity. When traders fear higher rates, stronger inflation, and slower growth at the same time, they usually reduce exposure to volatile assets. Leveraged positions are closed, capital moves toward cash, and Bitcoin can fall even as the argument for owning a scarce asset becomes stronger.
This is the uncomfortable truth behind Bitcoin versus $100 oil. Bitcoin may benefit from distrust in traditional monetary systems over the long term, but it can still suffer during the immediate financial stress that creates that distrust.
The network itself does not react to oil prices. Miners continue securing transactions, new BTC continues entering circulation according to predetermined rules, and the maximum supply remains fixed at 21 million coins. No government can increase Bitcoin production to offset a shortage, and no central bank can modify its issuance schedule in response to inflation.
Users interact with this system by holding BTC, transferring value, trading it, or using it as collateral. Its economic role is therefore different from oil. Oil is consumed, while Bitcoin is transferred and stored. Oil’s value comes from physical demand and constrained supply. Bitcoin’s value depends heavily on adoption, liquidity, network security, and confidence in its scarcity.
I would watch market behavior rather than accept the simple idea that inflation must push Bitcoin higher. Rising exchange inflows, selling from short-term holders, falling derivatives leverage, and heavier realized losses would show that investors are reducing risk. Declining exchange balances, steady long-term accumulation, and improving stablecoin liquidity would suggest that stronger buyers are absorbing the pressure.
This also matters within the broader market cycle. If $100 oil keeps inflation elevated, interest-rate cuts may be delayed and Bitcoin could remain under pressure. If expensive energy eventually damages economic growth and forces governments or central banks to provide support, liquidity conditions could improve again. Bitcoin may begin recovering before the wider economy looks healthy.
I do not see Bitcoin and oil as direct competitors. I see them as two different measures of global stress. Oil exposes weakness in the physical supply system, while Bitcoin measures confidence in the monetary system. My uncertainty is about timing, not the underlying tension. Bitcoin may eventually benefit from the consequences of expensive oil, but it could first be forced to survive the liquidity shock that $100 oil creates.$BTC
Oil and Bitcoin are both described as scarce assets, but their scarcity works differently. Oil is physically limited, geographically concentrated, difficult to transport, and essential to daily economic activity. Bitcoin is digitally scarce, globally transferable, and governed by a fixed issuance schedule. Oil keeps the physical economy moving. Bitcoin offers a monetary network that can operate without a central authority controlling its supply.
This distinction becomes important when oil reaches $100. Higher energy prices quickly affect transportation, manufacturing, food production, and household expenses. Businesses face rising costs, consumers lose purchasing power, and inflation becomes more difficult to control. Central banks may then be forced to keep interest rates elevated, even while economic growth begins to weaken.
That environment is not automatically positive for Bitcoin. Although BTC is often presented as protection against inflation, it remains highly sensitive to liquidity. When traders fear higher rates, stronger inflation, and slower growth at the same time, they usually reduce exposure to volatile assets. Leveraged positions are closed, capital moves toward cash, and Bitcoin can fall even as the argument for owning a scarce asset becomes stronger.
This is the uncomfortable truth behind Bitcoin versus $100 oil. Bitcoin may benefit from distrust in traditional monetary systems over the long term, but it can still suffer during the immediate financial stress that creates that distrust.
The network itself does not react to oil prices. Miners continue securing transactions, new BTC continues entering circulation according to predetermined rules, and the maximum supply remains fixed at 21 million coins. No government can increase Bitcoin production to offset a shortage, and no central bank can modify its issuance schedule in response to inflation.
Users interact with this system by holding BTC, transferring value, trading it, or using it as collateral. Its economic role is therefore different from oil. Oil is consumed, while Bitcoin is transferred and stored. Oil’s value comes from physical demand and constrained supply. Bitcoin’s value depends heavily on adoption, liquidity, network security, and confidence in its scarcity.
I would watch market behavior rather than accept the simple idea that inflation must push Bitcoin higher. Rising exchange inflows, selling from short-term holders, falling derivatives leverage, and heavier realized losses would show that investors are reducing risk. Declining exchange balances, steady long-term accumulation, and improving stablecoin liquidity would suggest that stronger buyers are absorbing the pressure.
This also matters within the broader market cycle. If $100 oil keeps inflation elevated, interest-rate cuts may be delayed and Bitcoin could remain under pressure. If expensive energy eventually damages economic growth and forces governments or central banks to provide support, liquidity conditions could improve again. Bitcoin may begin recovering before the wider economy looks healthy.
I do not see Bitcoin and oil as direct competitors. I see them as two different measures of global stress. Oil exposes weakness in the physical supply system, while Bitcoin measures confidence in the monetary system. My uncertainty is about timing, not the underlying tension. Bitcoin may eventually benefit from the consequences of expensive oil, but it could first be forced to survive the liquidity shock that $100 oil creates.$BTC
112
·
--
Article
Smart Money Is Moving NowI keep coming back to one observation when I look across crypto right now: capital is starting to move differently.
It is not simply flowing into everything. Bitcoin is receiving substantial institutional demand through ETFs, HYPE is appearing inside portfolios most traders would never associate with a relatively young DeFi asset, privacy coins have suddenly become one of the strongest parts of the market, and speculative liquidity is showing up again around Solana. That combination interests me more than any individual price candle.
U.S. spot Bitcoin ETFs recently recorded more than $730 million in daily net inflows, their strongest session since January. At roughly the same time, disclosures showed firms including UBS, Bank of Montreal and Jane Street holding exposure to Hyperliquid ETFs.
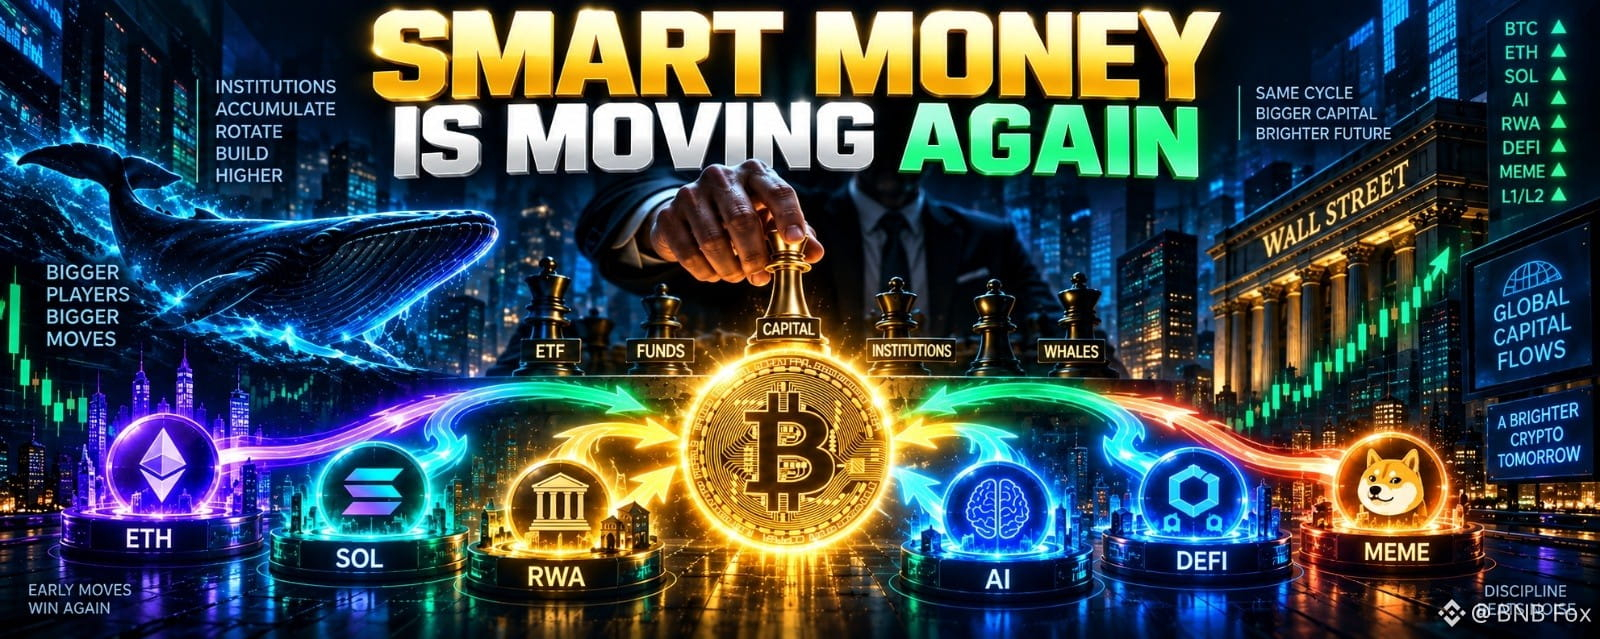
I think this is what “smart money moving” actually looks like. It rarely means one giant wallet buying the same token everyone is discussing on social media. Capital moves through different layers: ETFs for regulated Bitcoin exposure, derivatives for tactical positioning, DeFi markets for yield and trading activity, and increasingly tokenized products that connect traditional assets with blockchain liquidity.
The important part is the direction of that movement.
Zcash is a good example. ZEC recently crossed $1,000 after nearly doubling over a month. Its rally was supported by several forces at once, including the launch of a spot Zcash ETF and a derivatives market heavily positioned against the move. Roughly $34.5 million of bearish positions were liquidated during the surge.
That does not automatically make ZEC cheap. In fact, this is where I become cautious. Once an institutional narrative becomes obvious, leverage often arrives faster than fundamental demand. Rising open interest can confirm attention, but it can also create the conditions for violent reversals.
I see something similar happening around Solana. StonkFun, a platform built around tokens paired with assets including tokenized stocks, recently pulled attention toward Raydium and Jupiter, while STONK itself surged more than 250% in a day. The individual token may eventually matter less than the behavior underneath it: traders are experimenting again, liquidity is searching for new structures, and capital is becoming willing to move further out on the risk curve.
Bitcoin still sits at the center of this system. When institutional money wants crypto exposure without taking unnecessary structural risk, BTC remains the obvious doorway. When confidence improves, some of that liquidity begins searching elsewhere.
That rotation is what I am watching now.
I am not convinced we are entering a period where everything rises together. The market looks more selective than that. But selective markets can reveal something useful: where serious capital is willing to move before the crowd becomes comfortable following it.
For me, the question is no longer simply whether money is entering crypto.
It is where that money chooses to go next.
$BTC #Write2Earn
Smart Money Is Moving Now
I keep coming back to one observation when I look across crypto right now: capital is starting to move differently.
It is not simply flowing into everything. Bitcoin is receiving substantial institutional demand through ETFs, HYPE is appearing inside portfolios most traders would never associate with a relatively young DeFi asset, privacy coins have suddenly become one of the strongest parts of the market, and speculative liquidity is showing up again around Solana. That combination interests me more than any individual price candle.
U.S. spot Bitcoin ETFs recently recorded more than $730 million in daily net inflows, their strongest session since January. At roughly the same time, disclosures showed firms including UBS, Bank of Montreal and Jane Street holding exposure to Hyperliquid ETFs.
I think this is what “smart money moving” actually looks like. It rarely means one giant wallet buying the same token everyone is discussing on social media. Capital moves through different layers: ETFs for regulated Bitcoin exposure, derivatives for tactical positioning, DeFi markets for yield and trading activity, and increasingly tokenized products that connect traditional assets with blockchain liquidity.
The important part is the direction of that movement.
Zcash is a good example. ZEC recently crossed $1,000 after nearly doubling over a month. Its rally was supported by several forces at once, including the launch of a spot Zcash ETF and a derivatives market heavily positioned against the move. Roughly $34.5 million of bearish positions were liquidated during the surge.
That does not automatically make ZEC cheap. In fact, this is where I become cautious. Once an institutional narrative becomes obvious, leverage often arrives faster than fundamental demand. Rising open interest can confirm attention, but it can also create the conditions for violent reversals.
I see something similar happening around Solana. StonkFun, a platform built around tokens paired with assets including tokenized stocks, recently pulled attention toward Raydium and Jupiter, while STONK itself surged more than 250% in a day. The individual token may eventually matter less than the behavior underneath it: traders are experimenting again, liquidity is searching for new structures, and capital is becoming willing to move further out on the risk curve.
Bitcoin still sits at the center of this system. When institutional money wants crypto exposure without taking unnecessary structural risk, BTC remains the obvious doorway. When confidence improves, some of that liquidity begins searching elsewhere.
That rotation is what I am watching now.
I am not convinced we are entering a period where everything rises together. The market looks more selective than that. But selective markets can reveal something useful: where serious capital is willing to move before the crowd becomes comfortable following it.
For me, the question is no longer simply whether money is entering crypto.
It is where that money chooses to go next.
$BTC #Write2Earn
It is not simply flowing into everything. Bitcoin is receiving substantial institutional demand through ETFs, HYPE is appearing inside portfolios most traders would never associate with a relatively young DeFi asset, privacy coins have suddenly become one of the strongest parts of the market, and speculative liquidity is showing up again around Solana. That combination interests me more than any individual price candle.
U.S. spot Bitcoin ETFs recently recorded more than $730 million in daily net inflows, their strongest session since January. At roughly the same time, disclosures showed firms including UBS, Bank of Montreal and Jane Street holding exposure to Hyperliquid ETFs.
I think this is what “smart money moving” actually looks like. It rarely means one giant wallet buying the same token everyone is discussing on social media. Capital moves through different layers: ETFs for regulated Bitcoin exposure, derivatives for tactical positioning, DeFi markets for yield and trading activity, and increasingly tokenized products that connect traditional assets with blockchain liquidity.
The important part is the direction of that movement.
Zcash is a good example. ZEC recently crossed $1,000 after nearly doubling over a month. Its rally was supported by several forces at once, including the launch of a spot Zcash ETF and a derivatives market heavily positioned against the move. Roughly $34.5 million of bearish positions were liquidated during the surge.
That does not automatically make ZEC cheap. In fact, this is where I become cautious. Once an institutional narrative becomes obvious, leverage often arrives faster than fundamental demand. Rising open interest can confirm attention, but it can also create the conditions for violent reversals.
I see something similar happening around Solana. StonkFun, a platform built around tokens paired with assets including tokenized stocks, recently pulled attention toward Raydium and Jupiter, while STONK itself surged more than 250% in a day. The individual token may eventually matter less than the behavior underneath it: traders are experimenting again, liquidity is searching for new structures, and capital is becoming willing to move further out on the risk curve.
Bitcoin still sits at the center of this system. When institutional money wants crypto exposure without taking unnecessary structural risk, BTC remains the obvious doorway. When confidence improves, some of that liquidity begins searching elsewhere.
That rotation is what I am watching now.
I am not convinced we are entering a period where everything rises together. The market looks more selective than that. But selective markets can reveal something useful: where serious capital is willing to move before the crowd becomes comfortable following it.
For me, the question is no longer simply whether money is entering crypto.
It is where that money chooses to go next.
$BTC #Write2Earn
204
·
--

Article
Everyone Is Watching the Wrong CoinEveryone is watching Bitcoin around $80,000. I’m increasingly watching a coin that is designed not to move at all: USDT.
That sounds strange until I think about what actually drives crypto markets. Price needs liquidity. Before capital becomes a green candle on Bitcoin, Ethereum, Solana or some smaller token, a meaningful amount of it often exists as stablecoin liquidity waiting somewhere inside the system. Right now, that makes USDT more interesting to me than another argument about whether Bitcoin can break its next resistance level.
USDT quietly solves one of crypto’s most important problems: moving dollar-like liquidity around a market that never closes. Traders use it as a quote currency, collateral, temporary shelter and settlement asset. Someone can sell an altcoin into USDT, move that liquidity between supported networks or exchanges, and deploy it again without returning to a traditional bank account.
The mechanism itself is relatively simple. Tether issues digital tokens intended to remain close to one U.S. dollar while maintaining reserves behind them. Arbitrage and redemption help keep the market price close to that peg. USDT currently represents roughly $183 billion in market value, making it one of the largest assets in crypto even though almost nobody expects its price to appreciate.
That is exactly why I do not study USDT the way I study Bitcoin.
I care about its supply, exchange balances, transfer activity and especially its share of the total crypto market. USDT dominance is currently approaching what technicians call a death cross, with its 50-day average moving toward a break below its 200-day average. At the same time, Bitcoin is approaching the opposite formation. Historically, declining USDT dominance has often appeared when investors become more willing to hold volatile crypto assets instead of cash-like stablecoins.
But there is an uncomfortable detail here. Falling USDT dominance does not automatically mean billions of USDT are being converted into Bitcoin. The ratio can fall simply because BTC and altcoins appreciate faster while USDT supply stays relatively stable. And a large USDT mint is not automatically bullish either. Tokens can be created for inventory, payments or liquidity requirements without immediately becoming spot buying pressure.
There is also centralization risk. USDT depends on an issuer, reserves, banking relationships and the ability to freeze certain addresses. That makes it fundamentally different from Bitcoin despite both living inside the same market infrastructure.
So I’m not buying USDT expecting it to outperform anything. I’m watching it because sometimes the asset that refuses to move tells me more about the assets that are about to.
Bitcoin will keep getting the headlines. But if I want to understand where crypto money is becoming more aggressive or more defensive, I would rather watch where the dollars are sitting before everyone starts watching where the candles are going.
Everyone Is Watching the Wrong Coin
Everyone is watching Bitcoin around $80,000. I’m increasingly watching a coin that is designed not to move at all: USDT.
That sounds strange until I think about what actually drives crypto markets. Price needs liquidity. Before capital becomes a green candle on Bitcoin, Ethereum, Solana or some smaller token, a meaningful amount of it often exists as stablecoin liquidity waiting somewhere inside the system. Right now, that makes USDT more interesting to me than another argument about whether Bitcoin can break its next resistance level.
USDT quietly solves one of crypto’s most important problems: moving dollar-like liquidity around a market that never closes. Traders use it as a quote currency, collateral, temporary shelter and settlement asset. Someone can sell an altcoin into USDT, move that liquidity between supported networks or exchanges, and deploy it again without returning to a traditional bank account.
The mechanism itself is relatively simple. Tether issues digital tokens intended to remain close to one U.S. dollar while maintaining reserves behind them. Arbitrage and redemption help keep the market price close to that peg. USDT currently represents roughly $183 billion in market value, making it one of the largest assets in crypto even though almost nobody expects its price to appreciate.
That is exactly why I do not study USDT the way I study Bitcoin.
I care about its supply, exchange balances, transfer activity and especially its share of the total crypto market. USDT dominance is currently approaching what technicians call a death cross, with its 50-day average moving toward a break below its 200-day average. At the same time, Bitcoin is approaching the opposite formation. Historically, declining USDT dominance has often appeared when investors become more willing to hold volatile crypto assets instead of cash-like stablecoins.
But there is an uncomfortable detail here. Falling USDT dominance does not automatically mean billions of USDT are being converted into Bitcoin. The ratio can fall simply because BTC and altcoins appreciate faster while USDT supply stays relatively stable. And a large USDT mint is not automatically bullish either. Tokens can be created for inventory, payments or liquidity requirements without immediately becoming spot buying pressure.
There is also centralization risk. USDT depends on an issuer, reserves, banking relationships and the ability to freeze certain addresses. That makes it fundamentally different from Bitcoin despite both living inside the same market infrastructure.
So I’m not buying USDT expecting it to outperform anything. I’m watching it because sometimes the asset that refuses to move tells me more about the assets that are about to.
Bitcoin will keep getting the headlines. But if I want to understand where crypto money is becoming more aggressive or more defensive, I would rather watch where the dollars are sitting before everyone starts watching where the candles are going.
That sounds strange until I think about what actually drives crypto markets. Price needs liquidity. Before capital becomes a green candle on Bitcoin, Ethereum, Solana or some smaller token, a meaningful amount of it often exists as stablecoin liquidity waiting somewhere inside the system. Right now, that makes USDT more interesting to me than another argument about whether Bitcoin can break its next resistance level.
USDT quietly solves one of crypto’s most important problems: moving dollar-like liquidity around a market that never closes. Traders use it as a quote currency, collateral, temporary shelter and settlement asset. Someone can sell an altcoin into USDT, move that liquidity between supported networks or exchanges, and deploy it again without returning to a traditional bank account.
The mechanism itself is relatively simple. Tether issues digital tokens intended to remain close to one U.S. dollar while maintaining reserves behind them. Arbitrage and redemption help keep the market price close to that peg. USDT currently represents roughly $183 billion in market value, making it one of the largest assets in crypto even though almost nobody expects its price to appreciate.
That is exactly why I do not study USDT the way I study Bitcoin.
I care about its supply, exchange balances, transfer activity and especially its share of the total crypto market. USDT dominance is currently approaching what technicians call a death cross, with its 50-day average moving toward a break below its 200-day average. At the same time, Bitcoin is approaching the opposite formation. Historically, declining USDT dominance has often appeared when investors become more willing to hold volatile crypto assets instead of cash-like stablecoins.
But there is an uncomfortable detail here. Falling USDT dominance does not automatically mean billions of USDT are being converted into Bitcoin. The ratio can fall simply because BTC and altcoins appreciate faster while USDT supply stays relatively stable. And a large USDT mint is not automatically bullish either. Tokens can be created for inventory, payments or liquidity requirements without immediately becoming spot buying pressure.
There is also centralization risk. USDT depends on an issuer, reserves, banking relationships and the ability to freeze certain addresses. That makes it fundamentally different from Bitcoin despite both living inside the same market infrastructure.
So I’m not buying USDT expecting it to outperform anything. I’m watching it because sometimes the asset that refuses to move tells me more about the assets that are about to.
Bitcoin will keep getting the headlines. But if I want to understand where crypto money is becoming more aggressive or more defensive, I would rather watch where the dollars are sitting before everyone starts watching where the candles are going.
132
·
--
Article
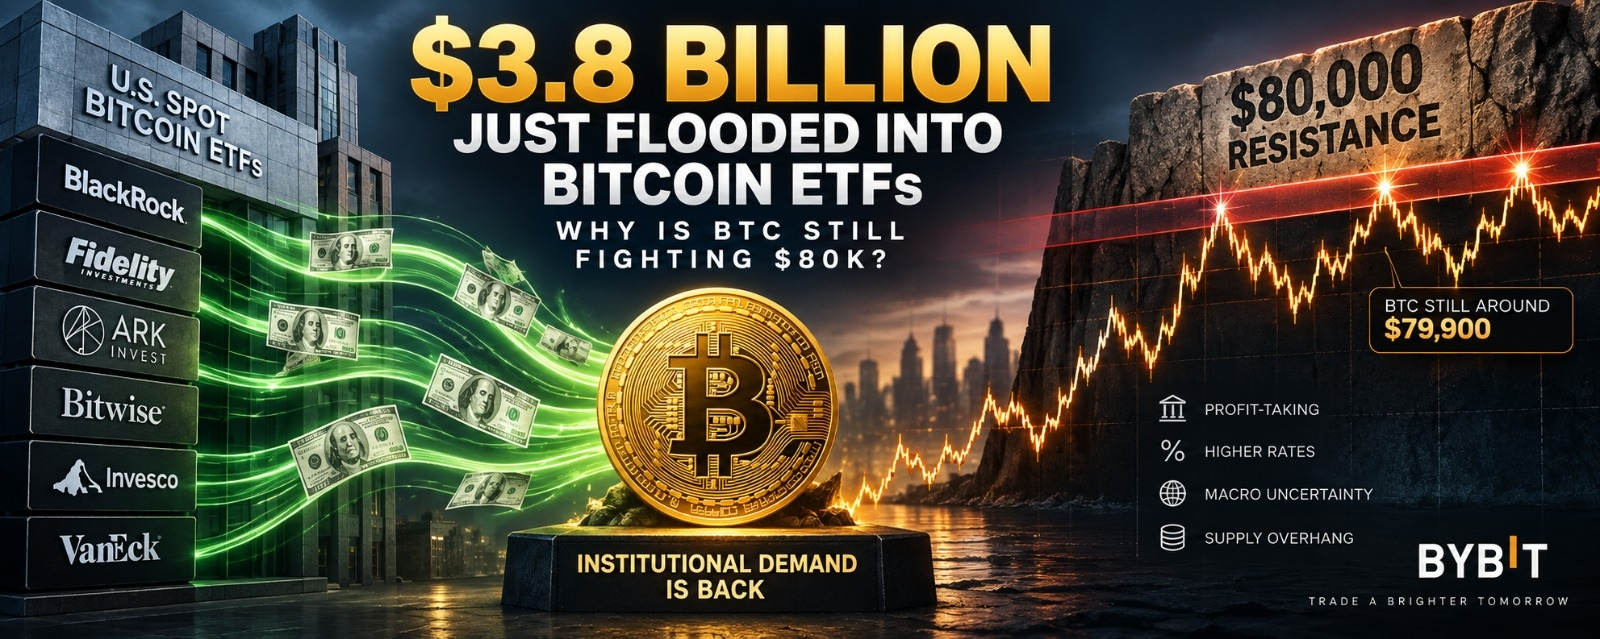
$3.8B Into Bitcoin ETFs. Why Is BTC Stuck at $80K?Nearly $3.8 billion has flowed into U.S. spot Bitcoin ETFs over three weeks, yet Bitcoin is still struggling around $80,000. That is the part of the market I find most interesting.
The inflows are clearly meaningful. Institutional demand has returned strongly, and recent ETF activity has been among the best stretches of 2026. But ETF demand does not automatically force price higher. Every buyer still needs a seller.
That means billions can enter through ETFs while other investors are taking profits, reducing exposure, or selling into strength. After Bitcoin’s recovery toward $80,000, there appears to be significant supply waiting above the market. Long-term holders may be locking in gains, traders may be reducing risk, and market makers may be rebalancing positions as price approaches resistance.
This is why I pay more attention to price response than the headline itself.
If huge inflows arrive and Bitcoin barely moves, it tells me supply is also strong. The market is absorbing real demand, but it is not doing so without resistance.
The macro environment adds another layer. Bitcoin is still sensitive to interest-rate expectations, bond yields, liquidity conditions, and upcoming Federal Reserve decisions. Stronger economic data can push markets toward tighter policy expectations, which often pressures risk assets even while ETF investors continue accumulating Bitcoin.
So the current battle around $80,000 is not simply about whether institutions are buying. They clearly are.
The bigger question is whether those buyers can absorb enough supply to push Bitcoin into a new price range.
I am watching the $80,000 to $82,000 area closely. If ETF inflows stay strong and sellers gradually become exhausted, Bitcoin could eventually move through resistance with much less difficulty. But if another wave of institutional money enters and price still refuses to advance, I would treat that as a warning.
For me, the $3.8 billion ETF story is not just bullish because capital is entering.
The more important signal is what Bitcoin does after that capital arrives.
If price starts responding strongly, demand may finally be overwhelming supply. If it does not, then someone is still using institutional buying as an opportunity to sell.
#CNPYAirdropOnBinanceAlpha #BTCReaches$80000 $BTC
{spot}(BTCUSDT)
$3.8B Into Bitcoin ETFs. Why Is BTC Stuck at $80K?
Nearly $3.8 billion has flowed into U.S. spot Bitcoin ETFs over three weeks, yet Bitcoin is still struggling around $80,000. That is the part of the market I find most interesting.
The inflows are clearly meaningful. Institutional demand has returned strongly, and recent ETF activity has been among the best stretches of 2026. But ETF demand does not automatically force price higher. Every buyer still needs a seller.
That means billions can enter through ETFs while other investors are taking profits, reducing exposure, or selling into strength. After Bitcoin’s recovery toward $80,000, there appears to be significant supply waiting above the market. Long-term holders may be locking in gains, traders may be reducing risk, and market makers may be rebalancing positions as price approaches resistance.
This is why I pay more attention to price response than the headline itself.
If huge inflows arrive and Bitcoin barely moves, it tells me supply is also strong. The market is absorbing real demand, but it is not doing so without resistance.
The macro environment adds another layer. Bitcoin is still sensitive to interest-rate expectations, bond yields, liquidity conditions, and upcoming Federal Reserve decisions. Stronger economic data can push markets toward tighter policy expectations, which often pressures risk assets even while ETF investors continue accumulating Bitcoin.
So the current battle around $80,000 is not simply about whether institutions are buying. They clearly are.
The bigger question is whether those buyers can absorb enough supply to push Bitcoin into a new price range.
I am watching the $80,000 to $82,000 area closely. If ETF inflows stay strong and sellers gradually become exhausted, Bitcoin could eventually move through resistance with much less difficulty. But if another wave of institutional money enters and price still refuses to advance, I would treat that as a warning.
For me, the $3.8 billion ETF story is not just bullish because capital is entering.
The more important signal is what Bitcoin does after that capital arrives.
If price starts responding strongly, demand may finally be overwhelming supply. If it does not, then someone is still using institutional buying as an opportunity to sell.
#CNPYAirdropOnBinanceAlpha #BTCReaches$80000 $BTC
The inflows are clearly meaningful. Institutional demand has returned strongly, and recent ETF activity has been among the best stretches of 2026. But ETF demand does not automatically force price higher. Every buyer still needs a seller.
That means billions can enter through ETFs while other investors are taking profits, reducing exposure, or selling into strength. After Bitcoin’s recovery toward $80,000, there appears to be significant supply waiting above the market. Long-term holders may be locking in gains, traders may be reducing risk, and market makers may be rebalancing positions as price approaches resistance.
This is why I pay more attention to price response than the headline itself.
If huge inflows arrive and Bitcoin barely moves, it tells me supply is also strong. The market is absorbing real demand, but it is not doing so without resistance.
The macro environment adds another layer. Bitcoin is still sensitive to interest-rate expectations, bond yields, liquidity conditions, and upcoming Federal Reserve decisions. Stronger economic data can push markets toward tighter policy expectations, which often pressures risk assets even while ETF investors continue accumulating Bitcoin.
So the current battle around $80,000 is not simply about whether institutions are buying. They clearly are.
The bigger question is whether those buyers can absorb enough supply to push Bitcoin into a new price range.
I am watching the $80,000 to $82,000 area closely. If ETF inflows stay strong and sellers gradually become exhausted, Bitcoin could eventually move through resistance with much less difficulty. But if another wave of institutional money enters and price still refuses to advance, I would treat that as a warning.
For me, the $3.8 billion ETF story is not just bullish because capital is entering.
The more important signal is what Bitcoin does after that capital arrives.
If price starts responding strongly, demand may finally be overwhelming supply. If it does not, then someone is still using institutional buying as an opportunity to sell.
#CNPYAirdropOnBinanceAlpha #BTCReaches$80000 $BTC
189
·
--
Article
$797M HYPE Unlock Hits Today — But Is the Supply Shock Actually Real?The number everyone sees today is $797 million. I think the more important number is much smaller.
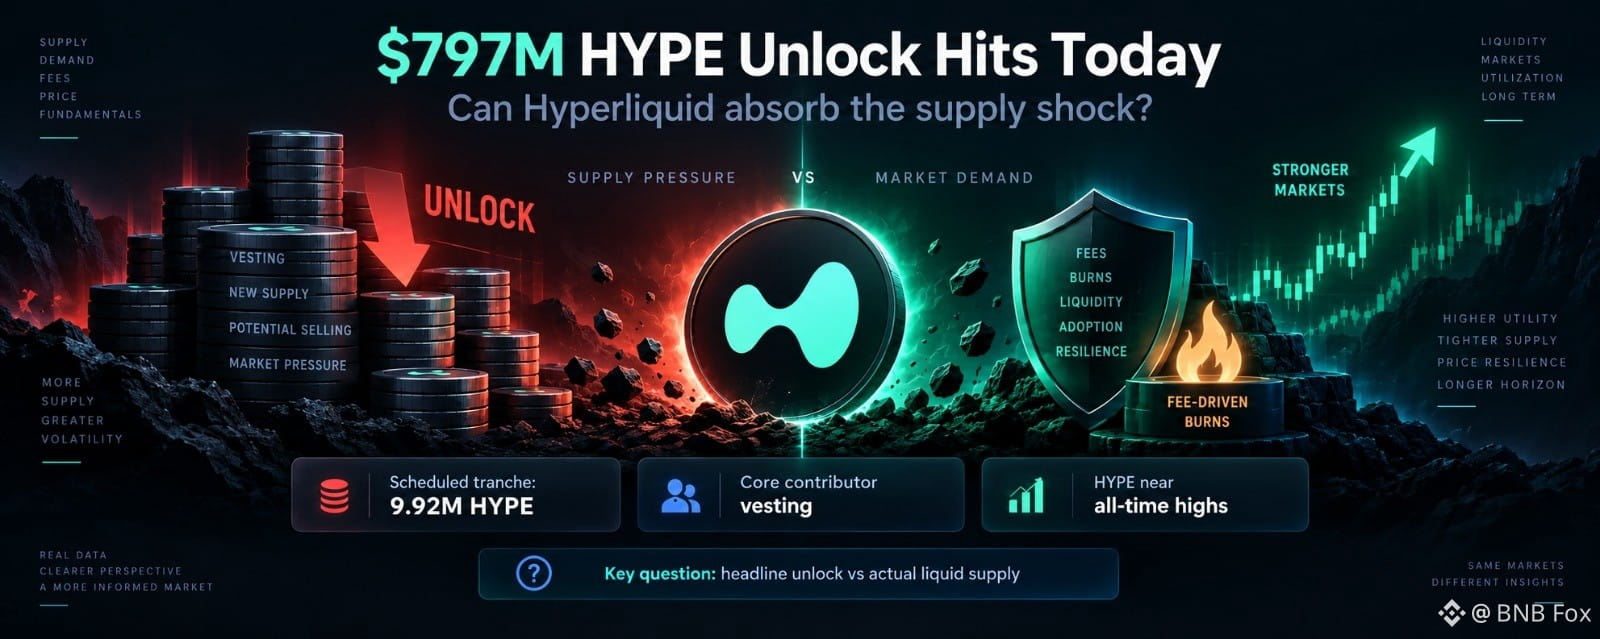
Hyperliquid’s September 6 schedule makes roughly 9.92 million HYPE available to core contributors. The $797 million figure was an earlier valuation of that tranche; with HYPE now around $86–$88, its theoretical value is closer to $850 million. But I do not think the useful question is whether that entire amount suddenly hits the market. The useful question is how much becomes liquid, how much moves toward exchanges, and whether real demand can absorb it. Current tracking points to roughly 433,000 HYPE committed for this event, worth only around $37 million.
That distinction matters because Hyperliquid is not trading like a token waiting for dilution. HYPE has been hovering near record territory. At the same time, the protocol continues to generate meaningful trading fees, and its Assistance Fund automatically converts eligible fees into HYPE that is burned. To me, this creates an unusual contest: contributor supply enters from one side while actual platform activity removes supply from the other.
The reason Hyperliquid has reached this moment is that it solved a problem traders care about more than most blockchain narratives admit: execution quality. Traders want an order book that feels fast, deep and familiar without surrendering the entire trading stack to a centralized exchange. HyperCore keeps the matching and margin system on-chain, while HyperBFT provides ordering and finality. In practice, a trader can place perpetual or spot orders with an experience much closer to a professional exchange than to the slower DeFi interfaces many users still associate with on-chain trading.
HYPE sits inside that machine rather than beside it. It is used for staking and network security, serves as gas on HyperEVM, and is the asset purchased by the Assistance Fund before being burned. That gives price a direct relationship with activity, but not a guaranteed floor. Buybacks cannot permanently overpower aggressive insider selling, declining volumes, or a broader risk-off market.
That is why I am watching exchange inflows, contributor wallets, staking withdrawals and fee generation more closely than the unlock headline itself. Hyperliquid generated about $71.7 million in fees over the last 30 days, while HYPE gained more than 50% over the same period. The market is currently pricing growth faster than dilution.
The uncomfortable part is that this confidence can become its own risk. A token near record highs has less room for disappointment. If contributor claims accelerate while trading activity weakens, the supply story changes quickly.
For me, today is not really a test of whether Hyperliquid can survive a $797 million dump. It is a test of whether traders understood that the headline was never the same thing as liquid supply. If HYPE absorbs the real circulating flow without losing momentum, demand may be deeper than the fear suggests. If it cannot, even excellent token economics still answer to liquidity.
$BTC
{spot}(BTCUSDT)
#RussiaUkraine72-hourCeasefire
$797M HYPE Unlock Hits Today — But Is the Supply Shock Actually Real?
The number everyone sees today is $797 million. I think the more important number is much smaller.
Hyperliquid’s September 6 schedule makes roughly 9.92 million HYPE available to core contributors. The $797 million figure was an earlier valuation of that tranche; with HYPE now around $86–$88, its theoretical value is closer to $850 million. But I do not think the useful question is whether that entire amount suddenly hits the market. The useful question is how much becomes liquid, how much moves toward exchanges, and whether real demand can absorb it. Current tracking points to roughly 433,000 HYPE committed for this event, worth only around $37 million.
That distinction matters because Hyperliquid is not trading like a token waiting for dilution. HYPE has been hovering near record territory. At the same time, the protocol continues to generate meaningful trading fees, and its Assistance Fund automatically converts eligible fees into HYPE that is burned. To me, this creates an unusual contest: contributor supply enters from one side while actual platform activity removes supply from the other.
The reason Hyperliquid has reached this moment is that it solved a problem traders care about more than most blockchain narratives admit: execution quality. Traders want an order book that feels fast, deep and familiar without surrendering the entire trading stack to a centralized exchange. HyperCore keeps the matching and margin system on-chain, while HyperBFT provides ordering and finality. In practice, a trader can place perpetual or spot orders with an experience much closer to a professional exchange than to the slower DeFi interfaces many users still associate with on-chain trading.
HYPE sits inside that machine rather than beside it. It is used for staking and network security, serves as gas on HyperEVM, and is the asset purchased by the Assistance Fund before being burned. That gives price a direct relationship with activity, but not a guaranteed floor. Buybacks cannot permanently overpower aggressive insider selling, declining volumes, or a broader risk-off market.
That is why I am watching exchange inflows, contributor wallets, staking withdrawals and fee generation more closely than the unlock headline itself. Hyperliquid generated about $71.7 million in fees over the last 30 days, while HYPE gained more than 50% over the same period. The market is currently pricing growth faster than dilution.
The uncomfortable part is that this confidence can become its own risk. A token near record highs has less room for disappointment. If contributor claims accelerate while trading activity weakens, the supply story changes quickly.
For me, today is not really a test of whether Hyperliquid can survive a $797 million dump. It is a test of whether traders understood that the headline was never the same thing as liquid supply. If HYPE absorbs the real circulating flow without losing momentum, demand may be deeper than the fear suggests. If it cannot, even excellent token economics still answer to liquidity.
$BTC
#RussiaUkraine72-hourCeasefire
Hyperliquid’s September 6 schedule makes roughly 9.92 million HYPE available to core contributors. The $797 million figure was an earlier valuation of that tranche; with HYPE now around $86–$88, its theoretical value is closer to $850 million. But I do not think the useful question is whether that entire amount suddenly hits the market. The useful question is how much becomes liquid, how much moves toward exchanges, and whether real demand can absorb it. Current tracking points to roughly 433,000 HYPE committed for this event, worth only around $37 million.
That distinction matters because Hyperliquid is not trading like a token waiting for dilution. HYPE has been hovering near record territory. At the same time, the protocol continues to generate meaningful trading fees, and its Assistance Fund automatically converts eligible fees into HYPE that is burned. To me, this creates an unusual contest: contributor supply enters from one side while actual platform activity removes supply from the other.
The reason Hyperliquid has reached this moment is that it solved a problem traders care about more than most blockchain narratives admit: execution quality. Traders want an order book that feels fast, deep and familiar without surrendering the entire trading stack to a centralized exchange. HyperCore keeps the matching and margin system on-chain, while HyperBFT provides ordering and finality. In practice, a trader can place perpetual or spot orders with an experience much closer to a professional exchange than to the slower DeFi interfaces many users still associate with on-chain trading.
HYPE sits inside that machine rather than beside it. It is used for staking and network security, serves as gas on HyperEVM, and is the asset purchased by the Assistance Fund before being burned. That gives price a direct relationship with activity, but not a guaranteed floor. Buybacks cannot permanently overpower aggressive insider selling, declining volumes, or a broader risk-off market.
That is why I am watching exchange inflows, contributor wallets, staking withdrawals and fee generation more closely than the unlock headline itself. Hyperliquid generated about $71.7 million in fees over the last 30 days, while HYPE gained more than 50% over the same period. The market is currently pricing growth faster than dilution.
The uncomfortable part is that this confidence can become its own risk. A token near record highs has less room for disappointment. If contributor claims accelerate while trading activity weakens, the supply story changes quickly.
For me, today is not really a test of whether Hyperliquid can survive a $797 million dump. It is a test of whether traders understood that the headline was never the same thing as liquid supply. If HYPE absorbs the real circulating flow without losing momentum, demand may be deeper than the fear suggests. If it cannot, even excellent token economics still answer to liquidity.
$BTC
#RussiaUkraine72-hourCeasefire
125
·
--
Bullish
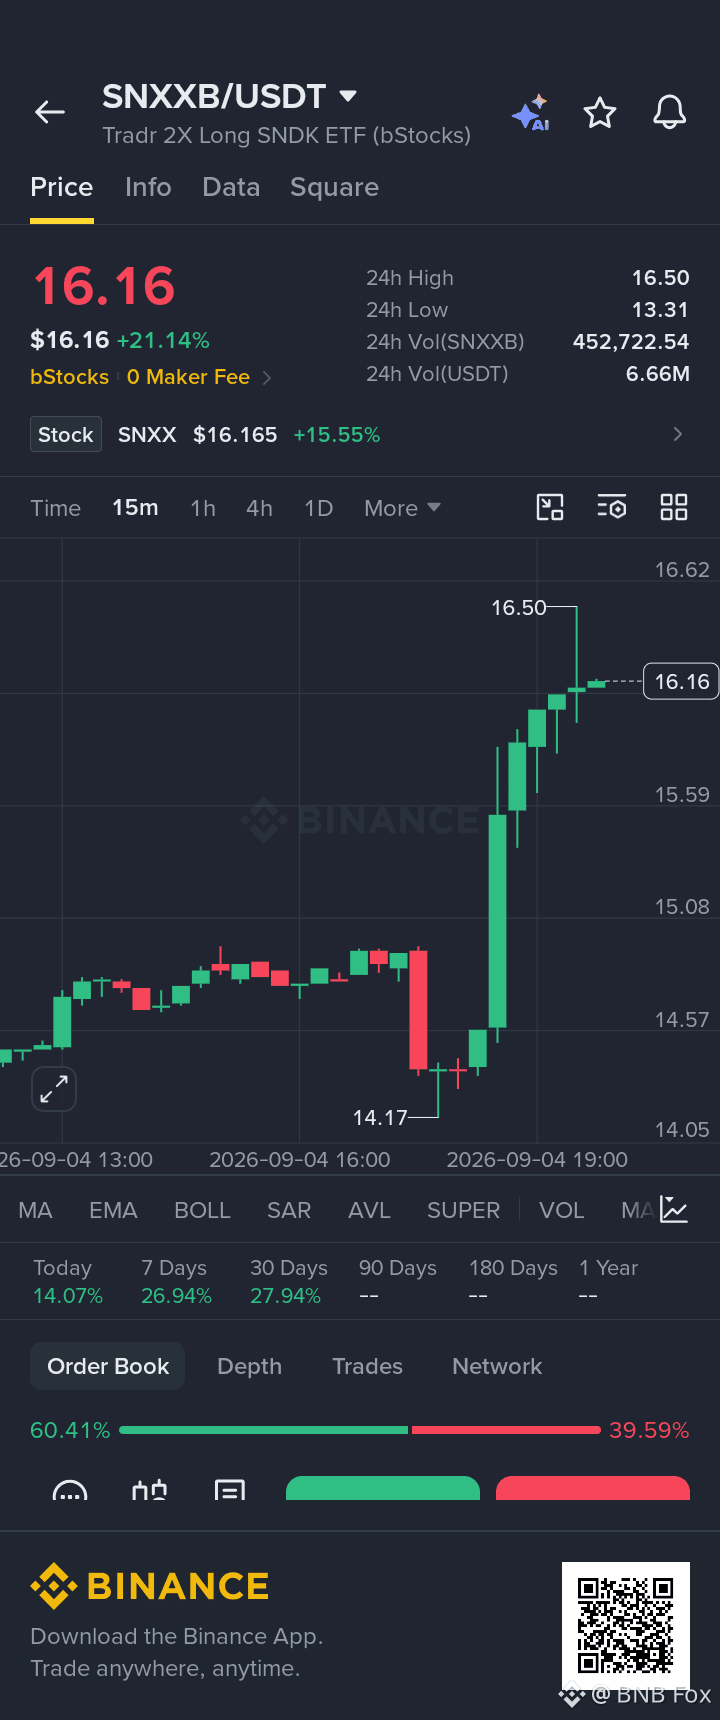
🚨 $SNXXB IS ABSOLUTELY FLYING!
Buyers just stepped in aggressively, sending $SNXXB from around $14.17 → $16.50, while the pair is sitting at roughly +21% in 24H. 🔥
The 15M chart shows a powerful bullish expansion followed by price holding near the highs — exactly where things get interesting.
👀 Key level: $16.50
Break and hold above it → bulls could push into another expansion.
Rejection here → watch for a pullback toward the recent breakout zone.
Order book currently shows roughly 60% bids vs 40% asks, adding to the short-term bullish pressure.
Don’t blindly chase a vertical candle. Let the market confirm the next move.
$SNXXB bulls — are we breaking $16.50 next? 🚀
⚠️ Not financial advice. Manage risk.
🚨 $SNXXB IS ABSOLUTELY FLYING!
Buyers just stepped in aggressively, sending $SNXXB from around $14.17 → $16.50, while the pair is sitting at roughly +21% in 24H. 🔥
The 15M chart shows a powerful bullish expansion followed by price holding near the highs — exactly where things get interesting.
👀 Key level: $16.50
Break and hold above it → bulls could push into another expansion.
Rejection here → watch for a pullback toward the recent breakout zone.
Order book currently shows roughly 60% bids vs 40% asks, adding to the short-term bullish pressure.
Don’t blindly chase a vertical candle. Let the market confirm the next move.
$SNXXB bulls — are we breaking $16.50 next? 🚀
⚠️ Not financial advice. Manage risk.
Buyers just stepped in aggressively, sending $SNXXB from around $14.17 → $16.50, while the pair is sitting at roughly +21% in 24H. 🔥
The 15M chart shows a powerful bullish expansion followed by price holding near the highs — exactly where things get interesting.
👀 Key level: $16.50
Break and hold above it → bulls could push into another expansion.
Rejection here → watch for a pullback toward the recent breakout zone.
Order book currently shows roughly 60% bids vs 40% asks, adding to the short-term bullish pressure.
Don’t blindly chase a vertical candle. Let the market confirm the next move.
$SNXXB bulls — are we breaking $16.50 next? 🚀
⚠️ Not financial advice. Manage risk.
86
·
--
Bullish
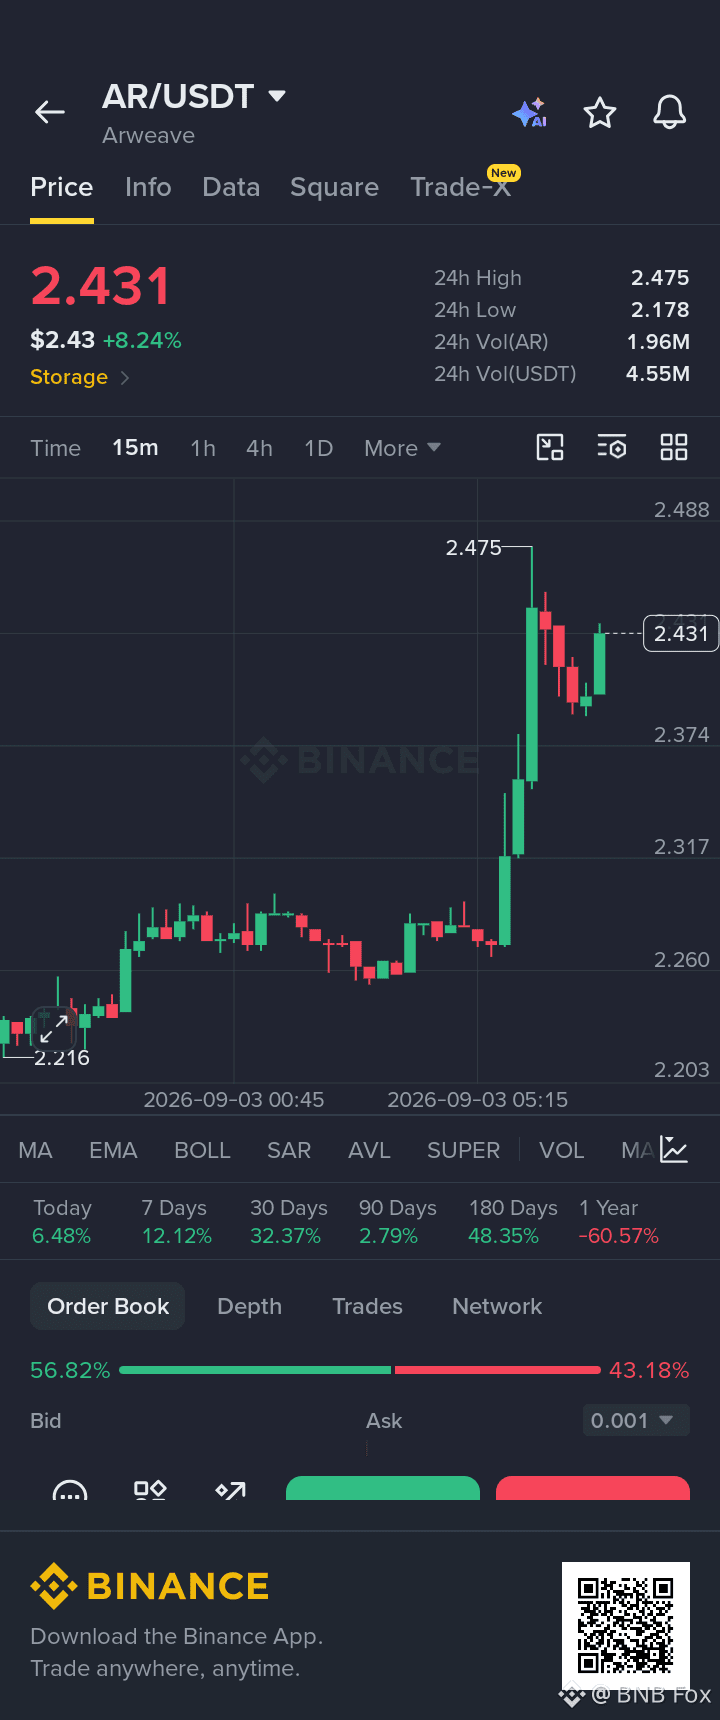
🚨 $AR LONG SETUP — EXPLOSIVE BREAKOUT, BULLS WANT MORE!
{spot}(ARUSDT)
$AR is trading around $2.431, up +8.24%, after violently breaking out from the $2.26 area and hitting $2.475.
🟢 Entry Zone: $2.39–$2.43
🎯 TP1: $2.475
🎯 TP2: $2.52
🎯 TP3: $2.60
🛑 Stop Loss: $2.36
The first rejection from $2.475 was quickly bought, and price is now pushing upward again.
🔥 Key trigger: $2.475
Break $2.475 → $2.50+ could come FAST.
🚀 Hold above $2.40 → bulls remain in control.
⚠️ Lose $2.374 → breakout momentum weakens.
The displayed order book also favors buyers at roughly 57% bids vs 43% asks.
$AR isn't back at the high yet — but bulls are already knocking on the door again. 👀🔥
Not financial advice. Manage risk.
🚨 $AR LONG SETUP — EXPLOSIVE BREAKOUT, BULLS WANT MORE!
$AR is trading around $2.431, up +8.24%, after violently breaking out from the $2.26 area and hitting $2.475.
🟢 Entry Zone: $2.39–$2.43
🎯 TP1: $2.475
🎯 TP2: $2.52
🎯 TP3: $2.60
🛑 Stop Loss: $2.36
The first rejection from $2.475 was quickly bought, and price is now pushing upward again.
🔥 Key trigger: $2.475
Break $2.475 → $2.50+ could come FAST.
🚀 Hold above $2.40 → bulls remain in control.
⚠️ Lose $2.374 → breakout momentum weakens.
The displayed order book also favors buyers at roughly 57% bids vs 43% asks.
$AR isn't back at the high yet — but bulls are already knocking on the door again. 👀🔥
Not financial advice. Manage risk.
$AR is trading around $2.431, up +8.24%, after violently breaking out from the $2.26 area and hitting $2.475.
🟢 Entry Zone: $2.39–$2.43
🎯 TP1: $2.475
🎯 TP2: $2.52
🎯 TP3: $2.60
🛑 Stop Loss: $2.36
The first rejection from $2.475 was quickly bought, and price is now pushing upward again.
🔥 Key trigger: $2.475
Break $2.475 → $2.50+ could come FAST.
🚀 Hold above $2.40 → bulls remain in control.
⚠️ Lose $2.374 → breakout momentum weakens.
The displayed order book also favors buyers at roughly 57% bids vs 43% asks.
$AR isn't back at the high yet — but bulls are already knocking on the door again. 👀🔥
Not financial advice. Manage risk.
141
·
--
Bullish
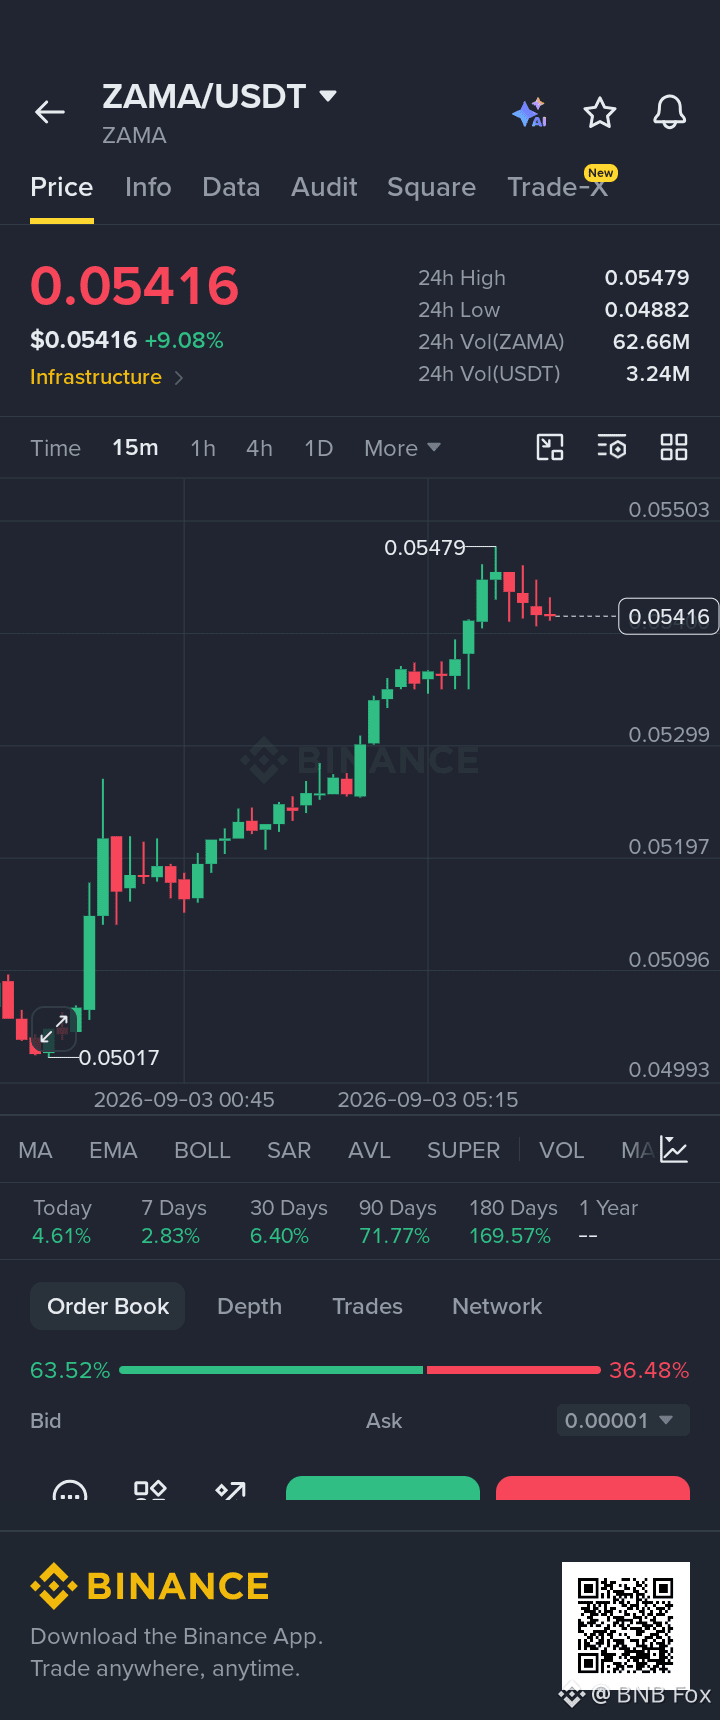
🚨 $ZAMA LONG SETUP — BULLS ARE PRESSING THE HIGH!
{spot}(ZAMAUSDT)
$ZAMA is trading around $0.05416, up +9.08%, after a clean staircase rally from roughly $0.05017 to $0.05479.
🟢 Entry Zone: $0.05380–$0.05415
🎯 TP1: $0.05479
🎯 TP2: $0.05550
🎯 TP3: $0.05620
🛑 Stop Loss: $0.05290
The 15M structure remains bullish with a clear sequence of higher highs + higher lows. Price is now consolidating just underneath the $0.05479 resistance.
🔥 Break $0.05479 → momentum could accelerate FAST.
🚀 Hold above $0.05500 → $0.05600+ becomes the next zone.
⚠️ Lose $0.05299 → bullish structure starts weakening.
The displayed order book also favors buyers at roughly 63.5% bids vs 36.5% asks.
$ZAMA is sitting right under the breakout door. One strong candle could kick it open. 👀🔥
Not financial advice. Manage risk.
🚨 $ZAMA LONG SETUP — BULLS ARE PRESSING THE HIGH!
$ZAMA is trading around $0.05416, up +9.08%, after a clean staircase rally from roughly $0.05017 to $0.05479.
🟢 Entry Zone: $0.05380–$0.05415
🎯 TP1: $0.05479
🎯 TP2: $0.05550
🎯 TP3: $0.05620
🛑 Stop Loss: $0.05290
The 15M structure remains bullish with a clear sequence of higher highs + higher lows. Price is now consolidating just underneath the $0.05479 resistance.
🔥 Break $0.05479 → momentum could accelerate FAST.
🚀 Hold above $0.05500 → $0.05600+ becomes the next zone.
⚠️ Lose $0.05299 → bullish structure starts weakening.
The displayed order book also favors buyers at roughly 63.5% bids vs 36.5% asks.
$ZAMA is sitting right under the breakout door. One strong candle could kick it open. 👀🔥
Not financial advice. Manage risk.
$ZAMA is trading around $0.05416, up +9.08%, after a clean staircase rally from roughly $0.05017 to $0.05479.
🟢 Entry Zone: $0.05380–$0.05415
🎯 TP1: $0.05479
🎯 TP2: $0.05550
🎯 TP3: $0.05620
🛑 Stop Loss: $0.05290
The 15M structure remains bullish with a clear sequence of higher highs + higher lows. Price is now consolidating just underneath the $0.05479 resistance.
🔥 Break $0.05479 → momentum could accelerate FAST.
🚀 Hold above $0.05500 → $0.05600+ becomes the next zone.
⚠️ Lose $0.05299 → bullish structure starts weakening.
The displayed order book also favors buyers at roughly 63.5% bids vs 36.5% asks.
$ZAMA is sitting right under the breakout door. One strong candle could kick it open. 👀🔥
Not financial advice. Manage risk.
48
·
--
Bullish
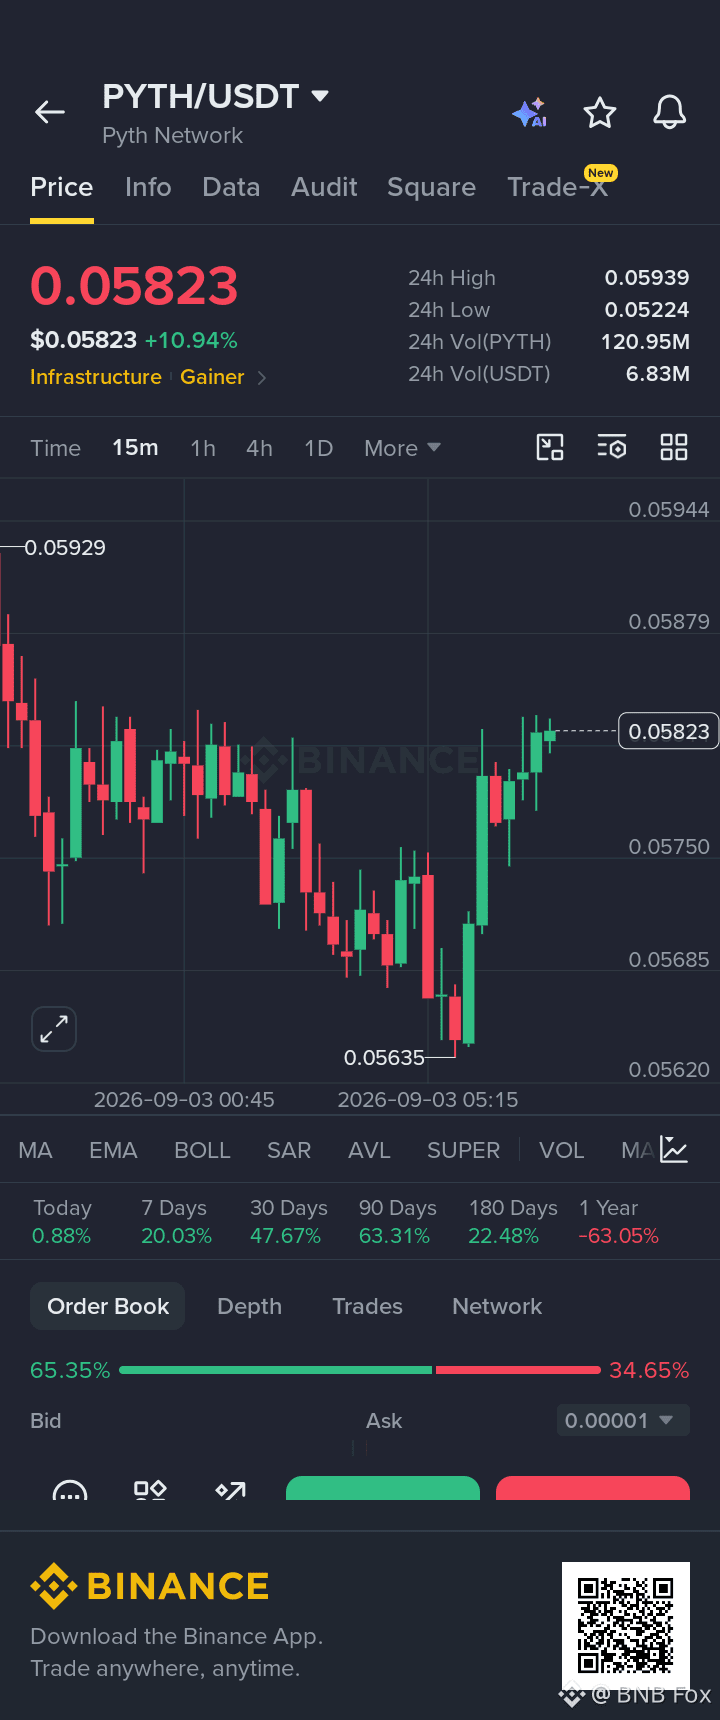
🚨 $PYTH LONG SETUP — BUYERS ARE STEPPING BACK IN!
$PYTH is trading around $0.05823, up nearly +11% in 24H, after a sharp recovery from the $0.05635 local low.
🟢 Entry Zone: $0.05770–$0.05820
🎯 TP1: $0.05880
🎯 TP2: $0.05930
🎯 TP3: $0.06000
🛑 Stop Loss: $0.05680
The 15M chart shows a strong rebound with price pushing back toward the session highs. Buyers also represent roughly 65% of the displayed order book versus 35% asks.
🔥 $0.0593 is the level to watch.
If bulls break and hold above it, $0.0600 could come into play quickly.
Hold $0.0575 → bullish momentum stays alive.
Break $0.0593 → next expansion could begin. 🚀
Don’t FOMO into resistance. Manage the downside first.
Not financial advice.
🚨 $PYTH LONG SETUP — BUYERS ARE STEPPING BACK IN!
$PYTH is trading around $0.05823, up nearly +11% in 24H, after a sharp recovery from the $0.05635 local low.
🟢 Entry Zone: $0.05770–$0.05820
🎯 TP1: $0.05880
🎯 TP2: $0.05930
🎯 TP3: $0.06000
🛑 Stop Loss: $0.05680
The 15M chart shows a strong rebound with price pushing back toward the session highs. Buyers also represent roughly 65% of the displayed order book versus 35% asks.
🔥 $0.0593 is the level to watch.
If bulls break and hold above it, $0.0600 could come into play quickly.
Hold $0.0575 → bullish momentum stays alive.
Break $0.0593 → next expansion could begin. 🚀
Don’t FOMO into resistance. Manage the downside first.
Not financial advice.
$PYTH is trading around $0.05823, up nearly +11% in 24H, after a sharp recovery from the $0.05635 local low.
🟢 Entry Zone: $0.05770–$0.05820
🎯 TP1: $0.05880
🎯 TP2: $0.05930
🎯 TP3: $0.06000
🛑 Stop Loss: $0.05680
The 15M chart shows a strong rebound with price pushing back toward the session highs. Buyers also represent roughly 65% of the displayed order book versus 35% asks.
🔥 $0.0593 is the level to watch.
If bulls break and hold above it, $0.0600 could come into play quickly.
Hold $0.0575 → bullish momentum stays alive.
Break $0.0593 → next expansion could begin. 🚀
Don’t FOMO into resistance. Manage the downside first.
Not financial advice.
65
·
--
Bullish
🚨 $ASTSB
{spot}(ASTSBUSDT)
BREAKOUT SETUP — BULLS HOLDING AFTER THE SPIKE!
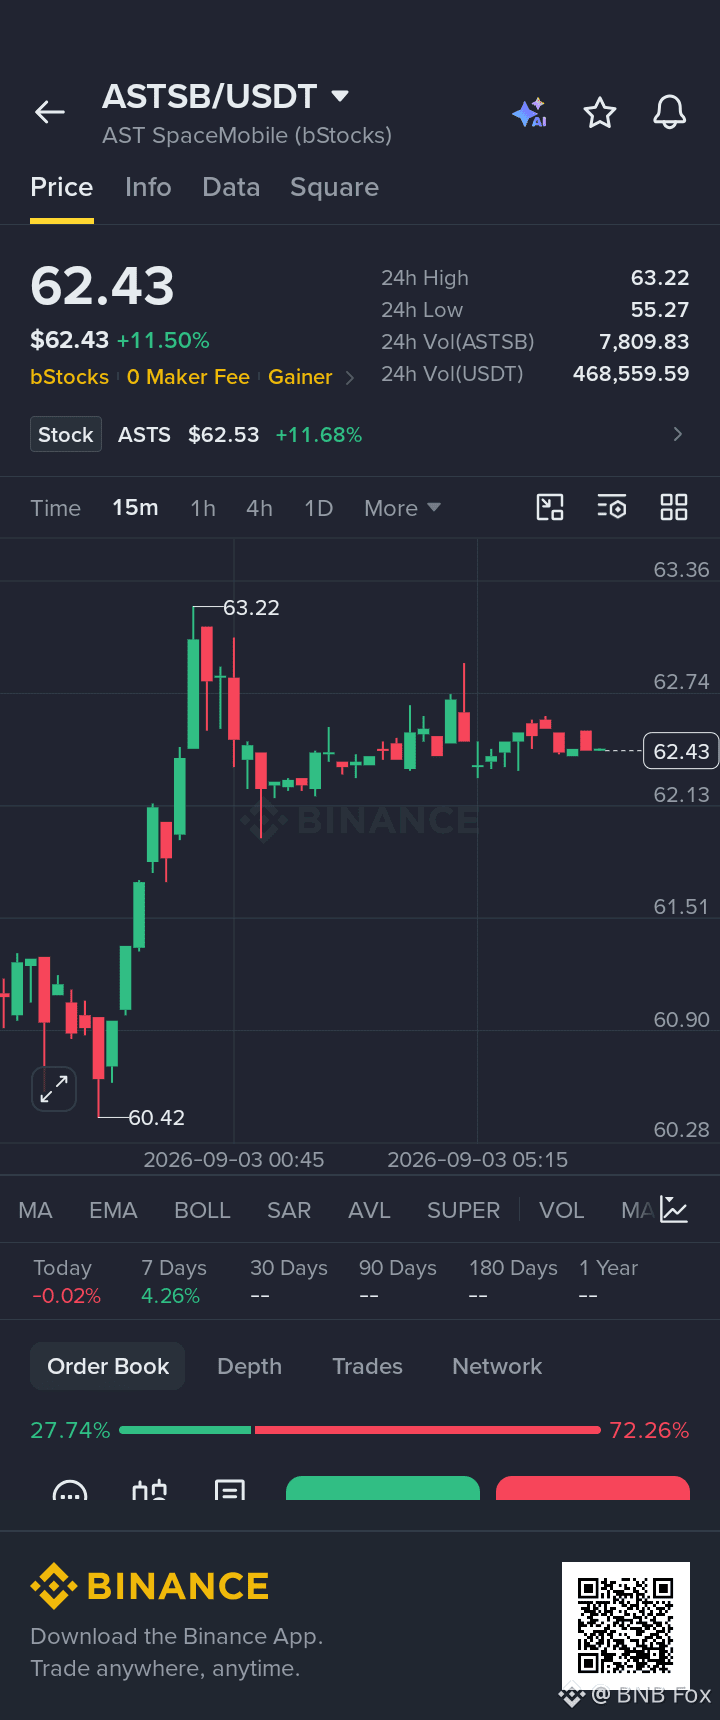
$ASTSB is trading around $62.43, up roughly +11.5% in 24H. After exploding from $60.42 to $63.22, price has entered a tight consolidation instead of completely giving back the move.
🟢 Entry Zone: $62.15–$62.45
🎯 TP1: $62.75
🎯 TP2: $63.22
🎯 TP3: $63.80
🛑 Stop Loss: $61.90
🔥 Key level: $63.22
A clean breakout above the previous high could trigger another momentum leg.
But there’s a major warning: the displayed order book is roughly 72% asks vs 28% bids, showing significant sell-side pressure right now.
Hold $62.13 → bullish structure survives.
Break $63.22 → bulls could take control again. 🚀
Don’t chase — wait for confirmation.
Not financial advice. Manage risk.
🚨 $ASTSB
BREAKOUT SETUP — BULLS HOLDING AFTER THE SPIKE!
$ASTSB is trading around $62.43, up roughly +11.5% in 24H. After exploding from $60.42 to $63.22, price has entered a tight consolidation instead of completely giving back the move.
🟢 Entry Zone: $62.15–$62.45
🎯 TP1: $62.75
🎯 TP2: $63.22
🎯 TP3: $63.80
🛑 Stop Loss: $61.90
🔥 Key level: $63.22
A clean breakout above the previous high could trigger another momentum leg.
But there’s a major warning: the displayed order book is roughly 72% asks vs 28% bids, showing significant sell-side pressure right now.
Hold $62.13 → bullish structure survives.
Break $63.22 → bulls could take control again. 🚀
Don’t chase — wait for confirmation.
Not financial advice. Manage risk.
BREAKOUT SETUP — BULLS HOLDING AFTER THE SPIKE!
$ASTSB is trading around $62.43, up roughly +11.5% in 24H. After exploding from $60.42 to $63.22, price has entered a tight consolidation instead of completely giving back the move.
🟢 Entry Zone: $62.15–$62.45
🎯 TP1: $62.75
🎯 TP2: $63.22
🎯 TP3: $63.80
🛑 Stop Loss: $61.90
🔥 Key level: $63.22
A clean breakout above the previous high could trigger another momentum leg.
But there’s a major warning: the displayed order book is roughly 72% asks vs 28% bids, showing significant sell-side pressure right now.
Hold $62.13 → bullish structure survives.
Break $63.22 → bulls could take control again. 🚀
Don’t chase — wait for confirmation.
Not financial advice. Manage risk.
22
Log in to explore more content
Join global crypto users on Binance Square
⚡️ Get latest and useful information about crypto.
💬 Trusted by the world’s largest crypto exchange.
👍 Discover real insights from verified creators.
Email / Phone number
Trending Topics
BOJRaisesRatesTo31YearHigh
117,918 views
1,840 Discussing
#BOJRaisesRatesTo31YearHigh
#BOJRaisesRatesTo31YearHigh 🇯🇵📈
The Bank of Japan has taken another major step by raising interest rates to their highest level in 31 years, putting global markets on alert. The move signals a continued shift away from Japan’s long-standing ultra-loose monetary policy. Higher Japanese rates could strengthen the yen, influence global bond yields, and potentially impact capital flows across financial markets. Crypto and risk assets may also react as investors reassess liquidity and risk exposure. Traders are now watching the BOJ’s next statements closely for clues about future rate decisions. Volatility could increase as markets digest the policy change and its potential global impact. #BOJ #Japan #Crypto #Markets #InterestRates $NVDAB
maqsoodahmed1
·1 Likes
·49 views
BuffettStepsDownAsBerkshireChairman
55,567 views
891 Discussing
XRPExchangeReservesHitSevenYearLow
58,648 views
847 Discussing