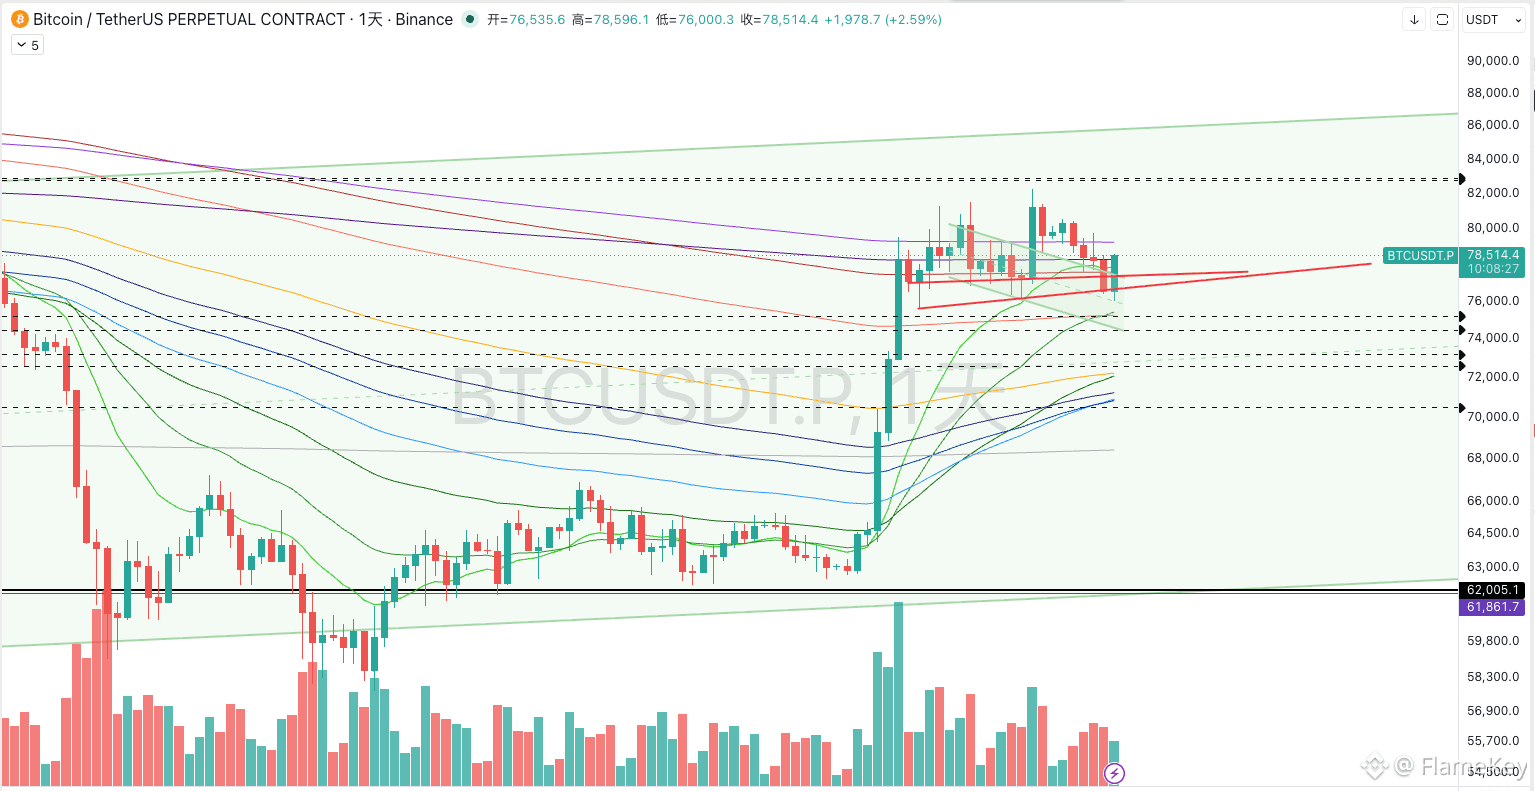
CPI data is good news, and the US stocks and $BTC both started to rally. If today BTC closes above 78,300, then the daily engulfing pattern will be confirmed. Then on the weekend, we’ll see altcoins and mreme put on a show! $牛来 $我踏马来了 $marscoin are all great.
I’m taking today off, so there won’t be a livestream. The overall market is still choppy. Don’t worry too much. The key date is still the 15th. With the fluctuations over the past two days, the small-cap alts should have some movement.
Brothers, I'm taking a day off today and won't be streaming. The non-farm payroll and unemployment data were somewhat bearish, so $BTC has already fallen back and retested. At the moment, BTC looks to be pulling back to around 79k~78.6k. If it holds steady, it can continue rising over the weekend.
Bought a bit of $GIGGLE and $我踏马来了 as lottery tickets. The logic is that the distribution phase time is about right, and the fundamentals and overall condition are still okay. What if the rally starts in mid-September?
Also, one more thing about $牛来 —I think “bull” is a very good coin. Fast-track alpha and the derivatives market and contract also suggest the project is related and has connections. But the distribution time isn’t enough and the concentration of holdings isn’t high enough, so it may still need a shakeout. After the shakeout, I guess it will be around Chinese New Year.
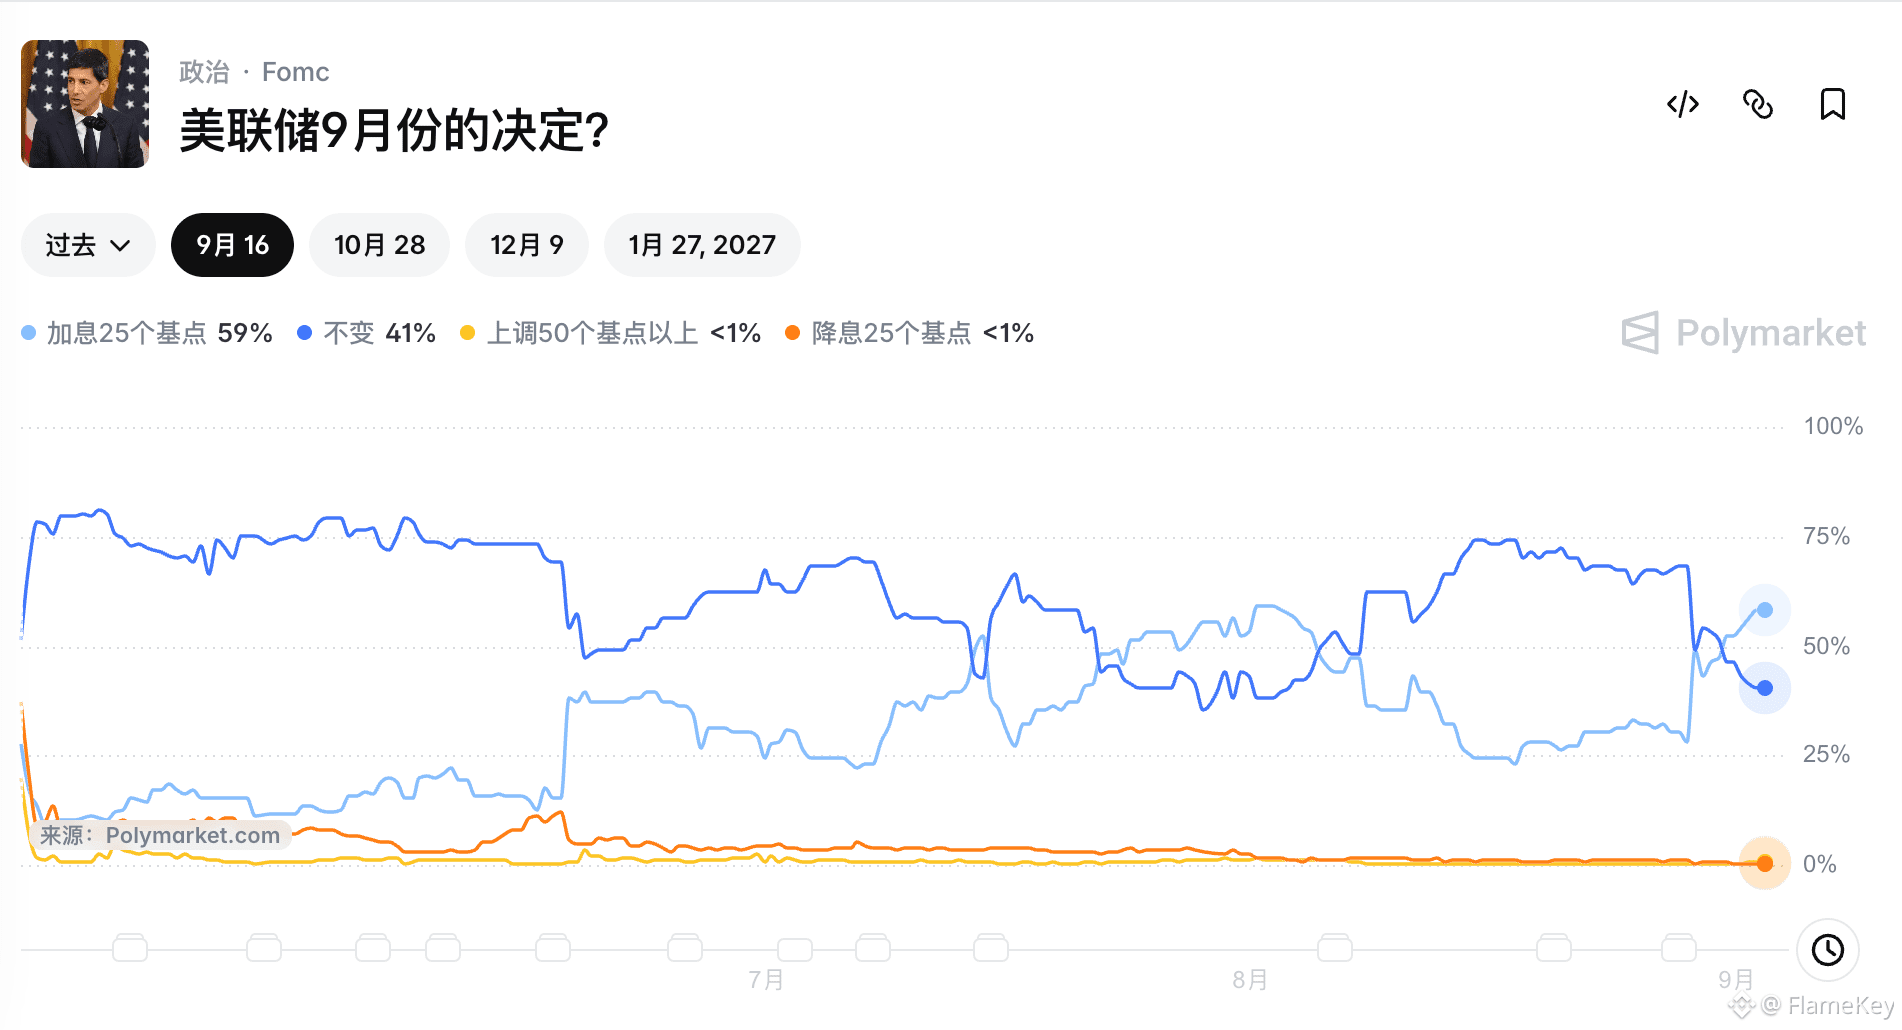
$BTC As scheduled, it fell, mainly due to two factors: the deterioration of the Iran-U.S. relationship, along with a higher expectation of a rate hike in September. Currently, the probability of a September rate hike is already close to 60%. For Bitcoin here, a pullback needs to test the support around 75,500–75,000. If that breaks, then it should go to around 72,500.😅
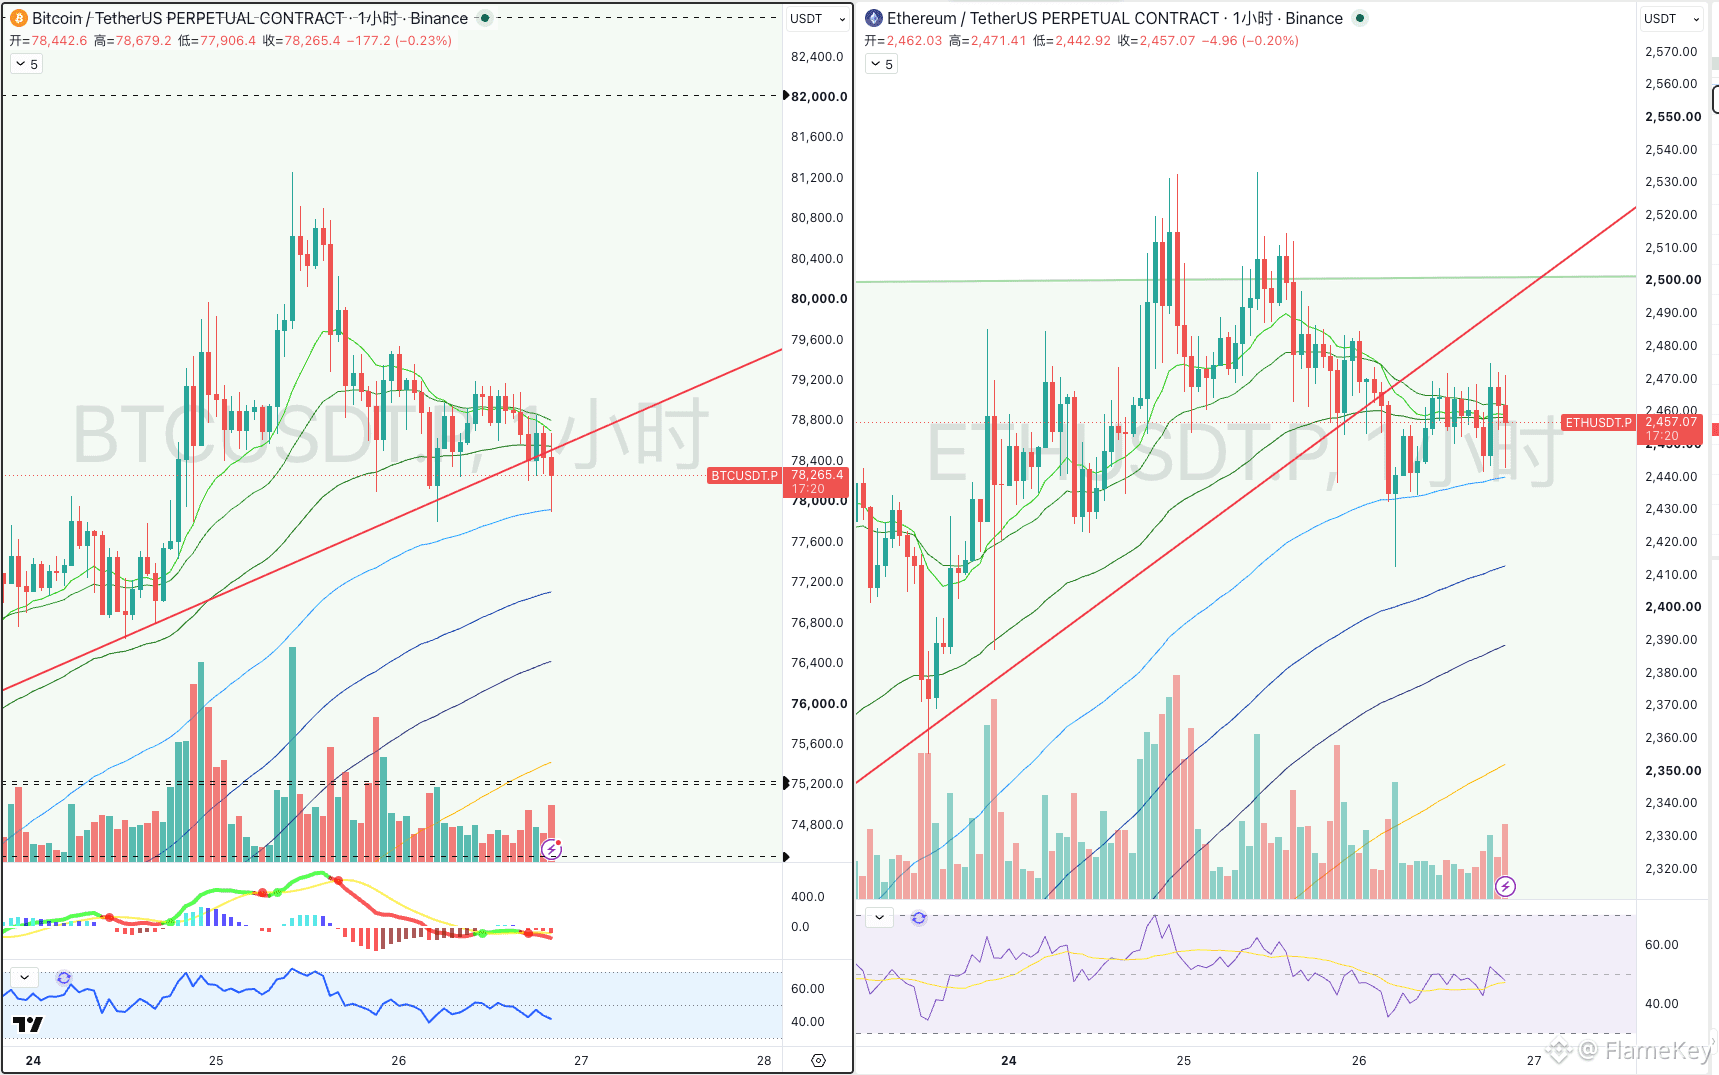
💹BTC August 26 Evening Market Analysis Current price: $78,432
Analysis of the current price status BTC is currently trading around $78,432 and has already approached the resistance near $78,515. On the upside, the main resistance area to watch is $78,515–$78,786. On the downside, the main support area to watch is $77,851–$78,239. This position is not suitable for chasing higher directly; it’s more appropriate to wait for a breakout and confirmation, or for a pullback to confirm. The daily RSI is overheated, so the risk-reward ratio for chasing is reduced.
Technical analysis outlook for BTC The technical outlook is: overall bearish, and in the short term, any rallies should mainly serve as confirmation of resistance. 1-hour price is below the SMA20, and 4-hour price is also below the SMA20; however, the daily price is above the SMA20. The 1-hour MACD remains weak, and the 4-hour MACD remains weak. The 1-hour RSI is 43.3, the 4-hour RSI is 56.7, and the daily RSI is 79.5. Price is trading below the Bollinger middle band; the lower band reference is $78,239. Current volume is close to the average—temporarily, treat it as a normal range-bound consolidation.
💹ETH August 26 Evening Market Analysis Current price: $2,462
Analysis of the current price status ETH is currently trading around $2,462 and has already approached support near $2,460. On the upside, the main resistance area to watch is $2,465–$2,476. On the downside, the main support area to watch is $2,438–$2,460. This position is not suitable for chasing shorting directly; it’s more appropriate to wait for confirmation of support holding or breaking. The daily RSI is overheated, so the risk-reward ratio for chasing is reduced.
Technical analysis outlook for ETH The technical outlook is: bullish on the larger timeframe, with short-term consolidation and repair. 1-hour price is above the SMA20, and 4-hour price is also above the SMA20; the daily price is above the SMA20. The 1-hour MACD histogram is positive, while the 4-hour MACD negative histogram is narrowing. The 1-hour RSI is 49.4, the 4-hour RSI is 58.0, and the daily RSI is 75.9. Price is trading above the Bollinger middle band; overhead pressure reference is $2,477. Current volume is close to the average—temporarily, treat it as a normal range-bound consolidation.