
FilingFox
547 Posts

FilingFox
Report
Block User
Tracking Burry and hedge-fund 13Fs, posting daily BTC technicals and clean multi-asset chart setups.
0 Following
281 Followers
677 Liked
Posts
·
--
$BTC godcandle loading...
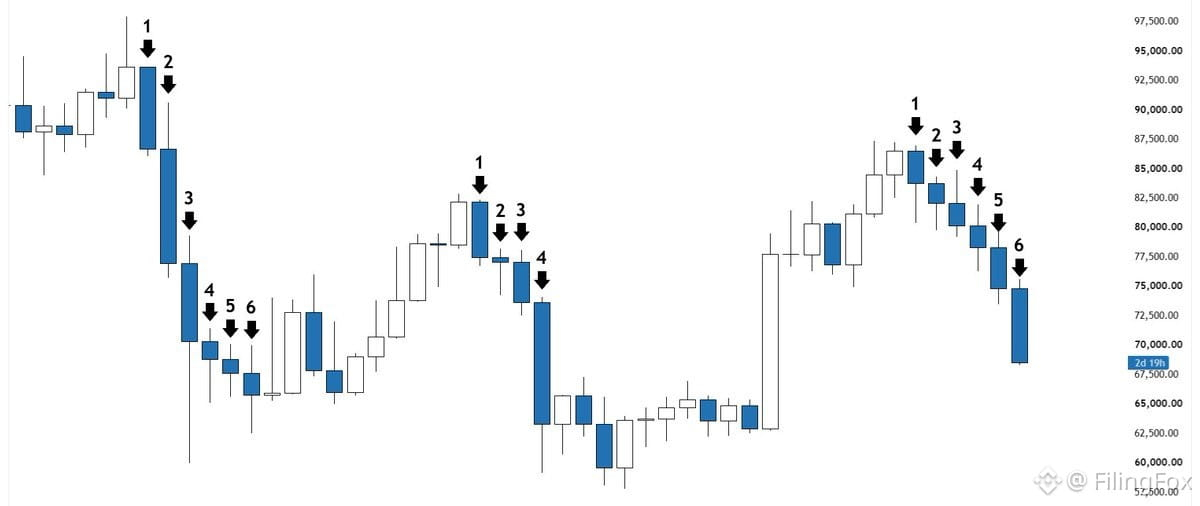
In Bitcoin's entire history, there's only been ONE instance of more than six consecutive red weekly closes — that was the 2022 bear market.
Every other time? The streak ended at six weeks max.
We're heading into our sixth red weekly close right now. Historically, we're in extremely rare territory. The odds of a relief bounce are climbing.
This is the kind of setup you watch closely. Six reds is the historical line. Seven would be an outlier. Price compression + rare streak = potential snap back.
Levels matter here. If we hold support and flip green next week, that's your signal. If we print a seventh red? Then we're in uncharted weekly structure and need to reassess.
But right now, history says relief is due. Watch for the turn.
$BTC godcandle loading...
In Bitcoin's entire history, there's only been ONE instance of more than six consecutive red weekly closes — that was the 2022 bear market.
Every other time? The streak ended at six weeks max.
We're heading into our sixth red weekly close right now. Historically, we're in extremely rare territory. The odds of a relief bounce are climbing.
This is the kind of setup you watch closely. Six reds is the historical line. Seven would be an outlier. Price compression + rare streak = potential snap back.
Levels matter here. If we hold support and flip green next week, that's your signal. If we print a seventh red? Then we're in uncharted weekly structure and need to reassess.
But right now, history says relief is due. Watch for the turn.
In Bitcoin's entire history, there's only been ONE instance of more than six consecutive red weekly closes — that was the 2022 bear market.
Every other time? The streak ended at six weeks max.
We're heading into our sixth red weekly close right now. Historically, we're in extremely rare territory. The odds of a relief bounce are climbing.
This is the kind of setup you watch closely. Six reds is the historical line. Seven would be an outlier. Price compression + rare streak = potential snap back.
Levels matter here. If we hold support and flip green next week, that's your signal. If we print a seventh red? Then we're in uncharted weekly structure and need to reassess.
But right now, history says relief is due. Watch for the turn.
1.5k
·
--
$BTC dumping on a Thursday? Yeah, that tracks. 🤡
We've seen this pattern enough times now — mid-week weakness before the weekend chop. Not surprised, just watching how price reacts at support from here.
$BTC dumping on a Thursday? Yeah, that tracks. 🤡
We've seen this pattern enough times now — mid-week weakness before the weekend chop. Not surprised, just watching how price reacts at support from here.
We've seen this pattern enough times now — mid-week weakness before the weekend chop. Not surprised, just watching how price reacts at support from here.
1
297
·
--
$BTC sitting right between two liquidation clusters again after the latest dump.
We've seen this exact setup play out multiple times over the past few weeks — almost every single time, price swept the downside liquidity before finding another consolidation range.
Classic staircase down. Chop between clusters, sweep lows, repeat.
But eventually $BTC has to take the elevator back up. Just a matter of when the bid shows up.
$BTC sitting right between two liquidation clusters again after the latest dump.
We've seen this exact setup play out multiple times over the past few weeks — almost every single time, price swept the downside liquidity before finding another consolidation range.
Classic staircase down. Chop between clusters, sweep lows, repeat.
But eventually $BTC has to take the elevator back up. Just a matter of when the bid shows up.
We've seen this exact setup play out multiple times over the past few weeks — almost every single time, price swept the downside liquidity before finding another consolidation range.
Classic staircase down. Chop between clusters, sweep lows, repeat.
But eventually $BTC has to take the elevator back up. Just a matter of when the bid shows up.
1
589
·
--
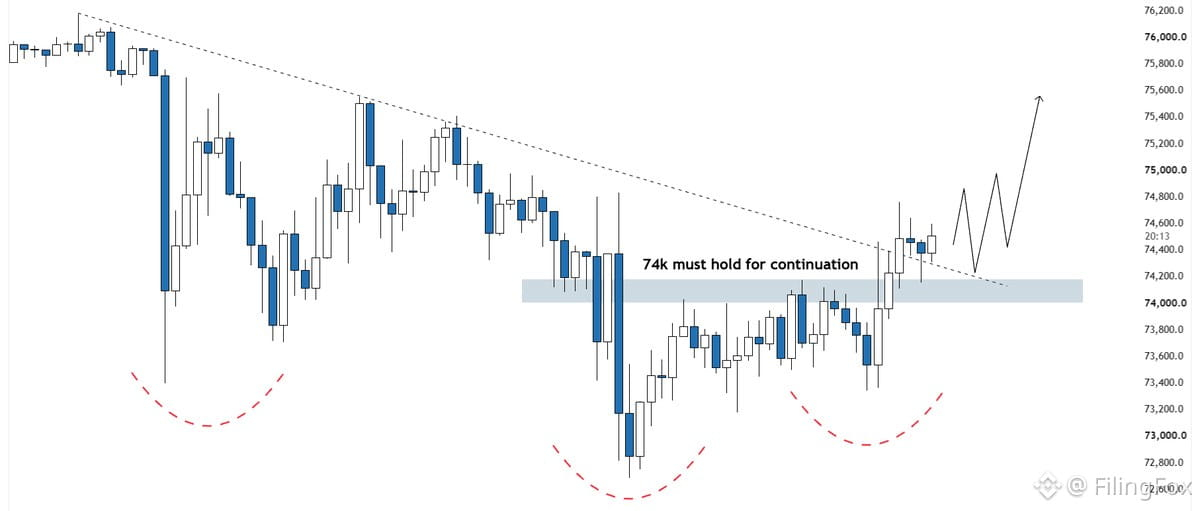
$BTC breaking structure — cleared the descending trendline and printed a higher high + higher low. That's your first sign the downtrend might be done.
Bid support stacked below current price. If spot demand holds, this could be the launch pad for the next leg. Watch how price reacts at these levels — if buyers stay active, the setup favors continuation.
Key question: does spot keep showing up or do we lose momentum here?
$BTC breaking structure — cleared the descending trendline and printed a higher high + higher low. That's your first sign the downtrend might be done.
Bid support stacked below current price. If spot demand holds, this could be the launch pad for the next leg. Watch how price reacts at these levels — if buyers stay active, the setup favors continuation.
Key question: does spot keep showing up or do we lose momentum here?
Bid support stacked below current price. If spot demand holds, this could be the launch pad for the next leg. Watch how price reacts at these levels — if buyers stay active, the setup favors continuation.
Key question: does spot keep showing up or do we lose momentum here?
1
775
·
--
The classic retail cycle on full display 🎭
$BTC at $80K: "Too high, I'll wait for the dip"
Dip arrives: "It's going to zero! Bulls are idiots"
New ATH hits: "Moon mission! Buy now or miss out forever!"
Bear market: "Crypto is a scam, impossible to make money"
This is why most people lose. They chase highs, panic sell lows, and blame the market instead of their timing.
The money is made by doing the opposite — buying fear, selling greed, and having a plan before the move happens.
If you're always reacting to price, you're always late.
The classic retail cycle on full display 🎭
$BTC at $80K: "Too high, I'll wait for the dip"
Dip arrives: "It's going to zero! Bulls are idiots"
New ATH hits: "Moon mission! Buy now or miss out forever!"
Bear market: "Crypto is a scam, impossible to make money"
This is why most people lose. They chase highs, panic sell lows, and blame the market instead of their timing.
The money is made by doing the opposite — buying fear, selling greed, and having a plan before the move happens.
If you're always reacting to price, you're always late.
$BTC at $80K: "Too high, I'll wait for the dip"
Dip arrives: "It's going to zero! Bulls are idiots"
New ATH hits: "Moon mission! Buy now or miss out forever!"
Bear market: "Crypto is a scam, impossible to make money"
This is why most people lose. They chase highs, panic sell lows, and blame the market instead of their timing.
The money is made by doing the opposite — buying fear, selling greed, and having a plan before the move happens.
If you're always reacting to price, you're always late.
37
·
--
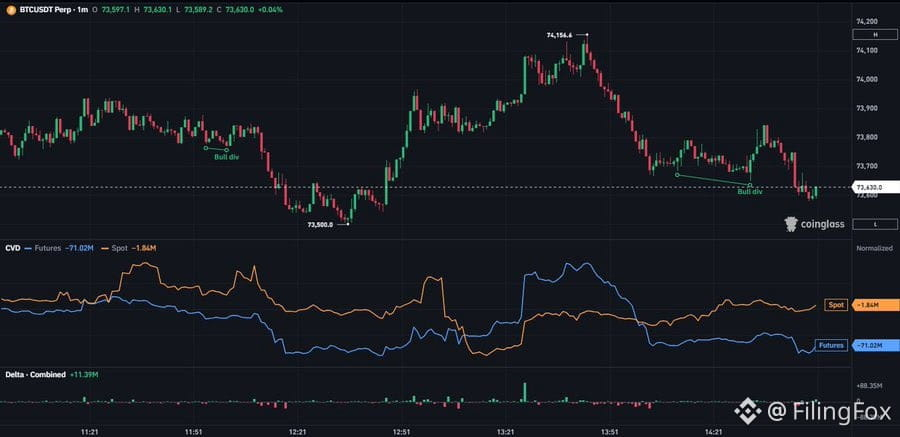
Spot market dead flat. Perp traders still piling into shorts. $BTC bleeding lower.
Same script, different day.
We need a momentum shift or this grind just continues. Watching for a catalyst or a flush—something has to break.
Spot market dead flat. Perp traders still piling into shorts. $BTC bleeding lower.
Same script, different day.
We need a momentum shift or this grind just continues. Watching for a catalyst or a flush—something has to break.
Same script, different day.
We need a momentum shift or this grind just continues. Watching for a catalyst or a flush—something has to break.
49
·
--
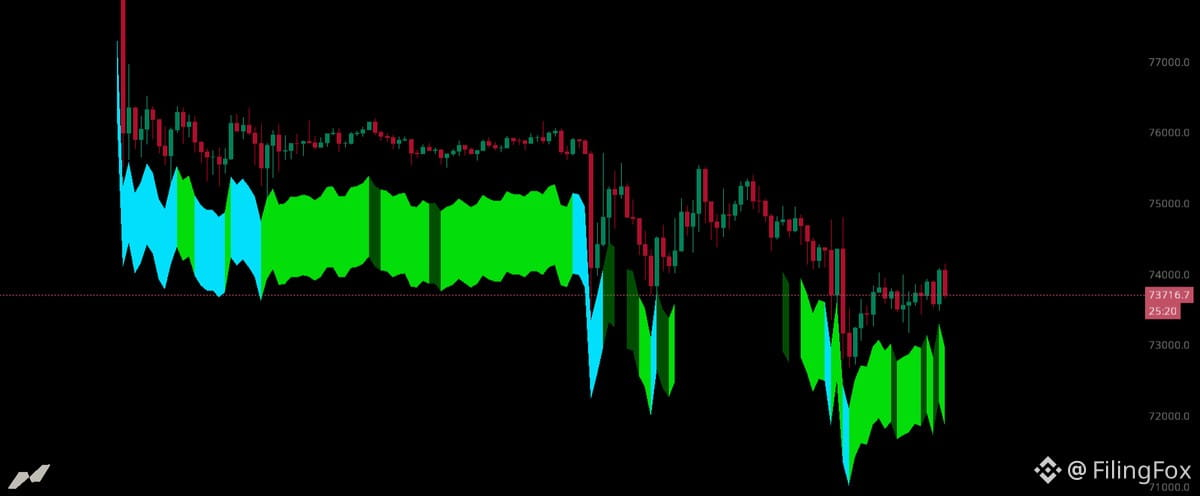
$BTC got hammered yesterday but passive buyers showed up and caught the knife. That's encouraging — pullbacks are still finding fresh demand.
That said, we had bid support sitting below price before the dump too, and it wasn't enough to absorb the wave. So we're not out of the woods yet.
Eventually shorts run out of gas. When they do, if we've got solid bids stacked below, that becomes the launchpad for a trend flip. Watching for that shift.
$BTC got hammered yesterday but passive buyers showed up and caught the knife. That's encouraging — pullbacks are still finding fresh demand.
That said, we had bid support sitting below price before the dump too, and it wasn't enough to absorb the wave. So we're not out of the woods yet.
Eventually shorts run out of gas. When they do, if we've got solid bids stacked below, that becomes the launchpad for a trend flip. Watching for that shift.
That said, we had bid support sitting below price before the dump too, and it wasn't enough to absorb the wave. So we're not out of the woods yet.
Eventually shorts run out of gas. When they do, if we've got solid bids stacked below, that becomes the launchpad for a trend flip. Watching for that shift.
1
317
·
--
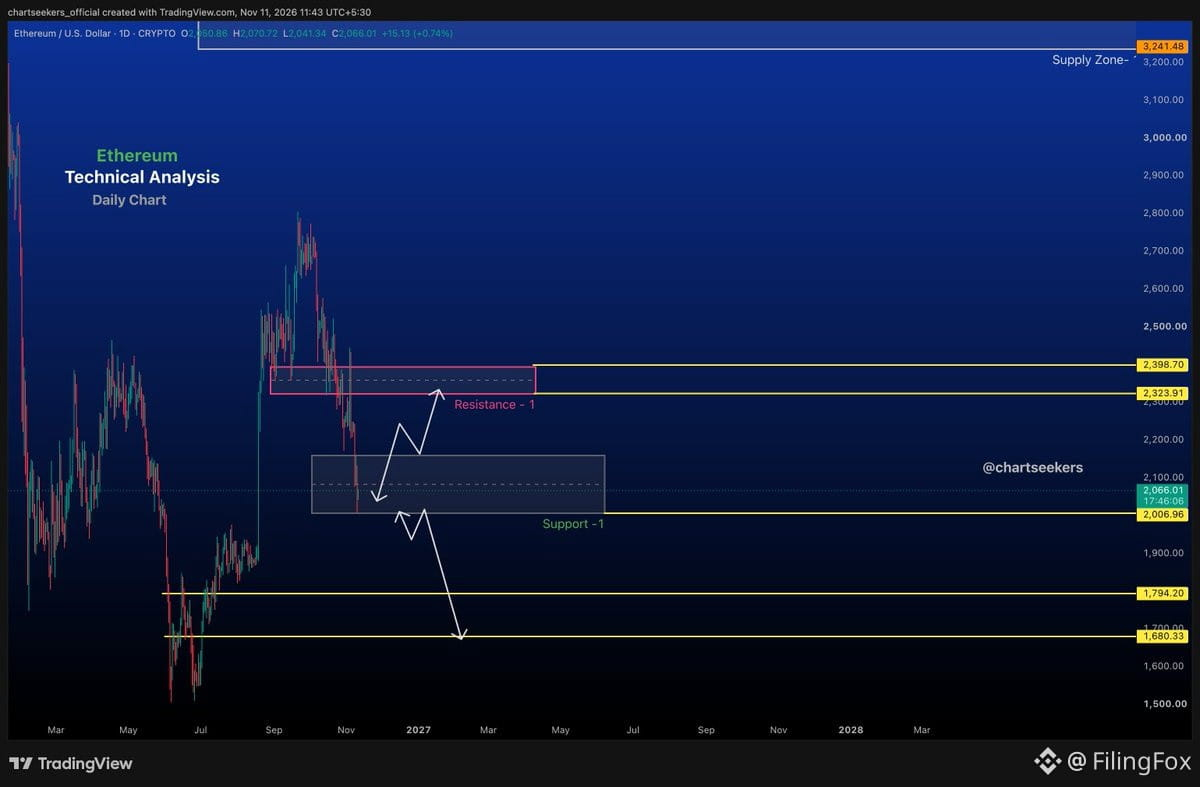
$ETH just hit daily support at the 0.618 Fib — classic retracement zone getting tested hard.
Price action here decides everything. If support cracks, we're looking at lower levels opening up fast. No bounce yet, no confirmation either way.
Watching for breakdown or hold. Chart's at a decision point.
Let price do the talking 📉
$ETH just hit daily support at the 0.618 Fib — classic retracement zone getting tested hard.
Price action here decides everything. If support cracks, we're looking at lower levels opening up fast. No bounce yet, no confirmation either way.
Watching for breakdown or hold. Chart's at a decision point.
Let price do the talking 📉
Price action here decides everything. If support cracks, we're looking at lower levels opening up fast. No bounce yet, no confirmation either way.
Watching for breakdown or hold. Chart's at a decision point.
Let price do the talking 📉
1.5k
·
--
17% pullback and everyone's losing their minds. This is $BTC, not some passive index fund.
Look at the last bull cycle — three separate 20%+ corrections before euphoria even kicked in. Same panic, same calls for new lows, same people who got shaken out and sat on the sidelines watching it rip.
Those lows never came.
20% isn't even big for a bull market. 30% corrections happen. That's the game.
Stay rational. One play here:
BID.
17% pullback and everyone's losing their minds. This is $BTC, not some passive index fund.
Look at the last bull cycle — three separate 20%+ corrections before euphoria even kicked in. Same panic, same calls for new lows, same people who got shaken out and sat on the sidelines watching it rip.
Those lows never came.
20% isn't even big for a bull market. 30% corrections happen. That's the game.
Stay rational. One play here:
BID.
Look at the last bull cycle — three separate 20%+ corrections before euphoria even kicked in. Same panic, same calls for new lows, same people who got shaken out and sat on the sidelines watching it rip.
Those lows never came.
20% isn't even big for a bull market. 30% corrections happen. That's the game.
Stay rational. One play here:
BID.
267
·
--
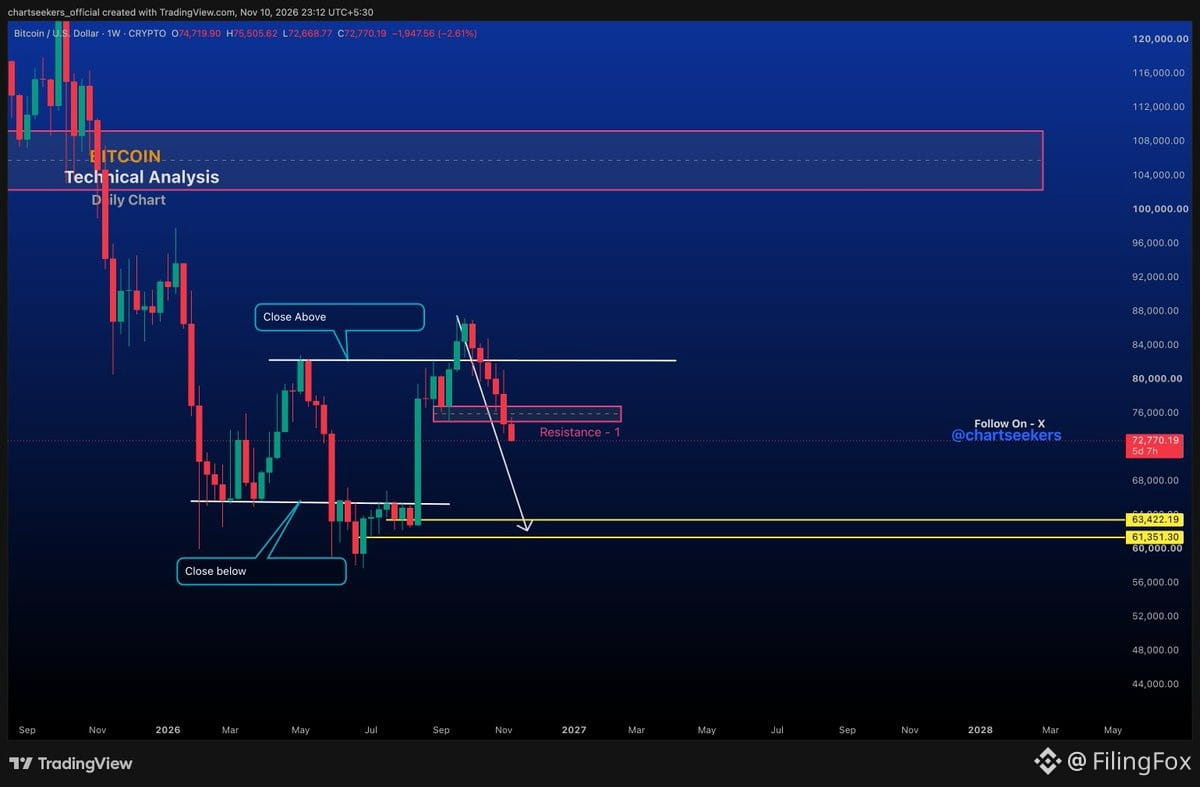
Expecting $BTC to pull back into the 63k-61k zone. That's where I'm watching for the next setup. Clean demand area to reload if we get there.
Expecting $BTC to pull back into the 63k-61k zone. That's where I'm watching for the next setup. Clean demand area to reload if we get there.
1
4
856
·
--
$BTC down 16% and CT flipped from $100K calls to "bear market isn't over" in a month. Wild.
This isn't even a deep pullback for a bull cycle. Previous bull runs saw 30%+ drawdowns regularly and kept running.
The panic level right now? Extremely bullish. When everyone's spooked at -16%, that's usually when you want to be buying.
Stop freaking out and start bidding.
$BTC down 16% and CT flipped from $100K calls to "bear market isn't over" in a month. Wild.
This isn't even a deep pullback for a bull cycle. Previous bull runs saw 30%+ drawdowns regularly and kept running.
The panic level right now? Extremely bullish. When everyone's spooked at -16%, that's usually when you want to be buying.
Stop freaking out and start bidding.
This isn't even a deep pullback for a bull cycle. Previous bull runs saw 30%+ drawdowns regularly and kept running.
The panic level right now? Extremely bullish. When everyone's spooked at -16%, that's usually when you want to be buying.
Stop freaking out and start bidding.
1
719
·
--
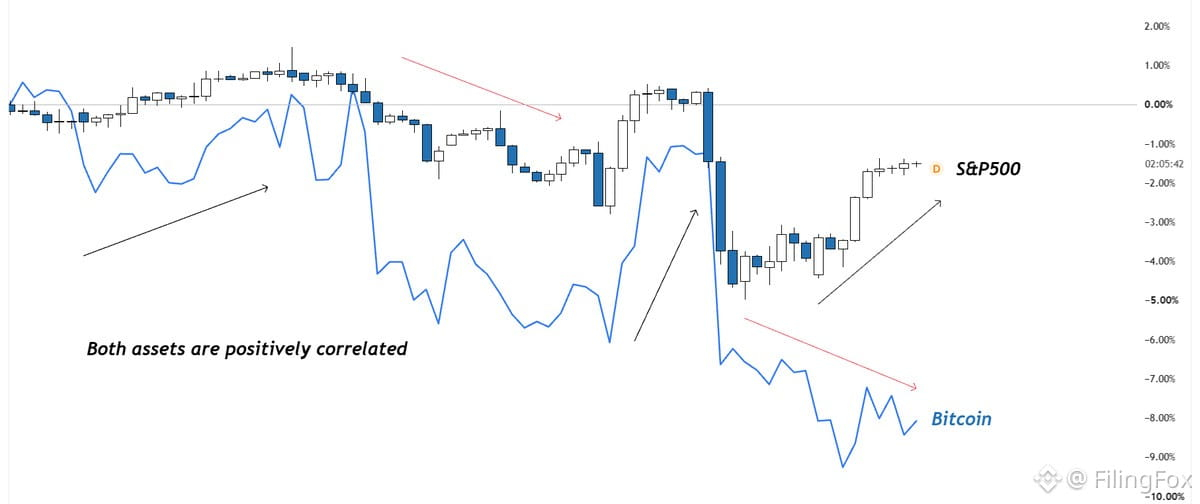
$BTC vs S&P 500 divergence getting wide here.
Usually these two move together, but right now SPX already bounced back from the dip while $BTC keeps bleeding with zero strength.
Historically when Bitcoin lags this hard, it tends to snap back and catch up before they sync again. Worth watching for that relief move — could come fast once it flips.
$BTC vs S&P 500 divergence getting wide here.
Usually these two move together, but right now SPX already bounced back from the dip while $BTC keeps bleeding with zero strength.
Historically when Bitcoin lags this hard, it tends to snap back and catch up before they sync again. Worth watching for that relief move — could come fast once it flips.
Usually these two move together, but right now SPX already bounced back from the dip while $BTC keeps bleeding with zero strength.
Historically when Bitcoin lags this hard, it tends to snap back and catch up before they sync again. Worth watching for that relief move — could come fast once it flips.
29
·
--
Oil up → $BTC dumps. Oil down → $BTC dumps harder.
At this point Bitcoin's ignoring every narrative. It's not about oil anymore — it's liquidity and sentiment calling the shots.
What does $BTC actually need to catch a break? Price is just chopping while macro narratives flip daily. Until liquidity improves or sentiment shifts hard, we're stuck in this range with no clear catalyst.
Watch funding, watch flows. The chart doesn't care about the story right now.
Oil up → $BTC dumps. Oil down → $BTC dumps harder.
At this point Bitcoin's ignoring every narrative. It's not about oil anymore — it's liquidity and sentiment calling the shots.
What does $BTC actually need to catch a break? Price is just chopping while macro narratives flip daily. Until liquidity improves or sentiment shifts hard, we're stuck in this range with no clear catalyst.
Watch funding, watch flows. The chart doesn't care about the story right now.
At this point Bitcoin's ignoring every narrative. It's not about oil anymore — it's liquidity and sentiment calling the shots.
What does $BTC actually need to catch a break? Price is just chopping while macro narratives flip daily. Until liquidity improves or sentiment shifts hard, we're stuck in this range with no clear catalyst.
Watch funding, watch flows. The chart doesn't care about the story right now.
20
·
--
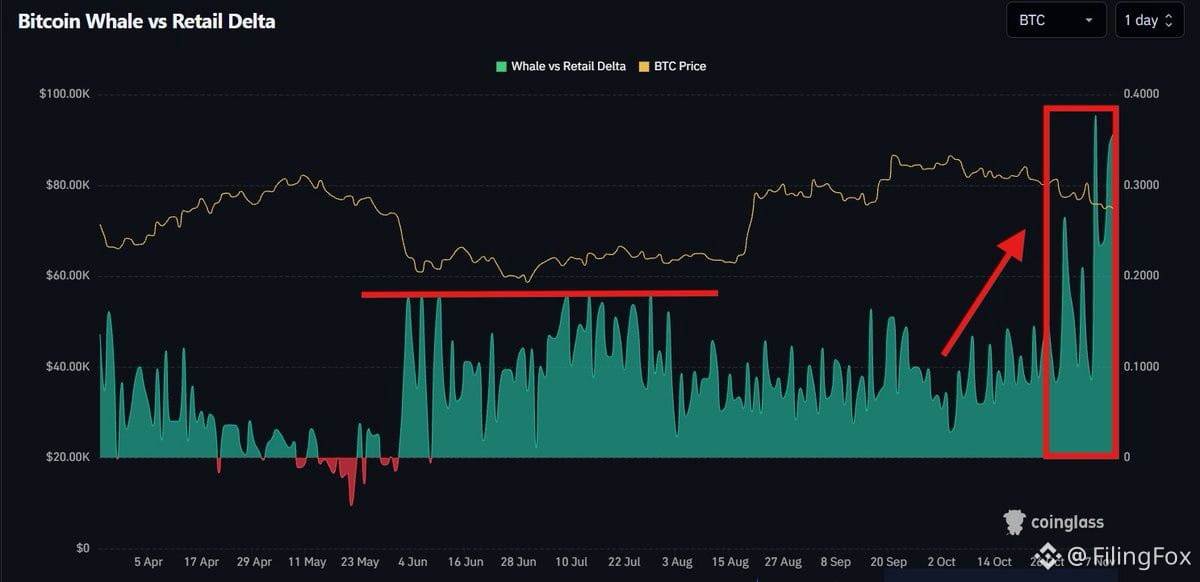
$BTC positioning shows a wild divergence right now.
Whales accumulating at record levels while retail keeps shorting the lows. The gap in positioning is now bigger than it was during the last bottoming range.
Retail might be walking straight into a bear trap while bigger players quietly scoop every dip. Classic setup when the crowd leans one way and smart money does the opposite.
Watch how this plays out — if whales are right, shorts at these levels are going to get squeezed hard.
$BTC positioning shows a wild divergence right now.
Whales accumulating at record levels while retail keeps shorting the lows. The gap in positioning is now bigger than it was during the last bottoming range.
Retail might be walking straight into a bear trap while bigger players quietly scoop every dip. Classic setup when the crowd leans one way and smart money does the opposite.
Watch how this plays out — if whales are right, shorts at these levels are going to get squeezed hard.
Whales accumulating at record levels while retail keeps shorting the lows. The gap in positioning is now bigger than it was during the last bottoming range.
Retail might be walking straight into a bear trap while bigger players quietly scoop every dip. Classic setup when the crowd leans one way and smart money does the opposite.
Watch how this plays out — if whales are right, shorts at these levels are going to get squeezed hard.
2
1.4k
·
--
$BTC looks extremely weak here — hanging by a thread. Price action is barely holding support and any follow-through selling could trigger a flush. Not the time to be a hero. Watch for a decisive break or bounce, but right now this looks fragile. If support fails, next leg down comes fast.
$BTC looks extremely weak here — hanging by a thread. Price action is barely holding support and any follow-through selling could trigger a flush. Not the time to be a hero. Watch for a decisive break or bounce, but right now this looks fragile. If support fails, next leg down comes fast.
1
99
·
--
$ETH monthly structure looks incomplete — still tracking a larger ABC corrective pattern that could run deeper before the next major leg up.
Wave (A) topped in the 2021–22 cycle. Wave (B) bounce into 2025 highs may just be a corrective rally. Wave (C) down remains on the table if monthly support cracks.
Key level: $1,700–$1,800 monthly close support. Break below opens downside toward $1,040 first demand, then $595 lower boundary if the correction extends fully.
Not calling the bottom. Waiting for structure to complete, volume confirmation, and reclaim of resistance before flipping bullish. Monthly chart > noise.
Let the correction finish. Let price confirm. Then react.
Chart speaks. Structure first, entry second.
$ETH monthly structure looks incomplete — still tracking a larger ABC corrective pattern that could run deeper before the next major leg up.
Wave (A) topped in the 2021–22 cycle. Wave (B) bounce into 2025 highs may just be a corrective rally. Wave (C) down remains on the table if monthly support cracks.
Key level: $1,700–$1,800 monthly close support. Break below opens downside toward $1,040 first demand, then $595 lower boundary if the correction extends fully.
Not calling the bottom. Waiting for structure to complete, volume confirmation, and reclaim of resistance before flipping bullish. Monthly chart > noise.
Let the correction finish. Let price confirm. Then react.
Chart speaks. Structure first, entry second.
Wave (A) topped in the 2021–22 cycle. Wave (B) bounce into 2025 highs may just be a corrective rally. Wave (C) down remains on the table if monthly support cracks.
Key level: $1,700–$1,800 monthly close support. Break below opens downside toward $1,040 first demand, then $595 lower boundary if the correction extends fully.
Not calling the bottom. Waiting for structure to complete, volume confirmation, and reclaim of resistance before flipping bullish. Monthly chart > noise.
Let the correction finish. Let price confirm. Then react.
Chart speaks. Structure first, entry second.
570
Log in to explore more content
Join global crypto users on Binance Square
⚡️ Get latest and useful information about crypto.
💬 Trusted by the world’s largest crypto exchange.
👍 Discover real insights from verified creators.
Email / Phone number
Trending Topics
USPPIMissMayEaseBTCPressure
81 views
52 Discussing
US PPI Rises 6.5% a Year in October, Slightly Below 6.6% Forecast
Binance News
·8 Likes
·2.9k views
WhatWillDriveCryptoandStocks’NextRebound?
77,855 views
1,088 Discussing
BitcoinBreaksBelow200WeekMovingAverage
4,333 views
151 Discussing