
空杯之心
13 Posts

空杯之心
Report
Block User
分享心得
Open Trade
High-Frequency Trader
9 Years
10 Following
9 Followers
2 Liked
Posts
Portfolio
·
--
Article
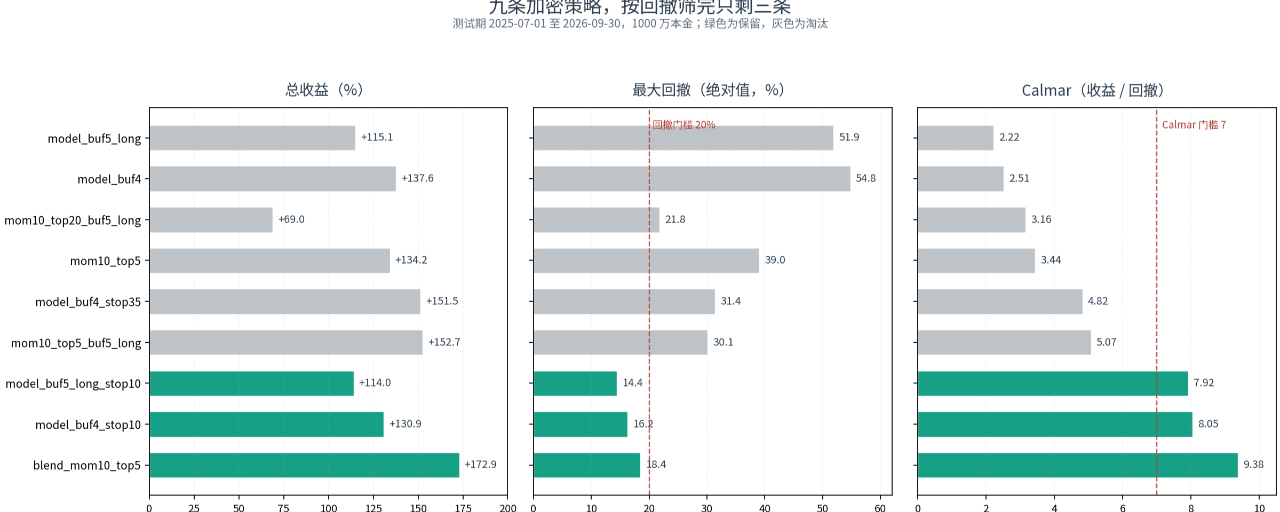
Cutting Nine Crypto Strategies Down to Three: If They Can’t Pass the Drawdown Test, They’re Out—No Matter How High the ReturnsAt the end of the previous installment, I wrote that the next one would cover three things: add a buffer and stop-loss to the fused signal, run the validation period, and then do a walk-forward test.
This installment didn’t follow that order.
After extending the data through October 21, I ran all nine strategies on the new forward window and reorganized the drawdown profiles for the test period. The decision after the runs: keep only three of the nine, and delete the other six, along with their strategy files and backtest results.
The six that were deleted weren’t unprofitable. Five had test-period returns above +115%, and the top performer returned +152.67%. But their maximum drawdowns ranged from -21.8% to -54.8%, and the longest time underwater was 232 trading days. Curves like these may look fine in a backtest, but in a live account, most people wouldn’t be able to hold on until they recovered.
Cutting Nine Crypto Strategies Down to Three: If They Can’t Pass the Drawdown Test, They’re Out—No Matter How High the Returns
At the end of the previous installment, I wrote that the next one would cover three things: add a buffer and stop-loss to the fused signal, run the validation period, and then do a walk-forward test.
This installment didn’t follow that order.
After extending the data through October 21, I ran all nine strategies on the new forward window and reorganized the drawdown profiles for the test period. The decision after the runs: keep only three of the nine, and delete the other six, along with their strategy files and backtest results.
The six that were deleted weren’t unprofitable. Five had test-period returns above +115%, and the top performer returned +152.67%. But their maximum drawdowns ranged from -21.8% to -54.8%, and the longest time underwater was 232 trading days. Curves like these may look fine in a backtest, but in a live account, most people wouldn’t be able to hold on until they recovered.
This installment didn’t follow that order.
After extending the data through October 21, I ran all nine strategies on the new forward window and reorganized the drawdown profiles for the test period. The decision after the runs: keep only three of the nine, and delete the other six, along with their strategy files and backtest results.
The six that were deleted weren’t unprofitable. Five had test-period returns above +115%, and the top performer returned +152.67%. But their maximum drawdowns ranged from -21.8% to -54.8%, and the longest time underwater was 232 trading days. Curves like these may look fine in a backtest, but in a live account, most people wouldn’t be able to hold on until they recovered.
402
·
--
BTC is holding very firmly around 80,000. After a high-volume drop on the 1-hour candle just now, it quickly rebounded and closed with a lower wick. If 80,000 holds, it should make a V-shaped recovery.
{future}(BTCUSDT)
BTC is holding very firmly around 80,000. After a high-volume drop on the 1-hour candle just now, it quickly rebounded and closed with a lower wick. If 80,000 holds, it should make a V-shaped recovery.
170
·
--
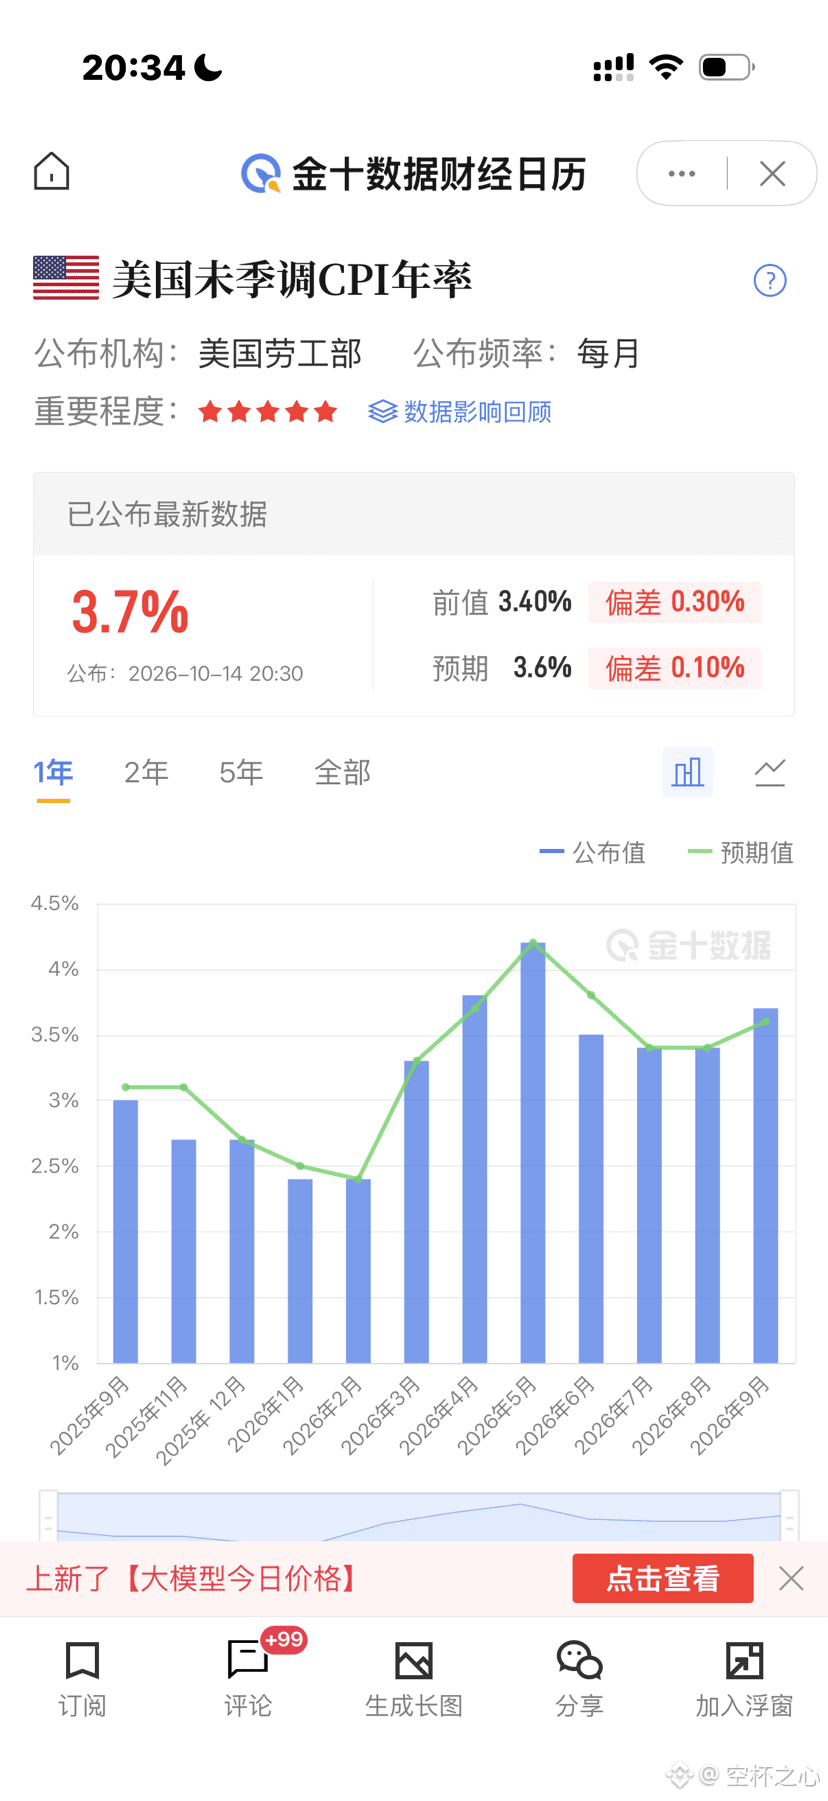
September CPI came in 0.1% higher than expected, pushing rate hike expectations up again, and BTC fell in response in the short term. Combined with Coinbase's recent sustained negative BTC premium and several major ETFs seeing net outflows for multiple consecutive days, this suggests the US market has been selling recently as it prices in rate hike expectations. However, BTC is still trading within the 82,000–84,000 range and hasn't entered a downtrend. Once the rate hike expectations have been mostly priced in, it will naturally rise. #BTC走势分析
September CPI came in 0.1% higher than expected, pushing rate hike expectations up again, and BTC fell in response in the short term. Combined with Coinbase's recent sustained negative BTC premium and several major ETFs seeing net outflows for multiple consecutive days, this suggests the US market has been selling recently as it prices in rate hike expectations. However, BTC is still trading within the 82,000–84,000 range and hasn't entered a downtrend. Once the rate hike expectations have been mostly priced in, it will naturally rise. #BTC走势分析
184
Log in to explore more content
Join global crypto users on Binance Square
⚡️ Get latest and useful information about crypto.
💬 Trusted by the world’s largest crypto exchange.
👍 Discover real insights from verified creators.
Email / Phone number
Trending Topics
NvidiaBeatsEstimatesWith$130BQ4Outlook
52,752 views
273 Discussing
Nvidia Beats With $115.8 Billion in Revenue, Guides to $130 Billion and Adds $150 Billion Buyback
Binance News
·73 Likes
·48.4k views
AnthropicIPOPriceCouldExceed$80
53,785 views
233 Discussing
RussiaCentralBankAddsAlfaBankToCryptoExchangeRegister
3,034 views
43 Discussing