
笔谈
545 Posts

笔谈
市场是持续震荡与单边交替进行,没有只升不降的波浪。
Open Trade
Frequent Trader
2.4 Years
69 Following
3.6K+ Followers
2.6K+ Liked
Posts
Portfolio
All
Quotes
Live
The four-year BTC cycle: the easiest mistake is to treat years as direction.
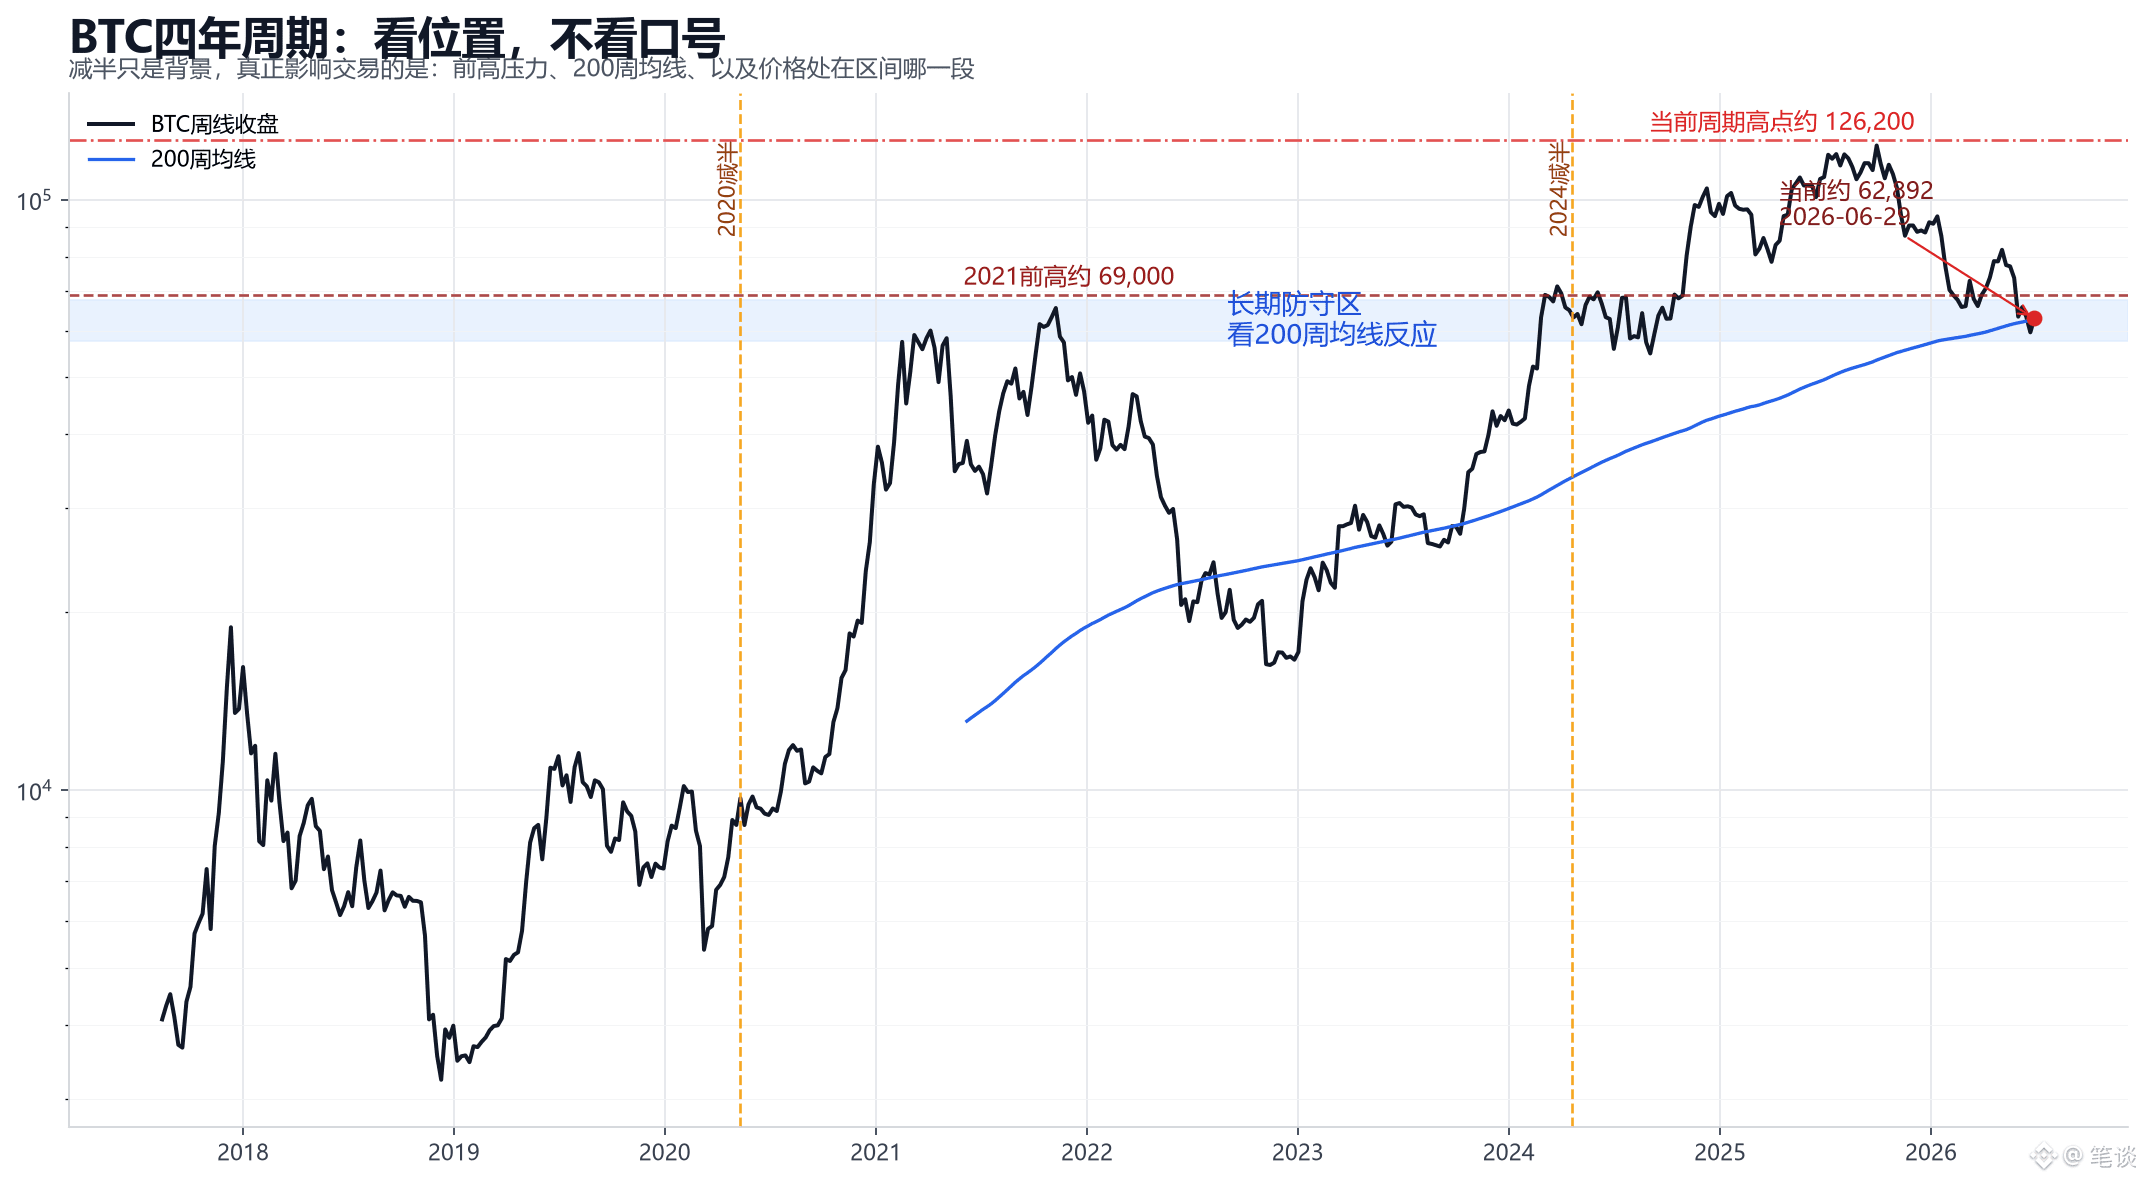
$BTC What you should look at now isn’t “what will happen in which year for sure,” but three key locations: the 2021 previous high, the current cycle’s high point, and the 200-week moving average.
Halving changes the narrative, but it won’t do the work of choosing an entry point for you.
What’s truly useful is this: when price approaches the prior high on the weekly chart, whether it gains volume and holds; and during pullbacks, whether there’s buy support near the long-term moving average.
In this chart, I focus on two layers:
The upper high-point zone—this is where people often confuse the cycle story with “breakout confirmation.”
The area near the 200-week moving average below—currently about 62,657—which is more like an observation area to see whether long-term capital is willing to step in.
Right now, the price is about 0.4% away from the 200-week moving average, which means it’s not a “cheap deal” at a low level, nor is it something you can blindly chase.
The invalidation conditions are simple:
If the weekly chart can’t reclaim and hold the key high zone, then any notion of “cycle continuation” is discounted for now; if, after a pullback, it can trade back up with increased volume near the long-term moving average, then you can start talking about a new round of structural repair.
You can use the four-year cycle as a reference, but don’t let the cycle place your orders. The real “cost” is paying when the story feels most convenient—then forgetting to check the actual location.
#BTC走势 #Cycle Analysis
$BTC What you should look at now isn’t “what will happen in which year for sure,” but three key locations: the 2021 previous high, the current cycle’s high point, and the 200-week moving average.
Halving changes the narrative, but it won’t do the work of choosing an entry point for you.
What’s truly useful is this: when price approaches the prior high on the weekly chart, whether it gains volume and holds; and during pullbacks, whether there’s buy support near the long-term moving average.
In this chart, I focus on two layers:
The upper high-point zone—this is where people often confuse the cycle story with “breakout confirmation.”
The area near the 200-week moving average below—currently about 62,657—which is more like an observation area to see whether long-term capital is willing to step in.
Right now, the price is about 0.4% away from the 200-week moving average, which means it’s not a “cheap deal” at a low level, nor is it something you can blindly chase.
The invalidation conditions are simple:
If the weekly chart can’t reclaim and hold the key high zone, then any notion of “cycle continuation” is discounted for now; if, after a pullback, it can trade back up with increased volume near the long-term moving average, then you can start talking about a new round of structural repair.
You can use the four-year cycle as a reference, but don’t let the cycle place your orders. The real “cost” is paying when the story feels most convenient—then forgetting to check the actual location.
#BTC走势 #Cycle Analysis
SOL only looks at one position before bed: 73.73 is the pullback resistance zone.
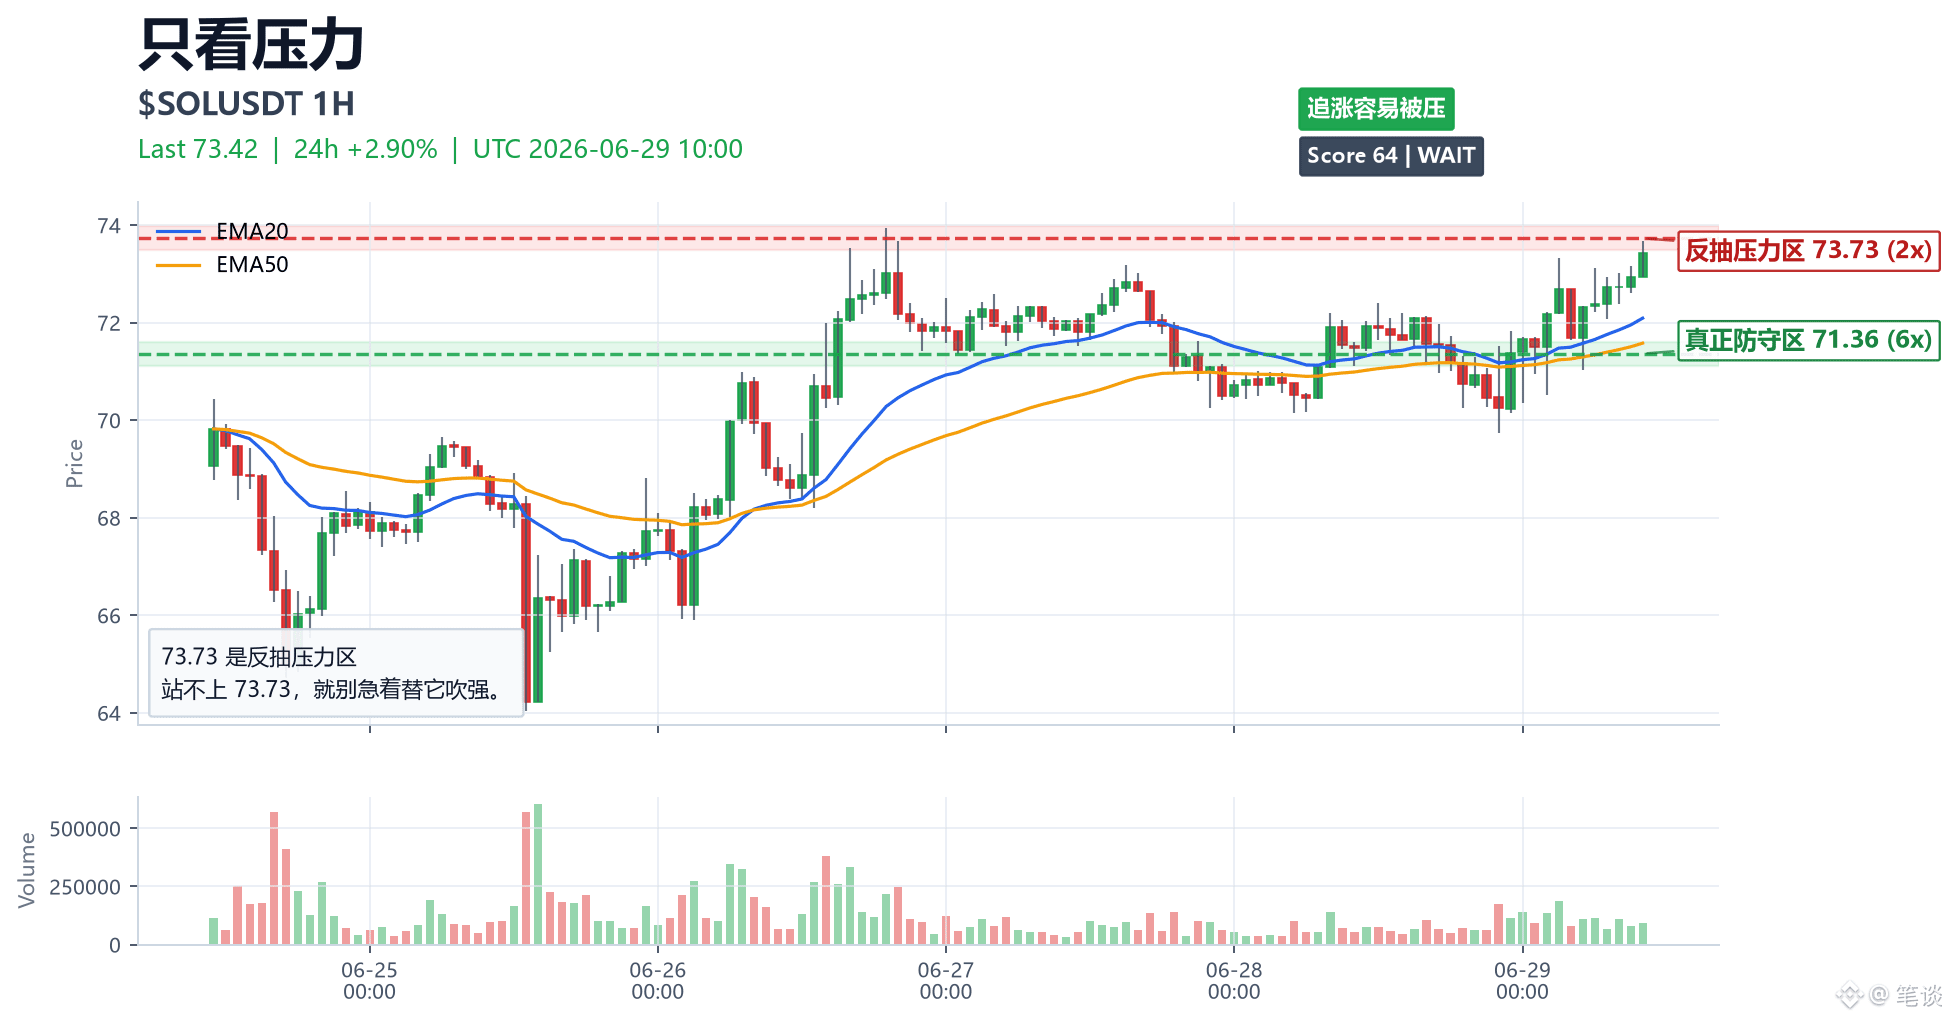
$SOL Tomorrow first look at: 73.73 is the pullback resistance zone.
If you can’t get above the resistance, don’t treat the pullback as a reversal; if it breaks through support and you can’t get it back, don’t rush to guess the bottom.
In situations like this, you don’t need to watch a bunch of indicators—understanding one key zone is more useful than chasing ten pieces of news.
#SOL走势 #market analysis
$SOL Tomorrow first look at: 73.73 is the pullback resistance zone.
If you can’t get above the resistance, don’t treat the pullback as a reversal; if it breaks through support and you can’t get it back, don’t rush to guess the bottom.
In situations like this, you don’t need to watch a bunch of indicators—understanding one key zone is more useful than chasing ten pieces of news.
#SOL走势 #market analysis
SOL heats up quickly, but it doesn’t mean it can go far. First, take a look at 72.55—this is the pullback pressure zone.
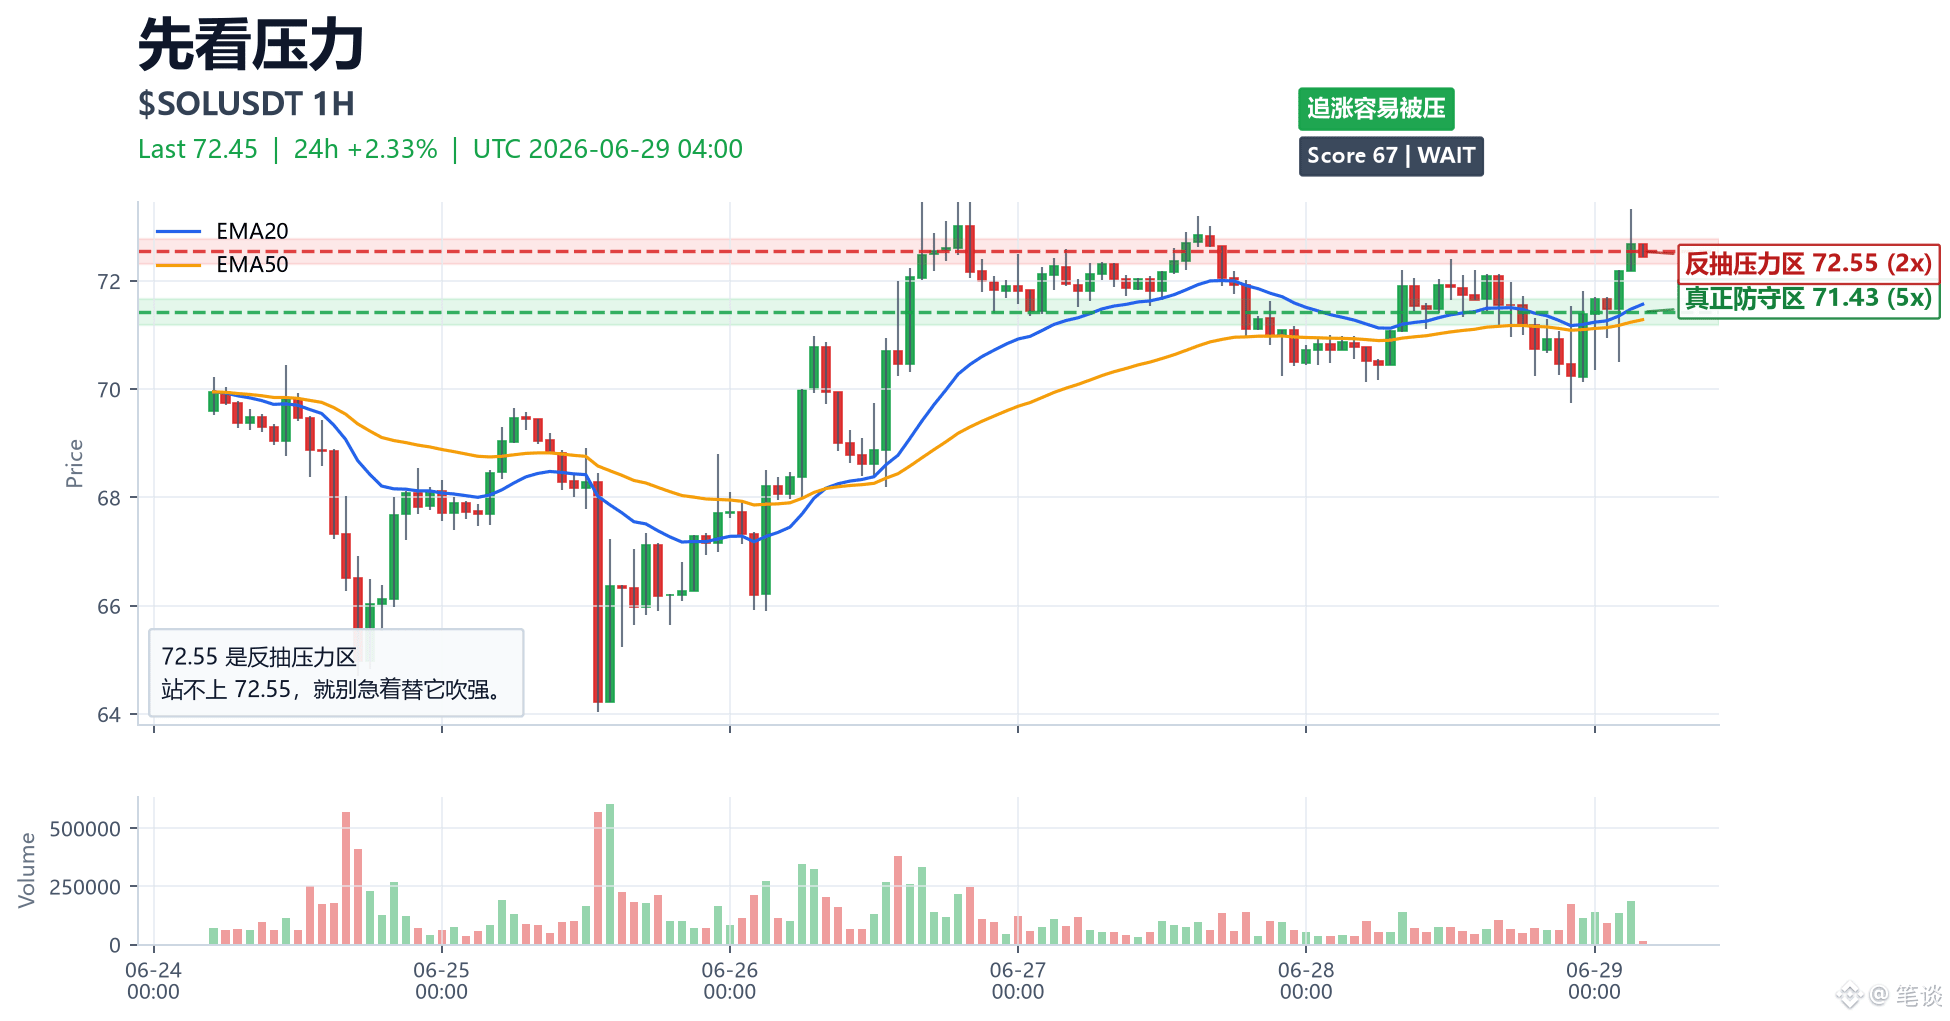
$SOL 24h +2.33%. For this one, I only look at one area: 72.55 is the pullback pressure zone.
If the price just pushes into the pressure zone but the volume can’t keep up, the “hot” momentum can easily turn into a chase-and-trap.
Only if there are buyers stepping in at a key level on the pullback does the momentum have a foundation to continue.
The two zones on the chart come from the clustering of swing highs and lows across the most recent 120 K-lines:
Pressure is near 72.55.
Support/defense is near 71.43.
Now don’t let the percentage moves drive your decisions.
If you can’t stand above 72.55, don’t rush to hype it as strong.
The biggest point of disagreement here: some people are watching for a breakout, while others are watching for a bull trap/false move. I place more importance on whether the close can hold above it.
Invalidation conditions:
If it spikes up and then falls back below the EMA20, treat this as a failed breakout; 71.43 on the downside is the level to reassess.
You can watch the momentum, but don’t let the gainers/leaderboard decide for you.
#SOL走势 #market analysis
$SOL 24h +2.33%. For this one, I only look at one area: 72.55 is the pullback pressure zone.
If the price just pushes into the pressure zone but the volume can’t keep up, the “hot” momentum can easily turn into a chase-and-trap.
Only if there are buyers stepping in at a key level on the pullback does the momentum have a foundation to continue.
The two zones on the chart come from the clustering of swing highs and lows across the most recent 120 K-lines:
Pressure is near 72.55.
Support/defense is near 71.43.
Now don’t let the percentage moves drive your decisions.
If you can’t stand above 72.55, don’t rush to hype it as strong.
The biggest point of disagreement here: some people are watching for a breakout, while others are watching for a bull trap/false move. I place more importance on whether the close can hold above it.
Invalidation conditions:
If it spikes up and then falls back below the EMA20, treat this as a failed breakout; 71.43 on the downside is the level to reassess.
You can watch the momentum, but don’t let the gainers/leaderboard decide for you.
#SOL走势 #market analysis
Log in to explore more content