
Dmitry from Traders
22 Posts

Dmitry from Traders
Built real-time infrastructure that monitors crypto markets through price, liquidity and order flow.
X: @dmitrypath
Frequent Trader
4.1 Years
4 Following
47 Followers
95 Liked
Posts
All
Quotes
$BTC $ETH Why did crypto rally today — and what comes next?
Today the market got a strong push higher from news out of the U.S. Treasury market. The Treasury announced that it will double the size of its buybacks of long-dated 10–30Y bonds, from $2B to at least $4B per operation. One important point: this is not QE. For some reason, whenever the Treasury does something, bloggers immediately start calling it QE.
That’s not accurate. With QE, the Fed creates new money and buys assets. Here, the Treasury is simply managing the structure of government debt and liquidity in the bond market.
So why did we get a bullish reaction?
After the announcement, the 30Y Treasury yield dropped from around 5.3% to 5.2%. When long-term yields fall, pressure on stocks and other risk assets decreases. Crypto benefited from that as well.
Lower yields also tend to put pressure on the dollar and support assets like gold. Today we saw exactly that kind of reaction.
But it’s still too early to celebrate 🐻
If the 30Y yield quickly moves back above ~5.3%, the market could take that very negatively.
What about crypto itself?
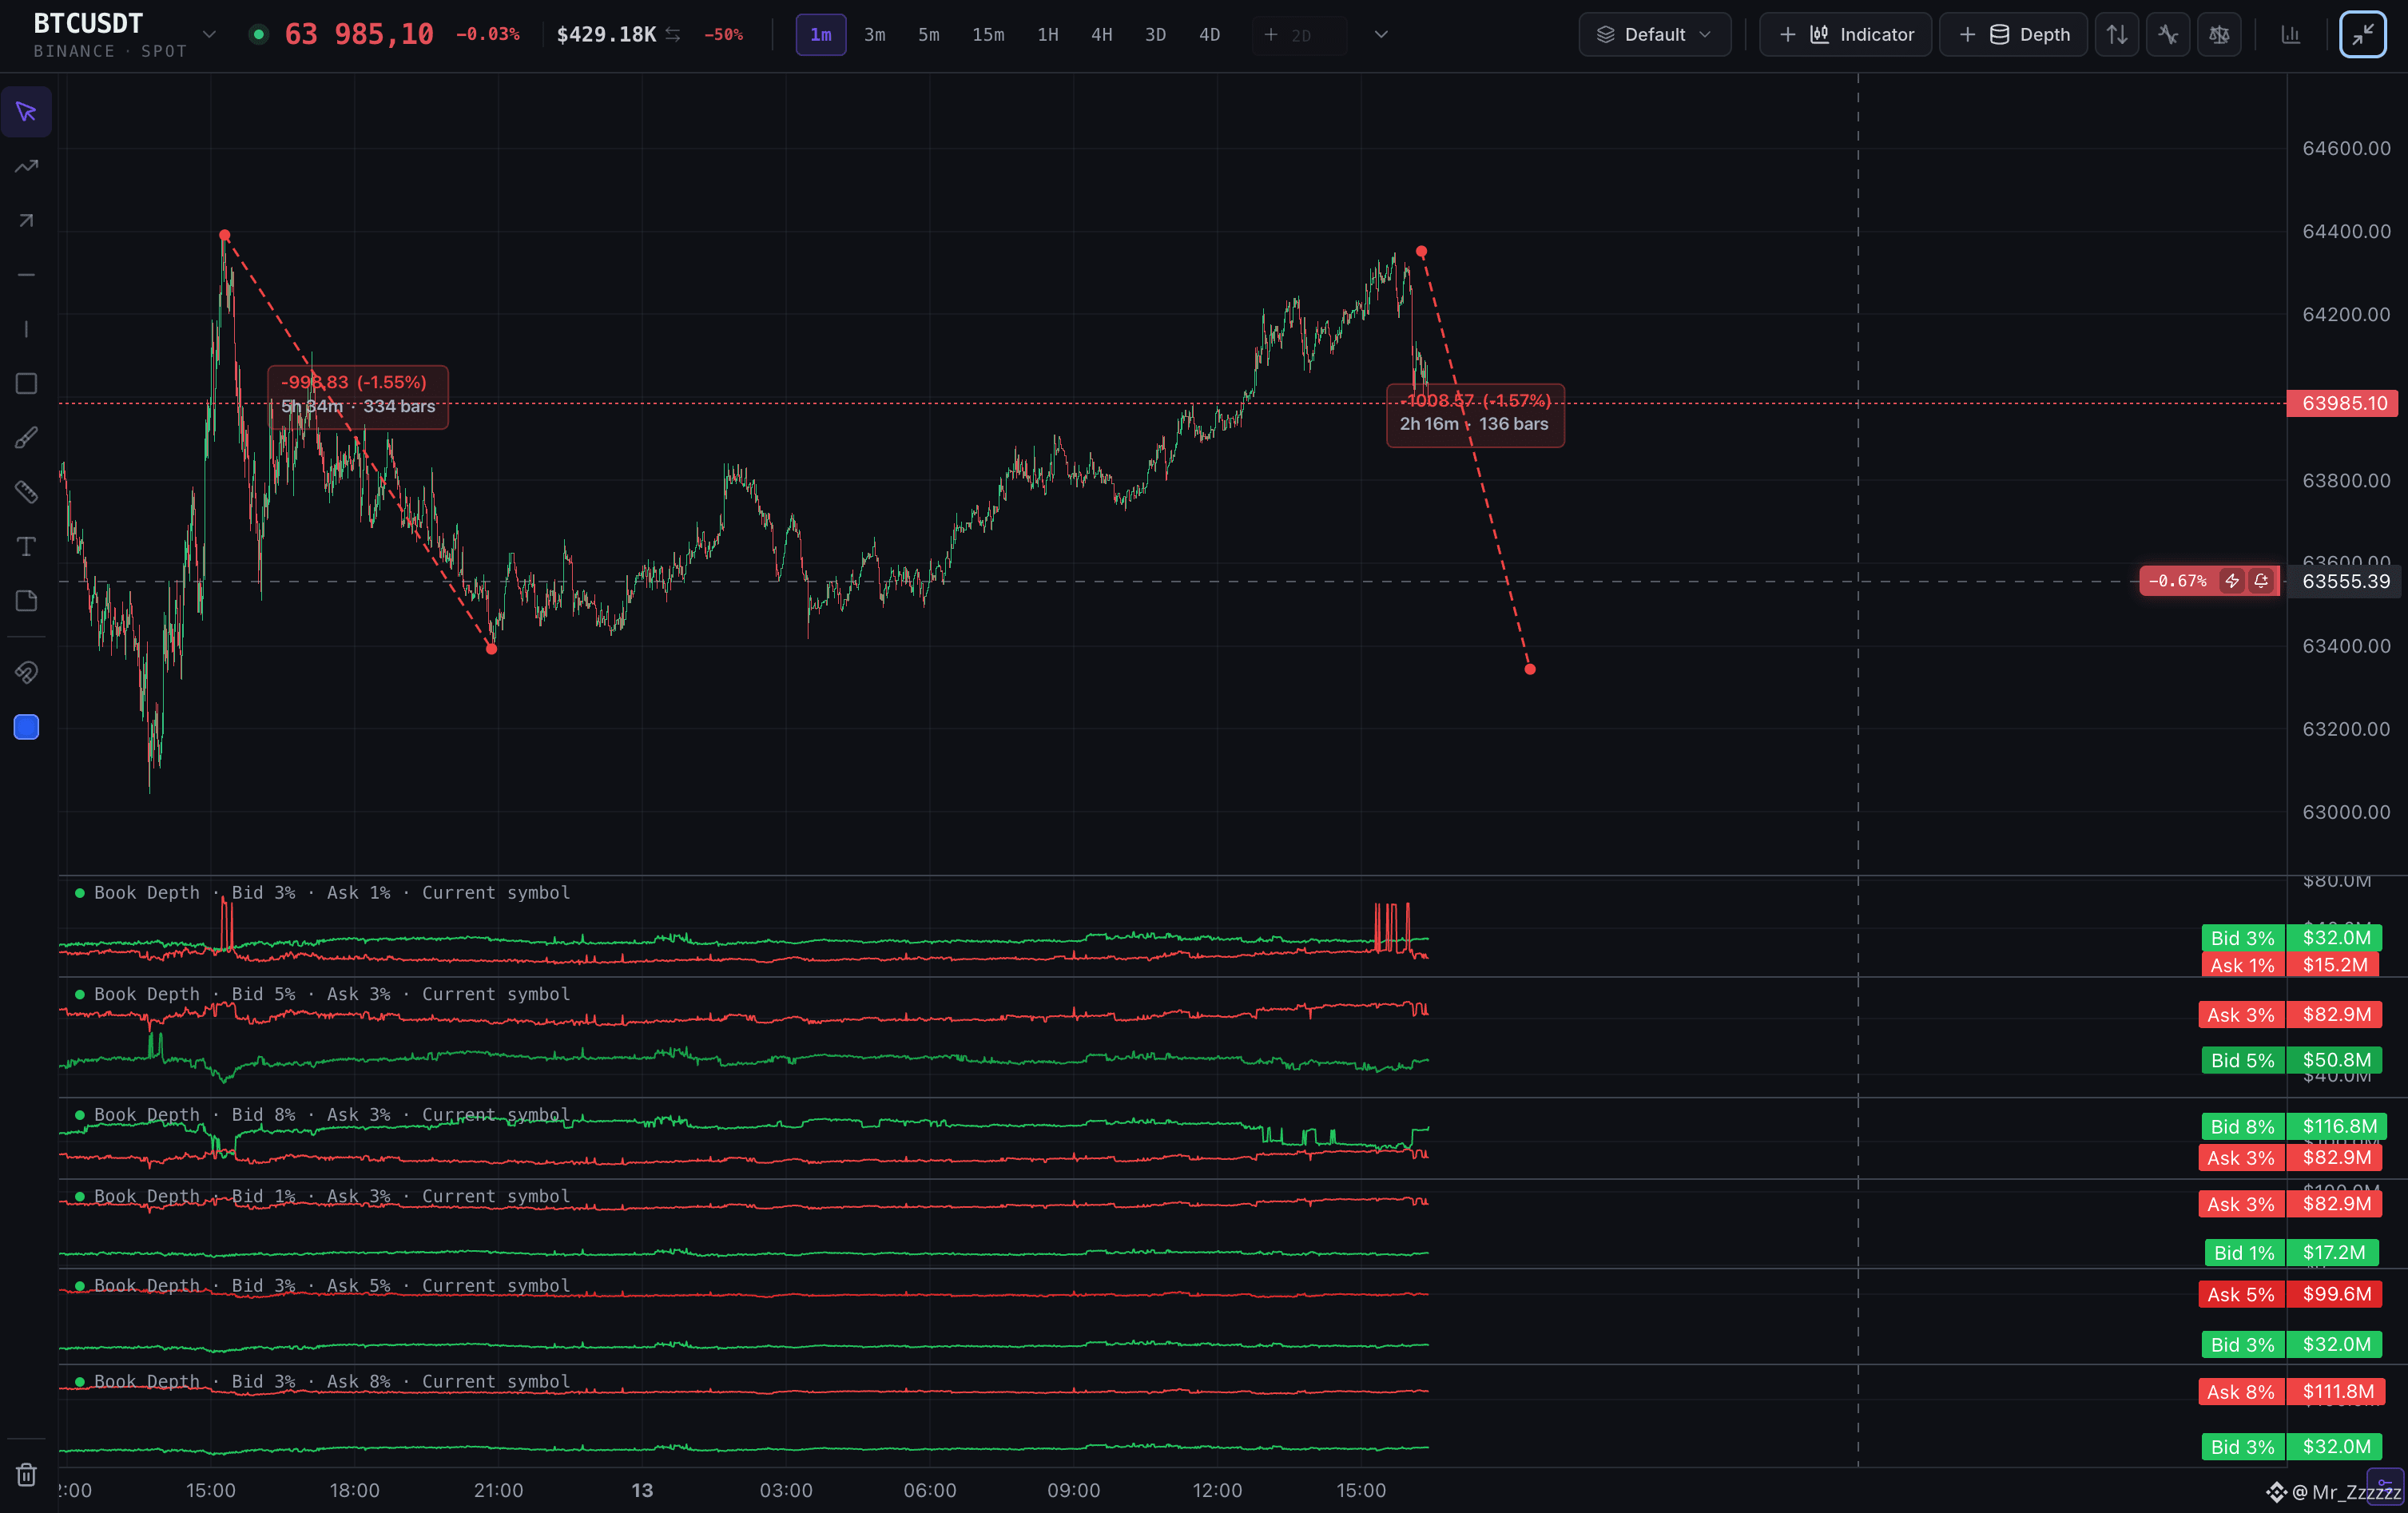
BTC has now reached roughly the 200 SMA, but the order book still doesn’t look particularly strong. While BTC gained around 5%, bid liquidity within my 8% depth range dropped from roughly $130M to $65M. I’m seeing a similar picture across the broader market.
So price moved higher, but there still isn’t a strong new layer of support underneath it.
My base case is a few days of consolidation. I want to see how liquidity gets rebuilt and whether buyers can actually hold these new levels. For now, I wouldn’t chase the green candle.
The three things I’m watching next: 30Y Treasury yields, BTC 200 SMA, and order book liquidity.
Today the market got a strong push higher from news out of the U.S. Treasury market. The Treasury announced that it will double the size of its buybacks of long-dated 10–30Y bonds, from $2B to at least $4B per operation. One important point: this is not QE. For some reason, whenever the Treasury does something, bloggers immediately start calling it QE.
That’s not accurate. With QE, the Fed creates new money and buys assets. Here, the Treasury is simply managing the structure of government debt and liquidity in the bond market.
So why did we get a bullish reaction?
After the announcement, the 30Y Treasury yield dropped from around 5.3% to 5.2%. When long-term yields fall, pressure on stocks and other risk assets decreases. Crypto benefited from that as well.
Lower yields also tend to put pressure on the dollar and support assets like gold. Today we saw exactly that kind of reaction.
But it’s still too early to celebrate 🐻
If the 30Y yield quickly moves back above ~5.3%, the market could take that very negatively.
What about crypto itself?
BTC has now reached roughly the 200 SMA, but the order book still doesn’t look particularly strong. While BTC gained around 5%, bid liquidity within my 8% depth range dropped from roughly $130M to $65M. I’m seeing a similar picture across the broader market.
So price moved higher, but there still isn’t a strong new layer of support underneath it.
My base case is a few days of consolidation. I want to see how liquidity gets rebuilt and whether buyers can actually hold these new levels. For now, I wouldn’t chase the green candle.
The three things I’m watching next: 30Y Treasury yields, BTC 200 SMA, and order book liquidity.
The phrase that turns a trader into a long-term investor without their consent: “It’s not a loss until you sell.”
Ancient bear wisdom that probably destroyed more portfolios than bad entries ever did.
The problem is not that people don’t want to take a loss. The problem is that they start confusing a position with a belief.
If the structure is broken, liquidity is gone, buyers are not defending the level, and price keeps sliding lower — that is already a loss. It just hasn’t been confirmed by the Sell button yet.
The market does not owe you a return to your entry just because closing the trade hurts psychologically.
Sometimes “I’ll just wait” is a strategy. Sometimes it is just refusal to admit you were wrong.
The difference is simple:
— If you have a plan, invalidation levels, and a clear reason why the position is still valid — that is holding.
— If all you have is hope and the phrase “it’s not a loss until you sell” that is no longer trading.
That is survival mode.
NFA.
$BTC
Ancient bear wisdom that probably destroyed more portfolios than bad entries ever did.
The problem is not that people don’t want to take a loss. The problem is that they start confusing a position with a belief.
If the structure is broken, liquidity is gone, buyers are not defending the level, and price keeps sliding lower — that is already a loss. It just hasn’t been confirmed by the Sell button yet.
The market does not owe you a return to your entry just because closing the trade hurts psychologically.
Sometimes “I’ll just wait” is a strategy. Sometimes it is just refusal to admit you were wrong.
The difference is simple:
— If you have a plan, invalidation levels, and a clear reason why the position is still valid — that is holding.
— If all you have is hope and the phrase “it’s not a loss until you sell” that is no longer trading.
That is survival mode.
NFA.
$BTC

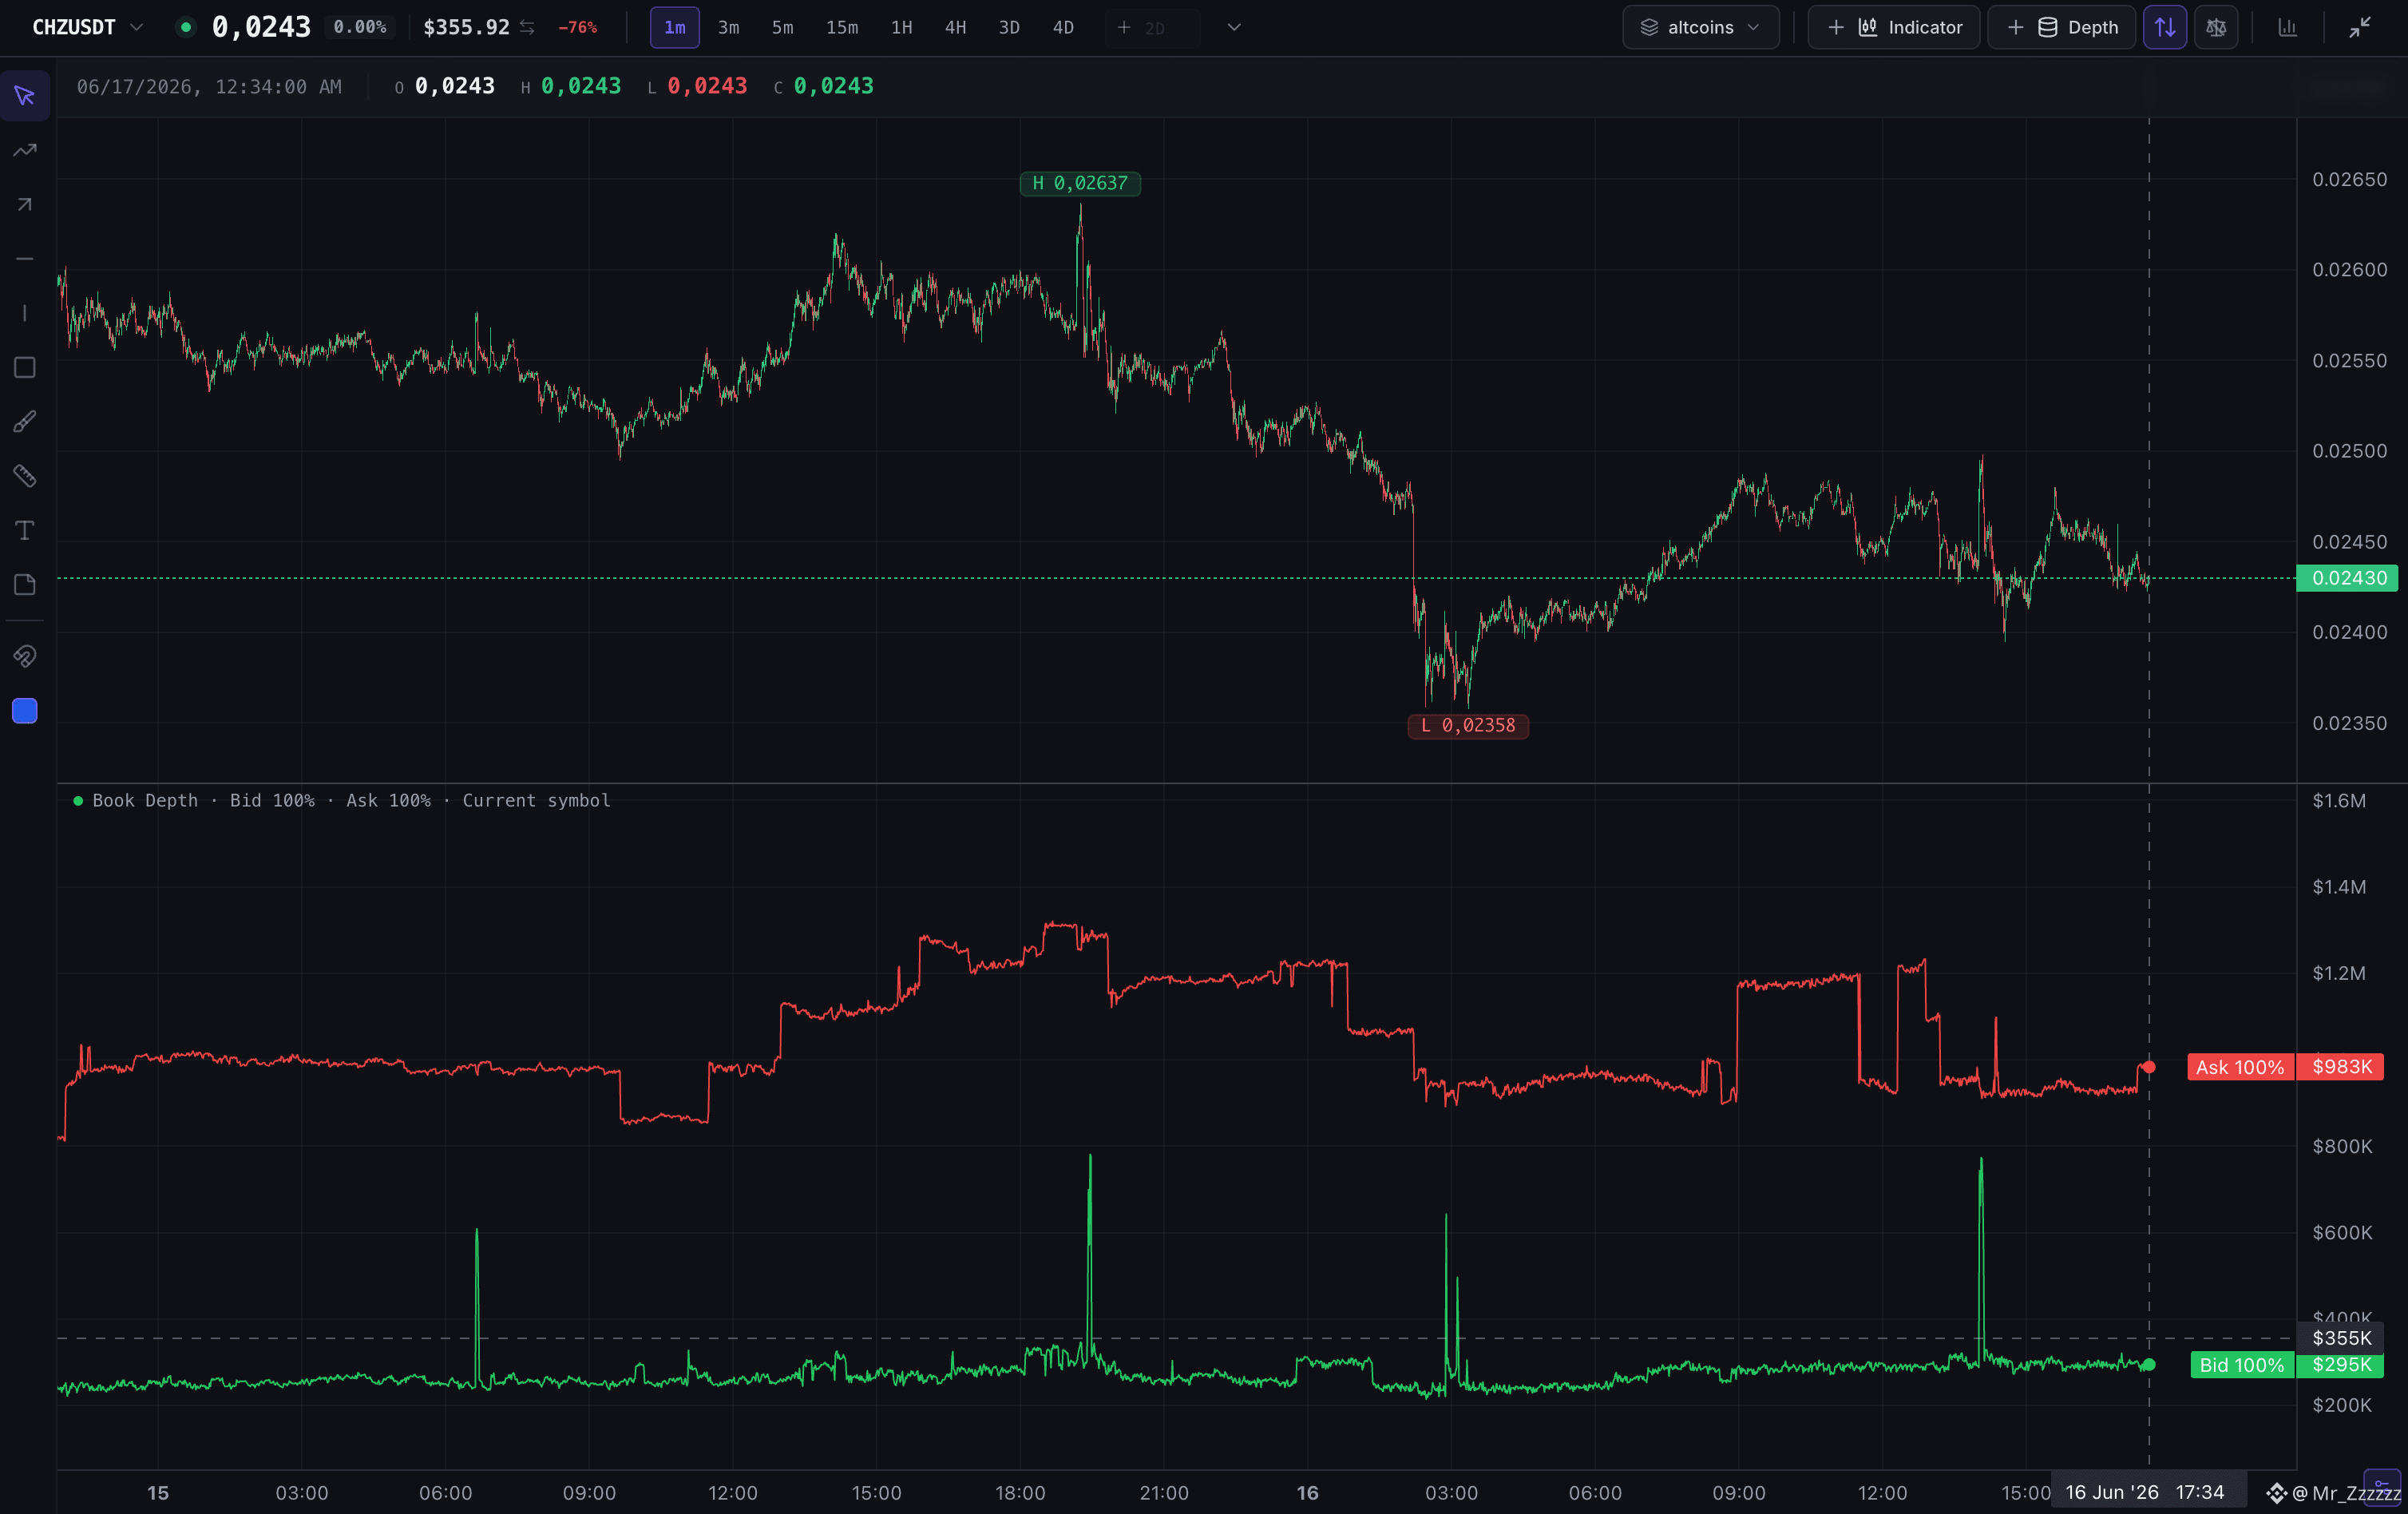
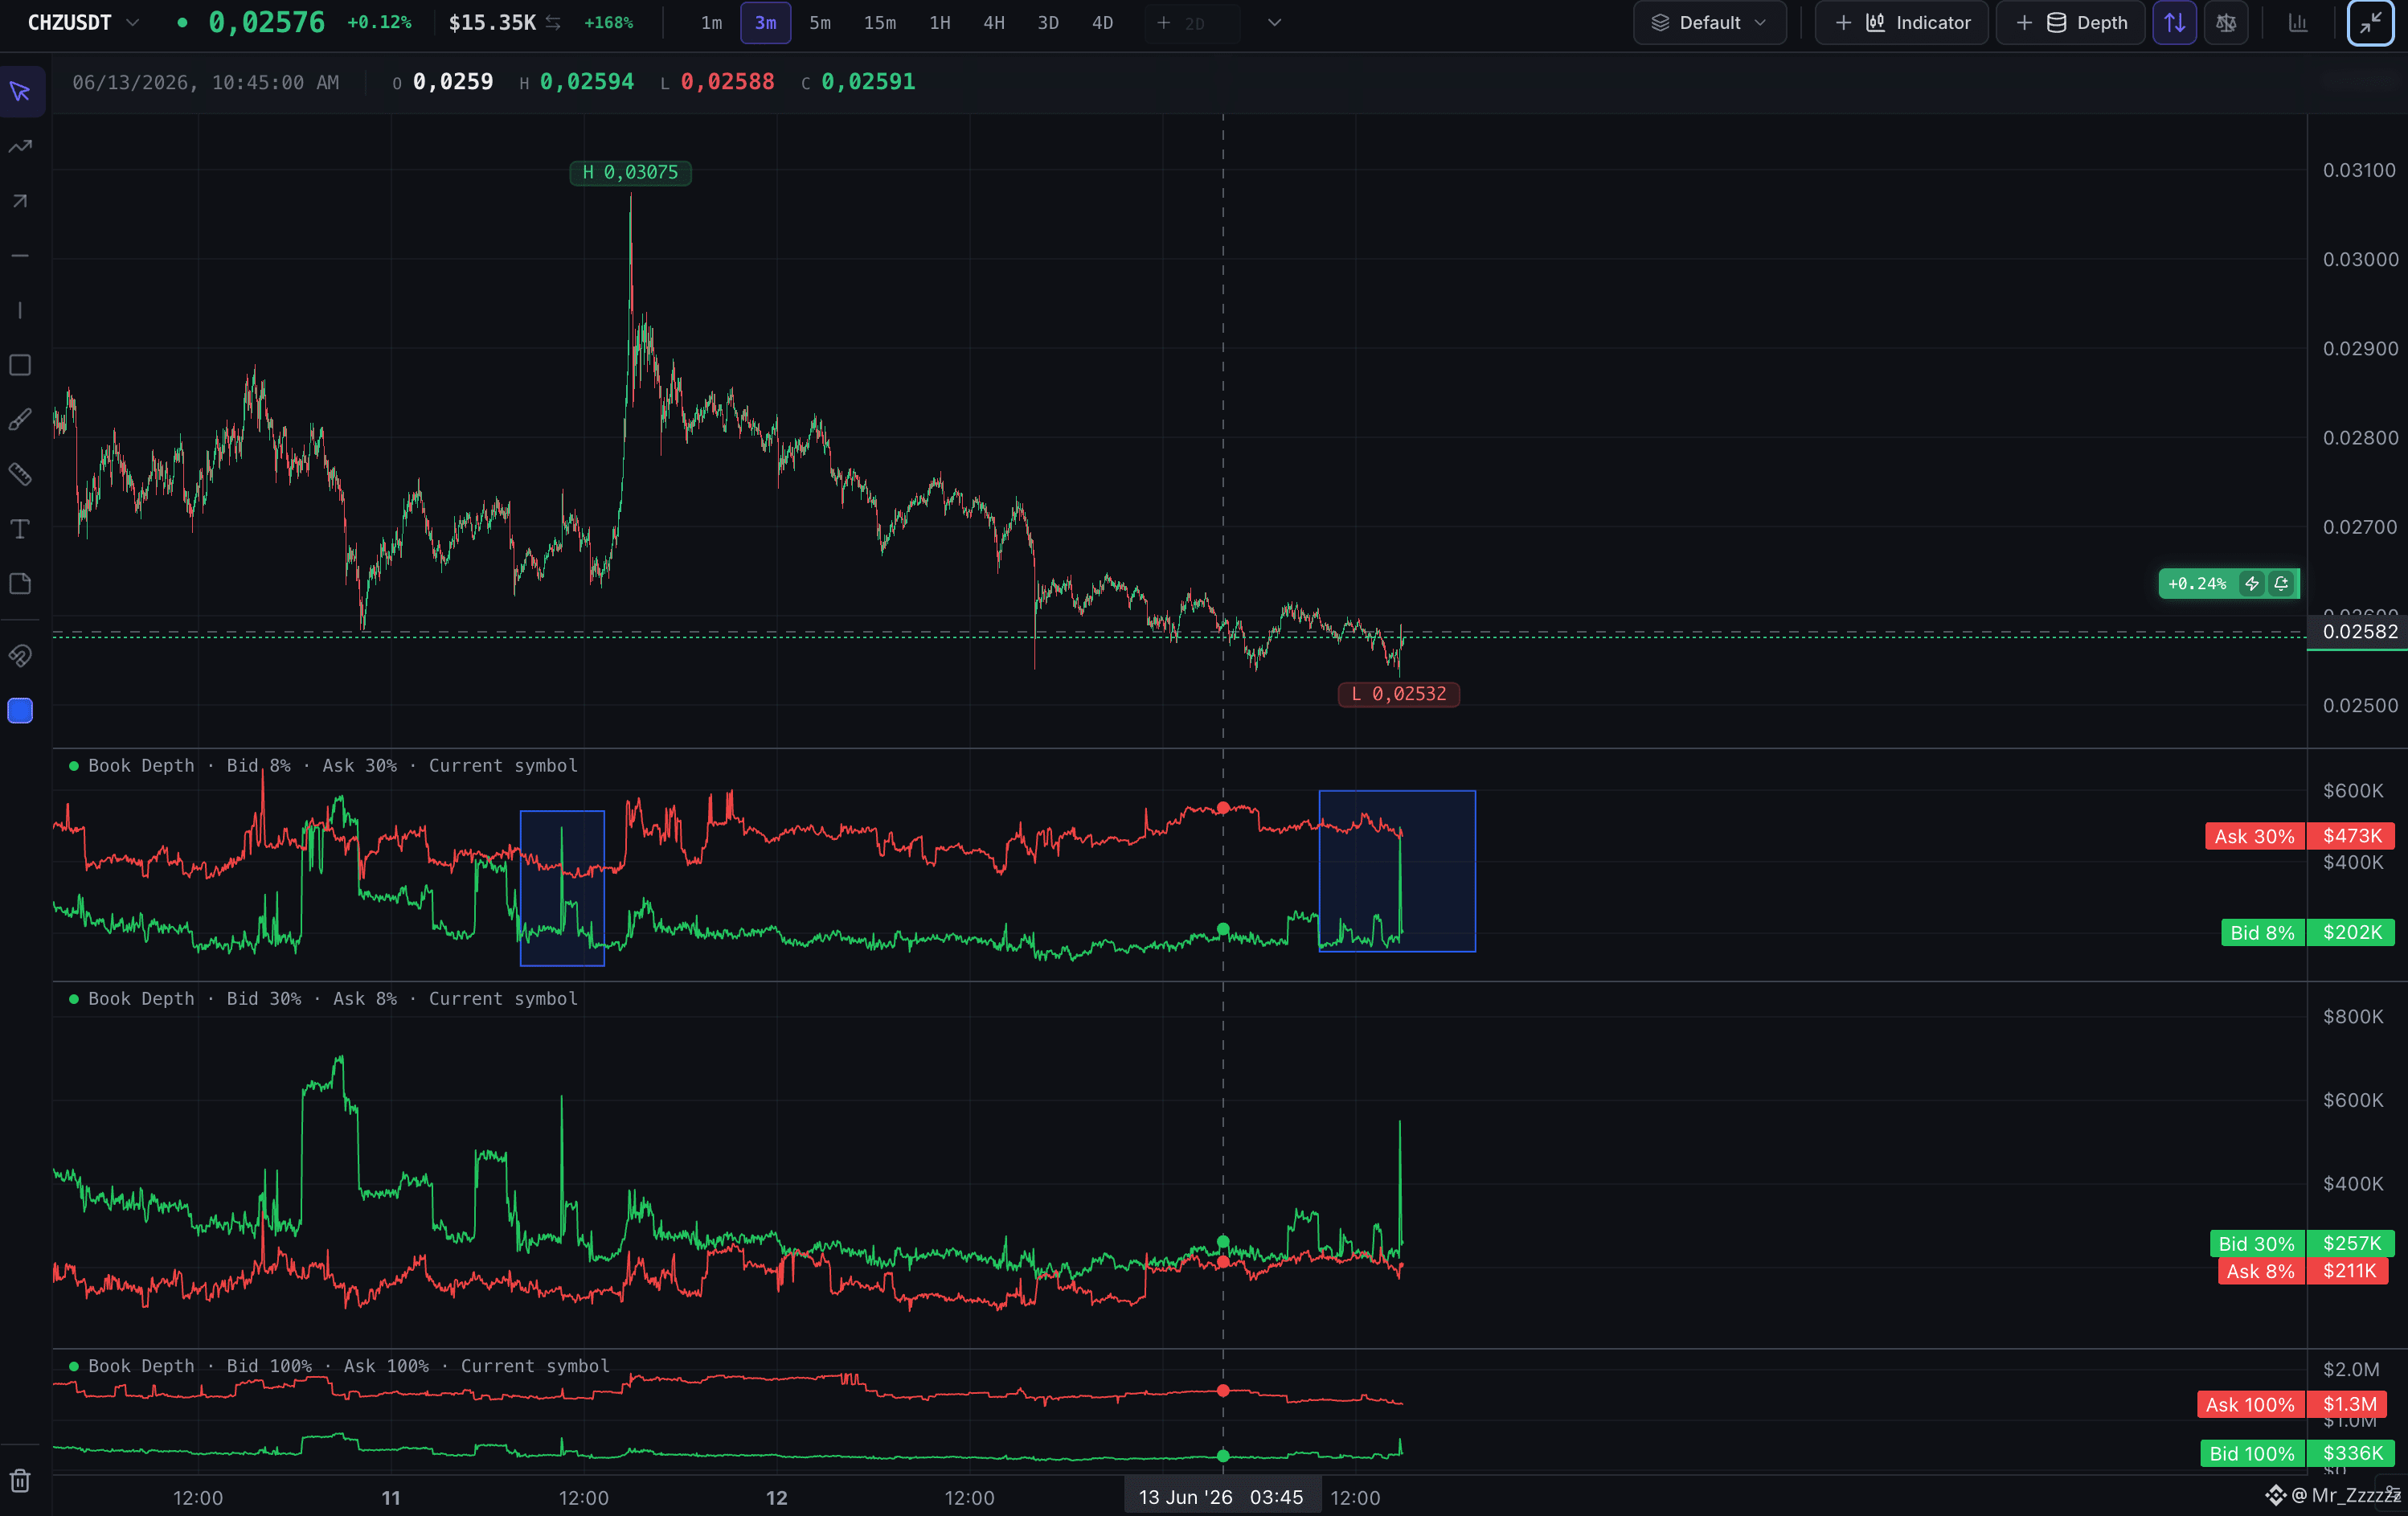
$CHZ can we expect growth here? The liquidity cardiogram gives us a pretty clear picture.
On the 1m timeframe and 1% depth, pay attention to how the market maker may be spoofing and confusing traders. It becomes even more visible when you look at the 100% depth.
The supply side in the order book at 100% depth is not really decreasing.
At the same time, demand at 1%, 3% and 5% depth is not growing in a stable way.
So all these spikes in liquidity look more like fake robot activity for now.
The market maker has to hold the asset from falling too fast. He can absorb orders into himself, but sooner or later he also needs to unload this inventory.
So at the moment I don’t see a real reason to expect a change in tactics for this instrument.
On the 1m timeframe and 1% depth, pay attention to how the market maker may be spoofing and confusing traders. It becomes even more visible when you look at the 100% depth.
The supply side in the order book at 100% depth is not really decreasing.
At the same time, demand at 1%, 3% and 5% depth is not growing in a stable way.
So all these spikes in liquidity look more like fake robot activity for now.
The market maker has to hold the asset from falling too fast. He can absorb orders into himself, but sooner or later he also needs to unload this inventory.
So at the moment I don’t see a real reason to expect a change in tactics for this instrument.
Dmitry from Traders
·
--
Bearish$CHZ update: spot sellers are still in control.
There is visible selling pressure on spot, and I don’t see a clean reversal confirmation yet.
The key issue is simple:
— buyers are reacting, but they are not taking control. They are mostly absorbing market sells and waiting — not aggressively lifting the price.
Until bid support strengthens and price starts accepting above the current range, this still looks like weakness.
Maybe it becomes long-term accumulation later. But right now, for me reversal is not confirmed.
Be careful with early longs here.
$CHZ
There is visible selling pressure on spot, and I don’t see a clean reversal confirmation yet.
The key issue is simple:
— buyers are reacting, but they are not taking control. They are mostly absorbing market sells and waiting — not aggressively lifting the price.
Until bid support strengthens and price starts accepting above the current range, this still looks like weakness.
Maybe it becomes long-term accumulation later. But right now, for me reversal is not confirmed.
Be careful with early longs here.
$CHZ
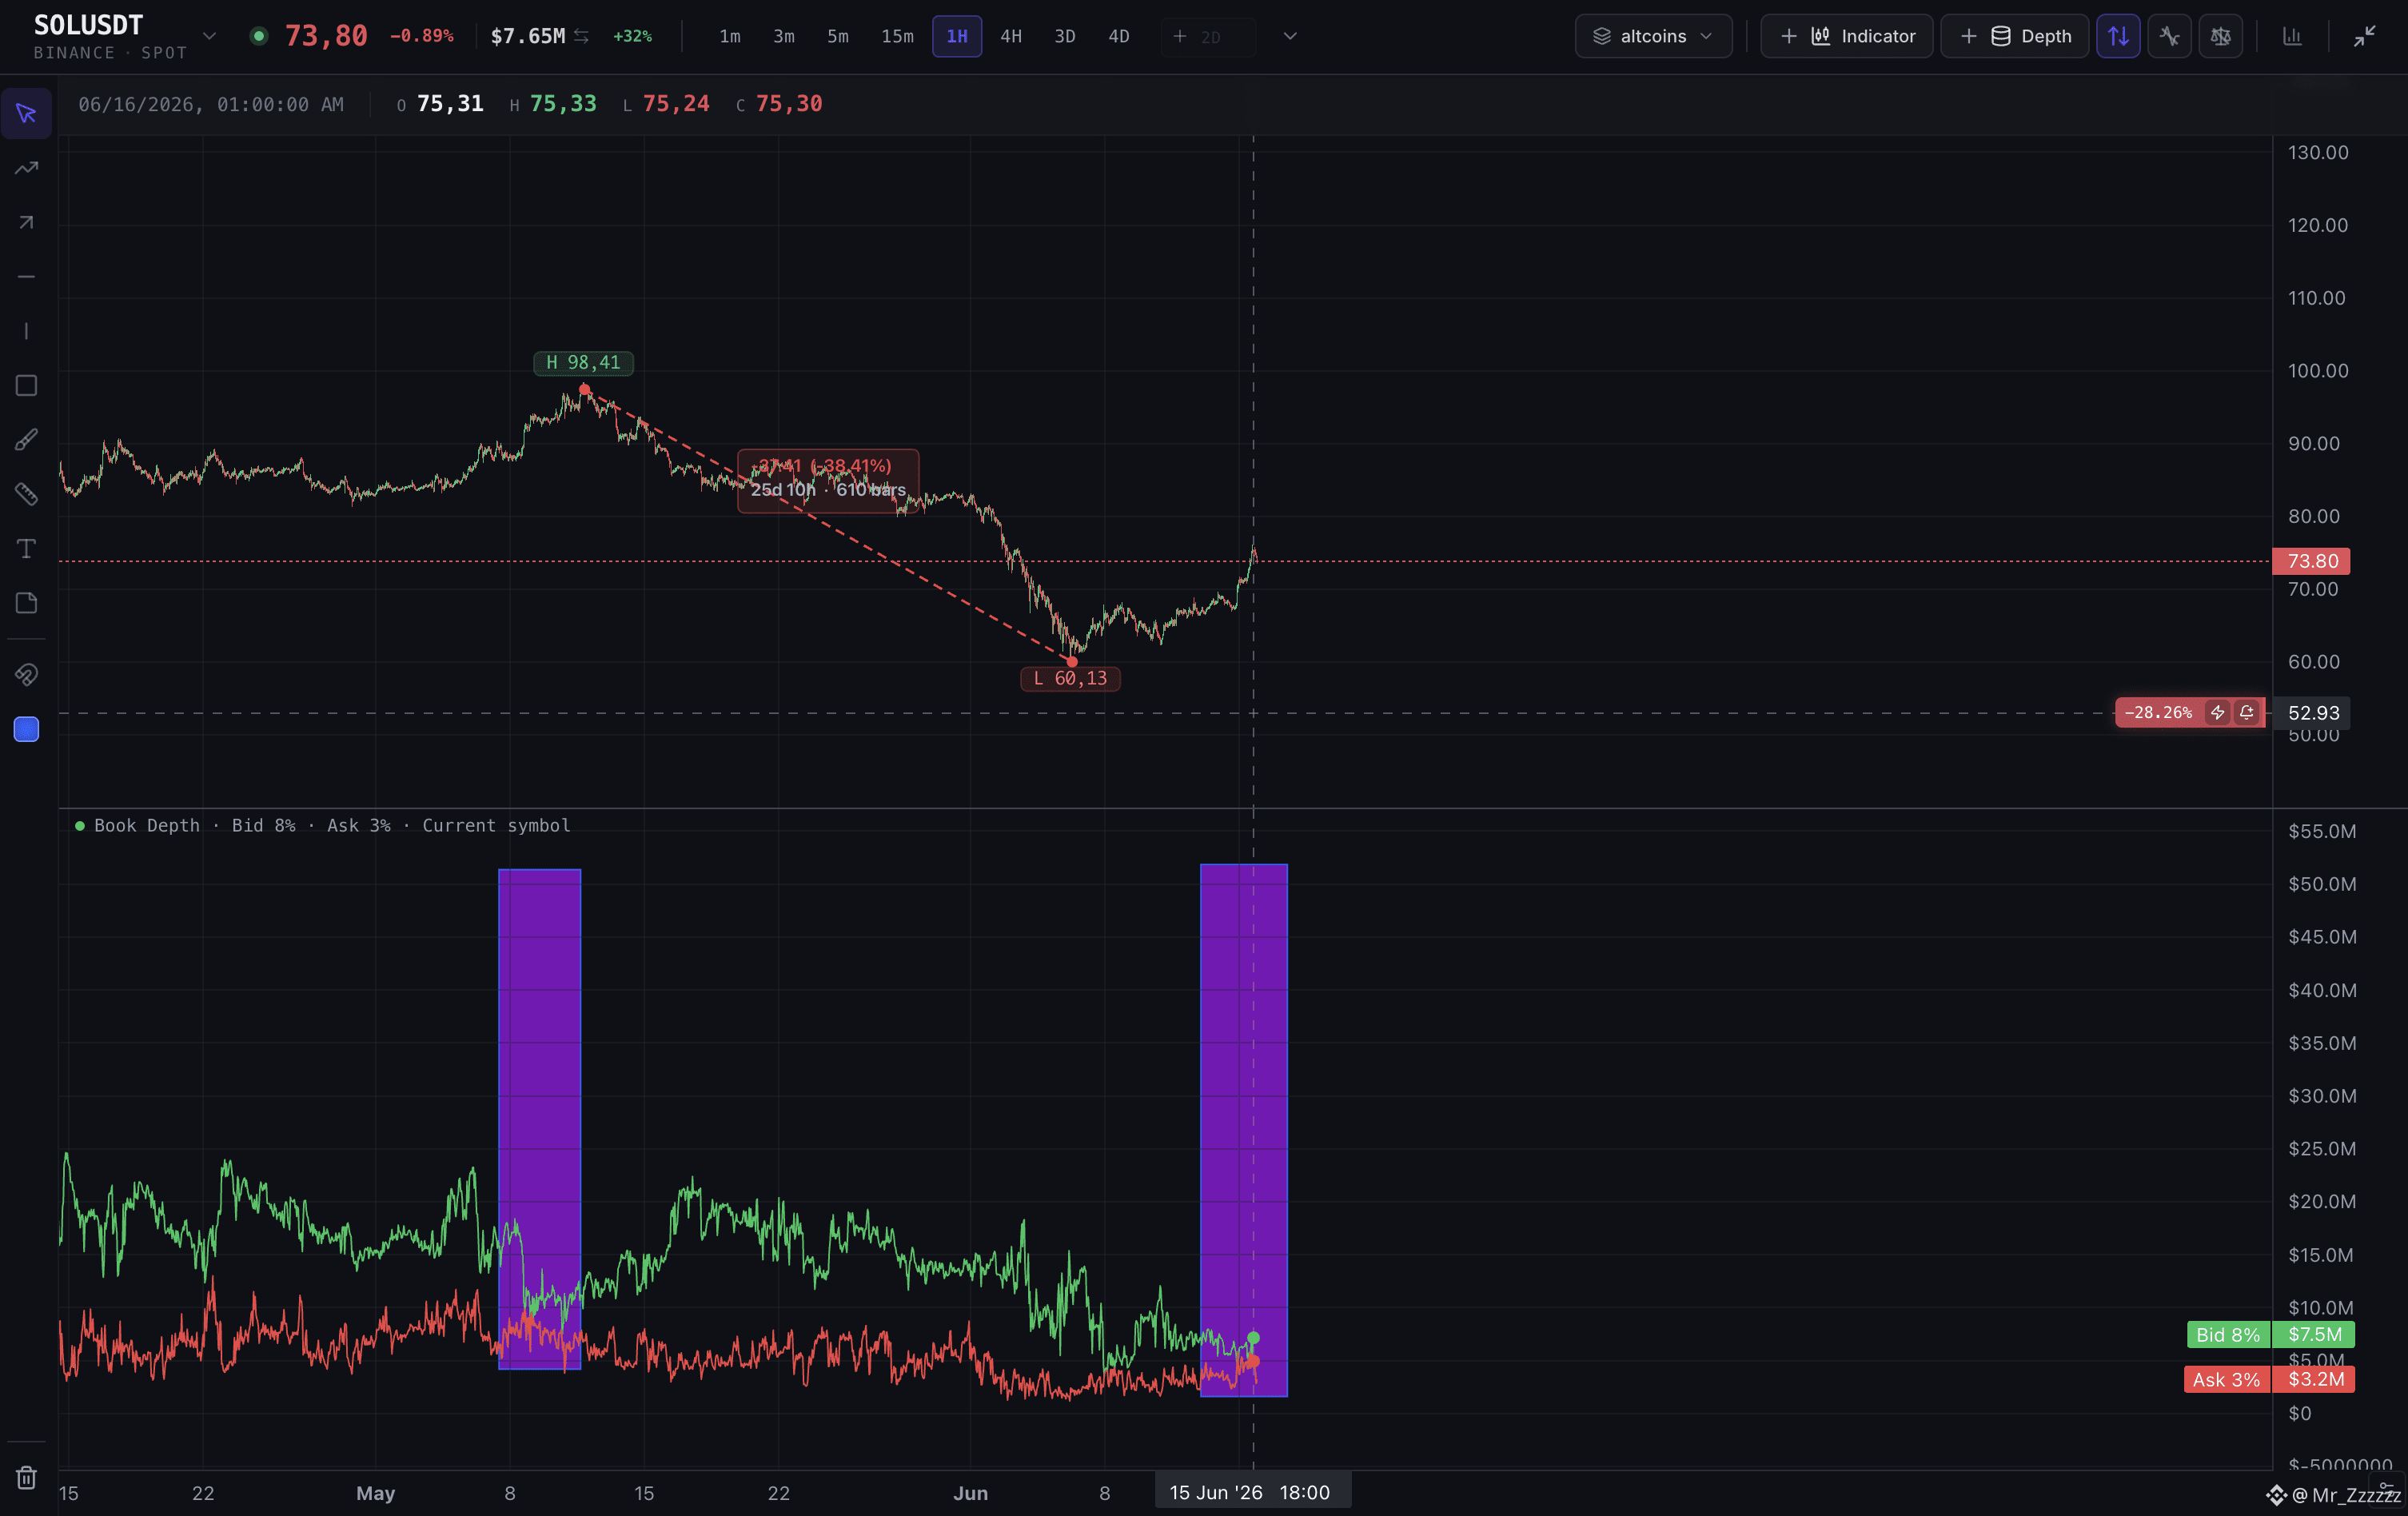
$SOL : I’m watching the $50 area. Seriously. Just look at the order book.
The candle chart can still be read as a recovery attempt: Elliott waves, bounce structure, continuation setup.But liquidity tells a more cautious story.
Cumulative ask liquidity within ~3% of price has grown to a level comparable with bid liquidity around ~8%.
In simple terms: sellers are placing serious size much closer to price than buyers.
This does not automatically mean “short SOL”. But my bias stays cautious unless this ask liquidity gets absorbed.
The key question now:
Can SOL actually absorb this supply — or will it cap the bounce and push the market lower? And if even part of this ask liquidity turns into aggressive market selling, the pressure can accelerate fast.
The candle chart can still be read as a recovery attempt: Elliott waves, bounce structure, continuation setup.But liquidity tells a more cautious story.
Cumulative ask liquidity within ~3% of price has grown to a level comparable with bid liquidity around ~8%.
In simple terms: sellers are placing serious size much closer to price than buyers.
This does not automatically mean “short SOL”. But my bias stays cautious unless this ask liquidity gets absorbed.
The key question now:
Can SOL actually absorb this supply — or will it cap the bounce and push the market lower? And if even part of this ask liquidity turns into aggressive market selling, the pressure can accelerate fast.
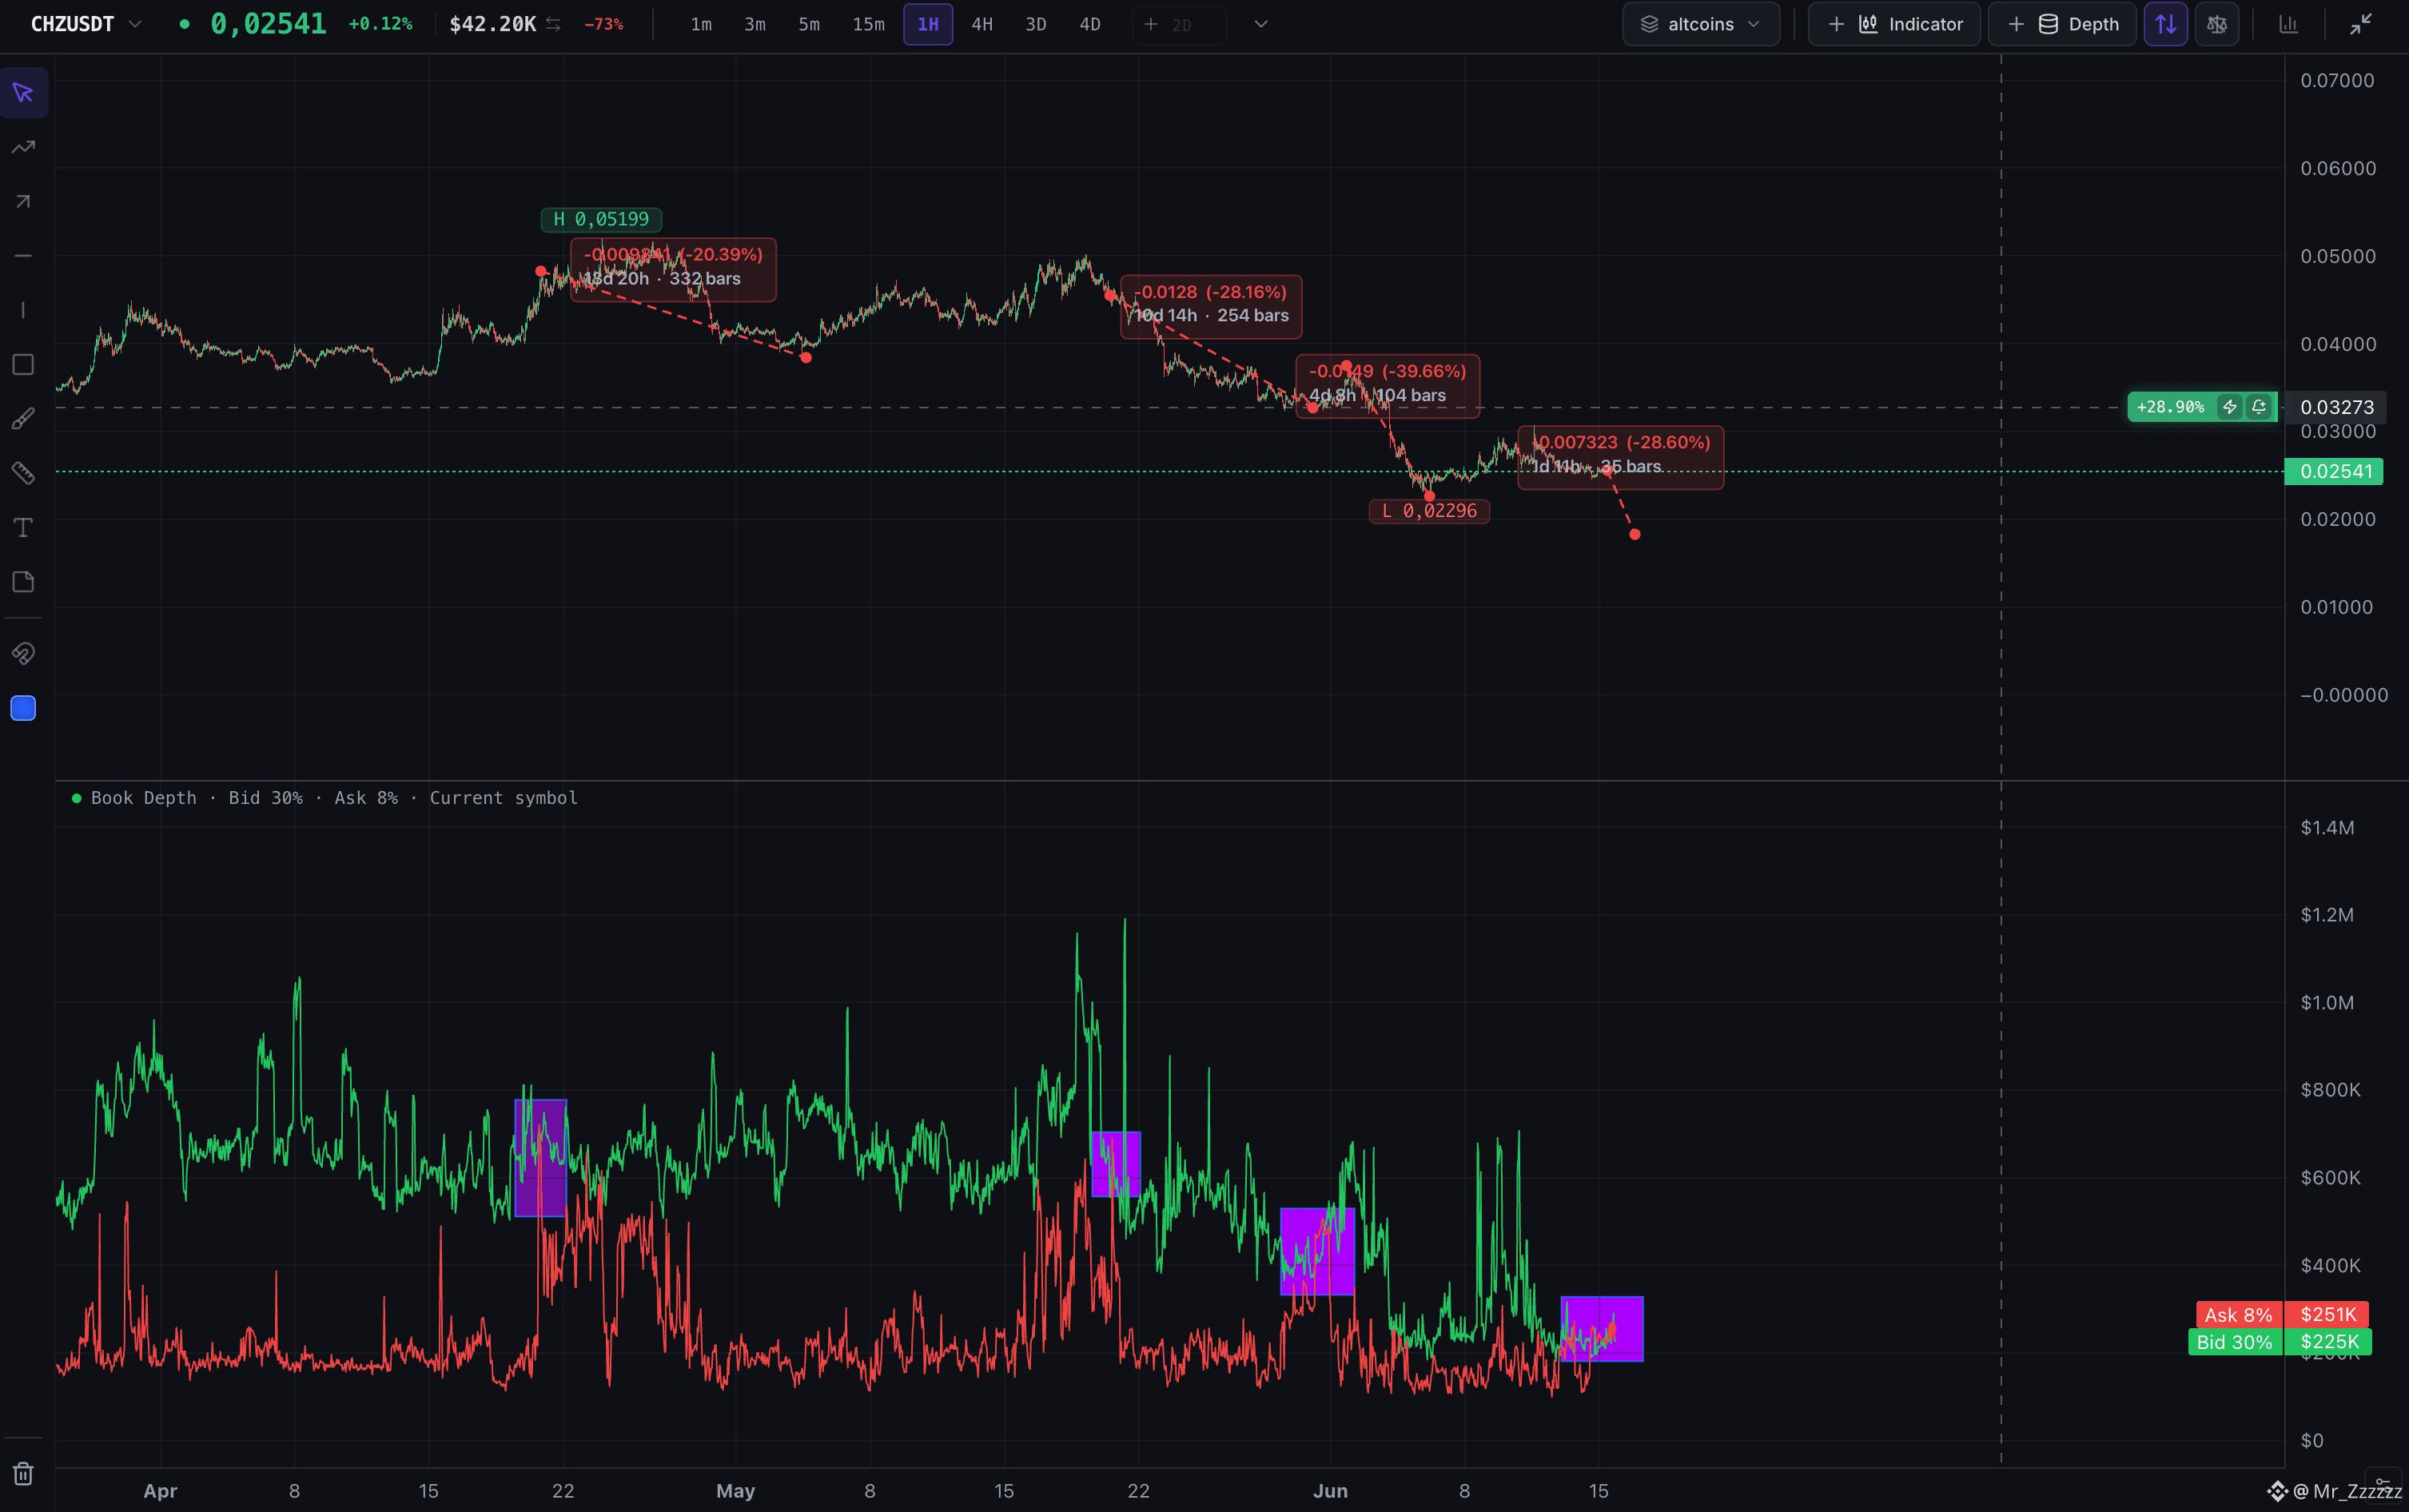
$CHZ update: spot sellers are still in control.
There is visible selling pressure on spot, and I don’t see a clean reversal confirmation yet.
The key issue is simple:
— buyers are reacting, but they are not taking control. They are mostly absorbing market sells and waiting — not aggressively lifting the price.
Until bid support strengthens and price starts accepting above the current range, this still looks like weakness.
Maybe it becomes long-term accumulation later. But right now, for me reversal is not confirmed.
Be careful with early longs here.
$CHZ
There is visible selling pressure on spot, and I don’t see a clean reversal confirmation yet.
The key issue is simple:
— buyers are reacting, but they are not taking control. They are mostly absorbing market sells and waiting — not aggressively lifting the price.
Until bid support strengthens and price starts accepting above the current range, this still looks like weakness.
Maybe it becomes long-term accumulation later. But right now, for me reversal is not confirmed.
Be careful with early longs here.
$CHZ
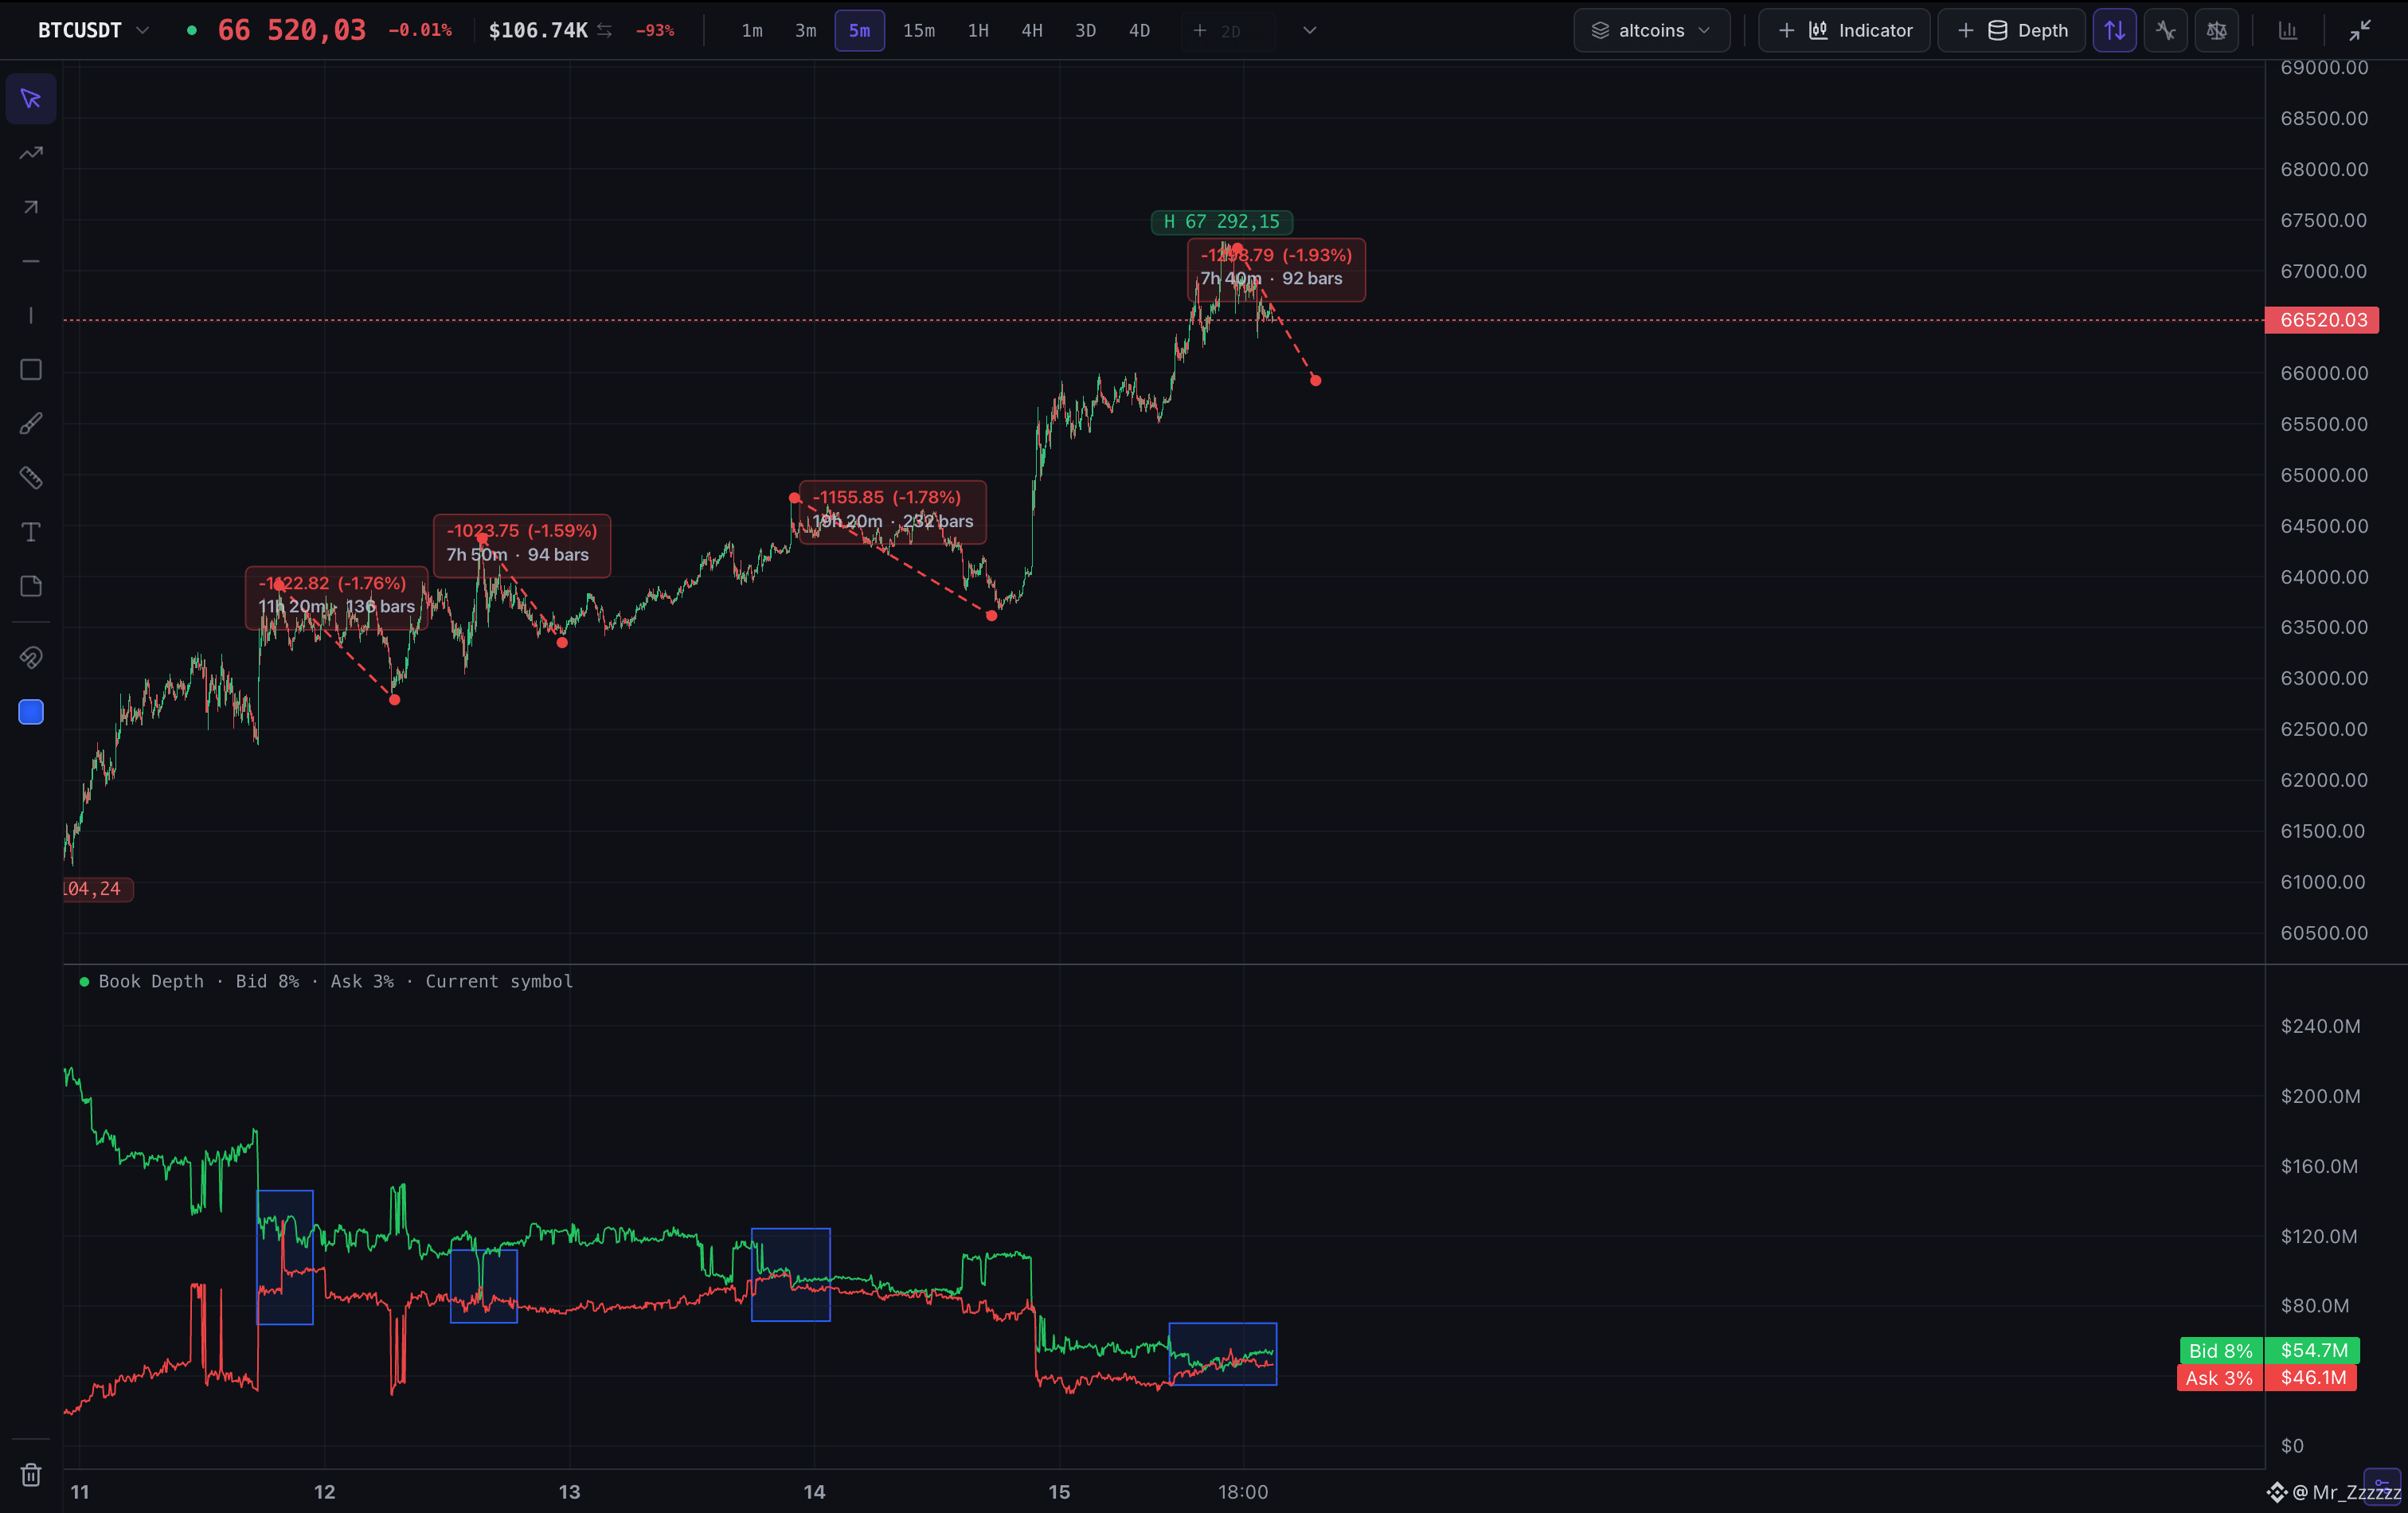
BTC follow-up: BTC did exactly what the order book suggested.
The previous read was not about candles. It was about absorption.
Buyers lifted through visible supply, and the market pushed higher. Now the setup is different.
After the move, I’m no longer chasing upside. I’m watching whether bid support fades and sellers start controlling the next leg.
If this range fails, BTC can rotate lower and continue the larger structure.
The trap now is being late to the long.
$BTC $ETH $SOL
#Bitcoin #CryptoMarket #MarketUpdate #Liquidity #OrderFlow
The previous read was not about candles. It was about absorption.
Buyers lifted through visible supply, and the market pushed higher. Now the setup is different.
After the move, I’m no longer chasing upside. I’m watching whether bid support fades and sellers start controlling the next leg.
If this range fails, BTC can rotate lower and continue the larger structure.
The trap now is being late to the long.
$BTC $ETH $SOL
#Bitcoin #CryptoMarket #MarketUpdate #Liquidity #OrderFlow
Dmitry from Traders
·
--
BullishBTC follow-up: market confirms the read. The chart below reflects aggregated order book liquidity across selected majors: BTC, ETH, SOL, ADA, XRP, BNB and ZEC.
Across this basket, ask-side liquidity is heavier at shallow depth, but price is still moving higher.
Static book says supply is there.
Flow says buyers are eating it.
Until that changes, I don’t see a clean short setup. Continuation remains the higher-quality scenario.
NFA. Liquidity read only.
$BTC
$ETH
$SOL
#BTC #Bitcoin #CryptoMarketMoves #liquidity #Marketstructure
Across this basket, ask-side liquidity is heavier at shallow depth, but price is still moving higher.
Static book says supply is there.
Flow says buyers are eating it.
Until that changes, I don’t see a clean short setup. Continuation remains the higher-quality scenario.
NFA. Liquidity read only.
$BTC
$ETH
$SOL
#BTC #Bitcoin #CryptoMarketMoves #liquidity #Marketstructure
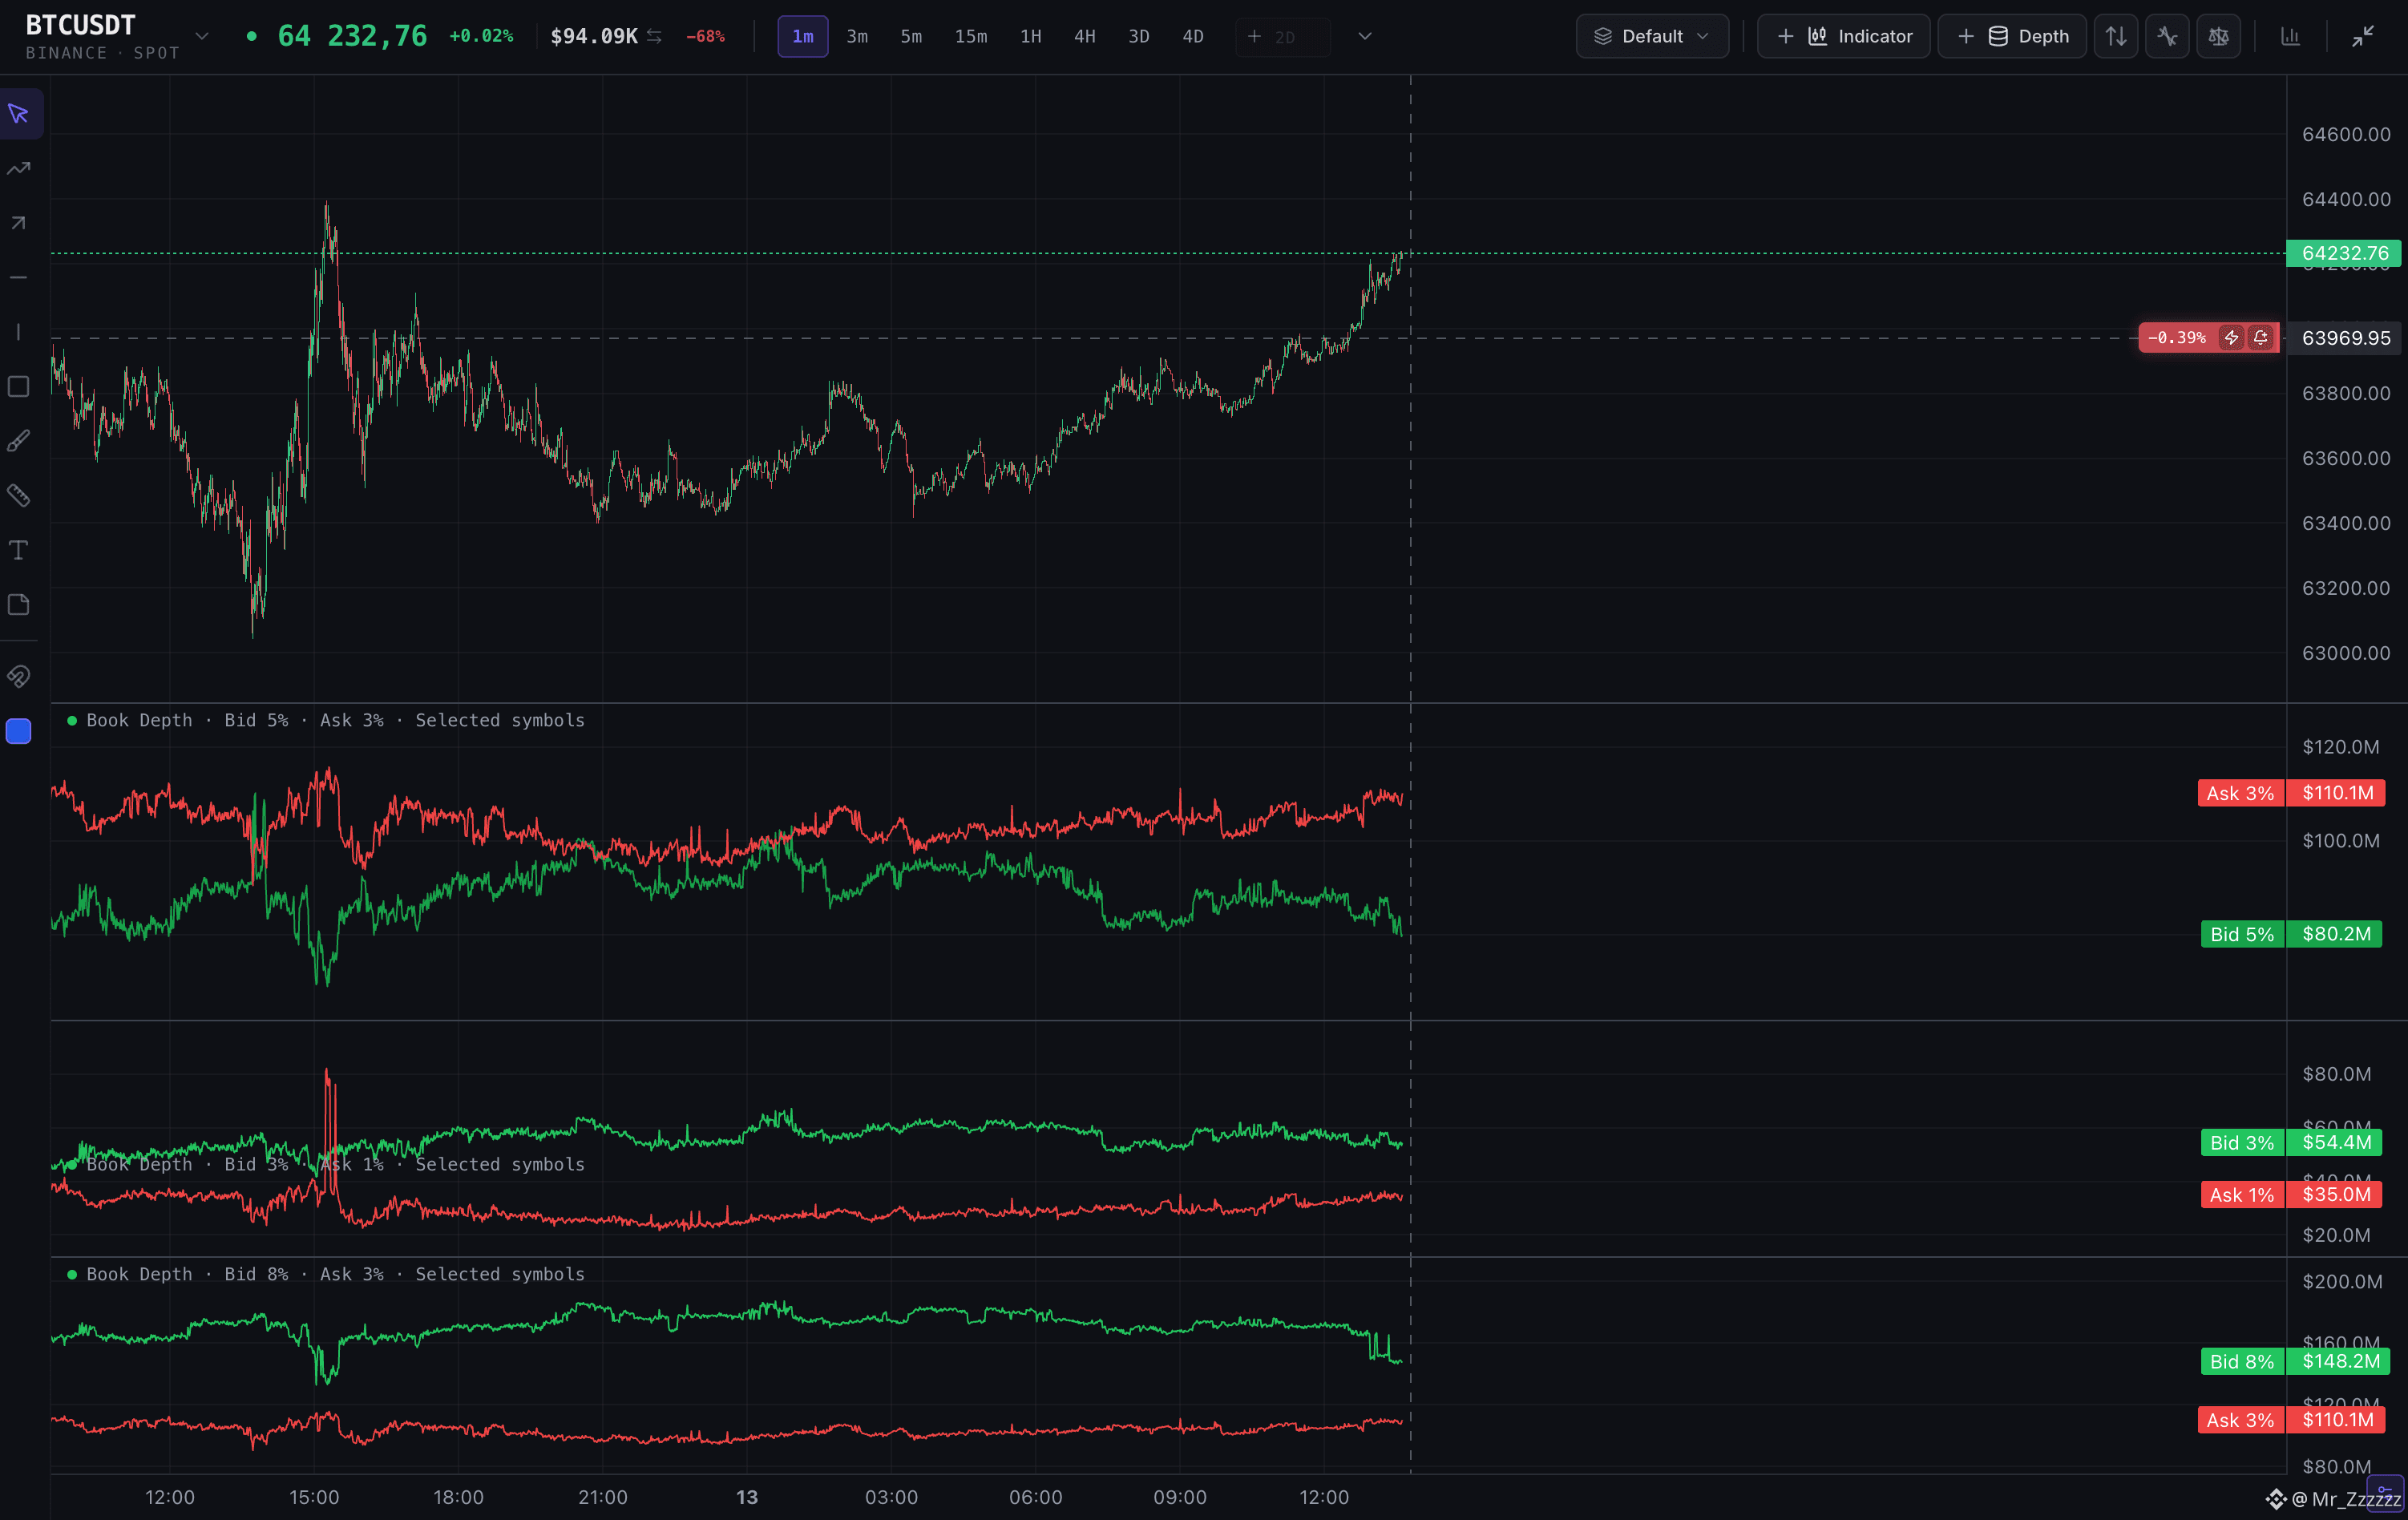
BTC follow-up: market confirms the read. The chart below reflects aggregated order book liquidity across selected majors: BTC, ETH, SOL, ADA, XRP, BNB and ZEC.
Across this basket, ask-side liquidity is heavier at shallow depth, but price is still moving higher.
Static book says supply is there.
Flow says buyers are eating it.
Until that changes, I don’t see a clean short setup. Continuation remains the higher-quality scenario.
NFA. Liquidity read only.
$BTC
$ETH
$SOL
#BTC #Bitcoin #CryptoMarketMoves #liquidity #Marketstructure
Across this basket, ask-side liquidity is heavier at shallow depth, but price is still moving higher.
Static book says supply is there.
Flow says buyers are eating it.
Until that changes, I don’t see a clean short setup. Continuation remains the higher-quality scenario.
NFA. Liquidity read only.
$BTC
$ETH
$SOL
#BTC #Bitcoin #CryptoMarketMoves #liquidity #Marketstructure
Log in to explore more content