

一pai胡言
75 Posts

一pai胡言
Report
Block User
0 Following
2 Followers
3 Liked
Posts
·
--
Came across a news story I thought you might want to see too:
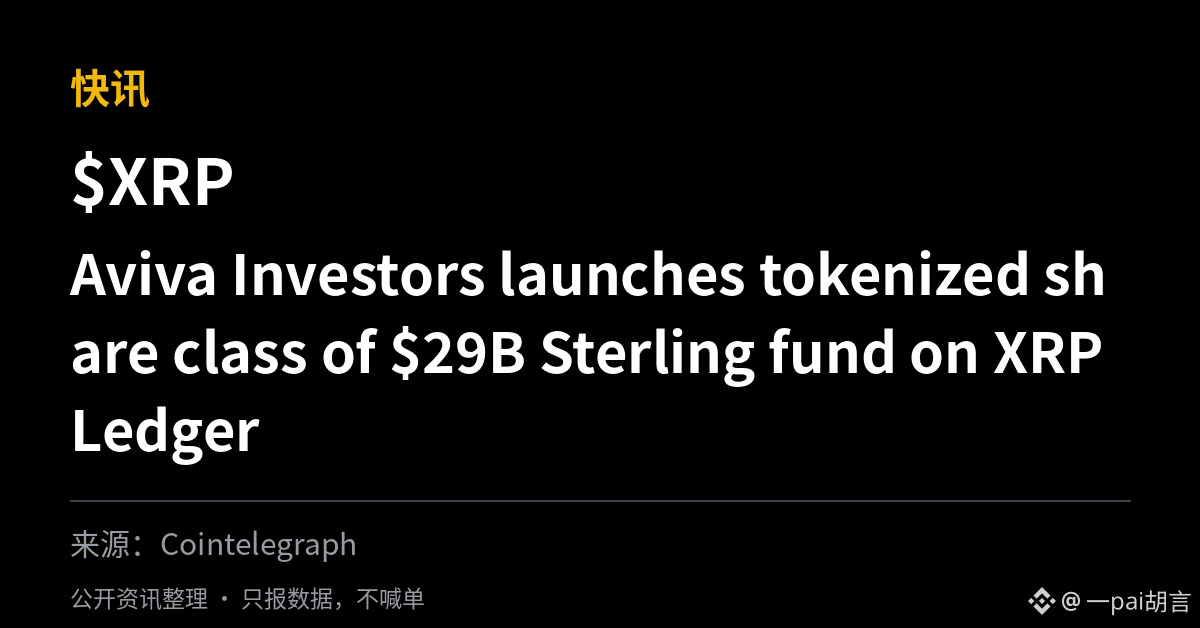
Aviva Investors launches tokenized share class of $29B Sterling fund on XRP Ledger
(Cointelegraph)
My take: It’s worth keeping an eye on, but don’t change your plans based on a single headline. When real money is at stake, waiting one more day won’t make you miss out.
With news like this, do you usually verify it first or save it for later?
$XRP
46
·
--
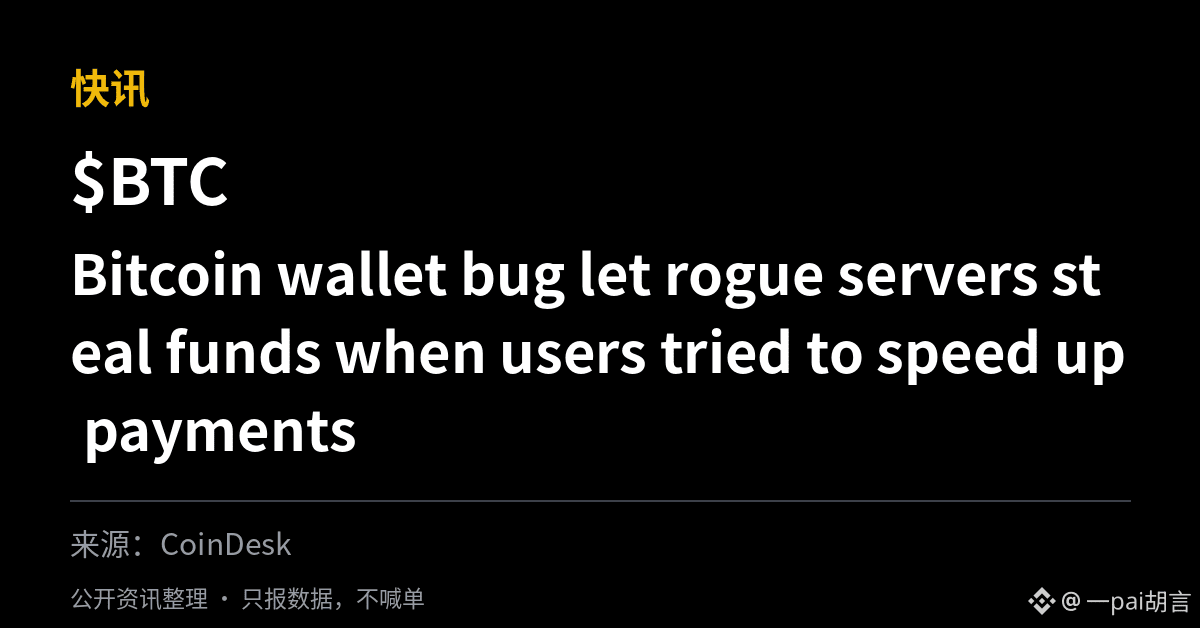
An industry update: A Bitcoin wallet bug let rogue servers steal funds when users tried to speed up payments
Source: CoinDesk. I like to keep news and data separate: news provides context, data helps prove or disprove it, and I use market action to validate it later.
Do you think this news will affect the market?
$BTC #News
Source: CoinDesk. I like to keep news and data separate: news provides context, data helps prove or disprove it, and I use market action to validate it later.
Do you think this news will affect the market?
$BTC #News
112
·
--
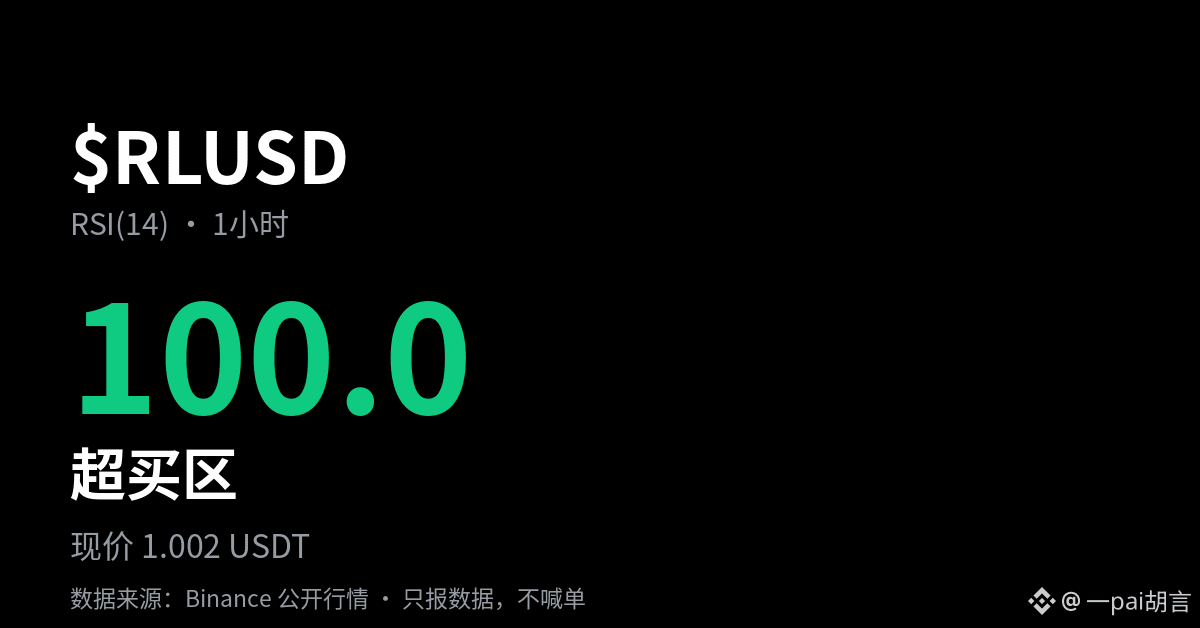
$RLUSD now RSI 100 (overbought), price 1.002.
My take: treat it like the yellow light at a traffic signal—not stop, not go, but a cue to look up and check the road conditions.
Do you think this divergence counts?
$RLUSD #Indicator
$RLUSD now RSI 100 (overbought), price 1.002.
My take: treat it like the yellow light at a traffic signal—not stop, not go, but a cue to look up and check the road conditions.
Do you think this divergence counts?
$RLUSD #Indicator
My take: treat it like the yellow light at a traffic signal—not stop, not go, but a cue to look up and check the road conditions.
Do you think this divergence counts?
$RLUSD #Indicator
25
·
--
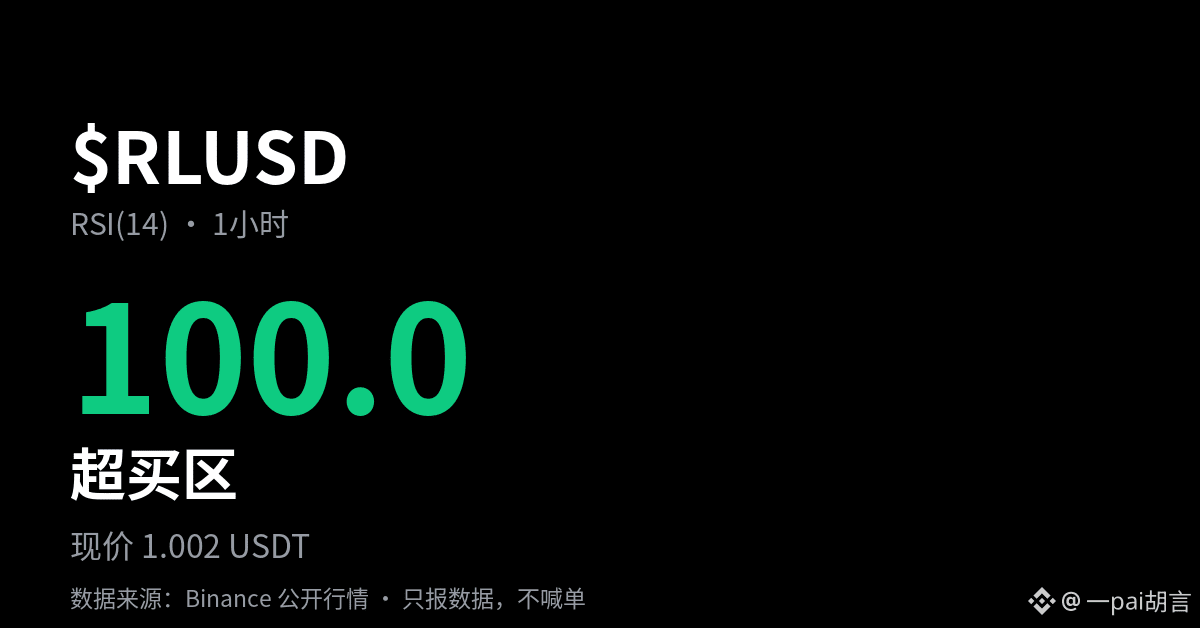
$RLUSD RSI is now at 100 (overbought), with the price at 1.002.
I use it like a yellow traffic light—not a signal to stop or go, but a reminder to look up and check the road conditions.
Do you think this divergence counts?
$RLUSD #indicator
$RLUSD RSI is now at 100 (overbought), with the price at 1.002.
I use it like a yellow traffic light—not a signal to stop or go, but a reminder to look up and check the road conditions.
Do you think this divergence counts?
$RLUSD #indicator
I use it like a yellow traffic light—not a signal to stop or go, but a reminder to look up and check the road conditions.
Do you think this divergence counts?
$RLUSD #indicator
59
·
--
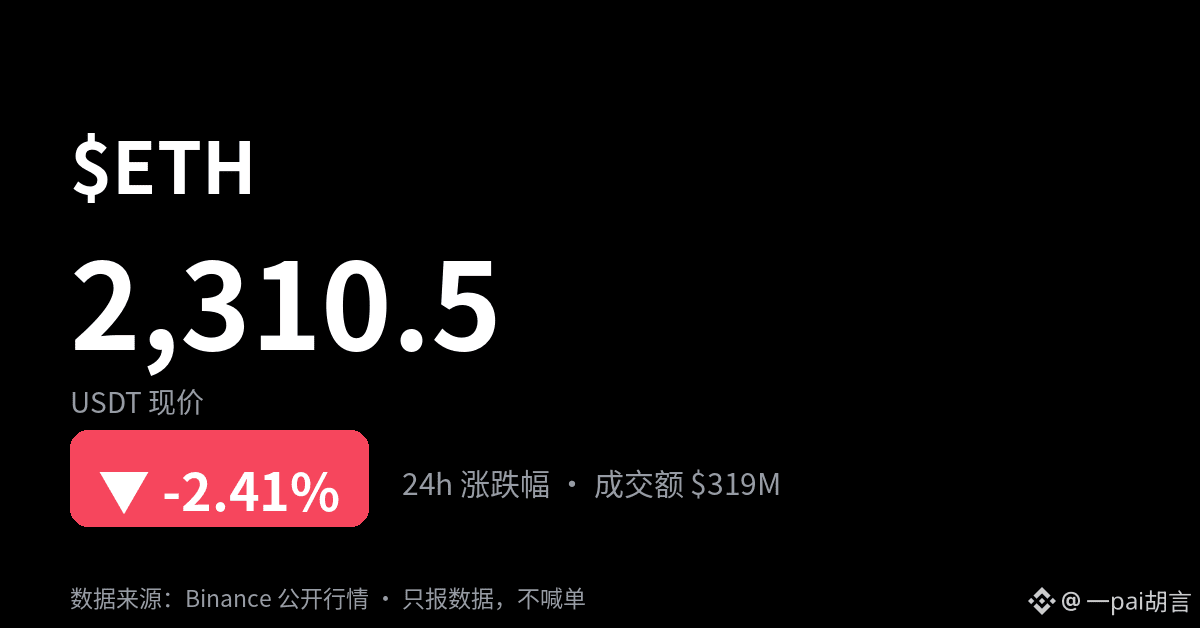
$ETH made the 24-hour movers list, down 2.41%, with the current price at 2,310.5.
The data only shows volatility, not direction. Before taking action, think about one thing: how much of a drop you can tolerate.
With this kind of volatility, would you look at volume first or price first?
$ETH #Data
$ETH made the 24-hour movers list, down 2.41%, with the current price at 2,310.5.
The data only shows volatility, not direction. Before taking action, think about one thing: how much of a drop you can tolerate.
With this kind of volatility, would you look at volume first or price first?
$ETH #Data
The data only shows volatility, not direction. Before taking action, think about one thing: how much of a drop you can tolerate.
With this kind of volatility, would you look at volume first or price first?
$ETH #Data
66
·
--
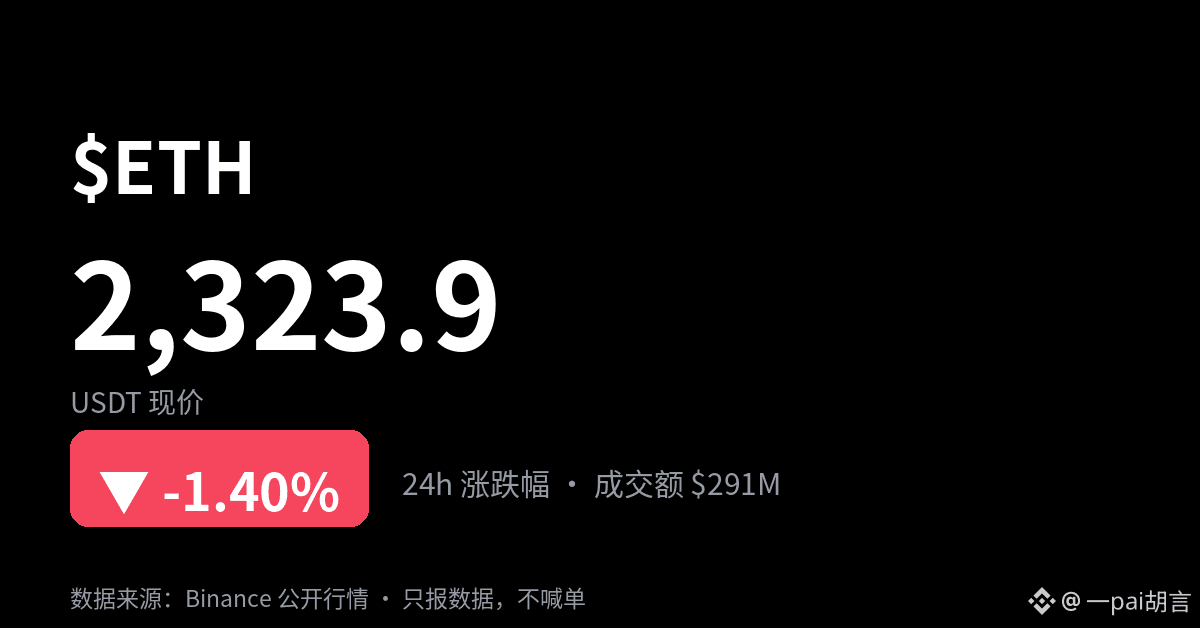
A coin just started moving: $ETH, current price 2,323.9, 24h -1.40%.
The market suddenly picked up, with short-term funds moving in. The reason is still being confirmed, so let's make a note and keep monitoring.
Does this figure match the trend you remember?
$ETH
A coin just started moving: $ETH , current price 2,323.9, 24h -1.40%.
The market suddenly picked up, with short-term funds moving in. The reason is still being confirmed, so let's make a note and keep monitoring.
Does this figure match the trend you remember?
$ETH
The market suddenly picked up, with short-term funds moving in. The reason is still being confirmed, so let's make a note and keep monitoring.
Does this figure match the trend you remember?
$ETH
143
·
--
Verified
A quick note about something that just happened: AI agents help rescue ETH’s Glamsterdam fork, ‘Steal My Bitcoin’ site: Hodler’s Digest
Source: Cointelegraph. I recommend reading the original yourself, since Chinese retellings often lose details. Related to these coins: $BTC $ETH
Will you keep following this story?
#QuickNote
Source: Cointelegraph. I recommend reading the original yourself, since Chinese retellings often lose details. Related to these coins: $BTC $ETH
Will you keep following this story?
#QuickNote

697
·
--
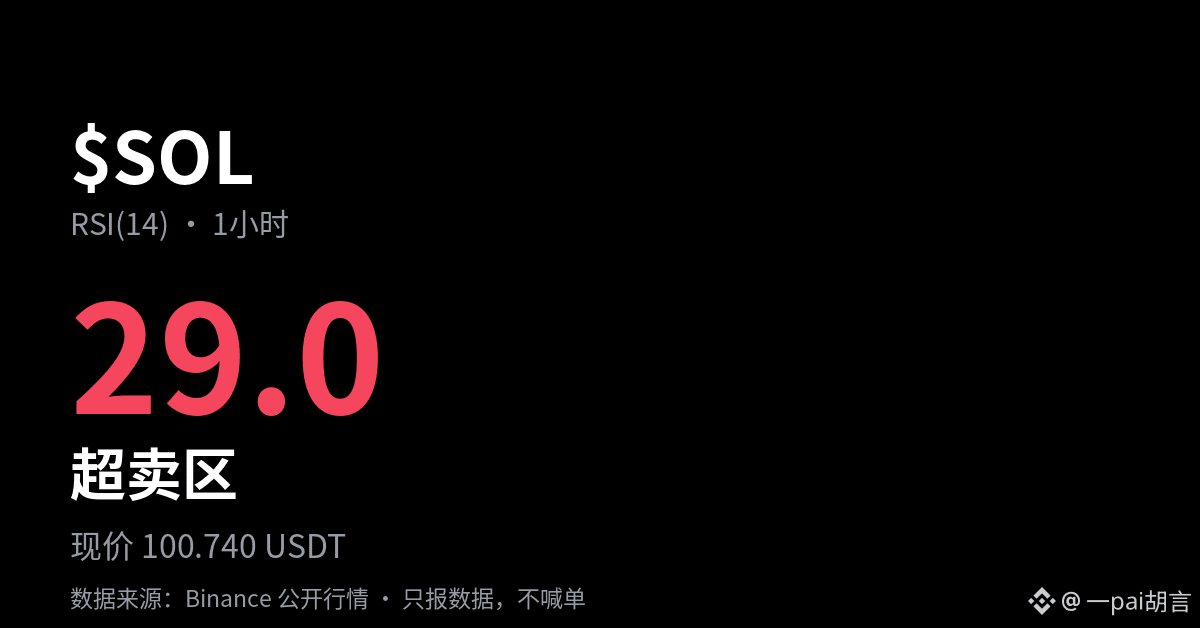
I took the temperature of $SOL : the 1-hour RSI(14) is 29, in oversold territory.
A thermometer can only tell you whether it's hot right now, not where it's headed. Overbought can get even more overbought, and oversold can keep drifting down. Look at price and volume together.
When indicators and price are at odds, which do you trust?
$SOL #Indicators
A thermometer can only tell you whether it's hot right now, not where it's headed. Overbought can get even more overbought, and oversold can keep drifting down. Look at price and volume together.
When indicators and price are at odds, which do you trust?
$SOL #Indicators
133
·
--
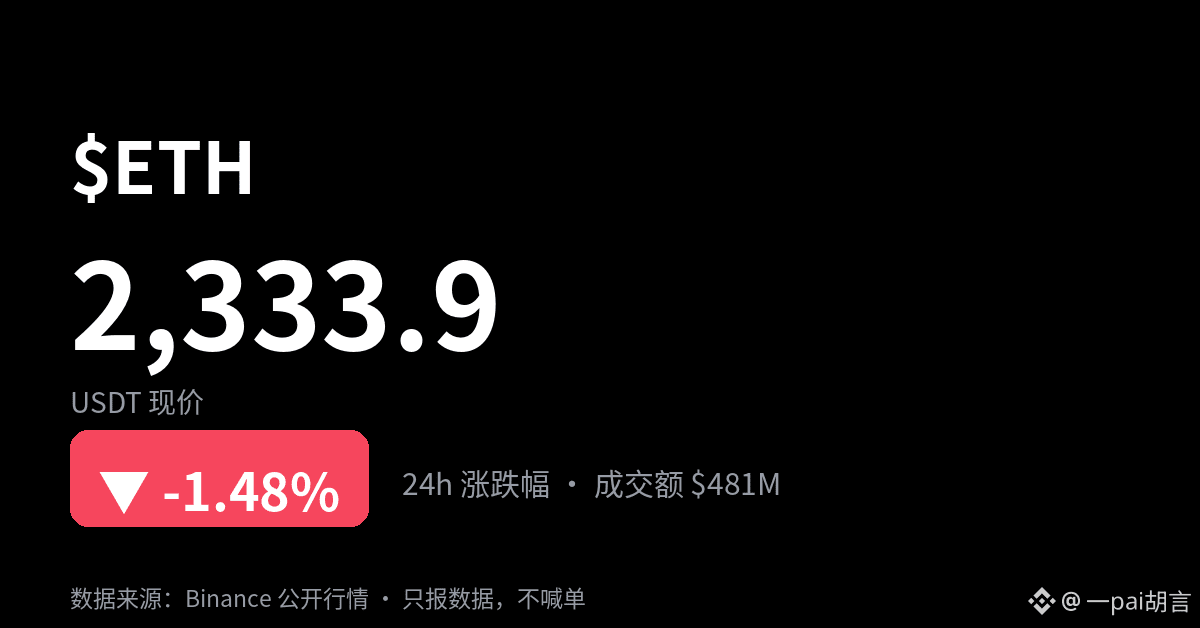
In plain English: $ETH is down 1.48% over the past 24 hours, now at 2,333.9.
Ups and downs are normal; the danger is getting carried away. If you really want to make a move, first decide how much of a drop you can tolerate, then decide how much to buy.
Does this price match the trend you had in mind?
$ETH
Ups and downs are normal; the danger is getting carried away. If you really want to make a move, first decide how much of a drop you can tolerate, then decide how much to buy.
Does this price match the trend you had in mind?
$ETH
164
·
--
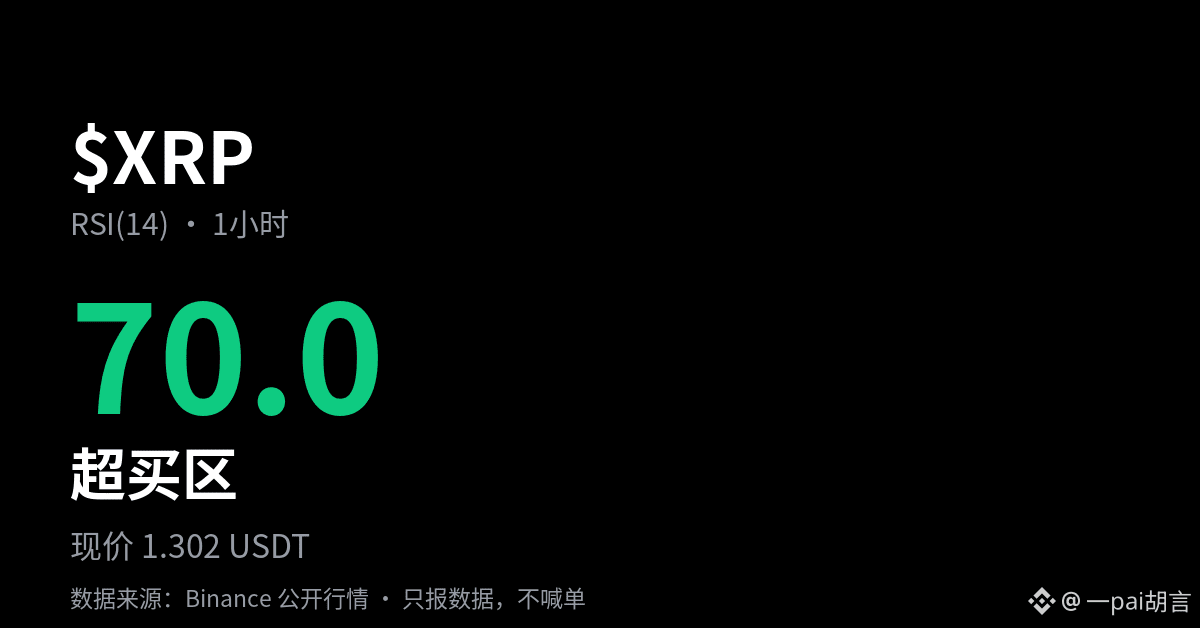
Reading the chart through numbers: $XRP RSI 70 (overbought), current price 1.302.
Numbers first, conclusions later.
Does this number match the trend you remember?
$XRP
Reading the chart through numbers: $XRP RSI 70 (overbought), current price 1.302.
Numbers first, conclusions later.
Does this number match the trend you remember?
$XRP
Numbers first, conclusions later.
Does this number match the trend you remember?
$XRP
87
·
--
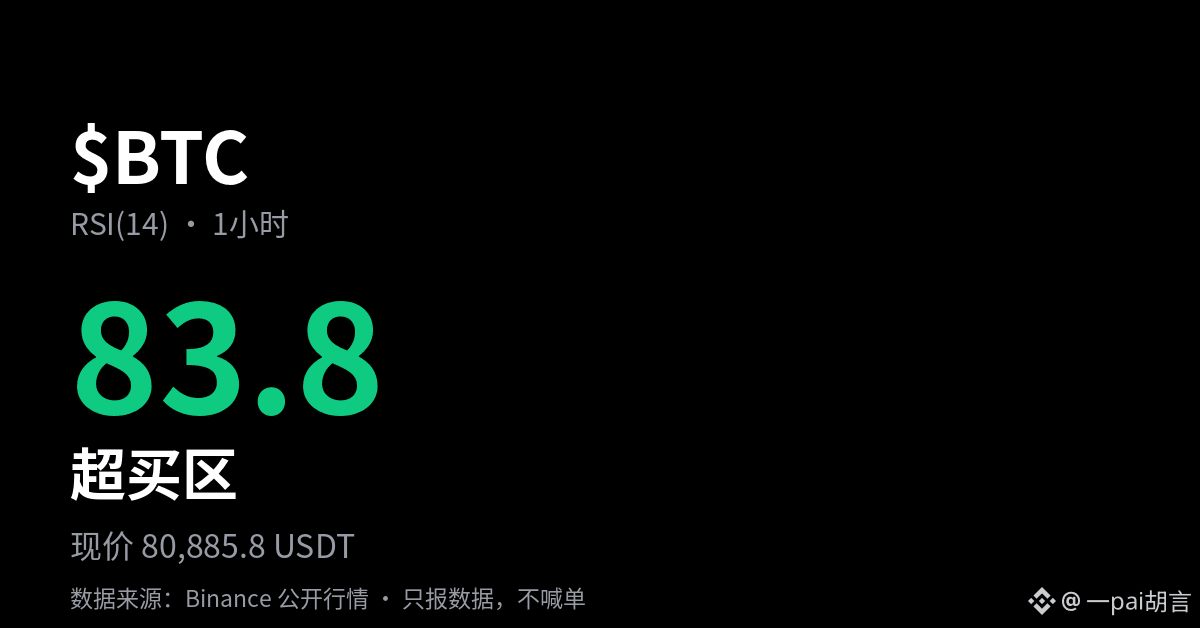
Checked the “temperature” of $BTC : RSI 84, which is overbought.
A high temperature doesn’t mean it’ll cool down right away, and a low temperature doesn’t mean it’ll spring back to life immediately. Its biggest use is to remind you: don’t act impulsively at this level.
When the indicator and price are at odds, which one do you trust?
$BTC
A high temperature doesn’t mean it’ll cool down right away, and a low temperature doesn’t mean it’ll spring back to life immediately. Its biggest use is to remind you: don’t act impulsively at this level.
When the indicator and price are at odds, which one do you trust?
$BTC
85
·
--
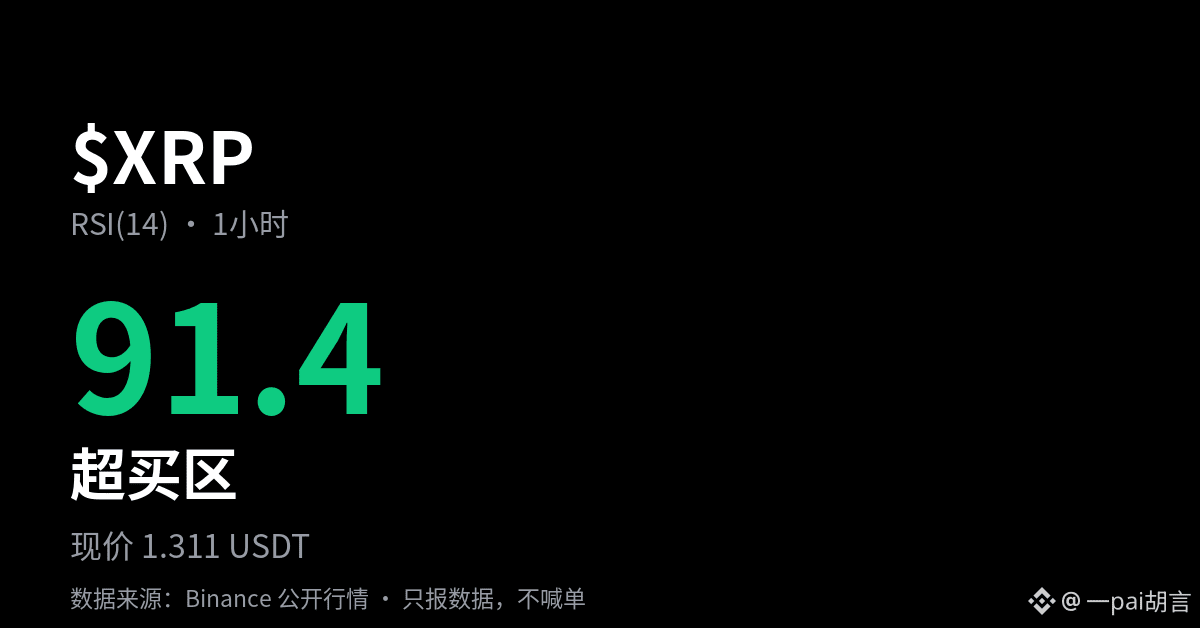
Saw the RSI for $XRP hit 91, so I thought I’d make a note of it.
Indicators can seem prophetic when they’re right and laughable when they’re wrong. Position sizing is more reliable than any indicator.
What’s your usual take on the relationship between price and volume?
$XRP
Saw the RSI for $XRP hit 91, so I thought I’d make a note of it.
Indicators can seem prophetic when they’re right and laughable when they’re wrong. Position sizing is more reliable than any indicator.
What’s your usual take on the relationship between price and volume?
$XRP
Indicators can seem prophetic when they’re right and laughable when they’re wrong. Position sizing is more reliable than any indicator.
What’s your usual take on the relationship between price and volume?
$XRP
132
·
--
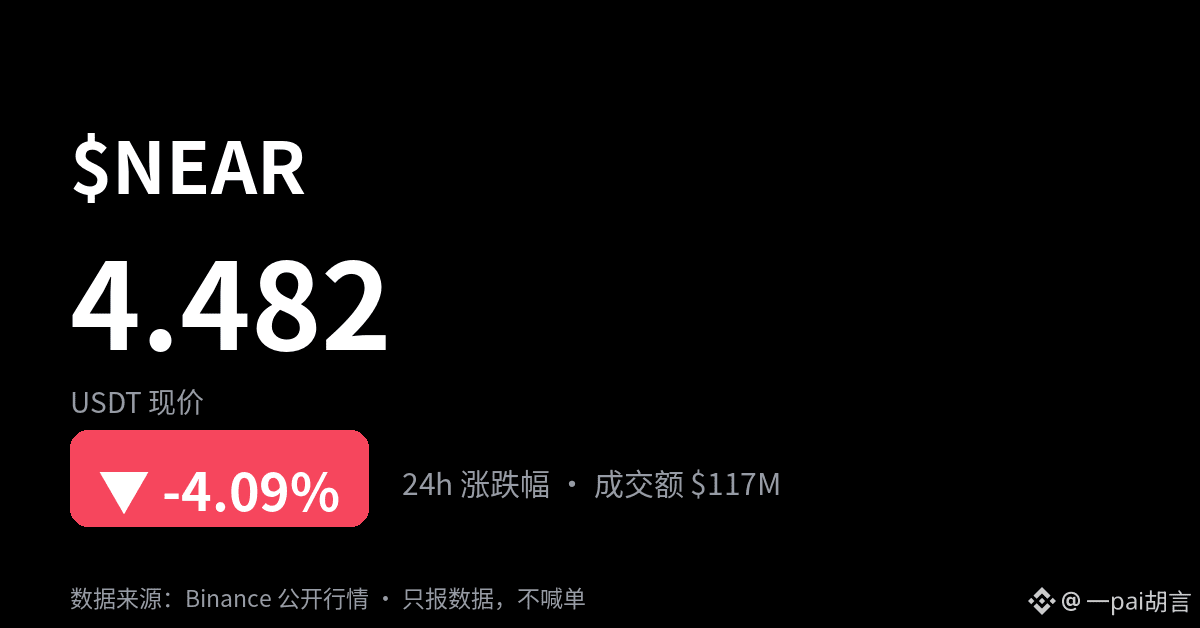
Here's a set of numbers to start with: $NEAR 24h -4.09%, latest price 4.482, trading volume $116.75M.
Coins near the top of the unusual-movements leaderboard usually take one of two paths over the next hour: a continuation on rising volume, or a quick pullback. Keep an eye on volume.
The data is right here—what's your take?
$NEAR
Coins near the top of the unusual-movements leaderboard usually take one of two paths over the next hour: a continuation on rising volume, or a quick pullback. Keep an eye on volume.
The data is right here—what's your take?
$NEAR
386
·
--
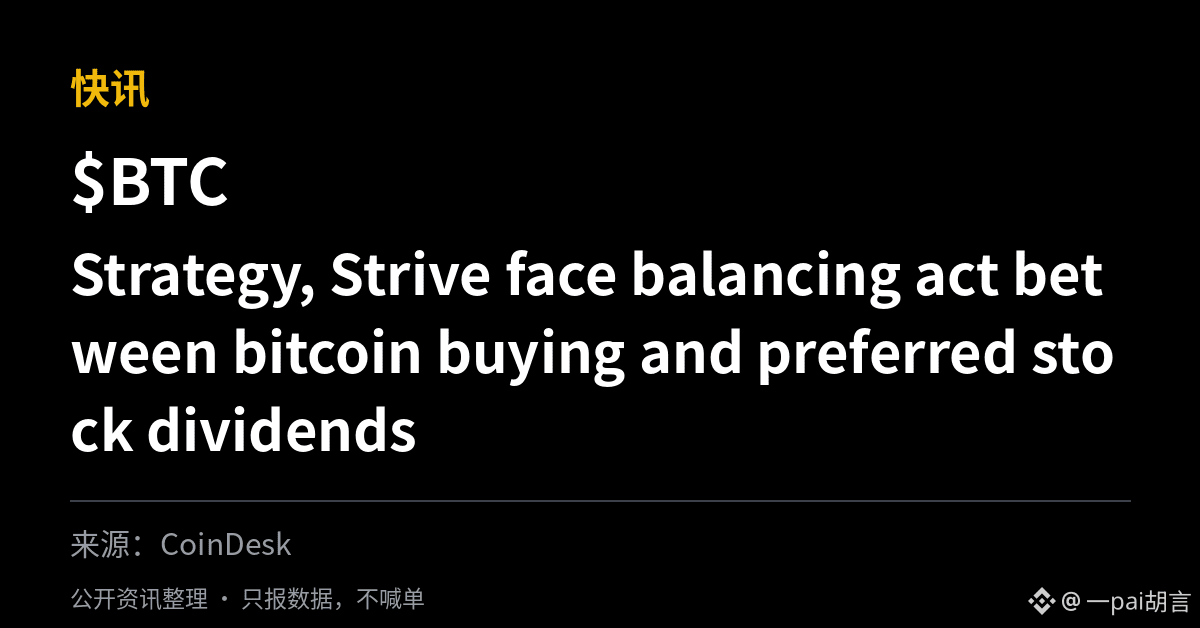
A quick news item, no embellishment:
Strategy, Strive face balancing act between bitcoin buying and preferred stock dividends
— CoinDesk
No predictions. The real impact will show up in the price and trading volume.
With news like this, do you usually verify it first or save it first?
$BTC
A quick news item, no embellishment:
Strategy, Strive face balancing act between bitcoin buying and preferred stock dividends
— CoinDesk
No predictions. The real impact will show up in the price and trading volume.
With news like this, do you usually verify it first or save it first?
$BTC
Strategy, Strive face balancing act between bitcoin buying and preferred stock dividends
— CoinDesk
No predictions. The real impact will show up in the price and trading volume.
With news like this, do you usually verify it first or save it first?
$BTC
65
·
--
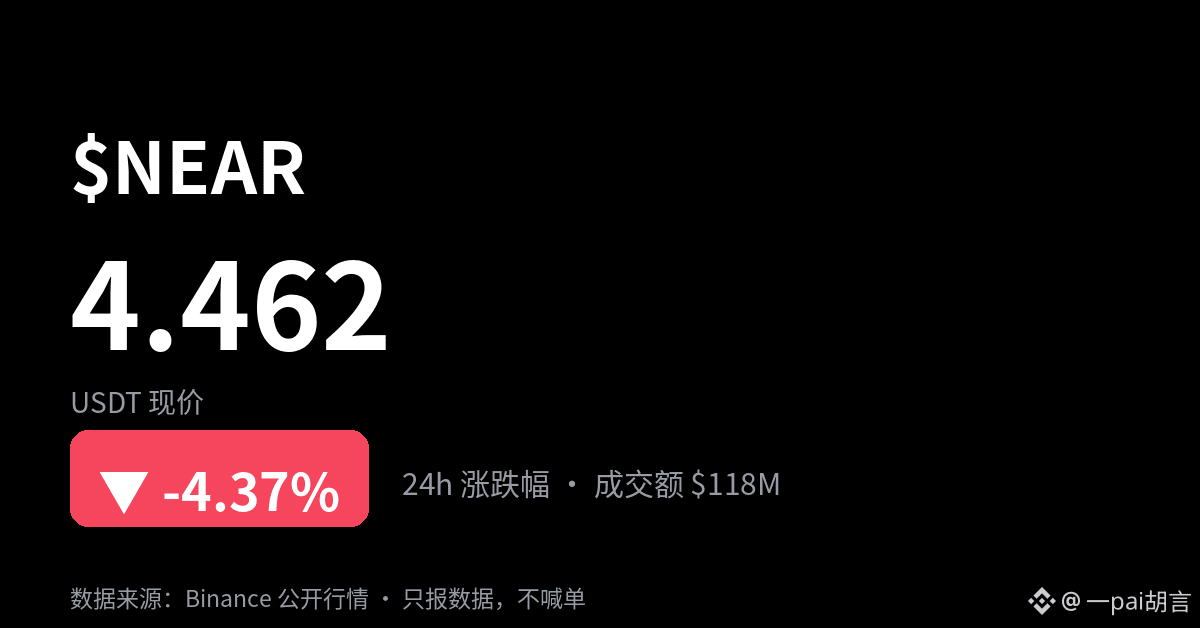
$NEAR is seeing some action today, down 4.37% over 24h.
My take is simple: things may be lively, but trading volume of $117.54M means real money is changing hands. It's fine to watch, but don't treat your entertainment money as investment money.
The data is right here—what's your take?
$NEAR
$NEAR is seeing some action today, down 4.37% over 24h.
My take is simple: things may be lively, but trading volume of $117.54M means real money is changing hands. It's fine to watch, but don't treat your entertainment money as investment money.
The data is right here—what's your take?
$NEAR
My take is simple: things may be lively, but trading volume of $117.54M means real money is changing hands. It's fine to watch, but don't treat your entertainment money as investment money.
The data is right here—what's your take?
$NEAR
·
--
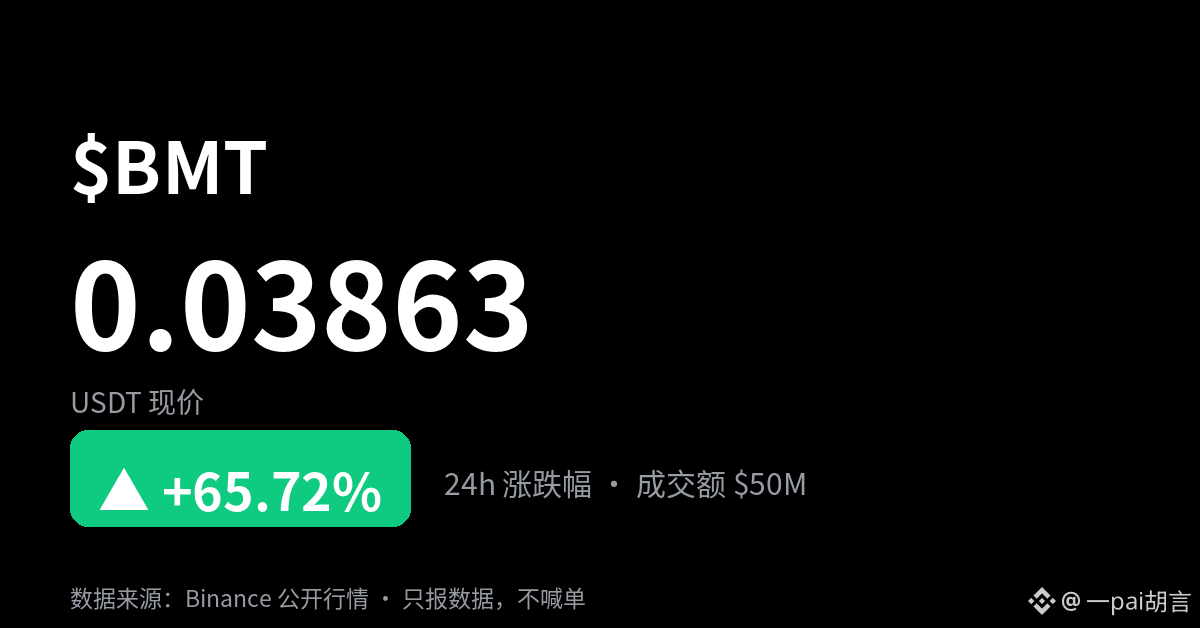
$BMT is showing some movement: up 65.72% in 24h, priced at 0.03863, with a trading volume of $50.41M.
At this level, don't rush in. It's better to wait for a candlestick to close before making a call.
What’s your usual take on how price and volume work together?
$BMT #BreakingNews
$BMT is showing some movement: up 65.72% in 24h, priced at 0.03863, with a trading volume of $50.41M.
At this level, don't rush in. It's better to wait for a candlestick to close before making a call.
What’s your usual take on how price and volume work together?
$BMT #BreakingNews
At this level, don't rush in. It's better to wait for a candlestick to close before making a call.
What’s your usual take on how price and volume work together?
$BMT #BreakingNews
116
·
--
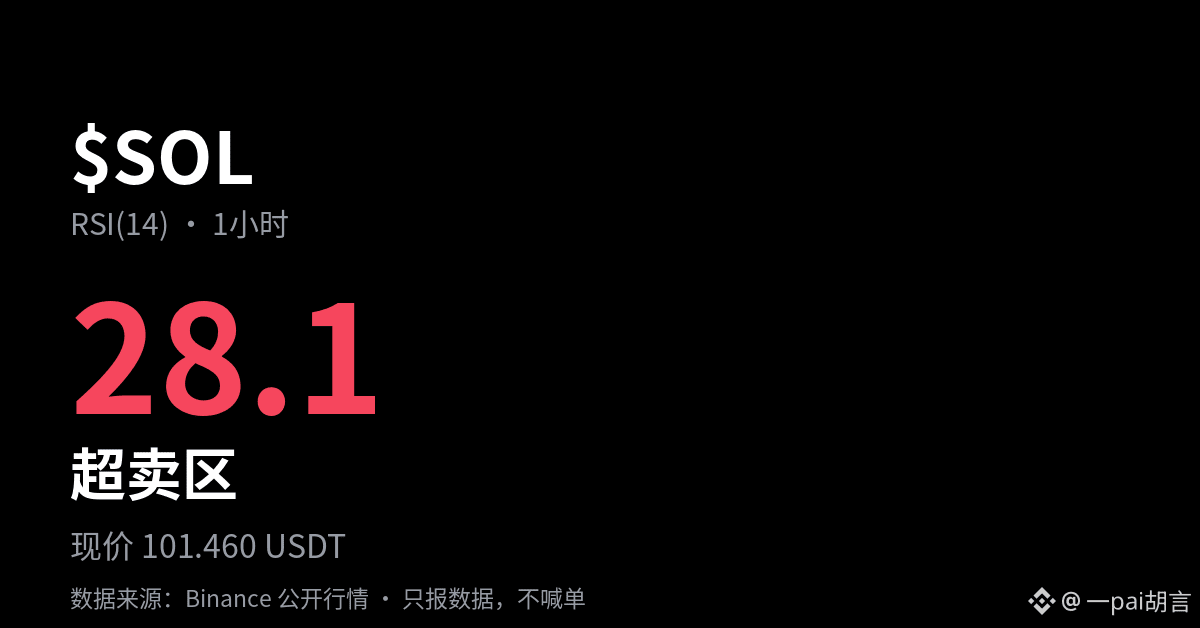
Saw that the RSI for $SOL has reached 28, so I’m making a note of it.
Indicators are like prophets when they’re right, and punchlines when they’re wrong. Position management is more reliable than any indicator.
What’s your take on the relationship between price and volume?
$SOL
Saw that the RSI for $SOL has reached 28, so I’m making a note of it.
Indicators are like prophets when they’re right, and punchlines when they’re wrong. Position management is more reliable than any indicator.
What’s your take on the relationship between price and volume?
$SOL
Indicators are like prophets when they’re right, and punchlines when they’re wrong. Position management is more reliable than any indicator.
What’s your take on the relationship between price and volume?
$SOL
62
·
--
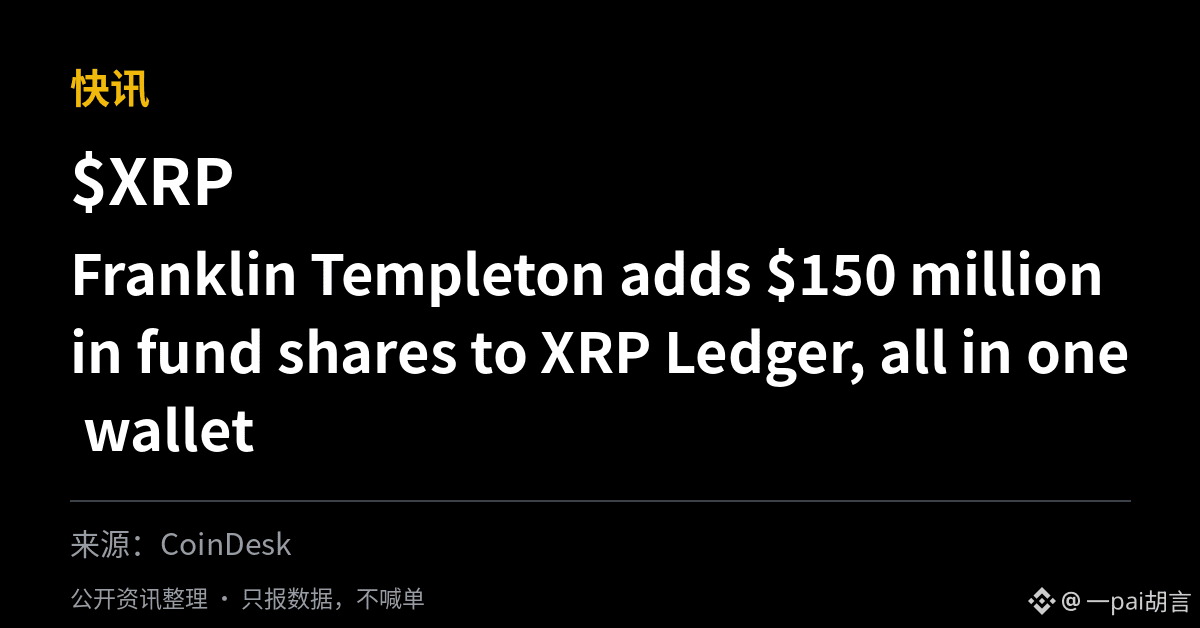
Franklin Templeton adds $150 million in fund shares to XRP Ledger, all in one wallet
— CoinDesk
A single report offers limited information. The key is whether a second or third source follows up. Save it for now; don't jump the gun.
Which do you trust more: the news or the market action?
$XRP
Franklin Templeton adds $150 million in fund shares to XRP Ledger, all in one wallet
— CoinDesk
A single report offers limited information. The key is whether a second or third source follows up. Save it for now; don't jump the gun.
Which do you trust more: the news or the market action?
$XRP
— CoinDesk
A single report offers limited information. The key is whether a second or third source follows up. Save it for now; don't jump the gun.
Which do you trust more: the news or the market action?
$XRP
30
·
--
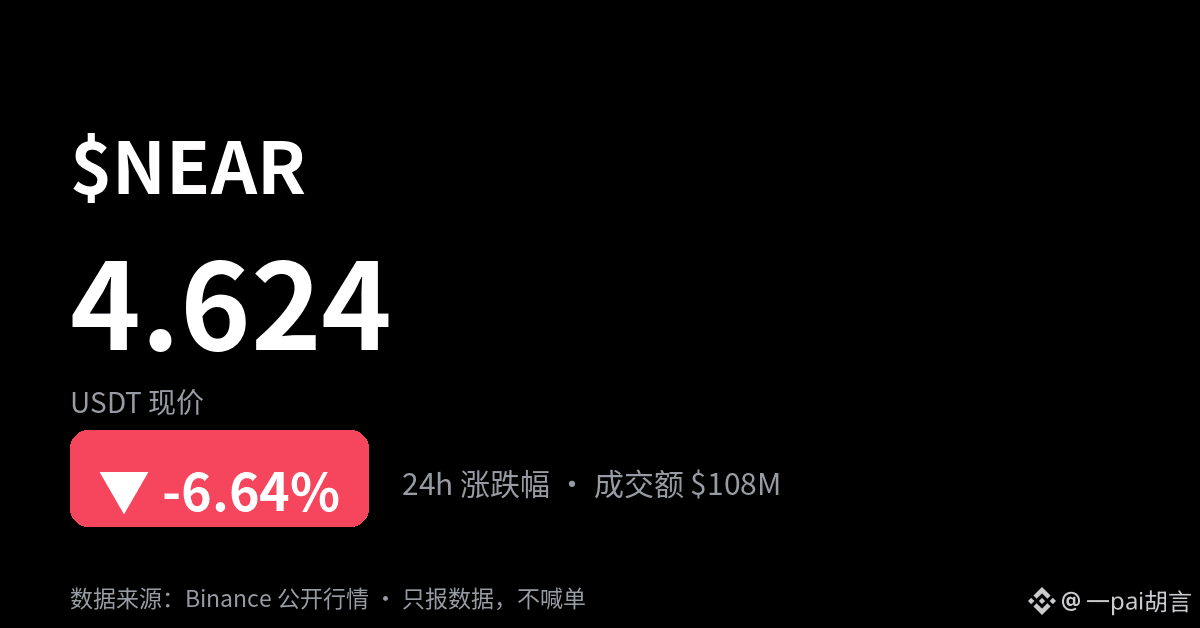
$NEAR is seeing a bit of action today, down 6.64% over 24h.
My take is simple: despite all the buzz, the $107.78M in trading volume means people are actually exchanging hands with real money. It's fine to watch, but don't treat your entertainment budget like investment money.
The data is right here—what's your take?
$NEAR
My take is simple: despite all the buzz, the $107.78M in trading volume means people are actually exchanging hands with real money. It's fine to watch, but don't treat your entertainment budget like investment money.
The data is right here—what's your take?
$NEAR
499
·
--
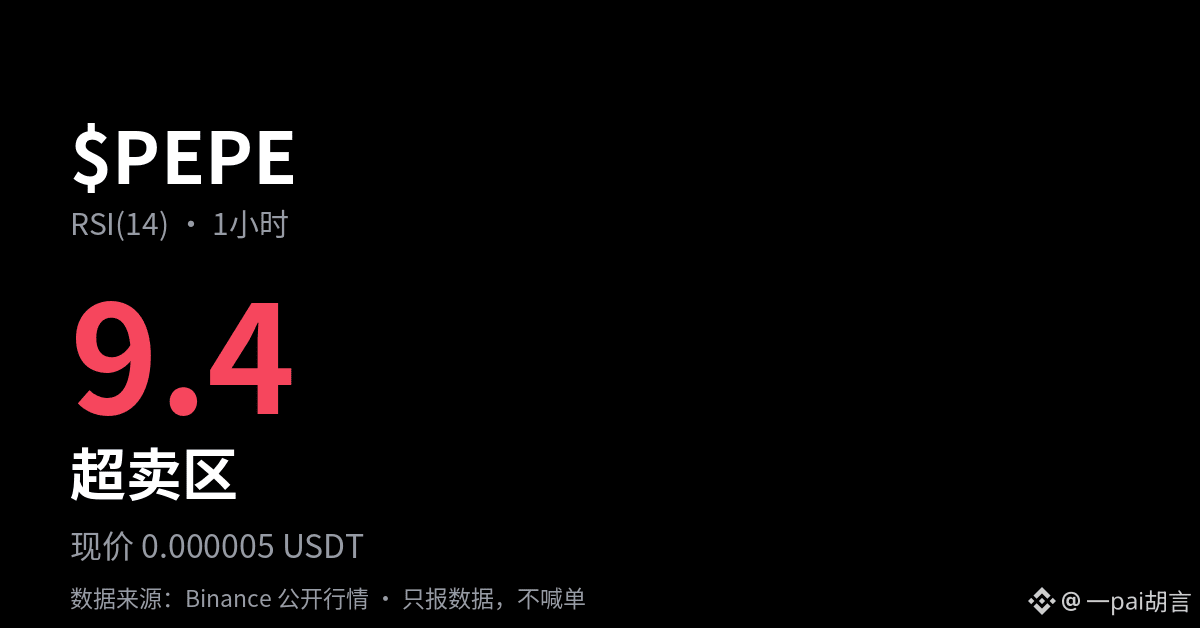
These three numbers are more interesting together: $PEPE is currently at 0.000005, 1h RSI is 9 (oversold), and 24h is +3.40%, with $112.38M in trading volume.
Price is moving, momentum is weak—looking at any one of them alone can be misleading.
Do you think this divergence matters?
$PEPE
These three numbers are more interesting together: $PEPE is currently at 0.000005, 1h RSI is 9 (oversold), and 24h is +3.40%, with $112.38M in trading volume.
Price is moving, momentum is weak—looking at any one of them alone can be misleading.
Do you think this divergence matters?
$PEPE
Price is moving, momentum is weak—looking at any one of them alone can be misleading.
Do you think this divergence matters?
$PEPE
177
Log in to explore more content
Join global crypto users on Binance Square
⚡️ Get latest and useful information about crypto.
💬 Trusted by the world’s largest crypto exchange.
👍 Discover real insights from verified creators.
Email / Phone number